1 Overview of Health Policies/strategies/acts in relation to Human Rights Dr. T.Gakuruh SPMD/MoH...
36
1 Overview of Health Policies/strategies/ac ts in relation to Human Rights Dr. T.Gakuruh SPMD/MoH HENNET: HEALTH AND HUMAN RIGHTS WORKSHOP KSMS 31st March 2008
-
Upload
fay-maxwell -
Category
Documents
-
view
214 -
download
0
Transcript of 1 Overview of Health Policies/strategies/acts in relation to Human Rights Dr. T.Gakuruh SPMD/MoH...

1
Overview of Health Policies/strategies/acts in relation to Human Rights
Dr. T.GakuruhSPMD/MoHHENNET: HEALTH AND HUMAN RIGHTS WORKSHOP
KSMS
31st March 2008

2
Kenya’s Health Policy Framework (1994)
Kenya’s Health Policy Framework goal to 2010- “ to promote and improve the health of all Kenyans through the deliberate restructuring of the health sector to make all health services more effective, accessible and affordable”.
3
0
20
40
60
80
100
120
140
'90 '95 '00 '02 '05 '10 '15
U<5MR
IMR
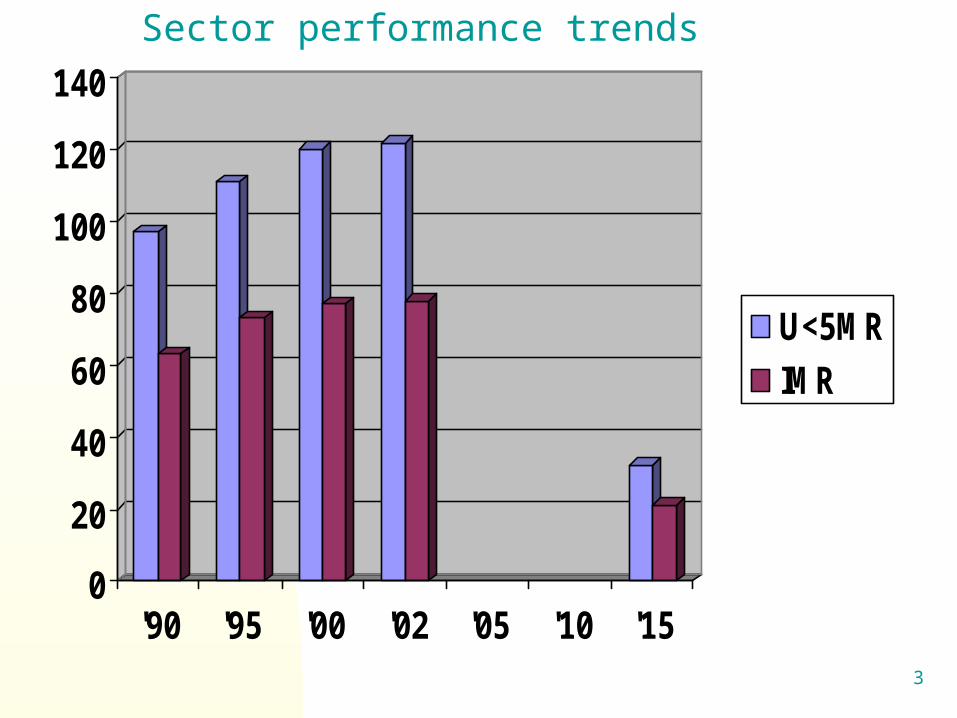
Sector performance trends

4
Health Related MDGs4. Reduce Child Mortality i.e. Reduce 2/3
(67%) between 1990 and 2015, the under five mortality rate.
5. Improve Maternal Health i.e reduce by ¾ (75%) between 1990 and 2015, the maternal ratio.
6. Have halted by 2015 and began to reverse the spread Of HIV/AIDS. Combat HIV/AIDS, Malaria, TB and other diseases.

5
The Goal of NHSSPII is to reduce health inequalities and to reverse the downward trend in health-related
outcome and impact indicators.
NHSSPII development Policy objectives
Programme areas of JPWF and AOPS
Overall development Goal (ERS): Expand economic growth, enhance social development and reduce poverty
Programme areas of AOPS

6
NHSSPII Objectives1. Increase equitable access to health
services:
2. Improve quality and responsiveness of services in the sector:
3. Improve the efficiency and effectiveness of service delivery;
4. Foster partnerships in improving health and delivering services; and
5. Improve financing of the health sector.

7
LEVELS OF CARE IN KEPH
Level 6
Tertiary Hospital
Level 5 Secondary Hospital
Level 4 Primary Hospital
Level 3 health Centre, Maternity and Nursing Home
Level 2 Dispensary/Clinics
Level 1 Community: Village/Household/Family/Individuals
Interface

8
KEPH Principles – Human Capital Development
Dispensary/Dispensary/
clinic clinic
Health Health Centre/maternityCentre/maternity/Nursing home/Nursing home
Primary Primary HospitalHospital
Secondary HospitalSecondary Hospital Tertiary HospitalTertiary Hospital
Essential Essential PackagesPackages
CommunityCommunity
FamilyFamily
HouseholdHousehold

9
Fig xx.xx: Managing health sector performance *
Support systemsService Delivery
Health sector performance
Health outcomes
1. Interface between Services and Community …
2. District Health Planning…
3. Financial Management …
4. Monitoring and Evaluation…
5. Human Resources…
6. Standards and Quality Assurance …
7. Commodity supply (pharmaceuticals / equipment) …
8. Maintenance (infrastructure, equipment, transport) …
9. Communication systems / ICT…
* adapted from Chen and Evans (2004)
IMPROVED HEALTH of
the POPULATION
KEPH
Quality and responsiveness
to demand
Equitable access
Efficiency and effectiveness

10
Results Based Management elements
1. Performance planning
2. Performance target setting (organisation, group & individual)- Performance Contracts
3. Performance appraisal (organisation, group & individual)

11
Kenya’s Health PolicyFramework 1994
Annual O
perational P
lan 2006/07
National Health Strategic Plan2005/10
Per
form
ance
App
rais
al
Performance Contract
Health sector programming process

12
AOP TargetsCoast Central Eastern Nairobi North Eastern Nyanza Rift Valley Western National Indicators
Baseline Target Baseline Target Baseline Target Baseline Target Baseline Target Baseline Target Baseline Target Baseline Target Baseline Target % deliveries conducted by skilled health staff in facility 14% 25% 10% 27% 7% 32% 2% 4% 15% 19% 4% 26% 6% 14% 2% 8% 5% 19%
# LLITN distributed to pregnant women in health facility 14,880 18,840 7,140 24,000 56,483 24,688
3 1,532 3,519 1,179 4,071 47,124 78,127 59,084 118,805 75,435 112,855 203,773 488,295
% pregnant women sleeping under LLITNs 27% 36% 26% 36% 0% 14% 1% 2% 0% 38% 30% 43% 9% 26% 14% 32% 15% 28% % pregnant women attending four ANC visits 25% 31% 57% 62% 0% 17% 24% 31% 19% 24% 32% 36% 46% 53% 17% 33% 25% 36%
% Pregnant women receiving IPT 2x 26% 31% 24% 42% 0% 27% 0% 2% 17% 22% 32% 39% 35% 44% 16% 42% 16% 34% % deliveries by skilled health staff 21% 33% 50% 56% 0% 43% 11% 14% 5% 9% 21% 28% 28% 30% 21% 40% 23% 37% % WRA receiving FP commodities 44% 53% 54% 70% 0% 37% 19% 26% 1% 3% 19% 22% 24% 31% 8% 41% 21% 38% % newborns receiving BCG 48% 45% 68% 78% 0% 48% 69% 88% 20% 26% 47% 53% 65% 62% 32% 43% 39% 55% % HIV + pregnant women receiving nevirapine 4% 44% 0% 0% 0% 5% 0% 0% 0% 0% 38% 53% 24% 34% 6% 16% 9% 19%
# LLITNs distributed to children < 5 yrs in health facility 102,264 119,18
3 25,701 94,000 50,857 107,089 6,126 13,416 1,207 32,173 166,526 312,83
4 262,830 455,608 140,500 1,108,936 493,181 1,787,630
% children sleeping under LLITN 30% 39% 14% 46% 0% 7% 1% 2% 8% 16% 40% 50% 30% 23% 7% 79% 13% 46% % children at 6 months on exclusive breastfeeding 20% 60% 0% 0% 0% 13% 0% 0% 0% 0% 0% 18% 0% 3% 0% 8% 0% 14%
% children fully immunized at 1 year of age 74% 86% 83% 91% 0% 81% 53% 54% 41% 48% 59% 66% 56% 60% 26% 48% 42% 66% % children < 1yr vaccinated for measles 41% 47% 50% 69% 0% 62% 34% 38% 50% 57% 53% 58% 46% 53% 30% 50% 34% 54% % children receiving Vitamin A (1-2 doses) 30% 44% 69% 83% 0% 50% 28% 34% 53% 60% 35% 44% 46% 51% 6% 153% 22% 111% # of trained village health committees 13 92 17 54 6 151 3 4 303 57 14,536 18,130 169 771 286 42,184 15,164 60,672 # condoms distributed 8.53 3.00 0.40 3.60 0.31 0.88 8.59 1.30 0.51 0.63 0 30 0.77 1.20 9.90 11.5 28.25 31.8 # CORPs selected/trained 210 500 450 860 464 1210 70 100 32 376 0 0 5476544 11321000 3,692 45,957 4,918 49,003 New outpatient visits 774,600 400,00
0 403,779 251,206 547,030 400,00
0 314,640 319,80 230,400 140,000 0 0 4,318,333 3,978,370 837,566 72,057 3,108,015 1,582,743
# VCT clients 7672 47129 14790 15816 19233 23100 49955 60043 120 340 0 0 50832 76710 45654 87062 137424 233490 # HIV+ patients starting ART 525 1250 2334784 1757 340 500 2150 3450 12 31 0 0 9108 12600 12578 56557 2350389 63545
** Note: Seven districts ( Baringo, Garisa, Mwingi, Mbeere,Tana River, Mombassa, Kakamega) have not submitted their plans at all and two districts plans (Tharaka, and Kisimu municipality) did not have service delivery baselines and targets. The above consolidated sheet therefore does not include these omissions.

13
2006 2007 2008 2009
Total GOK Expenditure 457.0 526.7 581.1 650.3
Total MOH Expenditure (excl. aid) 35.0 38.9 43.1 53.0
% of total GOK 7.7 7.4 7.4 8.2
Total MOH Expenditure (incl. aid) 53.7 61.4 48.6 58.3
% of total GOK 11.8 11.7 8.4 9.0
Total MOH as share of Total Revenue 14.9% 18.5% 12.0% 14.6%
Source: BSP 2007
Allocations Projections

14
Trend in recurrent (gross) expenditure by economic categories (% share of total MOH recurrent expenditures)
2002/03
2003/04
2004/05
2005/06
2006/07
Salaries and Other Personnel costs
54.1 52.5 51.9 52.7 52.7
Transfers, Subsidies & Grants 8.0 9.4 9.0 8.3 7.7
Drugs and Medical Consumables
9.4 11.1 10.6 10.5 11.1
Operating & Maintenance 8.7 8.3 10.1 7.5 8.2
Purchase of Plant & Equipment 0.7 0.1 0.5 2.9 2.4
Kenyatta National Hospital 16.2 15.6 15.3 14.5 14.4
Moi Referral & Teaching Hospital
2.9 3.0 2.6 3.6 3.5
Total % 100.0 100.0 100.0 100.0 100.0

15
Country Public expenditureon health (% of GDP)2003–04
GDP perCapita (US$)
Kenya 1.7 481
Tanzania 2.4 288
Uganda 2.2 245
Zambia 2.8 471
Malawi 3.3 149
Zimbabwe 2.8 363
Rwanda 1.6 208
Burundi 0.7 90
Ethiopia 3.4 114
Source: UNDP: Human Development Report 2006
Total Public Spending on Health - Selected East and Central African Countries.

16
District resource allocation criteria
Population 30%Women in reproductive age
25%
Under-five children 20%HIV prevalence rate 5%Government facilities 15%Area (sq km) 5%

17Kenya – Health Sector JPWF
Page 1
SECTOR COORDINATION STRUCTURE
DISTRICT HEALTH STAKEHOLDERS FORUM
VILLAGE HEALTH COMMITTEE
HEALTH FACILITY COMMITTEES
4. Implementation management
HEALTH FACILITY -CHARGE
Implementing Partners
Development Partners
Roles
Stewardship
MINISTER’S OFFICE JOINT INTERAGENCY COORDINATING COMMITTEE (JICC)
HEALTH SECTOR COORDINATING COMMITTEE (HSCC)
PROVINCIAL STAKEHOLDERS FORUM
TECHNICAL STAKEHOLDERS COMMITTEE (TSC)
Secretariat
GIC & other sub committees
PS
2. Technical strategic direction
1. Policy Level
3. Support System PMO
DMOH
DMS

18
Responsiveness to client needs Service Charter developed rolled out to
hospitals 2007/8, lower levels 2008/10 inclusive of fee schedules in health facilities, suggestion boxes & quality indicators commitments
Complaint procedures are being installed in public sector through corruption prevention mechanisms
Community intervention by Community Health Committees and Workers to enhance their participation in health care and facilitate accountability of health facilities

19
CITIZENS’ SERVICE DELIVERY CHARTER FOR A HEALTH FACILITYPreamble
This health facility and its staff is committed to provide high quality health care services to all our clients with dignity, professionalism and within the shortest time possible.

20
Services rendered User charges (Kshs) Waiting time
1.Attendance and customer care desk/enquiries Free 5 minutes
1.Payment for hospital charges Free 30 minutes
1.Registration cardProvincial/District hospitals/sub districtHealth centerDispensaries
502010
30 minutes
1.ConsultationAdults & children above 5 yrs (Hospitals)Children below 5 yrs
30Free
20 minutes20 minutes
1.Dispensing medicineProvincial/District HospitalsHealth centers & dispensaries
30 – 400Free
20 minutes20 minutes
1.Vaccinations Free 20 minutes
1.Laboratory Services 50 – 400 30 minutes
1.X-Ray services 300 – 500 20 minutes
1.Emergency – admission Payable after treatment 10 minutes
1.Non emergency admission Payable after treatment 5 minutes
1.Emergency operation services 3,000 (payable after treatment) 30 minutes
1.Non emergency operation 3,000 24 hrs
13. Collecting body from mortuaryMortuary chargesTransfer from ward to mortuaryEmbalming
Free 200 per dayFree 500
1 hr1 hr1 day
Medical superintendents to ensure full accountability for all medicines, equipment and commodities
TREATMENT FRO MALARIA, TB, HIV/AIDS AND EPIDEMICS IS FREE
Any service that does not conform to the above standards or an officer who does not live up to the commitment to courtesy and excellence in service delivery should be reported to the Outpatient Matron/Nursing OfficerHUDUMA BORA NI HAKI YAKO
21
Key challengesThe pace and ability to jointly:
Develop a district-wide plan Hold regular performance reviews
The pace and resources to empower the communities
Pace, resources and commitment of civil societies to engage
Innovative, realistic and acceptable strategies for vulnerable groups in the society.
Ability to respond concerns on attainment of the MDGs
22
Health system and agency bottlenecks and constraints Increase equitable access to health services:
Absence of appropriate and comprehensive implementation guides and frameworks to implement some of the priority services especially for cohort 1.
Lack of a comprehensive view of implementation of services for cohort 3 and 6.
Uncoordinated investment in service delivery inputs. Dissemination of comprehensive community approach
not comprehensively done. Delay in initiating the referral strategy resulting into lack
of implementation of a comprehensive approach to referral.
Inadequate dissemination of the essential package

23
Health system and agency bottlenecks and constraints (cont) Improve the quality and responsiveness of services in the sector
The challenge of the RBM is to relate the results specified to resources, which will involve the development of programme budgeting.
The role of supportive supervision is being hampered in many districts due to lack of transport, and other facilitating inputs.
There is lack of a tracking system for commodities and supplies to confirm how much of the procured items reach the intended beneficiaries.
Delays in elaboration of service charters at the different levels of the health system resulting in limited implementation and follow up of the service charter

24
Health system and agency bottlenecks and constraints (cont) Improve the efficiency and effectiveness of service delivery
Inadequate information on investment from off budget partners The resource allocation criteria are still not appropriately poverty focused Health Sector Services Fund (HSSF):
modality for inclusion of f non-state service providers not clear. Inadequate financial resources.
Weak linkage between planning and budgeting processes Inadequate capacities for planning and monitoring at the implementation
levels DP’s Finally, willingness and commitment to abide by the planning
calendar and ensure that their resources are reflected at the appropriate levels of implementation.
The extent to which outputs from operations research are implemented and the policy findings assist in decision making is not verifiable.
There are still significant risks in procurement and financial management Lack of strategic approach to management of infrastructure,
communication and ICT in the sector that appropriately supporting service delivery

25
Health system and agency bottlenecks and constraints (cont)Foster partnerships in improving health and delivering
services Implementation follow up is still disjointed. Capacity for the implementing partners to engage in the sector is
still weak. The mechanisms for ensuring adherence to COC implementation
are yet to be spelt out. MOH structure and functions are still largely based on the vertical
program approach, with poor linkages between technical and administrative functions.
Accountability to the sector by different constituent actors is still weak.
Ensuring that the quality of plans at all levels (by facilities, districts, provinces, divisions, implementing agencies and development partners) have improved and interlinked to support each other.
There is still weak predictability of resources from all sources and linking them to the strategic objectives and priorities of the sector.

26
Health system and agency bottlenecks and constraints (cont)Improve financing of the health sector The weak ability to mobilise, and coordinate off budget
resources available for health limits the level of financing for the sector.
In addition, contributions from some of the key funding partners are not adequately captured in the budget and expenditure estimates for the sector. Accuracy of cost sharing contributions is also not verified.
In general, it appears that decisions regarding expenditure allocations to health are influenced largely by decisions and factors outside the sector.
There is need to ensure that, while focus is made on financing interventions at the lower levels of the system, the higher levels are not financially deprived to a level where they are not able to carry out their supporting functions for the rest of the health system.

27
What is the purpose of the legal framework?To provide an enabling
environment for implementation
Enhance partner participationProvide appropriate sector
structure for coordination

28
Current Legal Framework The legislative framework comprises: The Public Health Act,CAP 242 (the principal
Act for Health) established 1921!Public health orientation:
Disease preventionInternational health regulationsLimited role in regulation of health
personnel,drugs and medical supplies and services
Established the offices of the DMS and the Medical Officer of Health in law

29
Current Legal Framework (2)Old Act that set up a small
government department of healthNot suitable for current complex health sector
Only minor amendments have been made to date
Structure not inclusiveLimited stakeholder participation (SWAp)
30
Current Legal Framework (3) 24 different Acts relating to health service
provision, e.g.: Medical & Dental Practitioners Act (CAP 253), the Pharmacy and Poisons Act (CAP 244) the Nurses Act (CAP 257)
DMS office is the only link with Public Health Act, CAP 242
There are many cadres which are yet to be covered by specific regulatory legislation
MoH initiatives to review and harmonize health related Acts – not complete

31
Challenges with Current Legal Framework Administration of the many Acts The mixed nature of the Acts
(personnel/service regulation) Problems with coordination and
implementation Dormant Central Board Health Serious limitations i.e. updating, clear
enforcement framework, and conflicts Duplication and confusion (Acts vs policy
guidelines)

32
Challenges with Current Legal Framework (contd.) The DMS office is linked to all health
acts making effective implementation difficult
DMS is the chair, registrar,secretary or member of numerous boards/regulatory bodies!!
Lack of separation between regulatory and service delivery functions

33
Where do we want to go? A clear legal framework which:
Is harmonized and coordinated for smooth service provision e.g. Council of regulatory bodies
De-links service regulation from human resource regulation and provide autonomy to regulatory authorities
outlines the roles, responsibilities of and linkages with stakeholders (GoK, Mission,Private and NGO sectors)

34
Where do we want to go?(2)Underpins the implementation of the
NHSSP II through SWAp especially in the following areas:Coordination of the sectorProcurementBudgetting,financing and financial management
Human resource managementGovernance and regulation

35
Where do we want to go?(contd.) Give direction on decentralization of
service delivery to the districts Will give clear framework for review
of the existing acts Factors the focus of the country in
matters of health as outlined the proposed constitution (health sector) – Bill of Rights, devolution, Health Services Commission etc.

36
END