1 Oil and the Economy Christopher J. Neely Assistant Vice-President, FRB Saint Louis Presentation to...
26
1 Oil and the Economy Oil and the Economy Christopher J. Neely Christopher J. Neely Assistant Vice-President, FRB Assistant Vice-President, FRB Saint Louis Saint Louis Presentation to the Ballwin Presentation to the Ballwin Rotary Club Rotary Club April 22, 2008 April 22, 2008
-
Upload
alisha-cannon -
Category
Documents
-
view
213 -
download
0
Transcript of 1 Oil and the Economy Christopher J. Neely Assistant Vice-President, FRB Saint Louis Presentation to...
11
Oil and the EconomyOil and the Economy
Christopher J. NeelyChristopher J. Neely
Assistant Vice-President, FRB Saint LouisAssistant Vice-President, FRB Saint Louis
Presentation to the Ballwin Rotary ClubPresentation to the Ballwin Rotary Club
April 22, 2008April 22, 2008

22
DisclaimerDisclaimer
The views expressed are my own The views expressed are my own and do not necessarily reflect and do not necessarily reflect official positions of the Federal official positions of the Federal Reserve Bank of St. Louis, or the Reserve Bank of St. Louis, or the Federal Reserve System.Federal Reserve System.

33
What to talk about today? What to talk about today?
Current eventsCurrent events
Oil and the real economyOil and the real economy
Oil and gasoline pricesOil and gasoline prices
Lessons for the climate change debate Lessons for the climate change debate
44
Current EventsCurrent EventsOil Prices have risen since 2002. Oil Prices have risen since 2002.
– The international security situationThe international security situation
– Growth in global, primarily Asian, economies.Growth in global, primarily Asian, economies.
http://stlouisfed.org/publications/re/2007/b/pages/oil_prices.htmlhttp://stlouisfed.org/publications/re/2007/b/pages/oil_prices.html

55
Current EventsCurrent EventsSpot Oil Price: West Texas Intermediate ($/Barrel): 2000-2008:03
0
20
40
60
80
100
120
2000 2001 2002 2003 2004 2005 2006 2007 2008
US
D/b
bl

66
Current EventsCurrent EventsChinese Oil consumption (Thousands of barrels/day)
0
1000
2000
3000
4000
5000
6000
7000
8000
1975 1980 1985 1990 1995 2000 2005
Thou
sand
s bar
rels
/day

77
Current EventsCurrent Events
Oil companies make money when oil prices rise. Oil companies make money when oil prices rise.
Oil is their major asset. Oil is their major asset.

88
Real Oil Prices and Petroleum Industry Profits
0
20
40
60
80
100
1945 1950 1955 1960 1965 1970 1975 1980 1985 1990 1995 2000 2005
Rea
l oil
pric
e in
Q2.
2007
dol
lars
, def
late
d by
CP
I
-20
-10
0
10
20
30
40
Quarterly data through Q1.2007 (profits), Q2.2007 (oil price)
Pet
role
um a
nd c
oal i
ndus
trie
s' p
rofi
ts a
s pe
rcen
t of
all n
on-f
inan
cial
cor
pora
te p
rofi
ts
Real oil price: WTI spot price expressed inQ2.2007 dollars, deflated by CPI (left axis)
Petroleum and coal industries' profits as shareof all non-financial company corporate profits(right axis)

99
Current EventsCurrent Events
Inflation-adjusted oil prices are now just a little Inflation-adjusted oil prices are now just a little higher than in 1981. higher than in 1981.

1010
Yearly World Oil Prices ($/bb) World: Avg. Crude Price of UK Brent/Dubai/Alaska
0.00
10.00
20.00
30.00
40.00
50.00
60.00
70.00
80.00
90.00
100.00
1967 1972 1977 1982 1987 1992 1997 2002 2007
$/b
bl
Real Crude Oil Price
Nominal Crude Oil Price
1111
Oil and the real economyOil and the real economy
Rising oil prices often are associated with recessions.
James Hamilton (UCSD) has shown a strong relationship between oil and recessions.

1212
Oil and the real economyOil and the real economy
Spot Oil Price: West Texas Intermediate [Prior'82=Posted Price]$/Barrel
Civilian Unemployment Rate: 16 yr +SA, %
0500959085807570Sources: Wall Street Journal, Bureau of Labor Statistics /Haver Analytics
80
60
40
20
0
12
10
8
6
4
2
Spot Oil Price: West Texas Intermediate [Prior'82=Posted Price]$/Barrel
Civilian Unemployment Rate: 16 yr +SA, %
0500959085807570
Sources: Wall Street Journal, Bureau of Labor Statistics /Haver Analytics
120
100
80
60
40
20
0
12
10
8
6
4
2
1313
Oil and the real economyOil and the real economyWhy have rising oil prices caused recessions?Why have rising oil prices caused recessions?
– If input prices change, then If input prices change, then
firms change the types of capital and labor employedfirms change the types of capital and labor employed
and consumers will change their consumption bundles. and consumers will change their consumption bundles.
Rising oil prices will also redistribute wealth from oil Rising oil prices will also redistribute wealth from oil consumers, to oil producers.consumers, to oil producers.
1414
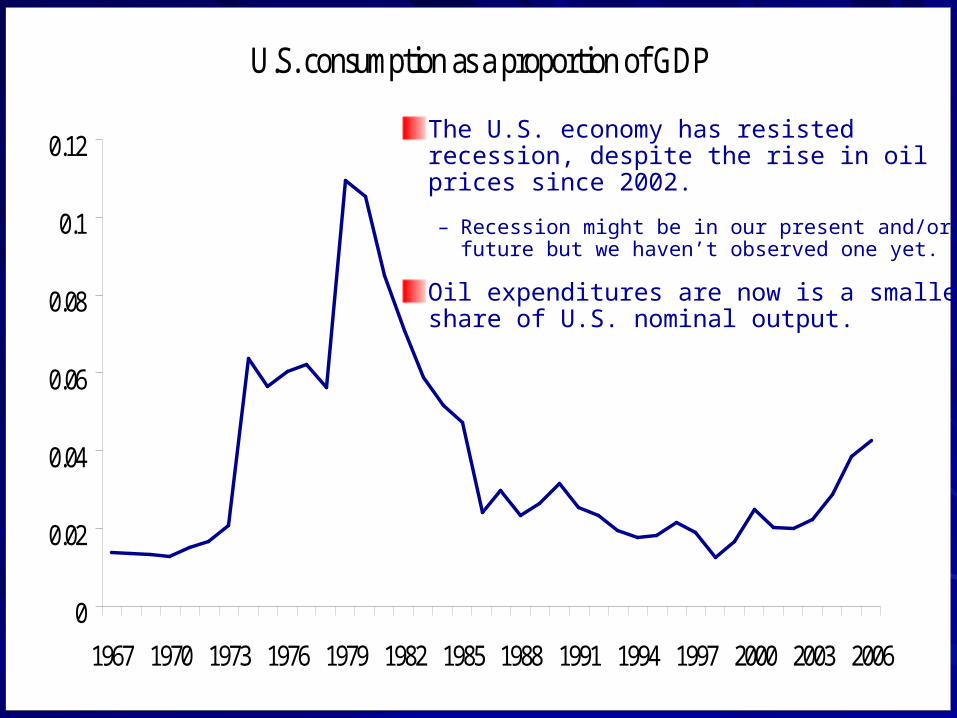
Oil and the real economyOil and the real economyU.S. consumption as a proportion of GDP
0
0.02
0.04
0.06
0.08
0.1
0.12
1967 1970 1973 1976 1979 1982 1985 1988 1991 1994 1997 2000 2003 2006
The U.S. economy has resisted recession, despite the rise in oil prices since 2002.
– Recession might be in our present and/or future but we haven’t observed one yet.
Oil expenditures are now is a smaller share of U.S. nominal output.

1515
Oil and the real economyOil and the real economyOil Consumption per Unit of Real GDP
0
0.5
1
1.5
2
2.5
3
3.5
4
1967 1972 1977 1982 1987 1992 1997 2002
How much oil does the U.S. consume per unit of real output?

1616
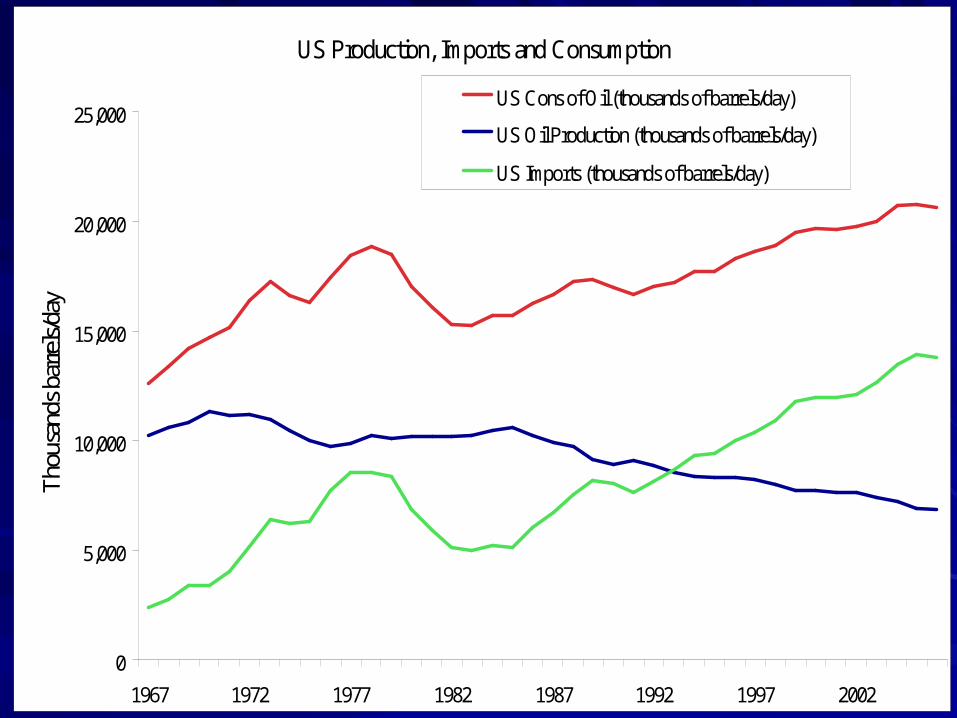
Oil and the real economyOil and the real economy Oil imports have become an even more important Oil imports have become an even more important share of U.S. consumption since the first calls for share of U.S. consumption since the first calls for “energy independence” in the 1970s. “energy independence” in the 1970s.
U.S. producers are relatively high cost producers. U.S. producers are relatively high cost producers.
We could produce more oil domestically, but at a We could produce more oil domestically, but at a higher cost than we could import it. higher cost than we could import it.
1717
Oil and the real economyOil and the real economyUS Production, Imports and Consumption
0
5,000
10,000
15,000
20,000
25,000
1967 1972 1977 1982 1987 1992 1997 2002
Tho
usan
ds b
arre
ls/d
ay
US Cons of Oil (thousands of barrels/day)
US Oil Production (thousands of barrels/day)
US Imports (thousands of barrels/day)
1818
Oil and gasoline pricesOil and gasoline prices
Why do gas prices change when oil prices change?Why do gas prices change when oil prices change?
– Crude oil is a major (and volatile) component of Crude oil is a major (and volatile) component of gasoline prices. gasoline prices.
http://stlouisfed.org/publications/re/2007/c/pages/gas-prices.htmlhttp://stlouisfed.org/publications/re/2007/c/pages/gas-prices.html
– If oil prices rise, the cost of producing gasoline rises and so does If oil prices rise, the cost of producing gasoline rises and so does its price. its price.

1919

2020
Oil and gasoline pricesOil and gasoline pricesWhy do expectations change gas prices? Why do expectations change gas prices?
(The oil in the tanks has been already purchased.)(The oil in the tanks has been already purchased.)
– Oil is a storable commodity: Spot and futures prices Oil is a storable commodity: Spot and futures prices are linked. are linked.
Higher expected prices cause sellers to sell less today and Higher expected prices cause sellers to sell less today and store more for tomorrow. store more for tomorrow.
This is good! It enables smoother consumption during This is good! It enables smoother consumption during disruptions. disruptions.
http://stlouisfed.org/publications/re/2007/c/pages/gas-prices.htmlhttp://stlouisfed.org/publications/re/2007/c/pages/gas-prices.html

2121
Oil and gasoline pricesOil and gasoline prices
An implication for An implication for forecasters: forecasters:
Futures price contain no Futures price contain no information about information about expected future spot expected future spot prices that isn’t in prices that isn’t in current spot prices, current spot prices, interest rates and storage interest rates and storage costs. costs.

2222
Prices are signalsPrices are signalsRising prices indicate either rising demand or Rising prices indicate either rising demand or falling supply (or both). falling supply (or both).
High prices encourage more production and less High prices encourage more production and less consumption, preventing shortages. consumption, preventing shortages.
Prices are usually the best way to ration scarce Prices are usually the best way to ration scarce goods and services. goods and services.
– Buyers are the most willing (and able) to pay. Buyers are the most willing (and able) to pay.
Redistribution of initial wealth can achieve Redistribution of initial wealth can achieve “fairness” goals within a price system. “fairness” goals within a price system.

2323
Lessons for global warmingLessons for global warming
Let’s stipulate—without debating—the following: Let’s stipulate—without debating—the following:
– Climate change is happening.Climate change is happening.
– Human COHuman CO22 emissions are substantially responsible. emissions are substantially responsible.
– The increase in temperature/ COThe increase in temperature/ CO22 is a bad thing, on is a bad thing, on
balance. balance.
– Reducing COReducing CO22 emissions is desirable. emissions is desirable.
2424
Lessons for global warmingLessons for global warming
Conventional price theory would support taxes on Conventional price theory would support taxes on COCO22 production/emission. production/emission.
Taxes should be introduced gradually.Taxes should be introduced gradually.
We can use the COWe can use the CO22 tax revenue to reduce other tax revenue to reduce other
taxes that distort behavior, like income taxes. taxes that distort behavior, like income taxes.
A tax will discourage consumption and encourage A tax will discourage consumption and encourage alternative sources of energy. alternative sources of energy.
2525
Lessons for global warmingLessons for global warming
Rationing/mandates are very costly & often Rationing/mandates are very costly & often ineffective. ineffective.
– Lines for concert tickets are wasteful. Lines for concert tickets are wasteful.
– CAFÉ standards spawned the SUV industry. CAFÉ standards spawned the SUV industry.
COCO22 cap-and-trade systems amount to gifts to the cap-and-trade systems amount to gifts to the
polluters. polluters.
– One could auction off permits to create COOne could auction off permits to create CO22. That . That
would produce effects similar to a tax. would produce effects similar to a tax.

2626
The EndThe End