1 Nepal’s WTO Membership and the Agriculture Sector Navin Dahal South Asia Watch on Trade...
30
1 Nepal’s WTO Membership and the Agriculture Sector Navin Dahal South Asia Watch on Trade Economics and Environment
-
Upload
justina-price -
Category
Documents
-
view
214 -
download
0
Transcript of 1 Nepal’s WTO Membership and the Agriculture Sector Navin Dahal South Asia Watch on Trade...

1
Nepal’s WTO Membership and the Agriculture Sector
Navin DahalSouth Asia Watch on Trade Economics and Environment
2
Content of the Presentation
Introduction to WTO Nepalese Agriculture Sector Agreement on Agriculture Nepal’s Commitments and Concerns Other Agreements that impact the
Agriculture Sector

3
WTO
Successor of GATT, Operational from 1 January 1995
Permanent inter-governmental body governing and regulating international trade in goods, services and IPR
It’s an organisation for liberalising trade – help trade flow as freely as possible
It’s a place for settling trade disputes

4
WTO
WTO is based on four pillars Promoting rules based multilateral trading system Non-discrimination (Most-Favoured Nations and National
Treatment) Transparency Special treatment for less developed countries
It has 149 members Decisions are made through consensus It provides for an effective dispute settlement
system
5
WTO
At the heart of the system are WTO Agreements, negotiated and signed by members
These Agreements are contracts that bind governments to keep their trade policies within agreed limits

6
Major WTO Agreements
GATT 1994 Trade Related Aspects of Intellectual Property
Rights (TRIPS) Agreement on Agriculture (AOA) General Agreement on Trade in Services (GATS) Agreement on Sanitary and Phytosanitary (SPS)
Measures Technical Barriers to Trade (TBT) Agreement on Textile and Clothing (ATC)

7
WTO Agreements
The WTO Agreements cover goods, services and intellectual property
They spell out principles of liberalisation and permitted exceptions
They include individual countries commitment to lower custom tariffs and other trade barriers and open key services sectors : 22,500 pages listing individual countries commitments
They set procedures for settling disputes
8
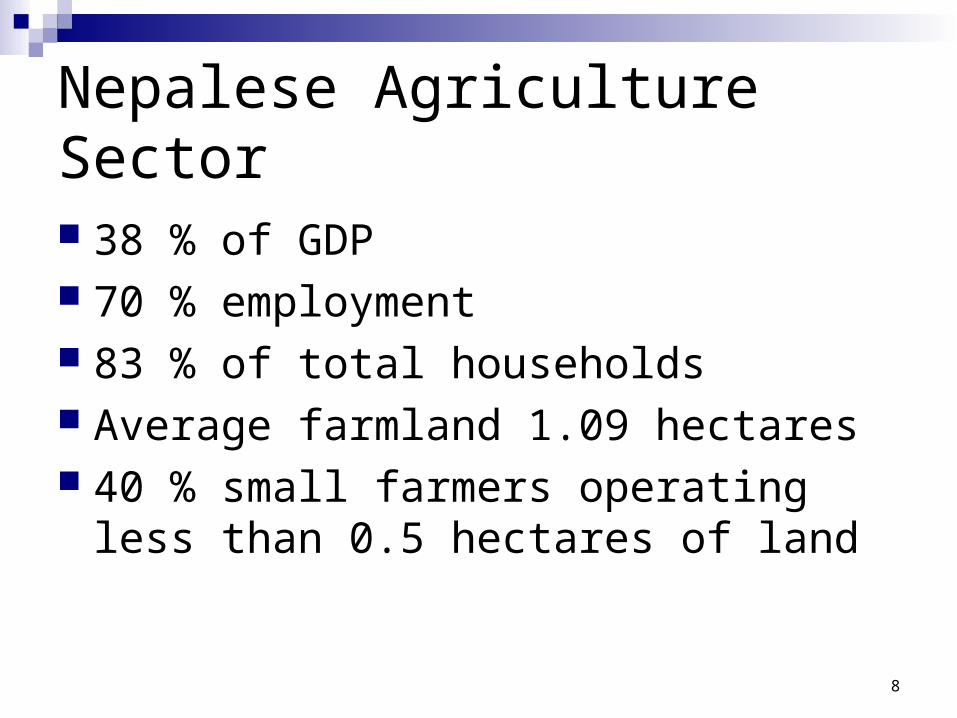
Nepalese Agriculture Sector
38 % of GDP 70 % employment 83 % of total households Average farmland 1.09 hectares 40 % small farmers operating less than 0.5
hectares of land

9
AoA
Objective – To establish a fair and market-oriented agriculture trading system
Members are required to make commitments in three areasMarket AccessDomestic SupportExport Subsidies
10
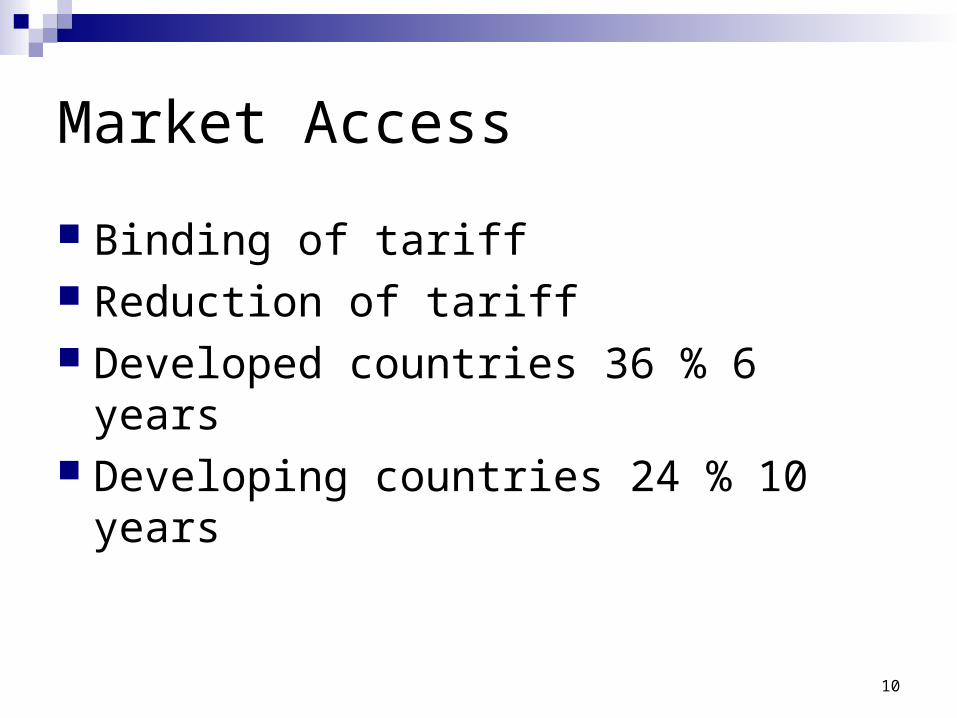
Market Access
Binding of tariff Reduction of tariff Developed countries 36 % 6 years Developing countries 24 % 10 years

11
Agriculture in WTO (contd..)
Modest success in reforming agricultureMarket Access Bound tariff-62 per cent Tariff peaks and escalation Non-predictability of tariff structure Use of specific duties Tariff Rate Quota Special Safeguard Measures (SSG) State Trading Enterprises

12
Tariff Structures Bound Tariffs
USA EU-15 INDIA
Mean 12% 29% 117%
Maximum 350% 277% 300%
Minimum 0% 0% 10%
# Tariff lines 1,829 2,091 692
T = 0% 388 399 0
0% < T >30% 1,247 1,060 24
30%<T>100% 139 480 422
T >100% 28 152 246
13
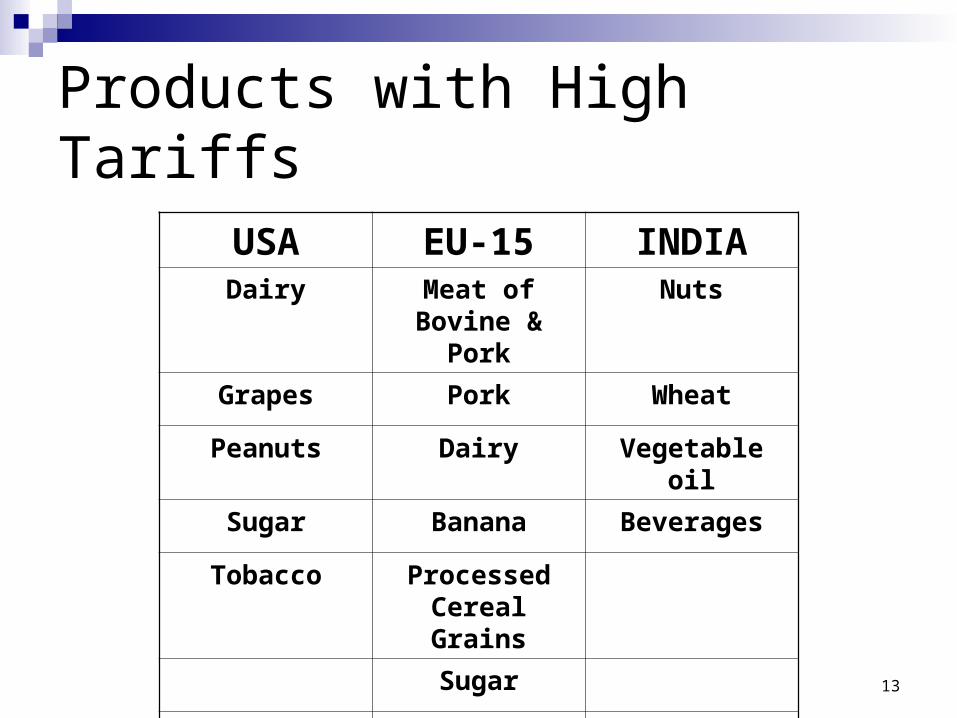
Products with High Tariffs
USA EU-15 INDIADairy Meat of Bovine
& PorkNuts
Grapes Pork Wheat
Peanuts Dairy Vegetable oil
Sugar Banana Beverages
Tobacco Processed Cereal Grains
Sugar
Prepared vegetables….

14
Domestic Support
Aggregate Measurement of Support (AMS) Support that encourage overproduction Amber box, blue box and green box support 1986-88 base level Developed countries reduce 20 percent over 6
years Developing countries reduce 13 percent over 10
years De minimis – 10 and 5 percent of AGDP

15
Export Subsidies
Prohibited unless specified in Member’s commitments
Where listed members agreed to cut both amount and quantities
Developed countries agreed to cut by 36 % over 6 years
Developing countries by 21 % over 10 years
16
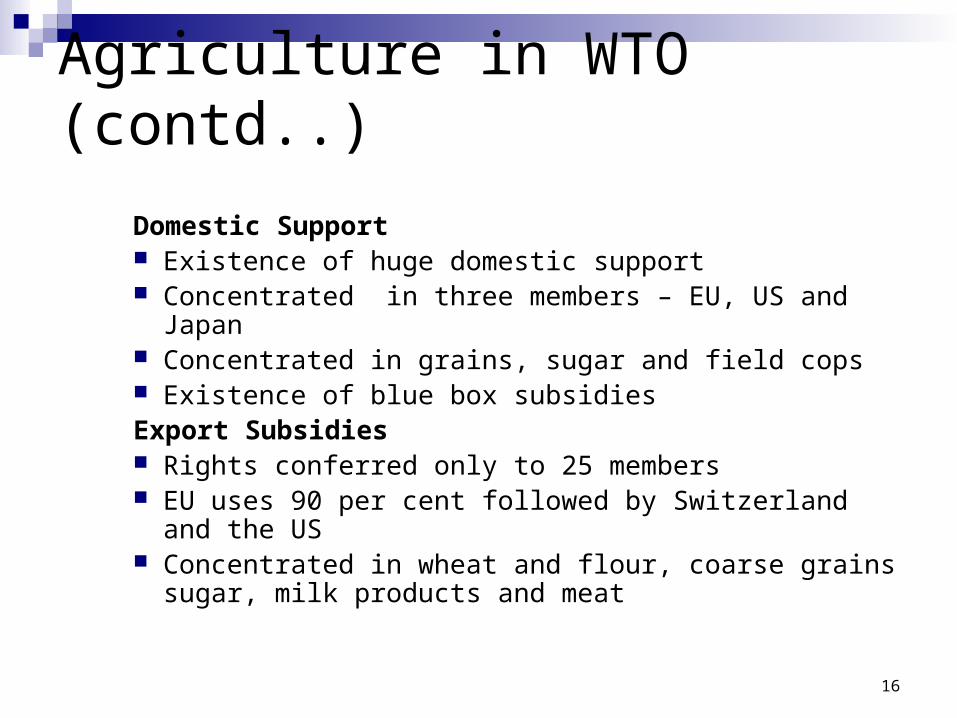
Agriculture in WTO (contd..)
Domestic Support Existence of huge domestic support Concentrated in three members – EU, US and Japan Concentrated in grains, sugar and field cops Existence of blue box subsidies Export Subsidies Rights conferred only to 25 members EU uses 90 per cent followed by Switzerland and
the US Concentrated in wheat and flour, coarse grains
sugar, milk products and meat
17
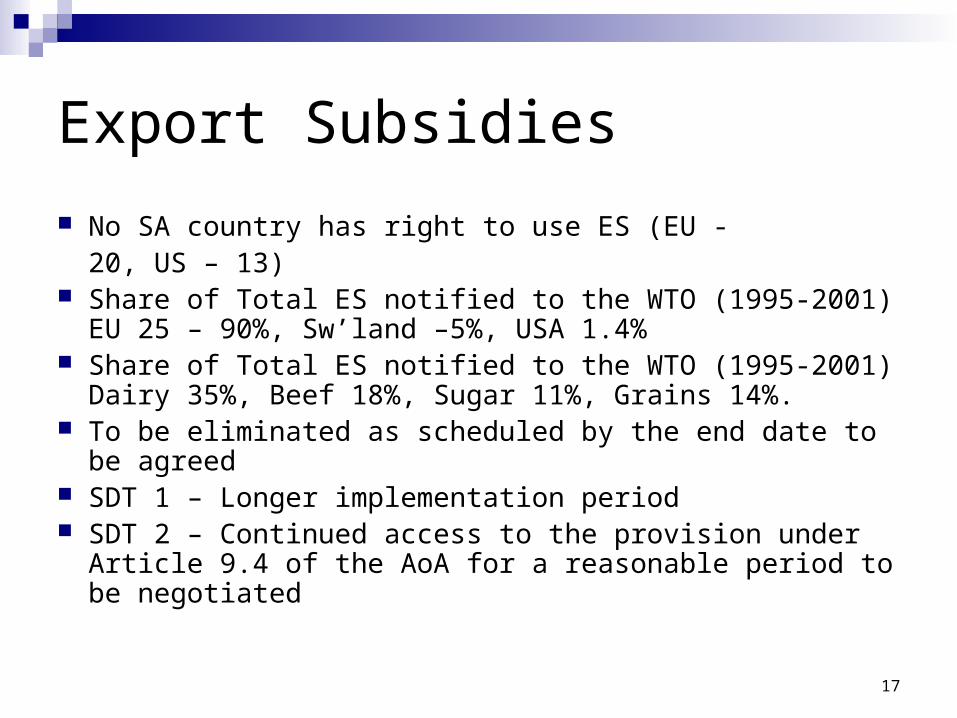
Export Subsidies
No SA country has right to use ES (EU -20, US – 13)
Share of Total ES notified to the WTO (1995-2001) EU 25 – 90%, Sw’land –5%, USA 1.4%
Share of Total ES notified to the WTO (1995-2001) Dairy 35%, Beef 18%, Sugar 11%, Grains 14%.
To be eliminated as scheduled by the end date to be agreed
SDT 1 – Longer implementation period SDT 2 – Continued access to the provision under Article
9.4 of the AoA for a reasonable period to be negotiated

18
Export Credits
Share of EC (1998) – USA 49%, Australia 20%, EU 15 16%, Canada 14%
Share of EC – Cereals 28%, Livestock products 16%, Vegetable products 16%, Processed Products 10%
Export credits, export credit guarantees or insurance programs with repayment periods beyond 180 days will be eliminated by the end date to be agreed
19
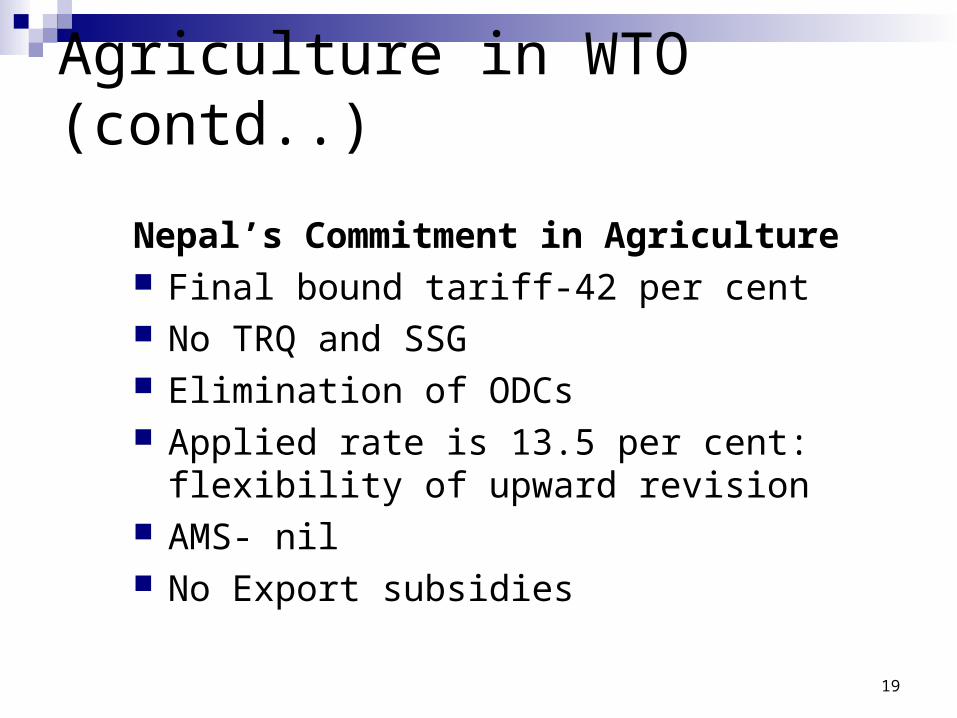
Agriculture in WTO (contd..)
Nepal’s Commitment in Agriculture Final bound tariff-42 per cent No TRQ and SSG Elimination of ODCs Applied rate is 13.5 per cent: flexibility
of upward revision AMS- nil No Export subsidies
20
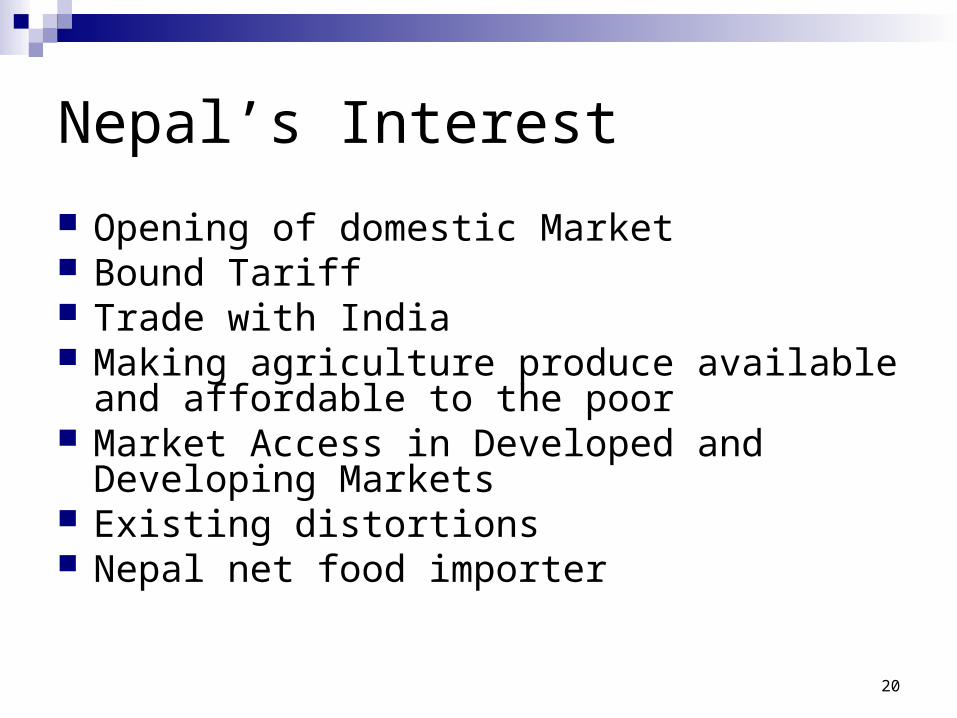
Nepal’s Interest
Opening of domestic Market Bound Tariff Trade with India Making agriculture produce available and
affordable to the poor Market Access in Developed and Developing
Markets Existing distortions Nepal net food importer

21
Agriculture in WTO (contd..)
Ongoing Negotiation Doha Declaration July Package
Parallelism Recognition of development and social issues Domestic support Export subsidies Market access Special and differential treatment
Work on Technical Issues not drafting of Text
22
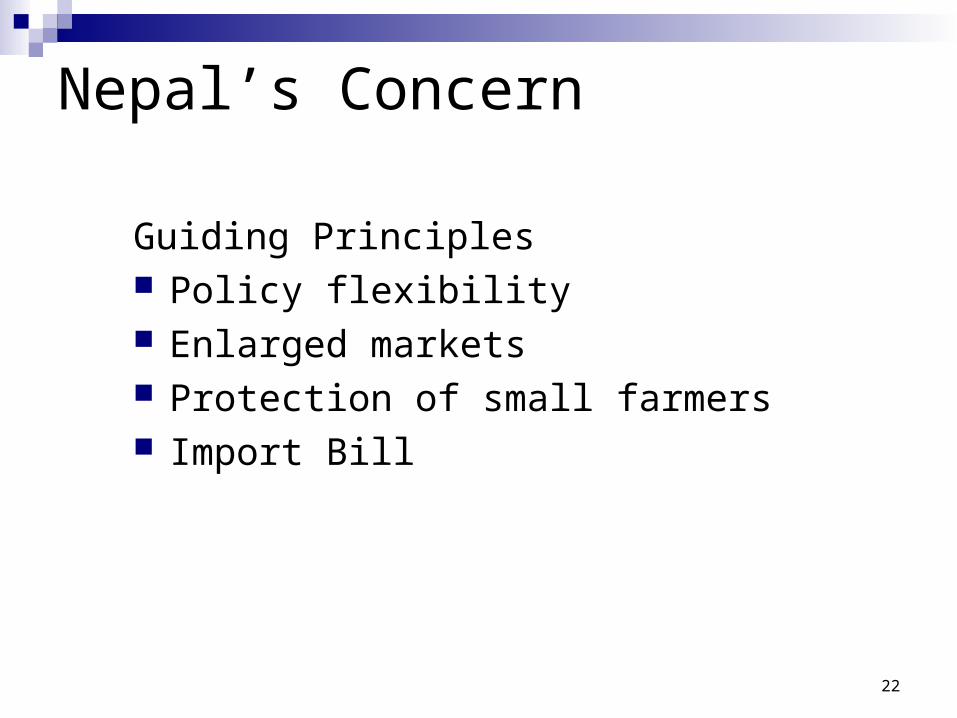
Nepal’s Concern
Guiding Principles Policy flexibility Enlarged markets Protection of small farmers Import Bill

23
Import
19 % of total Crude palm oil – 24.3 % Rice – 2.6 %
24
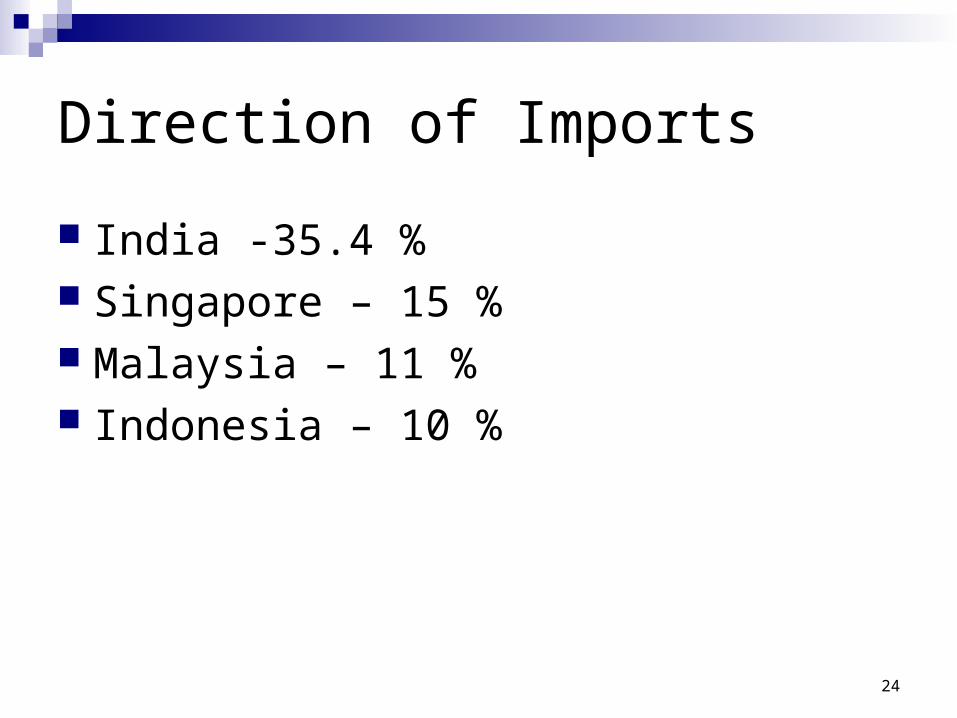
Direction of Imports
India -35.4 % Singapore – 15 % Malaysia – 11 % Indonesia – 10 %
25
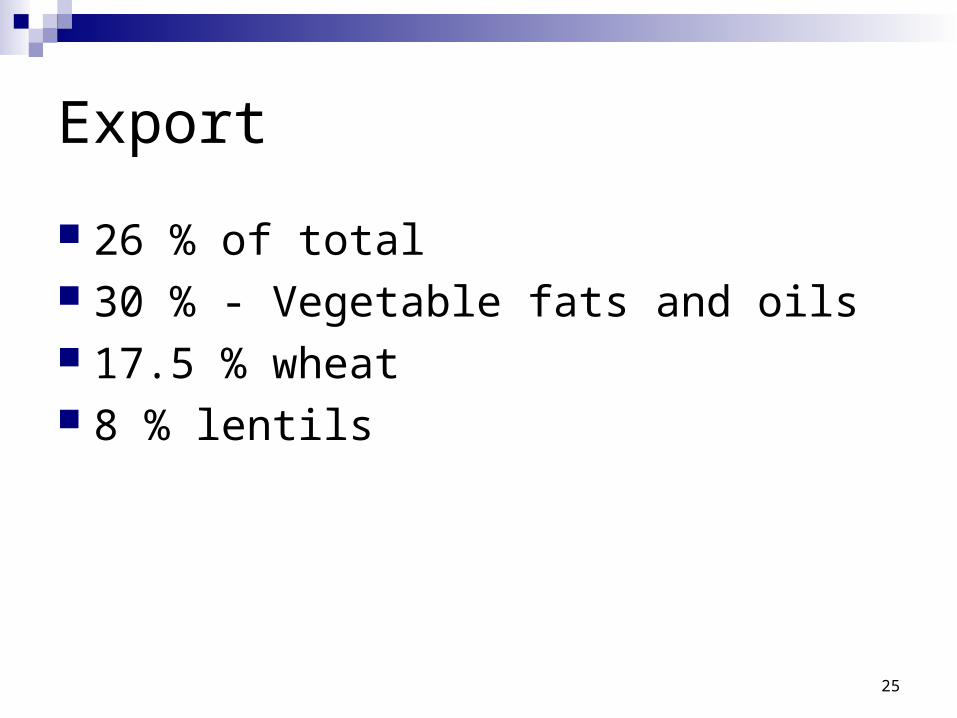
Export
26 % of total 30 % - Vegetable fats and oils 17.5 % wheat 8 % lentils

26
Direction of Exports
India – 84 % Tibet – 7 % EU – 3 %
27
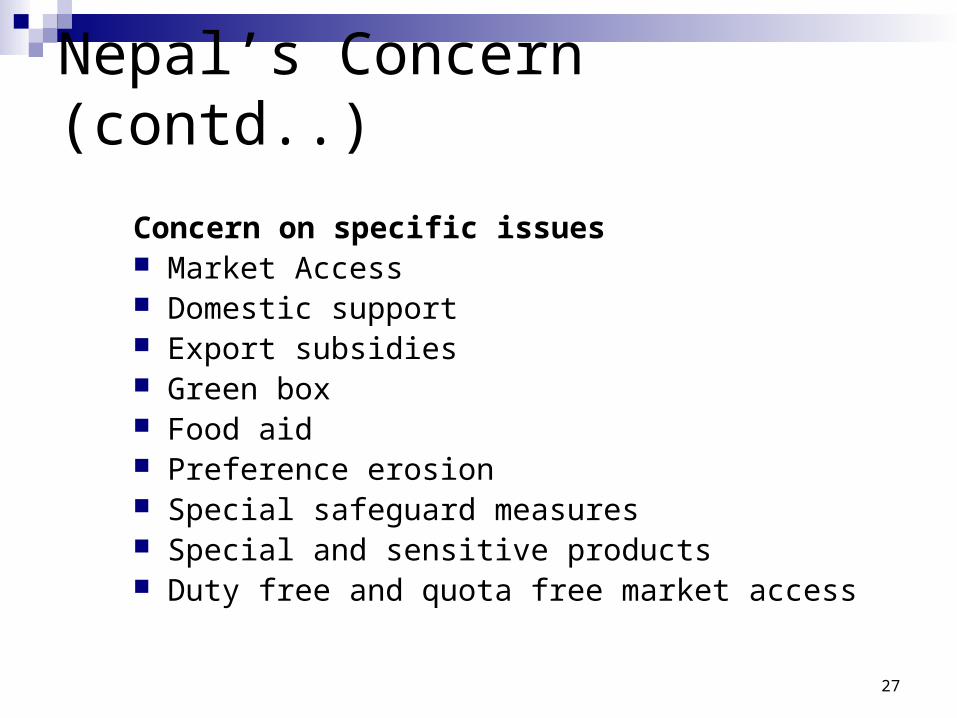
Nepal’s Concern (contd..)
Concern on specific issues Market Access Domestic support Export subsidies Green box Food aid Preference erosion Special safeguard measures Special and sensitive products Duty free and quota free market access
28
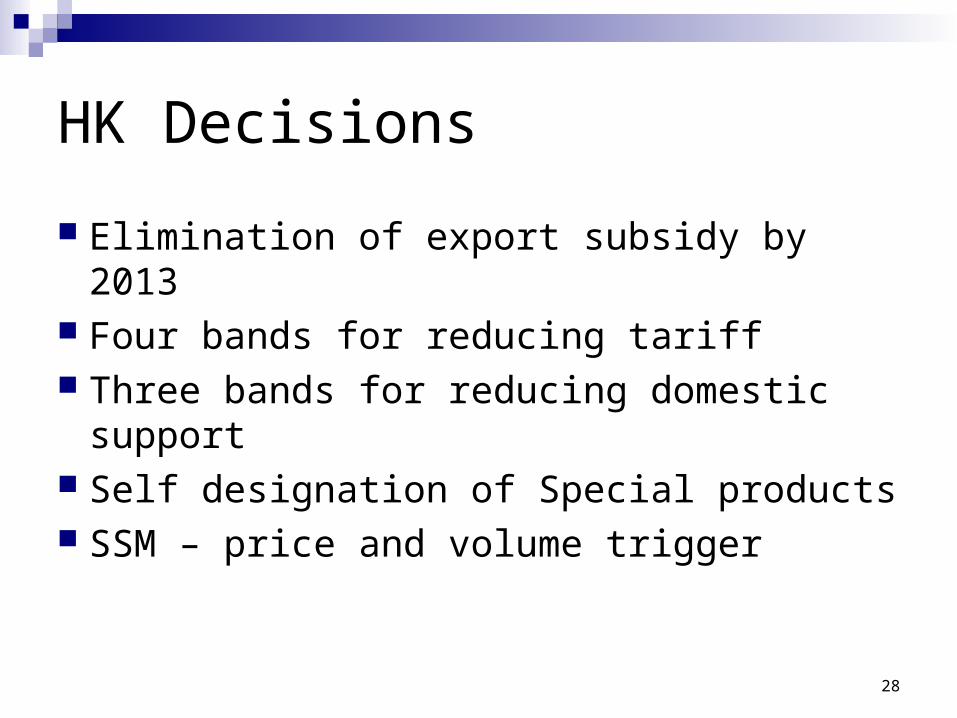
HK Decisions
Elimination of export subsidy by 2013 Four bands for reducing tariff Three bands for reducing domestic
support Self designation of Special products SSM – price and volume trigger

29
Other Agreements
SPS TBT TRIPS

30
Thank you for your kind attention


![Haemophilus [NavIn]](https://static.fdocuments.net/doc/165x107/577d27191a28ab4e1ea30e7f/haemophilus-navin.jpg)