
1 Mobile County Public School System 2008 Accountability Report September 18, 2008.
64
1 Mobile County Public School Mobile County Public School System System 2008 2008 Accountability Report Accountability Report September 18, 2008 September 18, 2008
-
Upload
vernon-hoover -
Category
Documents
-
view
215 -
download
1
Transcript of 1 Mobile County Public School System 2008 Accountability Report September 18, 2008.

11
Mobile County Public School Mobile County Public School SystemSystem20082008
Accountability ReportAccountability Report
September 18, 2008September 18, 2008

22
22008 MCPSS Annual Report008 MCPSS Annual Report
AYP Summary Graph AYP Summary Graph Page 3Page 3 AYP Accountability Overview AYP Accountability Overview Page 4 – 4a/4bPage 4 – 4a/4b
AYP System Introduction Page AYP System Introduction Page Page 5Page 5 Grade Span Summary Report Grade Span Summary Report Page 6Page 6 5 Year APY Status Comparison 5 Year APY Status Comparison Pages 7- 10Pages 7- 10 2008-2009 Status Year Report 2008-2009 Status Year Report Page 11Page 11 AYP Information AYP Information Pages 12-17Pages 12-17 Additional Academic Indicator Information Page 18Additional Academic Indicator Information Page 18 Graduation Rate Graduation Rate Page 19Page 19 Annual Measurable Objectives Chart Page 20Annual Measurable Objectives Chart Page 20 Assessment Information Assessment Information Pages 21-22Pages 21-22 Alabama Direct Writing Assessment Chart Page 23Alabama Direct Writing Assessment Chart Page 23

33
2008 MCPSS Annual Report2008 MCPSS Annual Report
Alabama H. S. Grad Exam Reports Alabama H. S. Grad Exam Reports Pages 24-36 Pages 24-36 ARMT Report Introduction PageARMT Report Introduction Page Page 37 Page 37 Annual Measurable Objectives Chart Page 38Annual Measurable Objectives Chart Page 38 Alabama Reading and Math Test Reports Pages Alabama Reading and Math Test Reports Pages
39-4039-40 44thth Quarter CRT Reports Pages 4-48 Quarter CRT Reports Pages 4-48 DIBELS Report DIBELS Report Page 49–50 Page 49–50 SAT 10 Reports SAT 10 Reports Pages 51–53 Pages 51–53 Next Steps Next Steps Pages 54–59 Pages 54–59 Balanced Scorecard Balanced Scorecard Page Page
60–60a/60b60–60a/60b Additional InformationAdditional Information Pages 61-65 Pages 61-65

44
55
Mobile County Public Mobile County Public SchoolsSchools
Accountability ComparisonAccountability Comparison
66
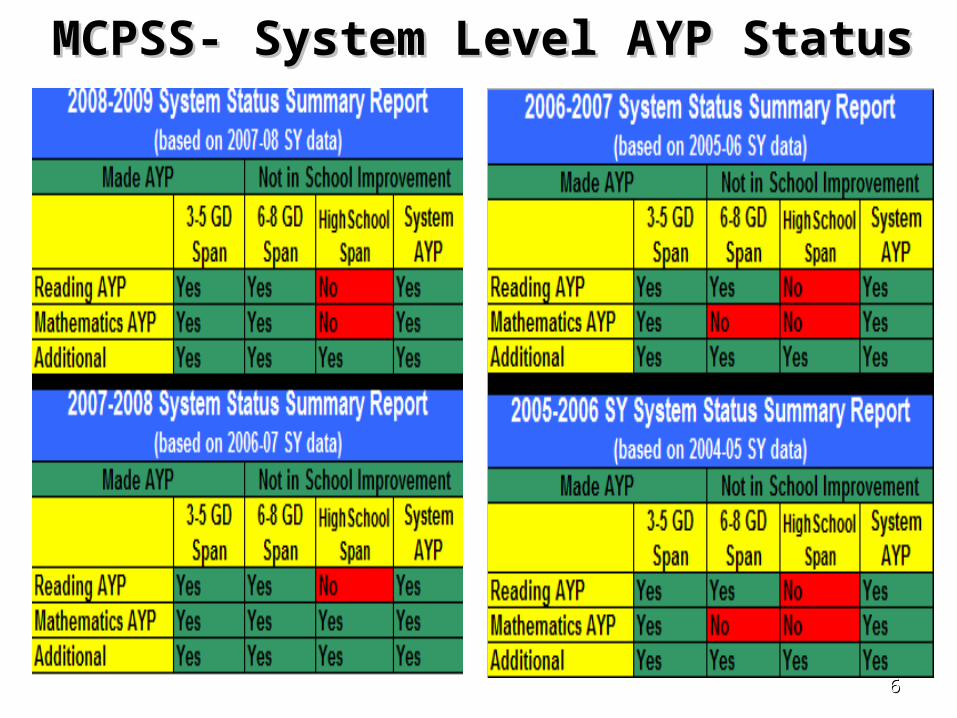
MCPSS- System Level AYP MCPSS- System Level AYP StatusStatus

77
Grade Span Summary AYP Report Grade Span Summary AYP Report Special Education Subgroup Special Education Subgroup Proficiency Index (Goal is 0.00) Proficiency Index (Goal is 0.00)
Status Status Year Year
School School Year Year
ReadingReading
3-5 Grade3-5 Grade 6-8 Grade6-8 Grade 11 Grade11 Grade
2008-092008-09 2007-082007-08 -6.31-6.31 Yes (SH)Yes (SH) -7.95-7.95 Yes(2%)Yes(2%) -40.28 No-40.28 No
2007-082007-08 2006-072006-07 -7.83 -7.83 Yes ( 2% )Yes ( 2% ) -4.44-4.44 Yes ( 2%)Yes ( 2%) -31.12 No-31.12 No
2006-072006-07 2005-062005-06 -6.25-6.25 Yes (SH)Yes (SH) -4.39-4.39 Yes (SH)Yes (SH) -33.30-33.30 Yes (SH)Yes (SH)
2005-062005-06 2004-052004-05 -29.72-29.72 Yes (SH)Yes (SH) -32.25-32.25 Yes (SH)Yes (SH) -43.11-43.11 NoNo
Status Status Year Year
School School Year Year
Math Math
3-5 Grade3-5 Grade 6-8 Grade6-8 Grade 11 Grade11 Grade
2008-092008-09 2007-082007-08 -0.04-0.04 Yes (CI)Yes (CI) 8.87 Yes8.87 Yes -25.54 No-25.54 No
2007-082007-08 2006-072006-07 -1.16-1.16 Yes ( 2% )Yes ( 2% ) 11.94 Yes11.94 Yes -13.89-13.89 (SH)(SH)
2006-072006-07 2005-062005-06 7.557.55 YesYes 19.02 Yes19.02 Yes -20.59-20.59 Yes (SH)Yes (SH)
2005-062005-06 2004-052004-05 -15.02-15.02 Yes (SH)Yes (SH) -23.92-23.92 NoNo -38.51-38.51 NoNo

88

99

1010
1111
1212
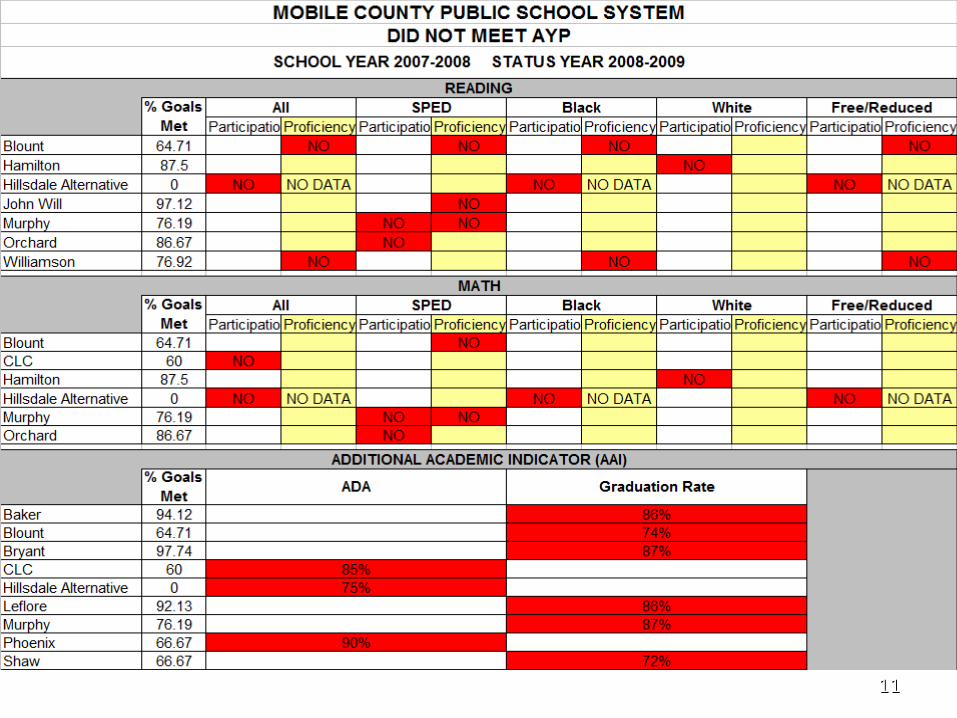
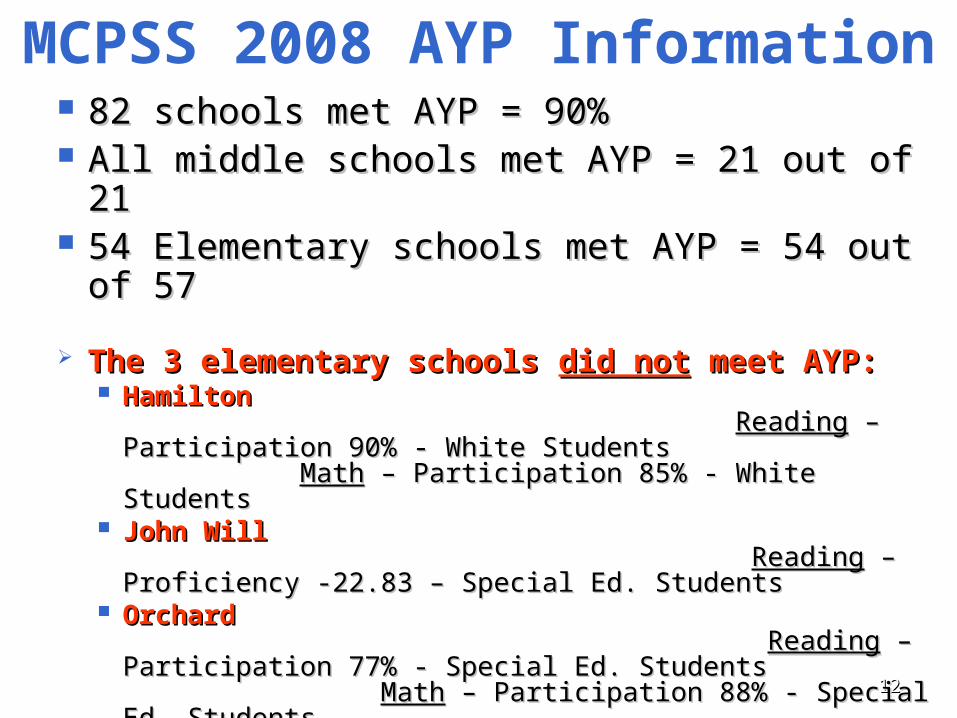
MCPSS 2008 AYP Information 82 schools met AYP = 90%82 schools met AYP = 90% All middle schools met AYP = 21 out of 21All middle schools met AYP = 21 out of 21 54 Elementary schools met AYP = 54 out 54 Elementary schools met AYP = 54 out
of 57of 57
The 3 elementary schools The 3 elementary schools did notdid not meet meet AYP:AYP: HamiltonHamilton
ReadingReading – Participation 90% - White Students – Participation 90% - White Students MathMath – Participation 85% - White – Participation 85% - White StudentsStudents
John WillJohn Will ReadingReading – Proficiency -22.83 – Special Ed. – Proficiency -22.83 – Special Ed. Students Students
Orchard Orchard ReadingReading – Participation 77% - Special Ed. – Participation 77% - Special Ed. Students Students MathMath – Participation 88% - – Participation 88% - Special Ed. StudentsSpecial Ed. Students
1313
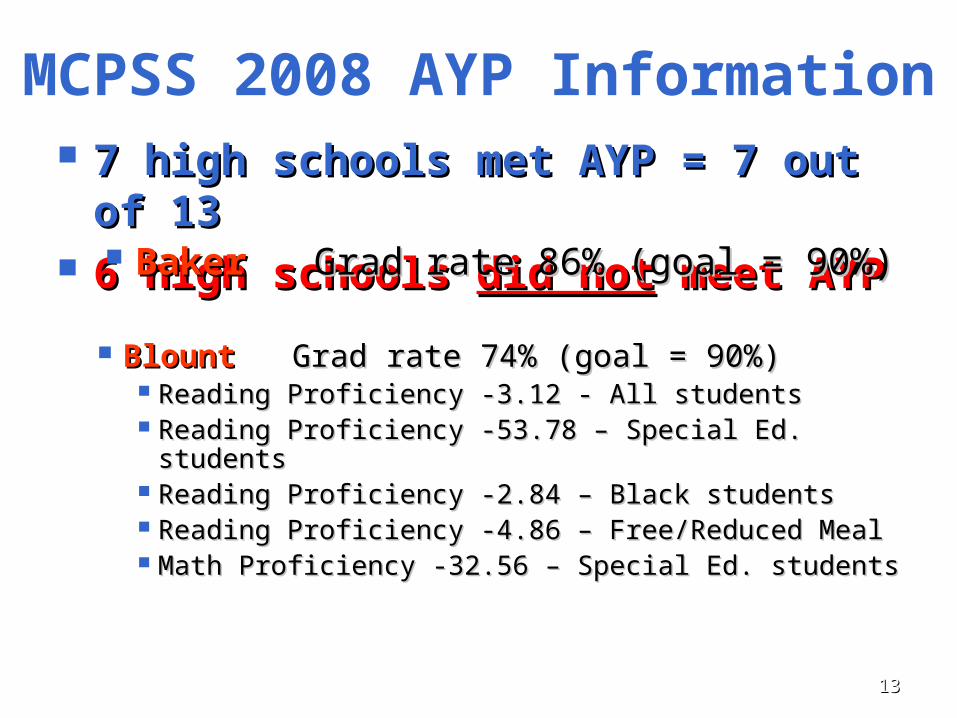
MCPSS 2008 AYP Information 7 high schools met AYP = 7 out 7 high schools met AYP = 7 out
of 13of 13 6 high schools 6 high schools did notdid not meet AYP meet AYP
BlountBlount Grad rate 74% (goal = 90%)Grad rate 74% (goal = 90%) Reading Proficiency -3.12 - All studentsReading Proficiency -3.12 - All students Reading Proficiency -53.78 – Special Ed. studentsReading Proficiency -53.78 – Special Ed. students Reading Proficiency -2.84 – Black studentsReading Proficiency -2.84 – Black students Reading Proficiency -4.86 – Free/Reduced MealReading Proficiency -4.86 – Free/Reduced Meal Math Proficiency -32.56 – Special Ed. studentsMath Proficiency -32.56 – Special Ed. students
Baker Baker Grad rate 86% (goal = 90%)Grad rate 86% (goal = 90%)

1414
MCPSS 2008 AYP Information Bryant Bryant Grad rate 87% (goal = 90%)Grad rate 87% (goal = 90%)
Murphy Murphy Grad rate 87% (goal = 90%)Grad rate 87% (goal = 90%) Reading Participation 89% - Special Ed. StudentsReading Participation 89% - Special Ed. Students Reading Proficiency -41.43 – Special Ed. StudentsReading Proficiency -41.43 – Special Ed. Students Math Participation 91% - Special Ed. StudentsMath Participation 91% - Special Ed. Students Math Proficiency -27.00 – Special Ed. StudentsMath Proficiency -27.00 – Special Ed. Students
LeFloreLeFlore Grad rate 88% (goal = 90%)Grad rate 88% (goal = 90%)
WilliamsonWilliamson Grad rate 86% (goal = 90%) Grad rate 86% (goal = 90%) IM =Improvement made IM =Improvement made
Reading Proficiency -5.46 - All studentsReading Proficiency -5.46 - All students Reading Proficiency -5.46 – Black studentsReading Proficiency -5.46 – Black students Reading Proficiency -6.40 – Free/Reduced MealReading Proficiency -6.40 – Free/Reduced Meal
1515
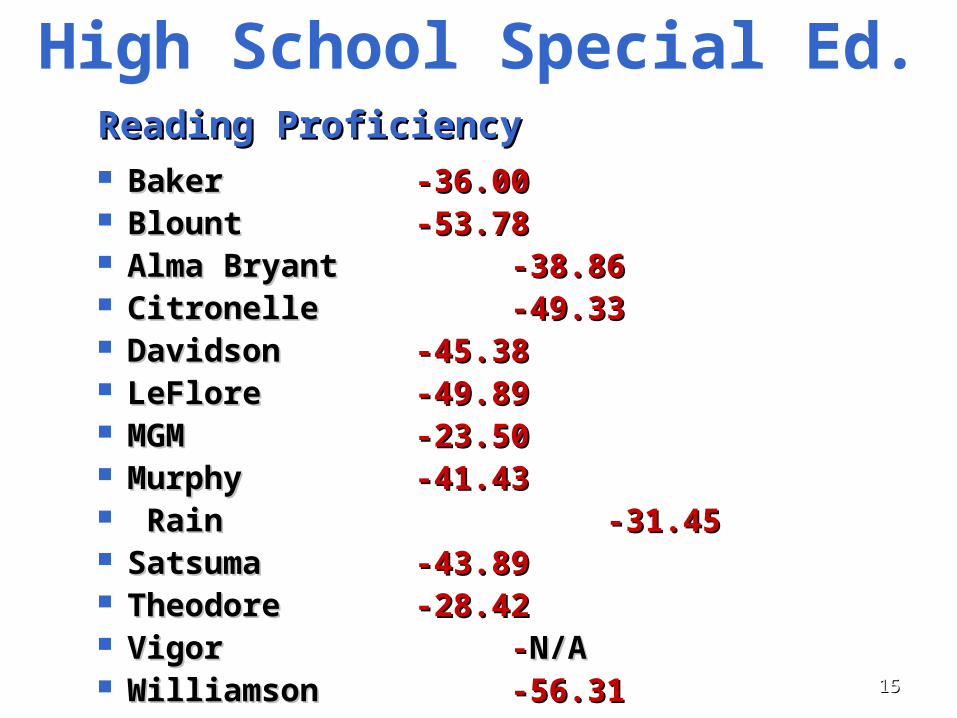
High School Special Ed.Reading ProficiencyReading Proficiency Baker Baker -36.00-36.00 Blount Blount -53.78-53.78 Alma Bryant Alma Bryant -38.86-38.86 CitronelleCitronelle -49.33-49.33 DavidsonDavidson -45.38-45.38 LeFloreLeFlore -49.89-49.89 MGMMGM -23.50-23.50 MurphyMurphy -41.43-41.43 RainRain -31.45-31.45 SatsumaSatsuma -43.89-43.89 TheodoreTheodore -28.42-28.42 VigorVigor --N/AN/A WilliamsonWilliamson -56.31-56.31

1616
High School Special Ed.Math ProficiencyMath Proficiency Baker Baker -27.00-27.00 Blount Blount -32.56-32.56 Alma BryantAlma Bryant -20.06-20.06 CitronelleCitronelle -37.00-37.00 DavidsonDavidson -27.00-27.00 LeFloreLeFlore -29.78-29.78 MGMMGM -19.86-19.86 MurphyMurphy -27.00-27.00 B.C. RainB.C. Rain -22.45-22.45 SatsumaSatsuma -11.21-11.21 TheodoreTheodore -8.82-8.82 VigorVigor -N/A-N/A WilliamsonWilliamson -39.90-39.90

1717
MCPSS 2008 AYP Information
No schoolsNo schools enteredentered School School ImprovementImprovement oror advancedadvanced in the in the school improvement cycleschool improvement cycle
Four schoolsFour schools delayeddelayed their statustheir status GilliardGilliard School Improvement Year 1 (Delay) School Improvement Year 1 (Delay) ChastangChastang School Improvement Year 4 School Improvement Year 4
(Delay)(Delay) DentonDenton School Improvement Year 3 (Delay) School Improvement Year 3 (Delay) Eanes Eanes School Improvement Year 8 (Delay)School Improvement Year 8 (Delay)

1818
ALSDE ALSDE
Additional Academic Indicator Additional Academic Indicator (AAI) (AAI)
AAI for Grades K-8AAI for Grades K-8Average Daily Attendance (ADA) Target 95%Average Daily Attendance (ADA) Target 95%
based on the attendance rates for the 20 school based on the attendance rates for the 20 school days after Labor Daydays after Labor Day
AAI for High SchoolsAAI for High SchoolsGraduation Rate Target 90%Graduation Rate Target 90%
based on the previous school year’s graduating based on the previous school year’s graduating classclass

1919

2020
2004 2005 2006 2007 2008 2009 2010 2011 2012 2013 2014Grade 3 73 73 77 77 81 85 88 92 96 100Grade 4 68 68 73 73 77 77 82 86 91 95 100Grade 5 73 73 77 77 81 85 88 92 96 100Grade 6 74 74 78 78 81 81 85 89 93 96 100Grade 7 63 63 68 68 74 79 84 89 95 100Grade 8 43 43 51 51 59 59 67 76 84 92 100
Grade 11 81 81 84 84 86 86 89 92 95 97 100
2004 2005 2006 2007 2008 2009 2010 2011 2012 2013 2014Grade 3 63 63 68 68 74 79 84 89 95 100Grade 4 61 61 67 67 72 72 78 83 89 94 100Grade 5 59 59 65 65 71 77 82 88 94 100Grade 6 39 39 48 48 56 56 65 74 83 91 100Grade 7 40 40 49 49 57 66 74 83 91 100Grade 8 48 48 55 55 63 70 78 85 93 100
Grade 11 68 68 73 73 77 77 82 86 91 95 100
Found in the 2005 Interpretive Guide, page 7, on the Alabama State Department website, www.alsde.edu
STATE OF ALABAMAMOBILE COUNTY PUBLIC SCHOOL SYSTEM
ANNUAL MEASURABLE OBJECTIVES
Annual Measurable Objectives
www.alsde.edu
Percentage of Proficient Students
ReadingAnnual Measurable Objectives
Percentage of Proficient Students
Mathematics

2121
Assessment ReportsAssessment Reports ADAWADAW--Alabama Direct Assessment of Alabama Direct Assessment of
WritingWriting AHSGEAHSGE--Alabama High School Alabama High School
Graduation ExamGraduation Exam CRTCRT--CriterionCriterion--Referenced TestReferenced Test DIBELSDIBELS--Dynamic Indicators of Basic Dynamic Indicators of Basic
Early Literacy SkillsEarly Literacy Skills ARMTARMT--Alabama Reading and Math Alabama Reading and Math
TestTest SAT-10SAT-10--Standford Achievement Test, Standford Achievement Test,
1010thth Ed. Ed.

2222
Proficiency DefinitionsProficiency Definitions
ADAWADAW--Students scoring Levels III & IVStudents scoring Levels III & IV AHSGEAHSGE--Students scoring Levels III & IVStudents scoring Levels III & IV ARMTARMT--Students scoring Levels III & IVStudents scoring Levels III & IV CRTCRT--Students scoring 70% correctStudents scoring 70% correct DIBELSDIBELS--Students “Established,” “Low Students “Established,” “Low
Risk,” or “Benchmarked”Risk,” or “Benchmarked” SAT-10SAT-10--Students scoring Stanines 5-9Students scoring Stanines 5-9

2323

2424
AHSGEAHSGE - - Reports include:Reports include:
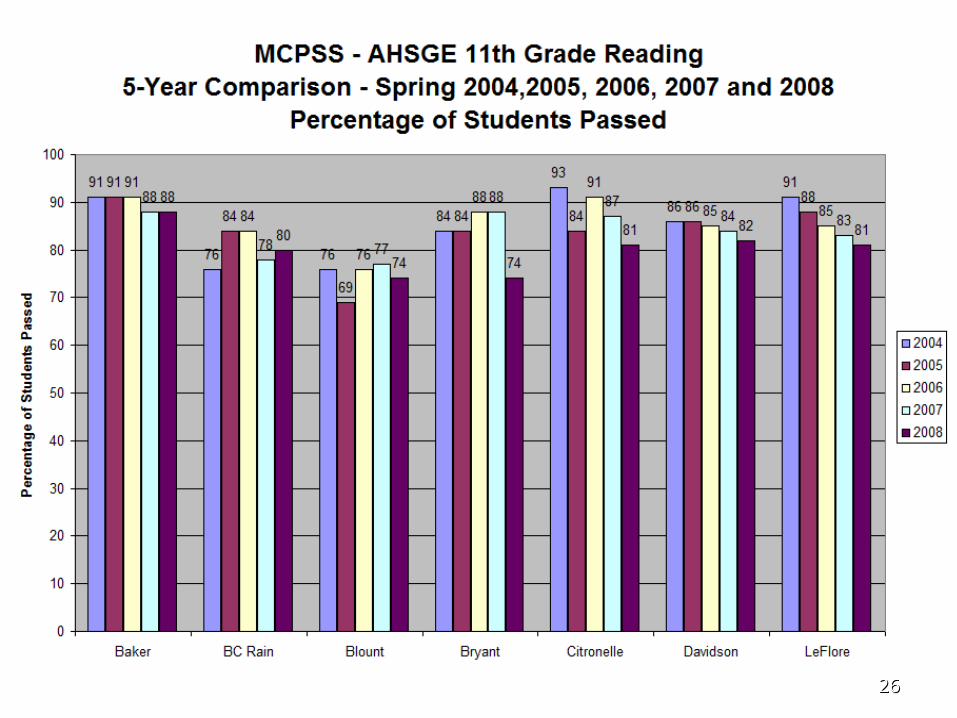
Spring 2008 State Report Spring 2008 State Report 1111thth Grade 5-Year School Level Grade 5-Year School Level
Comparison by Subject Reading, Math, Comparison by Subject Reading, Math, Language, Science & Social StudiesLanguage, Science & Social Studies
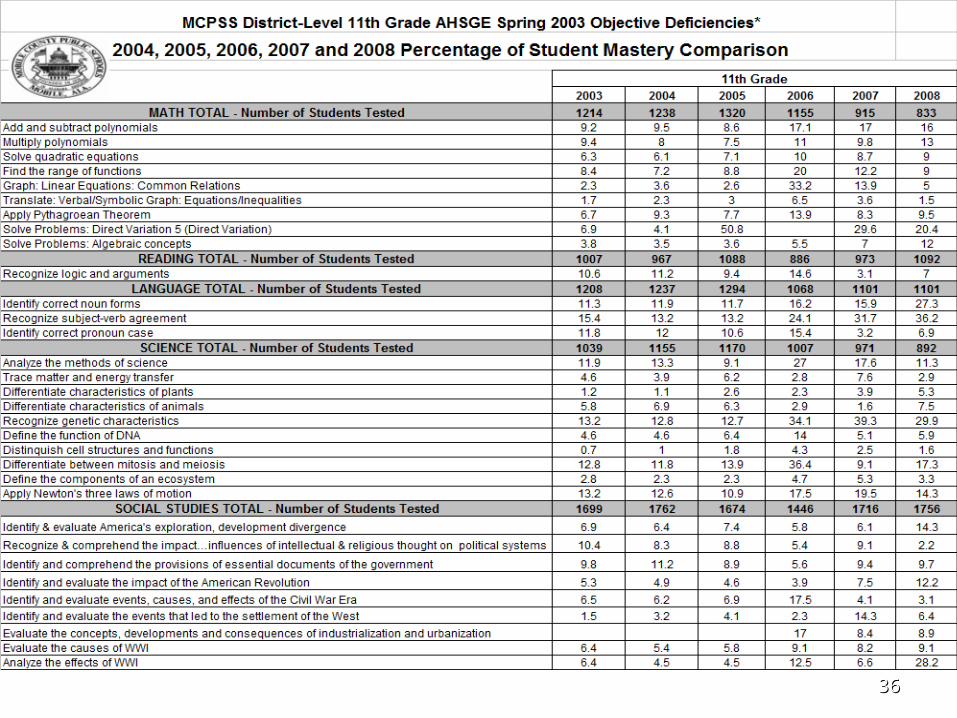
6-Year View of 116-Year View of 11thth Grade System Level Grade System Level Objective Deficiencies Objective Deficiencies
(Baseline Spring 2003)(Baseline Spring 2003)
2525
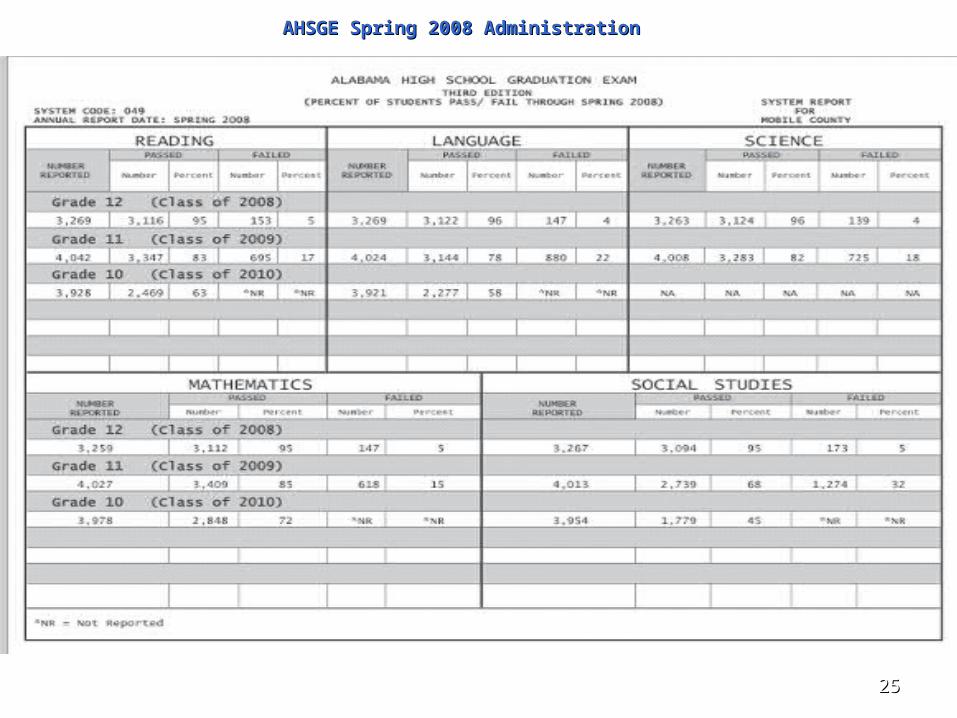
AHSGE Spring 2008 AdministrationAHSGE Spring 2008 Administration
2626

2727
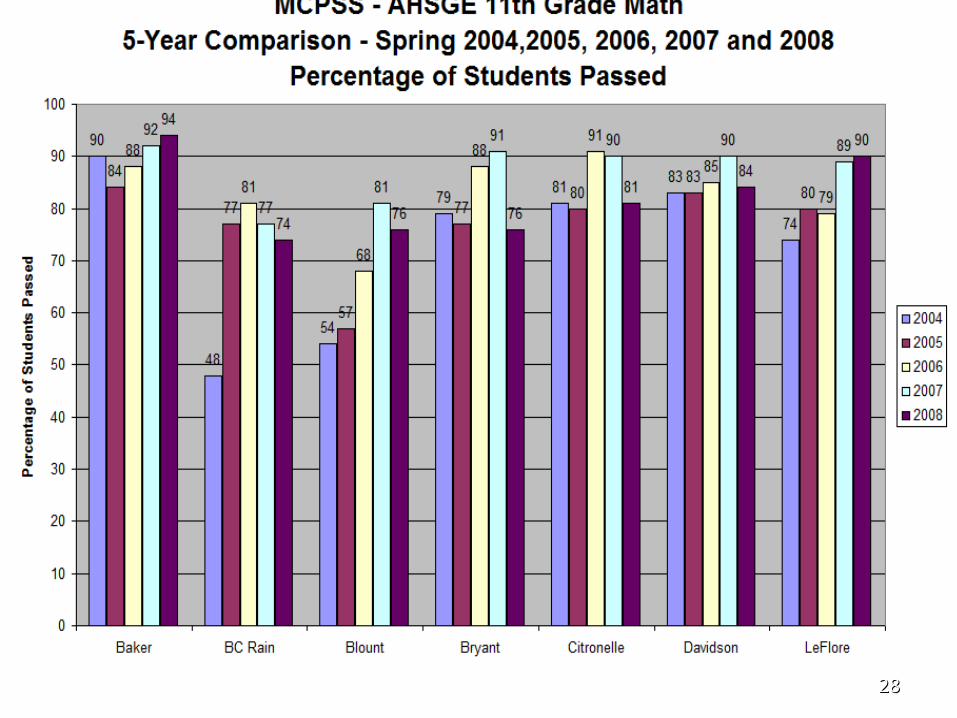
2828

2929

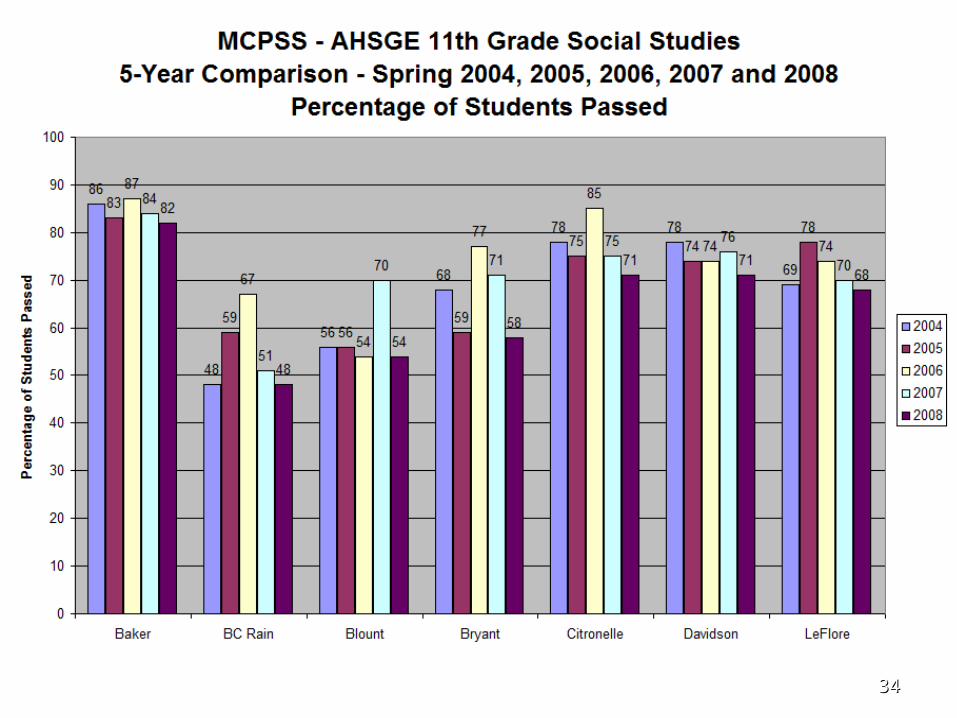
3030
MCPSS - AHSGE 11th Grade Language5-Year Comparison - Spring 2004,2005, 2006, 2007 and 2008
Percentage of Students Passed
90
62
55
75
8084
8690
64
59
64
73
8683
90
78
64
87
8184
8990
7876
8581
8582
88
7268 67
75 7477
0
10
20
30
40
50
60
70
80
90
100
Baker BC Rain Blount Bryant Citronelle Davidson LeFlore
Per
cen
tag
e o
f S
tud
ents
Pas
sed
2004
2005
2006
2007
2008

3131

3232

3333
3434

3535
3636

3737
ARMTARMT Alabama Reading and Mathematics Alabama Reading and Mathematics
TestTest
Reports Include:Reports Include:
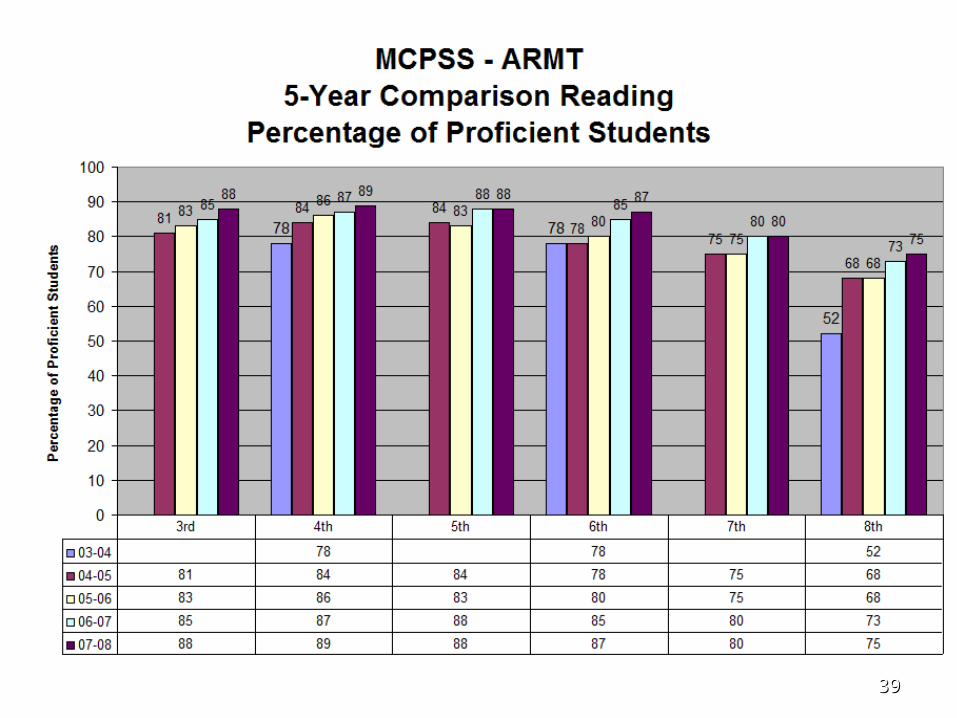
5-Year System Level Percentage of 5-Year System Level Percentage of
Proficient Students ComparisonProficient Students Comparison

3838
2004 2005 2006 2007 2008 2009 2010 2011 2012 2013 2014Grade 3 73 73 77 77 81 85 88 92 96 100Grade 4 68 68 73 73 77 77 82 86 91 95 100Grade 5 73 73 77 77 81 85 88 92 96 100Grade 6 74 74 78 78 81 81 85 89 93 96 100Grade 7 63 63 68 68 74 79 84 89 95 100Grade 8 43 43 51 51 59 59 67 76 84 92 100
Grade 11 81 81 84 84 86 86 89 92 95 97 100
2004 2005 2006 2007 2008 2009 2010 2011 2012 2013 2014Grade 3 63 63 68 68 74 79 84 89 95 100Grade 4 61 61 67 67 72 72 78 83 89 94 100Grade 5 59 59 65 65 71 77 82 88 94 100Grade 6 39 39 48 48 56 56 65 74 83 91 100Grade 7 40 40 49 49 57 66 74 83 91 100Grade 8 48 48 55 55 63 70 78 85 93 100
Grade 11 68 68 73 73 77 77 82 86 91 95 100
Found in the 2005 Interpretive Guide, page 7, on the Alabama State Department website, www.alsde.edu
STATE OF ALABAMAMOBILE COUNTY PUBLIC SCHOOL SYSTEM
ANNUAL MEASURABLE OBJECTIVES
Annual Measurable Objectives
www.alsde.edu
Percentage of Proficient Students
ReadingAnnual Measurable Objectives
Percentage of Proficient Students
Mathematics
3939
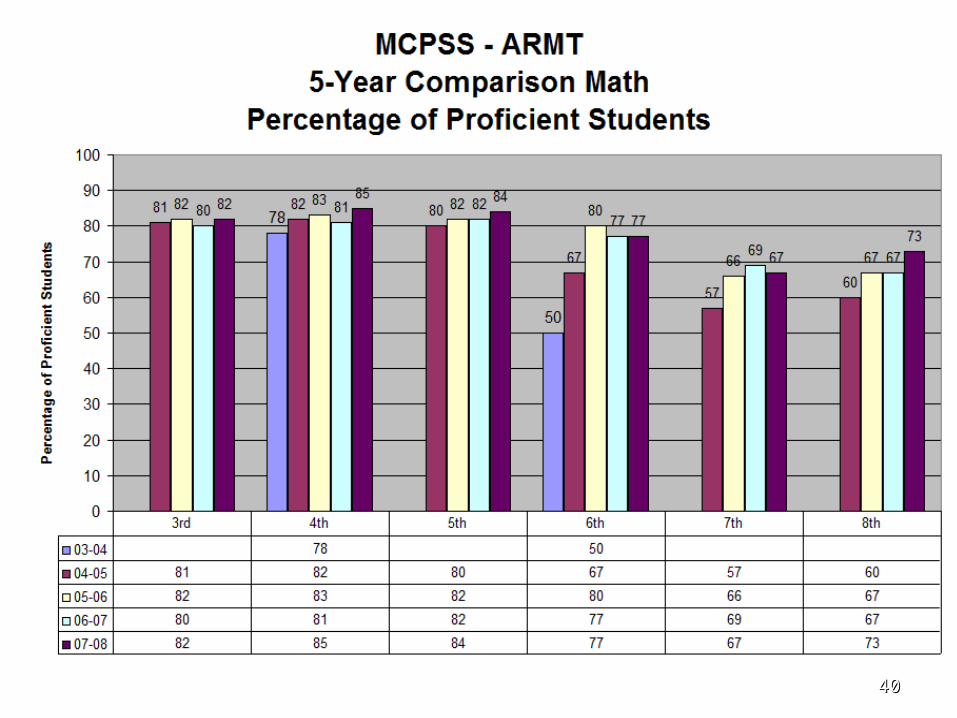
4040

4141
CRTCRT Reports Reports
Reports Include: Reports Include: - - 4-Year 44-Year 4thth Quarter Grade Level Quarter Grade Level
ComparisonsComparisons

4242
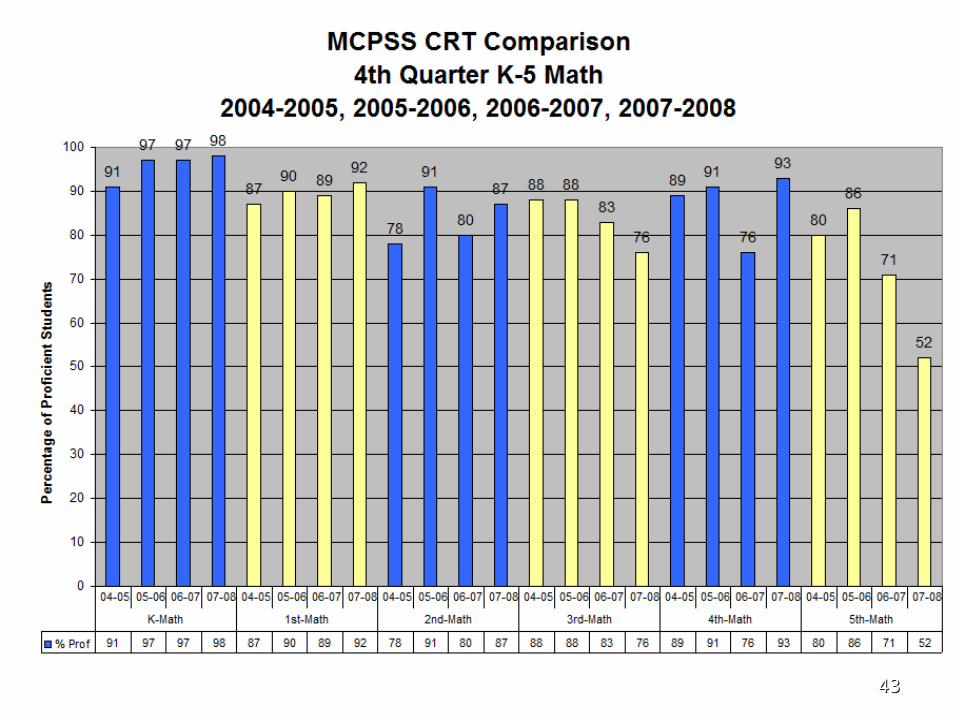
4343
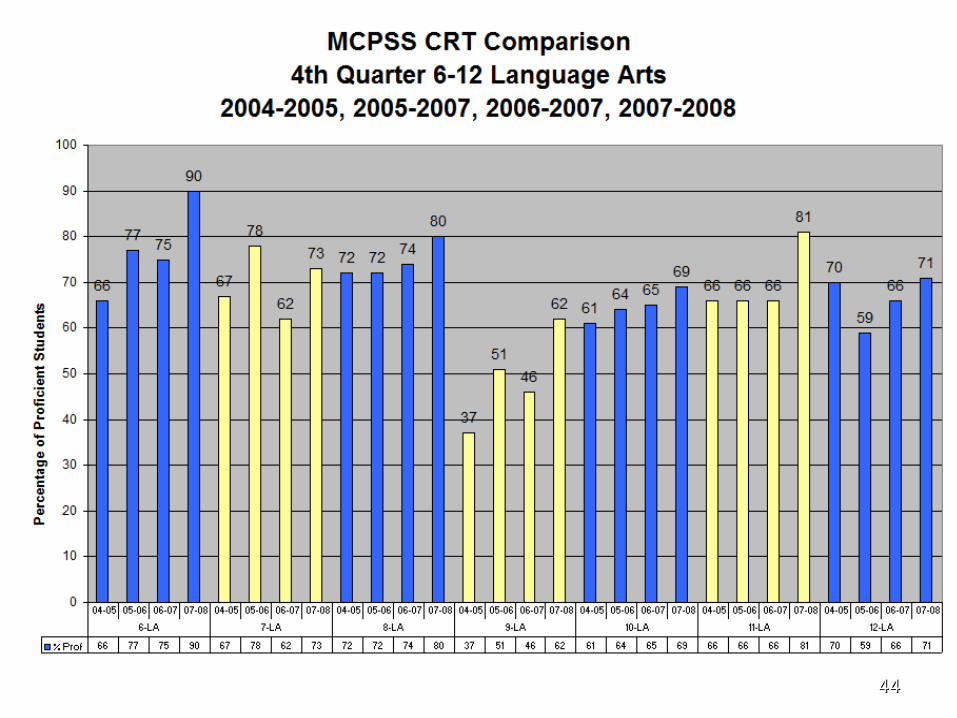
4444
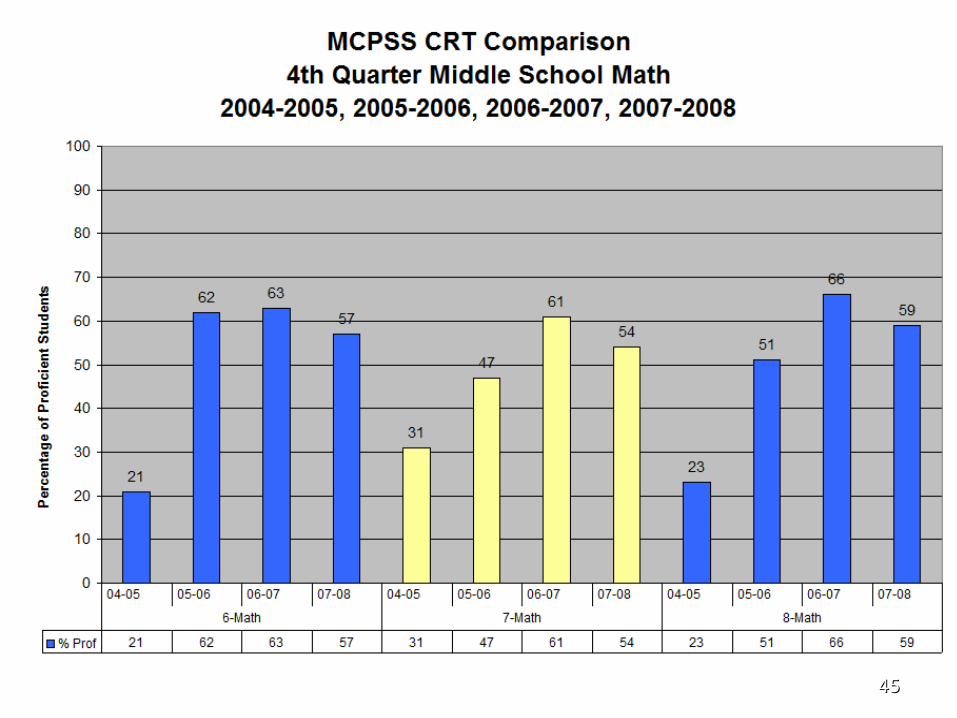
4545

4646

4747

4848

4949
DIBELSDIBELS Dynamic Indicator of Basic Early Dynamic Indicator of Basic Early
Learning SkillsLearning Skills
Report IncludesReport Includes
- 5-Year System Level End of Year - 5-Year System Level End of Year (EOY) (EOY) Measure of Percentage of Measure of Percentage of Proficient Proficient Students Students

5050
5151
SAT 10SAT 10Stanford Achievement TestStanford Achievement Test
Report Includes Report Includes - 5-Year - 5-Year System Level Percentage of System Level Percentage of Proficient StudentsProficient Students

5252

5353
5454
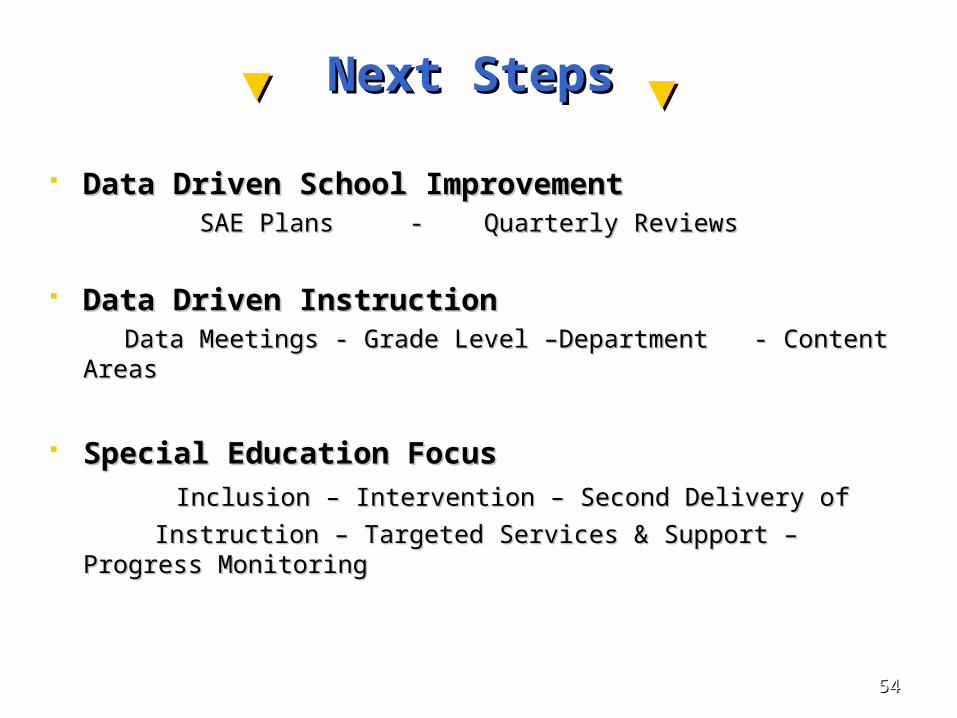
Next StepsNext Steps
Data Driven School ImprovementData Driven School Improvement SAE Plans - Quarterly ReviewsSAE Plans - Quarterly Reviews
Data Driven InstructionData Driven Instruction Data Meetings - Grade Level –Department - Content AreasData Meetings - Grade Level –Department - Content Areas
Special Education FocusSpecial Education Focus Inclusion – Intervention – Second Delivery ofInclusion – Intervention – Second Delivery of
Instruction – Targeted Services & Support – Progress Instruction – Targeted Services & Support – Progress MonitoringMonitoring
▼▼ ▼▼
5555
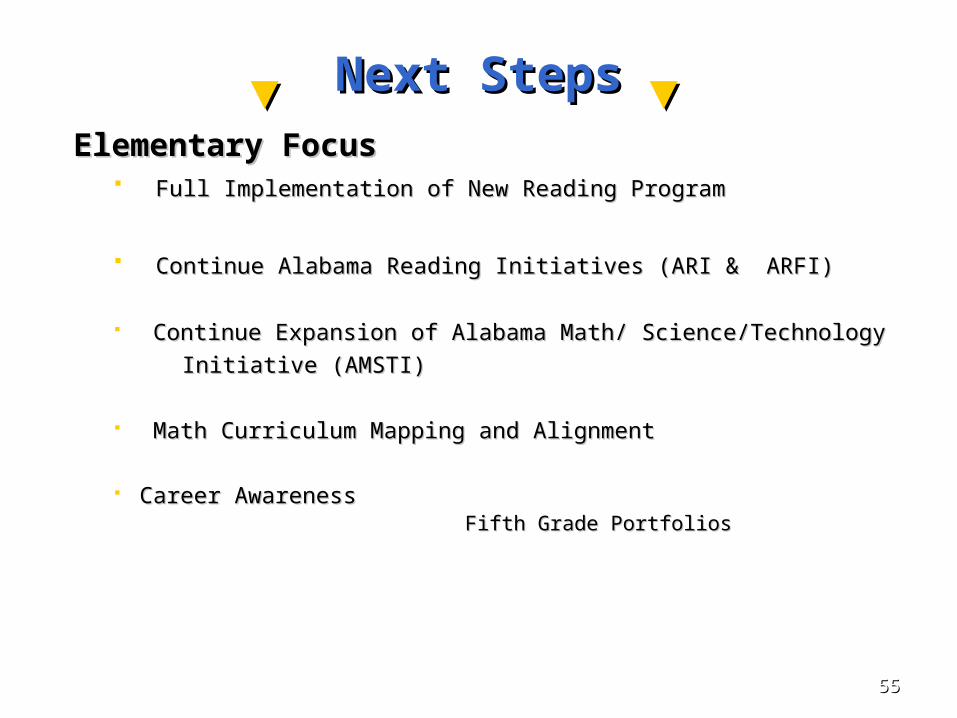
Next StepsNext StepsElementary FocusElementary Focus
Full Implementation of New Reading ProgramFull Implementation of New Reading Program
Continue Alabama Reading Initiatives (ARI & ARFI)Continue Alabama Reading Initiatives (ARI & ARFI)
Continue Expansion of Alabama Math/ Science/Technology Continue Expansion of Alabama Math/ Science/Technology
Initiative (AMSTI)Initiative (AMSTI)
Math Curriculum Mapping and AlignmentMath Curriculum Mapping and Alignment
Career Awareness Career Awareness Fifth Grade PortfoliosFifth Grade Portfolios
▼▼ ▼▼

5656
▼ ▼ Next StepsNext Steps ▼▼Middle FocusMiddle Focus
Making Middle Grades Work Making Middle Grades Work Expand 12 to 21 Middle SchoolsExpand 12 to 21 Middle Schools
Continuous Program ImprovementContinuous Program Improvement
Data Driven Planning and Decision Making Data Driven Planning and Decision Making Climate & Culture for LearningClimate & Culture for Learning
Delivery of InstructionDelivery of Instruction
Student Engagement in LearningStudent Engagement in Learning
Instructional LeadershipInstructional Leadership Professional DevelopmentProfessional Development Leadership Development & OpportunitiesLeadership Development & Opportunities Recognition of SuccessRecognition of Success

5757
Next StepsNext Steps
Middle FocusMiddle Focus
Literacy TrainingLiteracy Training Vocabulary Vocabulary
Summarization Summarization Cooperative LearningCooperative Learning
Career ExplorationCareer Exploration Career PortfolioCareer Portfolio Career/College ReadinessCareer/College Readiness ACT Readiness/Career Planning – Explore ACT AssessmentACT Readiness/Career Planning – Explore ACT Assessment
Counseling ProgramCounseling Program
▼▼ ▼▼

5858
▼ ▼ Next StepsNext Steps ▼▼ High School FocusHigh School Focus Graduation RateGraduation Rate Sp. Ed. Proficiency – Reading & MathSp. Ed. Proficiency – Reading & Math Reading & Math ProficiencyReading & Math Proficiency Math & Reading Strategies TeachersMath & Reading Strategies Teachers SAE Implementation & Data DrivenSAE Implementation & Data Driven Programs and InstructionPrograms and Instruction Targeted Academic Affairs Services & SupportTargeted Academic Affairs Services & Support Feeder Pattern Professional Learning CommunitiesFeeder Pattern Professional Learning Communities Ninth Grade AcademiesNinth Grade Academies Small Learning Communities – Theme ProgramsSmall Learning Communities – Theme Programs Distance and On-Line LearningDistance and On-Line Learning Staffing ReviewsStaffing Reviews

5959
NextNext Steps StepsHigh School FocusHigh School Focus Professional Development Professional Development
Delivery of Instruction - Student Engagement in Learning - Delivery of Instruction - Student Engagement in Learning -
InterventionIntervention Data Driven Instruction – Data MeetingsData Driven Instruction – Data Meetings Workforce Development – Career Technical Education Workforce Development – Career Technical Education Career/College ReadinessCareer/College Readiness
ACT Readiness– Career Planning Plan/ACT/SAT Assessments ACT Readiness– Career Planning Plan/ACT/SAT Assessments
Counseling ProgramCounseling Program Small Learning CommunitiesSmall Learning Communities Review of Block Scheduling and Early ReleaseReview of Block Scheduling and Early Release Alabama First Choice High School PlanAlabama First Choice High School Plan
▼▼ ▼▼

6060
Mobile County Public Mobile County Public SchoolsSchools
Balanced Score CardBalanced Score Card

6161
6262
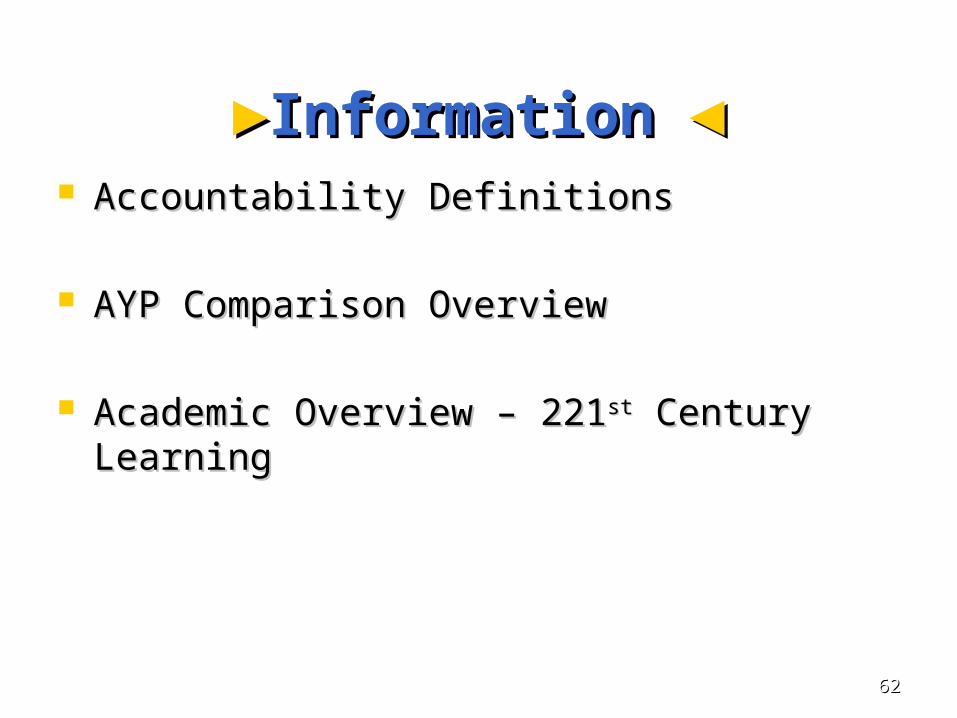
►►InformationInformation ◄◄ Accountability DefinitionsAccountability Definitions
AYP Comparison OverviewAYP Comparison Overview
Academic Overview – 221Academic Overview – 221stst Century Century LearningLearning

6363
▼▼Accountability Definitions Accountability Definitions ▼▼
AYP – Annual Year ProgressAYP – Annual Year Progress Reported in 4 Categories Reported in 4 Categories Reading – Mathematics – Additional Academic Indicator – OverallReading – Mathematics – Additional Academic Indicator – Overall
““N” Count – A subgroup must have an “N” Count of N” Count – A subgroup must have an “N” Count of 40 or more students for AYP measurement40 or more students for AYP measurement
School Improvement – Schools not making AYP for two School Improvement – Schools not making AYP for two years enter School Improvement Status –years enter School Improvement Status – To exit School Improvement Status schoolsTo exit School Improvement Status schools must make AYP for two yearsmust make AYP for two years
Annual Measurable Objectives – Term used to describe the establishedAnnual Measurable Objectives – Term used to describe the established yearly target for the percentage of studentsyearly target for the percentage of students scoring proficient scoring proficient
Participation Rate – Number of students Participation Rate – Number of students taking the testtaking the test – 95% required on all tests – 95% required on all tests
Additional Academic Indicators – Additional Academic Indicators – Daily Attendance RateDaily Attendance Rate – Grades 3-8 – 95% Required – Grades 3-8 – 95% Required Graduation Rate – Grades 9-12 – 90% Graduation Rate – Grades 9-12 – 90%

6464
▼▼Accountability DefinitionsAccountability Definitions▼▼Five Ways to Make AYPFive Ways to Make AYP
1. 1. Meet ProficiencyMeet Proficiency
If proficiency isn’t met the following calculations take place.If proficiency isn’t met the following calculations take place.
2. 2. Confidence Interval (CI)Confidence Interval (CI) – calculations used to determine if the – calculations used to determine if the
proficiency index is statistically different from the AMO goalproficiency index is statistically different from the AMO goal
3. 3. Uniform Averaging (UAUniform Averaging (UA) – calculated using the most recent three ) – calculated using the most recent three
years of datayears of data
4. 4. Safe Harbor (SH)Safe Harbor (SH) – schools make SH if made 95% participation goal, – schools make SH if made 95% participation goal,
reduced non proficient from previous year by 10%, met or improvedreduced non proficient from previous year by 10%, met or improved
additional academic indicatoradditional academic indicator
5. 5. 2%2% - interim 2% flexibility option that is calculated for Special Education - interim 2% flexibility option that is calculated for Special Education


![[Webinar] driving accountability in mobile advertising](https://static.fdocuments.net/doc/165x107/5a64a6997f8b9a88568b4faf/webinar-driving-accountability-in-mobile-advertising.jpg)

