1 Metrics and Money: The Process and Politics of Accountability Stephen Daigle, Ph.D, California...
37
1 Metrics and Money: The Process and Politics of Accountability Stephen Daigle, Ph.D, California State University Michael Large, Ph.D, Social and Behavioral Research Institute, CSU San Marcos Patricia Cuocco, California State University Copyright Patricia M. Cuocco, Stephen L. Daigle, Michael Large and Allen Risley, 2003
-
Upload
gordon-riley -
Category
Documents
-
view
214 -
download
0
Transcript of 1 Metrics and Money: The Process and Politics of Accountability Stephen Daigle, Ph.D, California...

1
Metrics and Money:The Process and Politics of
Accountability
Stephen Daigle, Ph.D, California State UniversityMichael Large, Ph.D, Social and Behavioral Research Institute, CSU San MarcosPatricia Cuocco, California State University
Copyright Patricia M. Cuocco, Stephen L. Daigle, Michael Large and Allen Risley, 2003

2
Overview
• ITS and the Measures of Success (MOS)
• MOS Research Agenda
• Findings
• Questions (and, we hope, answers)

3
Integrated Technology Strategy
• Early 1990s – Presidential Interest in Using Technology As a Strategic Tool Driven By:– Immense Growth in Technology, – Antiquated Legacy Systems, – Increasing Demand for Access– Fiscal Constraints
• Mid 1990s – Develop Integrated Technology Strategy Framework– Iterative Process, Constituent Input and Approval

4
ITS – The Process
• 1996 Accepted by Board of Trustees
• Living Framework – Not Written Plan
• 2003 – Technology Decisions Still Governed by ITS

5
What Is ITS
• Outcome Driven– -Excellence in Learning and Teaching– Quality of the Student Experience– Administrative Quality and Productivity– Personal Productivity

6
ITS – the Icon

7
ITS – How It Fits
• Personal Productivity - Attained Through Infrastructure Initiative – Minimum Baseline at All CSU Campuses
• The Infrastructure Is Critical If ITS Benefits Are to Extend to All Students, Faculty and Staff
• The Infrastructure Requires Money ($250M) = PROBLEM

8
Getting the Infrastructure
• Legislature Challenged CSU to Be Creative
• CSU Was Too Creative
• Public/private Partnership Made Legislature Uncomfortable
• Californians Passed a Bond
• Presidents Decided Infrastructure Had Priority Over New Buildings

9
Getting to “Yes” *
• Bond Expenditures Require Legislative Approval• Legislature Wanted to Tie Investment in
Infrastructure to “Learning Outcomes”• Not What ITS Is About• Infrastructure Enables ITS Initiatives Which, in
Turn, Enable Outcomes
Apologies to Fisher, Ury and Patton

10
Negotiating Accountability
• Worked With Legislature – Agreed on What Could Be Measured
• Developed 10 Year Process for Measures of Success
• Framework
• Baseline
• Changes to the Baseline

11
Types Of Data Collected
• System
•
• Campus
•
• Individual (Student, Faculty, Staff)
•
• External

12
Scope Of Data Collection
• 23 Campuses; 1,000 Miles
• 400,000 Students
• 35,000 Faculty And Staff
• 10 Year Commitment
• Institutional Comparisons Across Time
• S, F, S Comparisons Across Time
13
Technology User Survey Samples
• Students: Campus, Class Level, Ethnicity; 23 X 5 X 9 Cells
• Faculty: Campus, Rank, Discipline; 23 X 4 X 8 Cells
• Staff: Campus, Job Classification; 23 X 7 Cells

14
CATI LOGISTICS(COMPUTER ASSISTED TELEPHONE INTERVIEWING)
• No Self-select As With Mail
• About 100 Questions; 20-30 Minutes
• Importance Of Skip Facility
• Instant Database Creation

15
CATI (Continued)
• Standardized Context Provided (E.G., High Speed Network)
• Trained Interview Staff, Monitoring, Evaluation
• Refusals Less Than 2 Percent; Still Over Sample
• $75 To $100k Per Survey, But Systemwide

16
User Outcomes
Hardware Software Network Support Training
ACCESS
USE
SATISFACTION

17
Examples of Metrics
• Institutional– Library Cost Avoidance– Smart Classrooms– Data Center Savings– Training and Support Spending
• Individual– Computer Ownership– Network Use– Help Desk Satisfaction– Use of Administrative Systems
18
Findings and Data

19
Findings
Hardware Software Network Support Training
Access
Use
Satisfaction
20
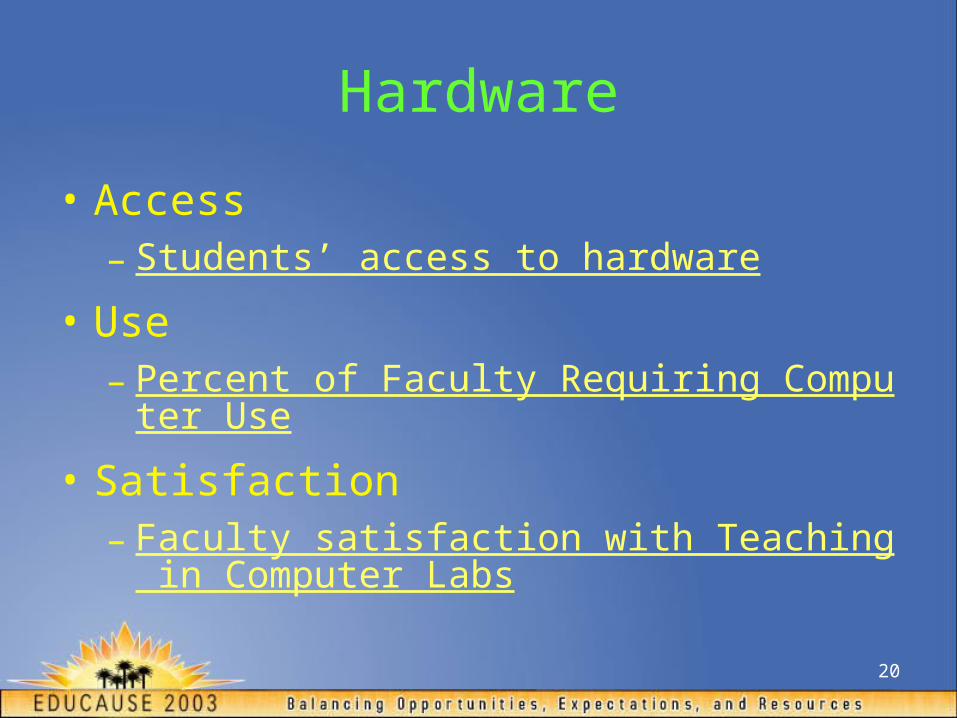
Hardware
• Access– Students’ access to hardware
• Use– Percent of Faculty Requiring Computer Use
• Satisfaction– Faculty satisfaction with Teaching in Computer La
bs

21
Software
• Access– Faculty access to software
• Use– Percent of Students Using Components of Their St
udent Information System
• Satisfaction– Staff Satisfaction with Software
22
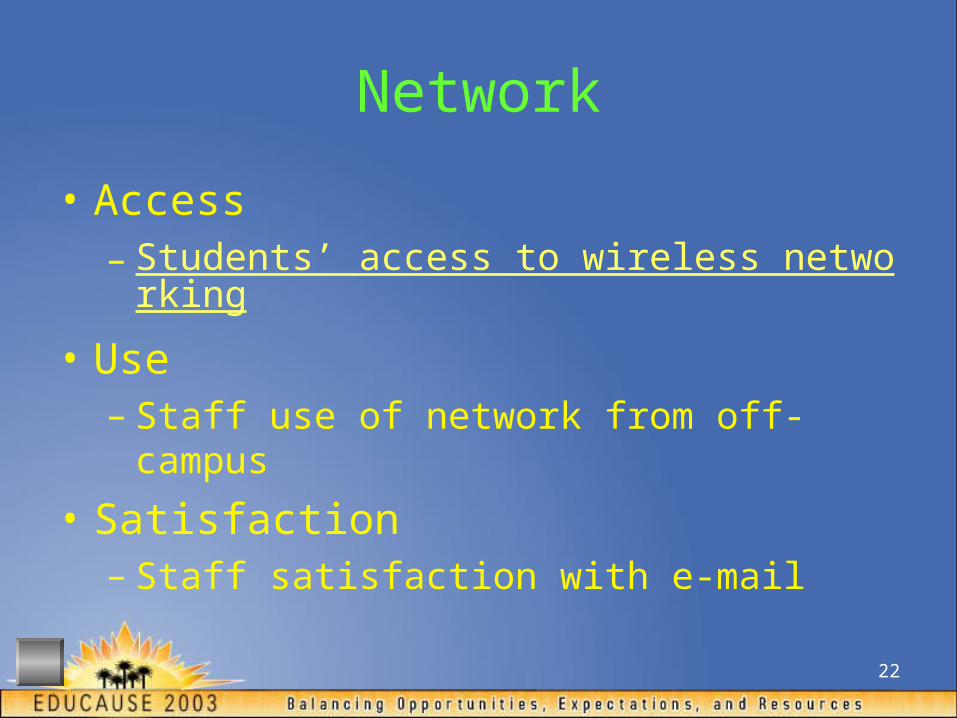
Network
• Access– Students’ access to wireless networking
• Use– Staff use of network from off-campus
• Satisfaction– Staff satisfaction with e-mail

23
Student Access to a University-provided Computer
Access to a University-Provided Workstation
YesNo
Per
cent
100
80
60
40
20
0
Administration
2001
2003
94
6
94
6

24
Percent of Faculty Requiring Students to Use a Computer
Required Students to Use Computer
YesNo
Per
cent
100
80
60
40
20
0
ADMINISTRATION
2000 AY
2002 AY
85
15
64
36

25
Faculty Satisfaction with Giving Instruction in a Computer Lab
SURVEY ADMINISTRATION
2002 AY2000 AY
Mea
n S
atis
fact
ion
10.0
9.0
8.0
7.0
6.0
5.0
4.0
3.0
2.0
1.0
0.0
Technical Support
Pedagogical
Effectiveness
7.87.4
6.76.4

26
Faculty Access to University-provided Software Needed
Access to University-Provided Software
YesNo
Per
cent
100
80
60
40
20
0
ADMINISTRATION
2000 AY
2002 AY
94
6
96

27
Percent of Students Using Their Campus Student Information System
Administration
20032001
Per
cent
Usi
ng S
tude
nt I
nfo
Sys
tem
100
80
60
40
20
0
Information about
Registration
Information about
Grades
Information about
Financial Aid
Information about
Billing
Degree Progress
Information
37
22
40
20
41
29
88
71
86
67

28
Staff Satisfaction with University-provided Software Available
Satisfaction with Software
Completely Satisfied
987654321Not at All Satisfied
Per
cent
40
30
20
10
0
29
21
25
12
55

29
Percent of Students with Laptops and Wireless Capability
Wireless NetworkingOwns a Lap-Top
Perc
ent
100
90
80
70
60
50
40
30
20
10
0
17
36

30
Staff Use of University Network from Off-campus
Accessed Network from Off-Campus
YesNo
Per
cent
70
60
50
40
30
20
10
0
Year of Study
2000
2002
60
40
5050
31
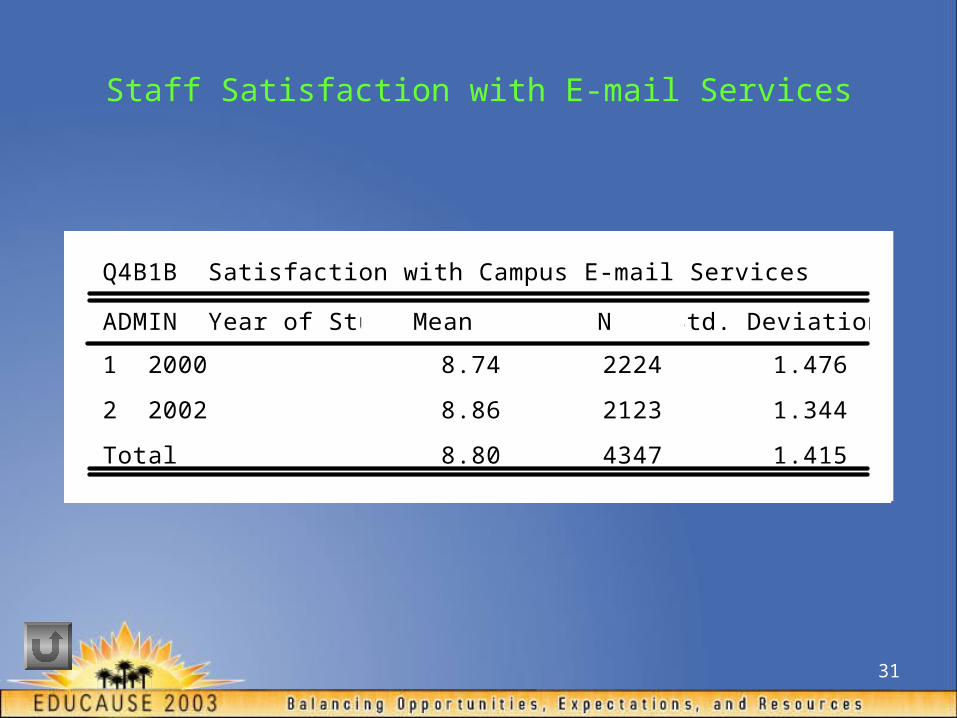
Staff Satisfaction with E-mail Services
Q4B1B Satisfaction with Campus E-mail Services
8.74 2224 1.476
8.86 2123 1.344
8.80 4347 1.415
ADMIN Year of Study
1 2000
2 2002
Total
Mean N Std. Deviation

32
Importance of Providing Electronic Access to Course Instruction
Any Time and Place
Academic Rank
Assistant Professor
Associate Professor
Professor
Mea
n Im
port
ance
10.0
9.0
8.0
7.0
6.0
5.0
4.0
3.0
2.0
1.00.0
5.15.05.0

33
Comparison between Faculty and Students in Perceived Importance of Providing “Any-time, Any-place” Instruction
Q1A3 Importance of Providing Electronic Access to Course Instructionfor Students at Any Time and Place
5.07 3167 3.040
8.11 3086 2.156
Group
Faculty - 2002
Students - 2003
Mean N Std. Deviation

34
Uses of the Data
• Accountability
• Description of the Population of Interest
• Change Over Time
• Subgroup Comparisons
• Cross-group Comparisons

35
Conclusion
• Expensive – but You Get What You Pay For: Valid
• Reliable• High Level of Confidence• Negotiate – Don’t Be Passive – Be Proactive• Accountability Provides Cover• Infrastructure Is a Utility and a Prerequisite• Strategic Planning Is Dynamic – Change/add

36
Look For Yourself
http://its.calstate.edu/documents/Data_Collection/I_Reports_MOS/Measure_of_Success.shtml

37
Copies of the Presentation
http://its.calstate.edu