1 Medina Healthcare System: Centralized Scheduling Center.
34
1 Medina Healthcare System: Centralized Scheduling Center
-
Upload
abraham-hall -
Category
Documents
-
view
215 -
download
0
Transcript of 1 Medina Healthcare System: Centralized Scheduling Center.
1
Medina Healthcare System: Centralized Scheduling Center
2
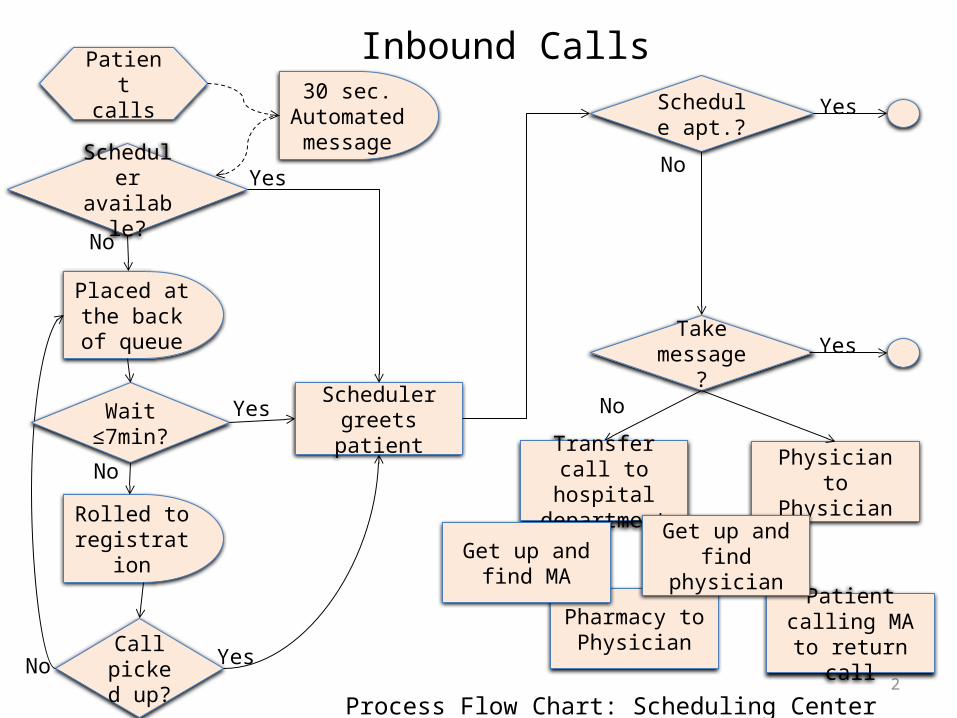
Patient calls 30 sec.
Automated message
Process Flow Chart: Scheduling Center Inbound Calls
Scheduler greets patient
Schedule apt.?
Take message?
Scheduler available?
Placed at the back of queue
Rolled to registration
Call picked
up?No Yes
Wait ≤7min?
No
Yes
No
Yes
Yes
No
Yes
No
Transfer call to hospital
department
Physician to Physician
Pharmacy to Physician
Patient calling MA to return call
Get up and find physician
Get up and find MA
Inbound Calls
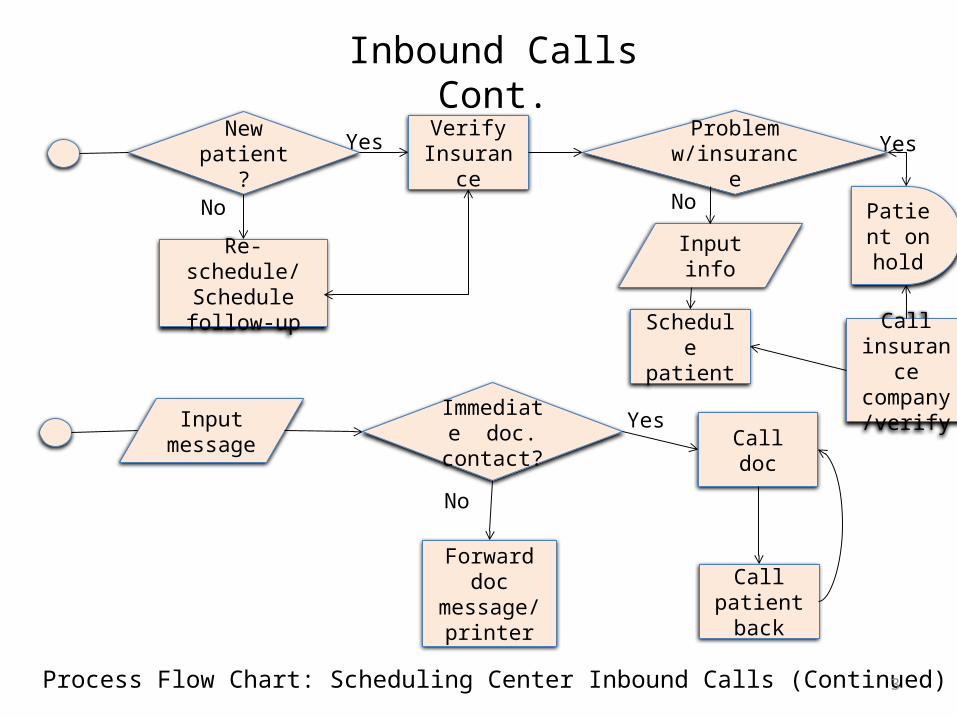
3Process Flow Chart: Scheduling Center Inbound Calls (Continued)
New patient?
Verify Insurance
Schedule patient
Input message
Immediate doc.
contact? Call doc
Forward doc message/
printer
Re-schedule/ Schedule follow-
up
Input info
Call patient back
Yes
Yes
No
No
Problem w/insurance
Call insurance
company/verify
Patient on hold
Yes
No
Inbound Calls Cont.
4
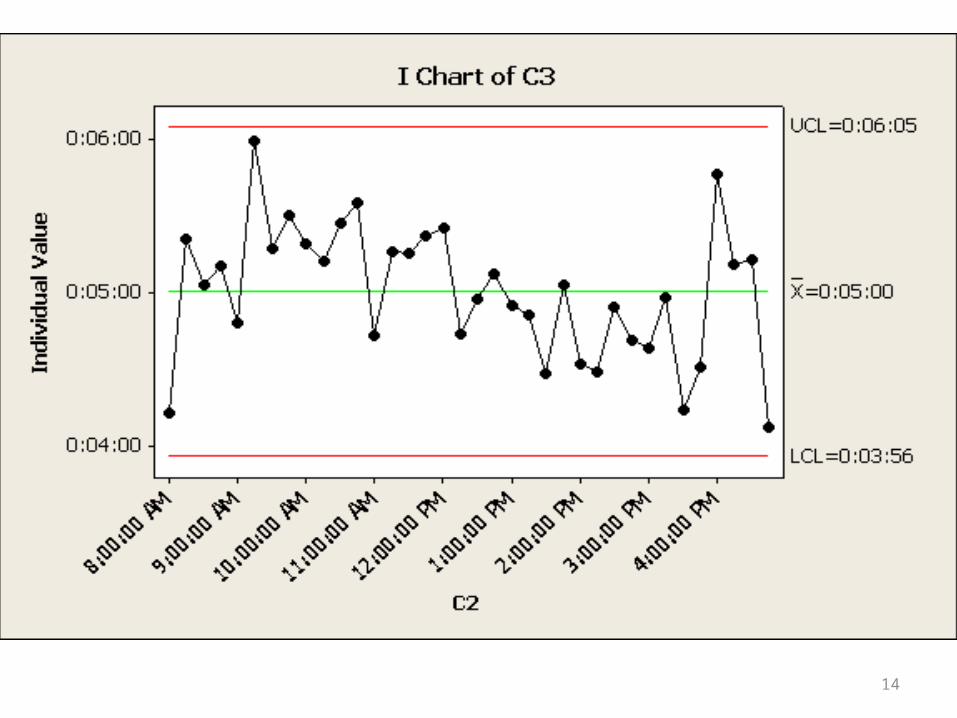
Data Analysis
June 1, 2012 – May 30, 2013
5
• Average queue time per 15 minute time interval
• Average service time per 15 minute time interval• Reduces variation; data in the tails
• Does not include the time the patient spends on “make busy”
• Calls interflowed that return to the queue are then tracked as if they are new calls
Data Limitations

7
8

9

10
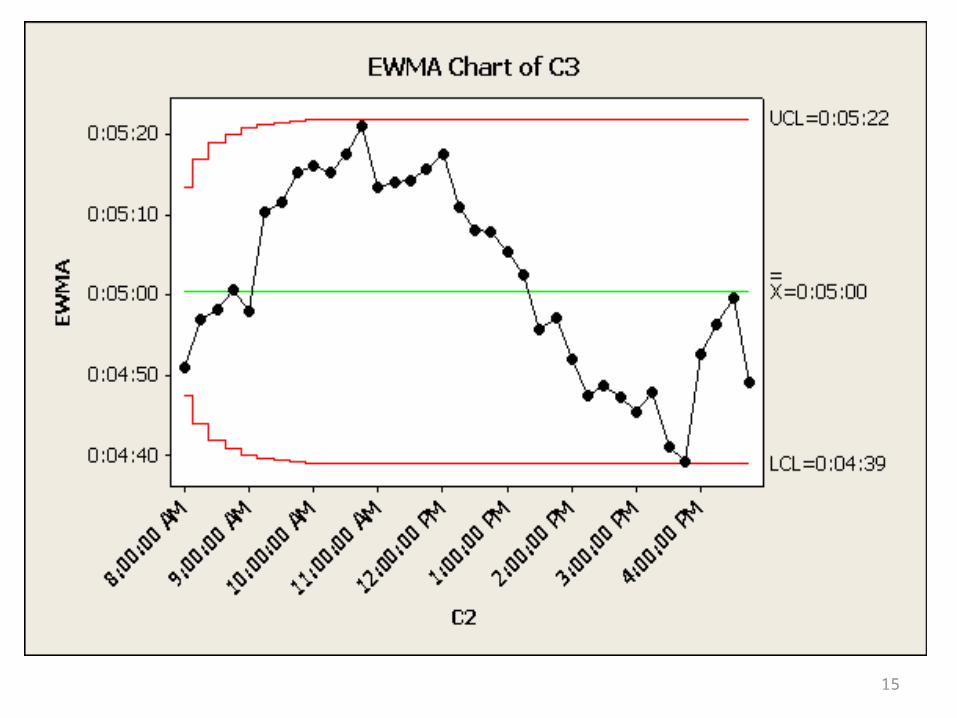
Data Analysis
June 2013

11
June - Record of changes made
04/2013: Added phone tree. Issues: Incorrect routing, Took too long to get through the
phone tree. Interflow noted as a problem
06/01/2013: Took out phone tree, routing to physician line removed Issues: Interflow a continued problem
12
13
14
15

16
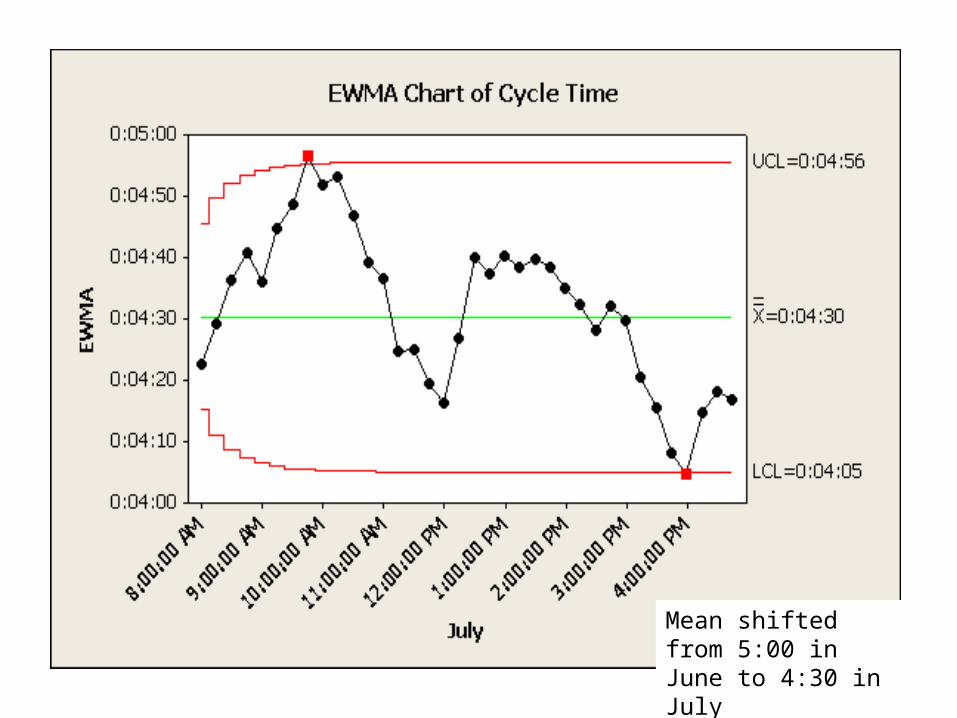
Data Analysis
July 1 – July 23rd

17
July - Record of changes made06/29/2013: Added physician phone number to beginning of automated
message.
7/01/2013: Removed interflow completely. Began using referral center staff during peak times (Mornings)
7/02/2013:Radiology dept. staff began giving patients in need of follow-up appointments the radiology scheduling line while reminding them not to call the clinic scheduling line for these appointments
Clinic scheduling center staff began sending emails to employers requesting information needed to process workman’s comp claims
Started using Recondo. Avoiding the rework of pasting information into templates previously entered – Faster insurance verification

18

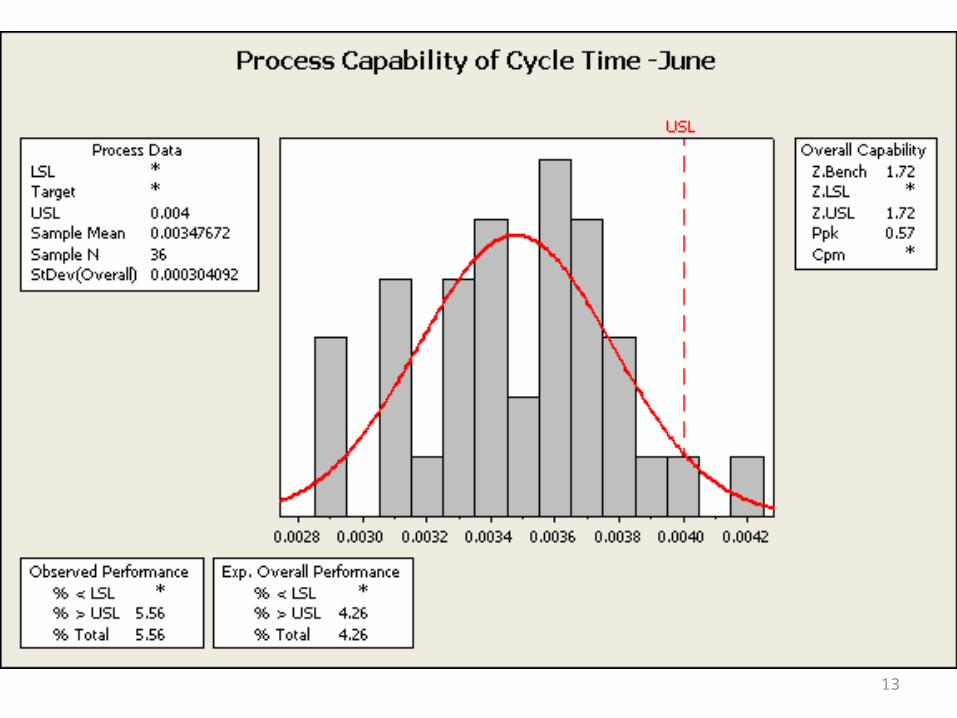
0.00400.00360.00320.00280.0024
USL
LSL *Target *USL 0.004Sample Mean 0.00312725Sample N 36StDev(Overall) 0.000354939
Process DataZ.Bench 2.46Z.LSL *Z.USL 2.46Ppk 0.82Cpm *
Overall Capability
% < LSL *% > USL 0.00% Total 0.00
Observed Performance% < LSL *% > USL 0.70% Total 0.70
Exp. Overall Performance
Process Capability of Converted

20
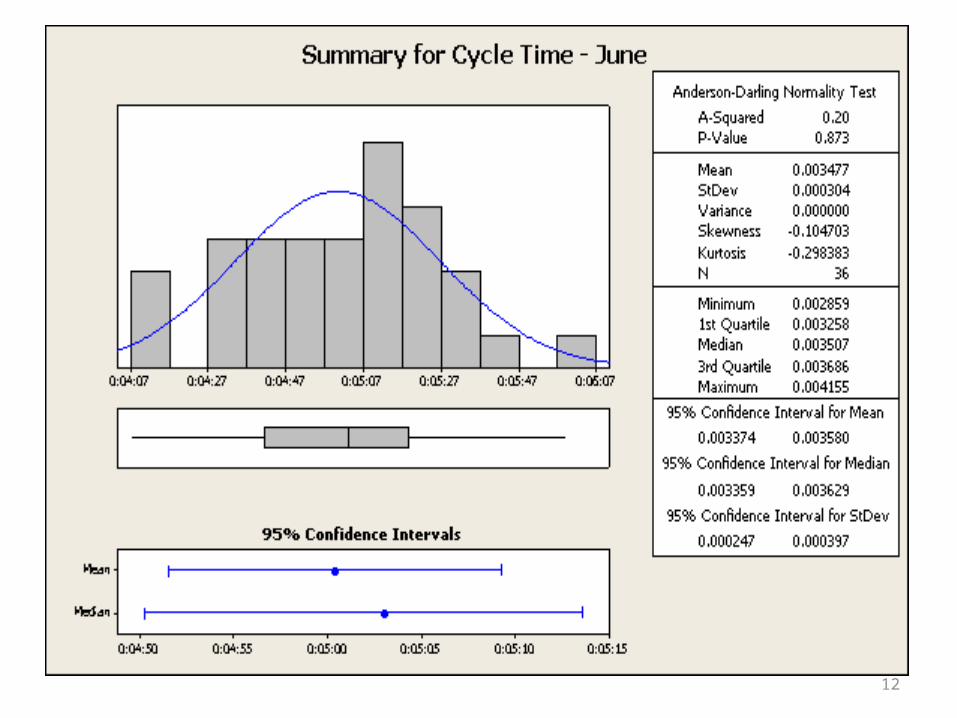
Mean shifted from 5:00 in June to 4:30 in July
21
Mean shifted from 5:00 in June to 4:30 in July

22
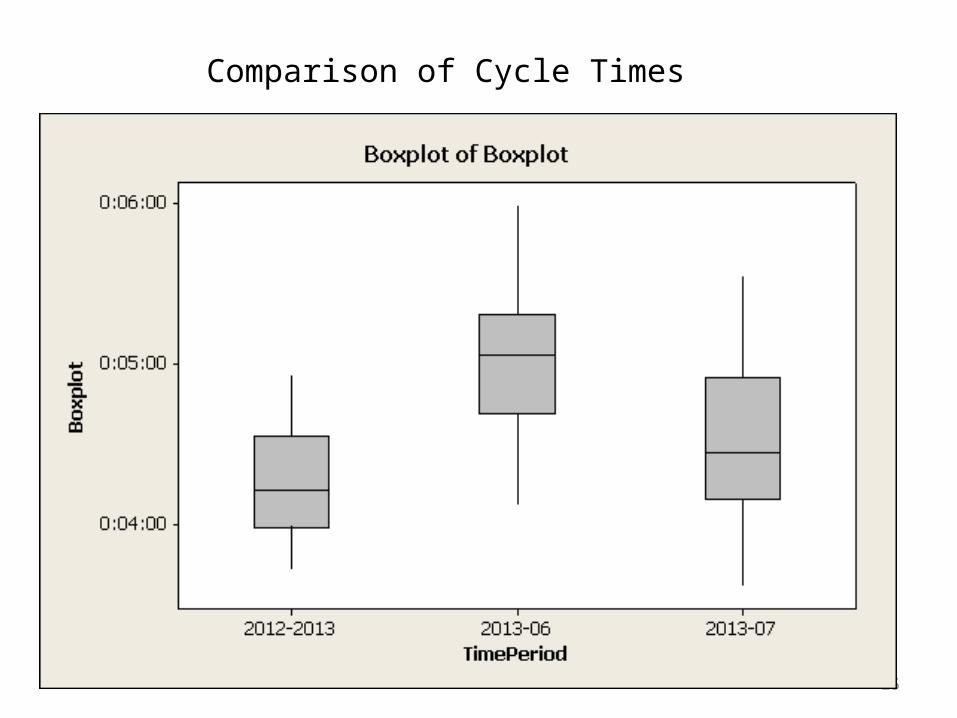
Hypothesis
• Ho: June and July cycle times were essentially the same
• Ha: June and July cycle times were significantly different

23
Hypothesis Testing
Two-sample T test for Cycle Time vs Cycle Time1
N Mean StDev SE MeanCycle Time 36 0.003477 0.000304 0.000051Cycle Time1 36 0.003127 0.000355 0.000059
Difference = mu (Cycle Time) - mu (Cycle Time1)Estimate for difference: 0.00034995% CI for difference: (0.000194, 0.000505)T-Test of difference = 0 (vs not =): T-Value = 4.49 P-Value = 0.000
DF = 68

24
25
Comparison of Cycle Times

26
Other important numbers…
Average Delay to Abandon
2012-2013: 1:45June 2013: 2:03July 1-23rd 2013: 2:01
Calls abandoned
2012-2013: 21.47%June 2013: 23.73%July 1-23rd 2013: 17.59%

27
2nd Hypothesis:
Ho: Regardless of the call type, data is essentially the same
Ha: Call cycle time is significantly different between call types

28
• Manually tracked
• Not all calls fit cleanly into a category
• Time includes service time but not time spent waiting
• Time does however include time spent on “make busy”
• Data sampled from 3 different time periods on 6 different days
• No interflow point
Data Limitations
29
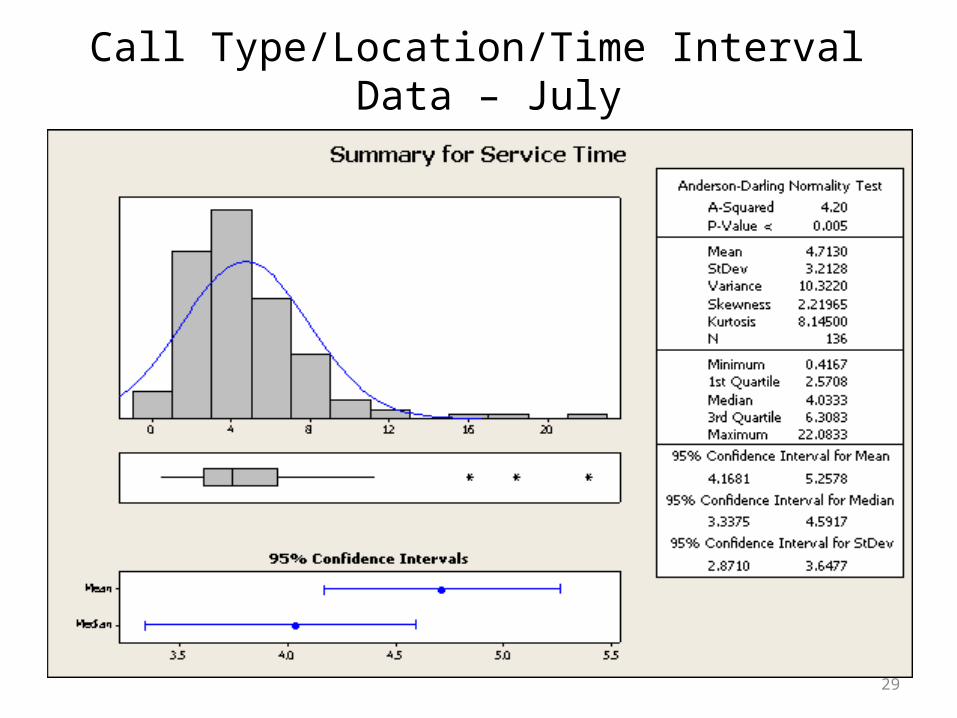
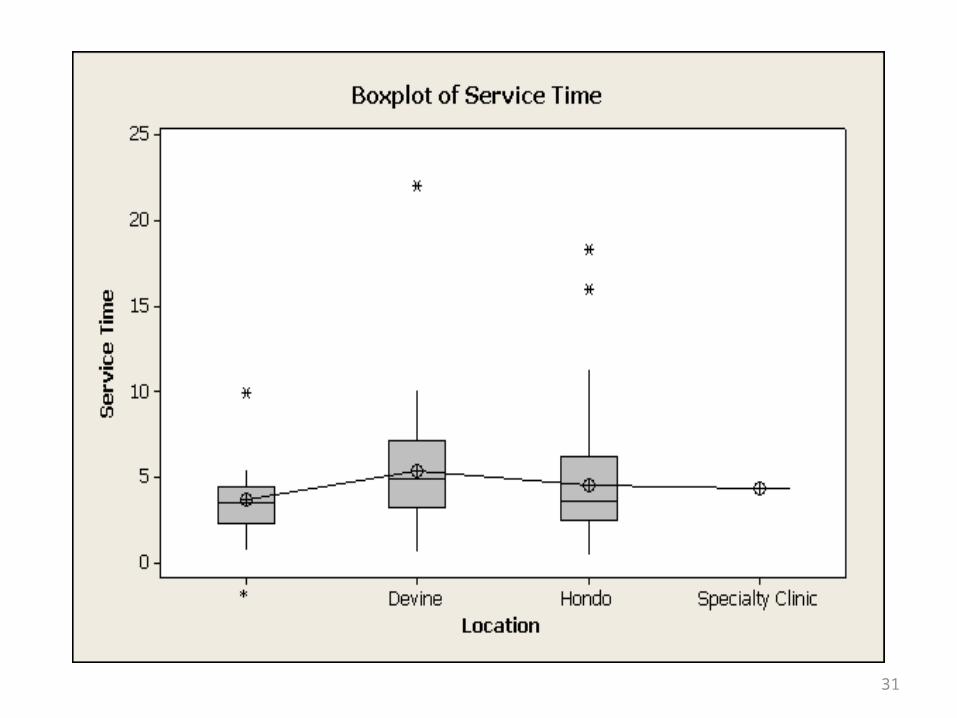
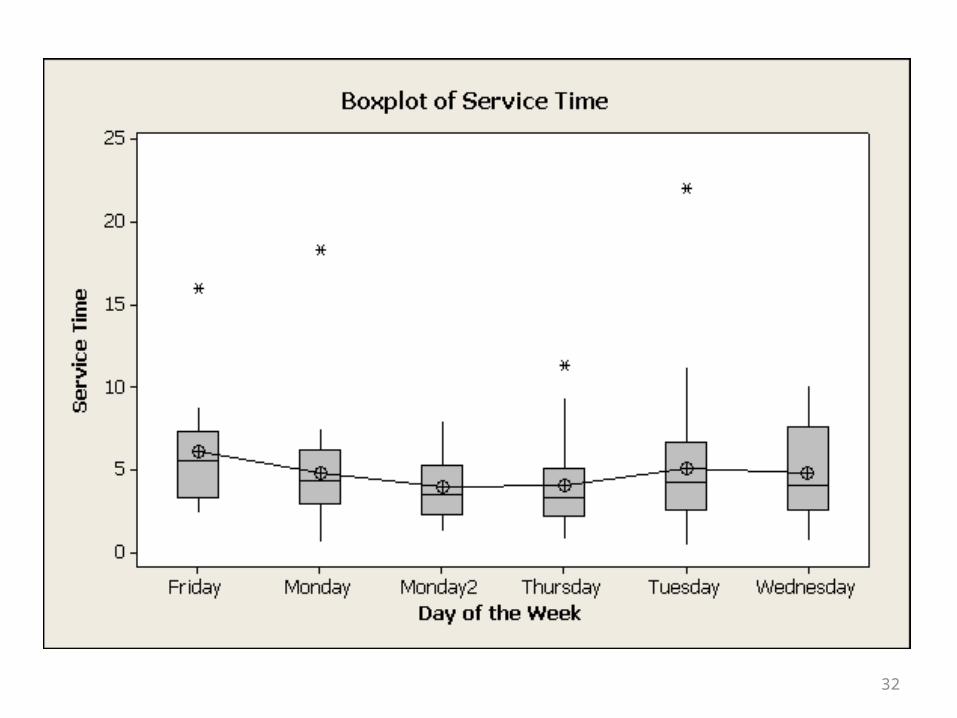
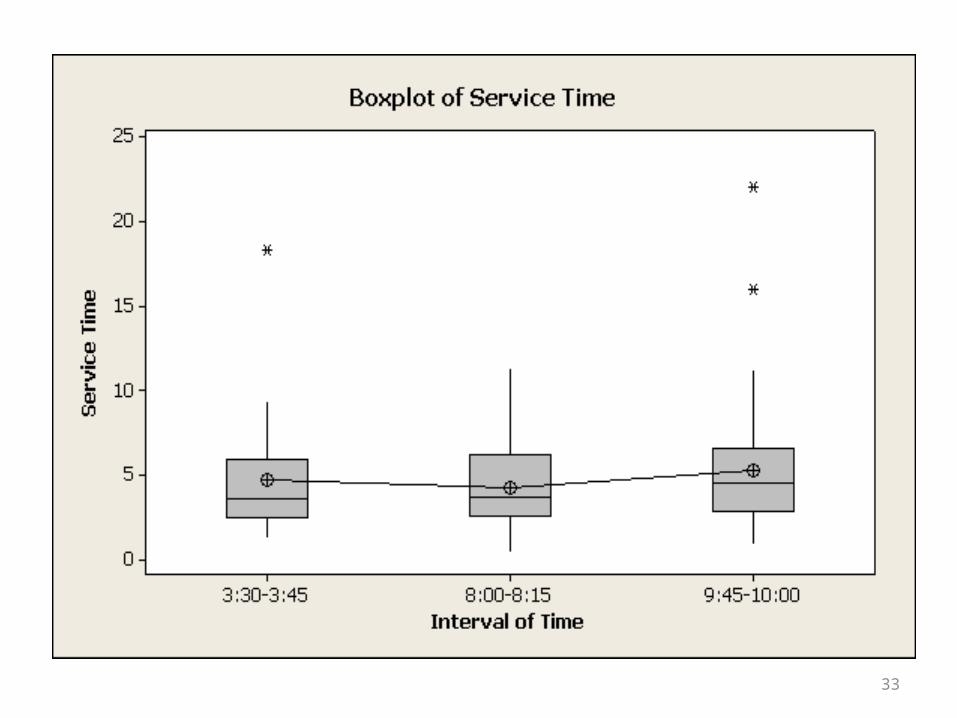
Call Type/Location/Time Interval Data – July

Count 254 25 15 14 8 7 6 5Percent 1.539.7 18.4 11.0 10.3 5.9 5.1 4.4 3.7Cum % 100.039.7 58.1 69.1 79.4 85.3 90.4 94.9 98.5
Call Type
140120100806040200
100
80
60
40
20
0
Count
Perc
ent
Pareto Chart of Call Type
31
32
33

34
Take AwaysIt is vital that systems are in place to accurately report on performance of the call
center. Times need to include “make busy” and at least include a range or standard deviation for the wait time and service time per time interval
Seemingly minor changes in the processing of calls makes a significant impact– Interflow point removal– Recondo – eliminate rework– Workman’s comp calls
Adjusting staffing for peak times will reduce time spent waiting– Referral coordinators used during peak times
Potential improvements: Designate a staff member to focus only on insurance verification during peak times
Redesign how messages for physicians are processed18% of calls in July were from patients who were calling to leave a
message for their physician
35
The Path Forward
1. Develop reports that track call center data. Enabling us to analyze performance and continually make improvements
2. Create weekly and monthly goals for scheduling center staff1. Improving patients satisfaction through decreased wait times and a
more consistent scheduling process
3. Ensure changes and improvements are sustained through monitoring the process using statistical process control charts and re-evaluating every quarter