1 Measurement techniques for steady shear viscosity of ...
32
1 Measurement techniques for steady shear viscosity of Mozzarella-type 1 cheeses at high shear rates and high temperature 2 3 Prateek Sharma 1,5* , Tzvetelin T. Dessev 1 , Peter A. Munro 1 , Peter G. Wiles 2 , Graeme 4 Gillies 2 , Matt Golding 3 , Bryony James 4 , Patrick Janssen 3 5 1 Riddet Institute, Massey University, Private Bag 11222, Palmerston North 4442, New Zealand 6 2 Fonterra Research and Development Centre, Private Bag 11029, Dairy Farm Rd, Palmerston North 7 4442, New Zealand 8 3 Institute of Food Nutrition and Human Health, Massey University, Massey University, PO Box 11 222, 9 Palmerston North 4442, New Zealand 10 4 Department of Chemical and Materials Engineering, University of Auckland, Auckland, New Zealand 11 5 Dairy Technology Division, National Dairy Research Institute, Karnal-132001, Haryana, India 12 * Corresponding Author: Tel: +64 635 05545 extn 81791 Email address: [email protected] (Prateek Sharma)
Transcript of 1 Measurement techniques for steady shear viscosity of ...

1
Measurement techniques for steady shear viscosity of Mozzarella-type 1
cheeses at high shear rates and high temperature 2
3
Prateek Sharma1,5*, Tzvetelin T. Dessev1, Peter A. Munro1, Peter G. Wiles2, Graeme 4
Gillies2, Matt Golding3, Bryony James4, Patrick Janssen3 5
1Riddet Institute, Massey University, Private Bag 11222, Palmerston North 4442, New Zealand 6
2Fonterra Research and Development Centre, Private Bag 11029, Dairy Farm Rd, Palmerston North 7
4442, New Zealand 8
3Institute of Food Nutrition and Human Health, Massey University, Massey University, PO Box 11 222, 9
Palmerston North 4442, New Zealand 10
4Department of Chemical and Materials Engineering, University of Auckland, Auckland, New Zealand 11
5Dairy Technology Division, National Dairy Research Institute, Karnal-132001, Haryana, India 12
* Corresponding Author: Tel: +64 635 05545 extn 81791 Email address: [email protected] (Prateek Sharma)

2
Abstract 13
While measuring steady shear viscosity of Mozzarella-type cheeses in a rotational rheometer 14
at 70oC, three main difficulties were encountered; wall slip, structural failure during 15
measurement and viscoelastic time dependent effects. Serrated plates were the most 16
successful surface modification at eliminating wall slip. However, even with serrated plates 17
shear banding occurred at higher shear rates. Because of the viscoelastic nature of the 18
cheeses, a time dependent viscous response occurred at shear rates <1 s-1, requiring longer 19
times to attain steady shear conditions. Prolonged continuous shearing altered the structure of 20
the molten cheeses. The effects of structural change were greatly reduced by minimising the 21
total accumulated strain exerted on the sample during flow curve determination. These 22
techniques enabled successful measurement of steady shear viscosity of molten Mozzarella-23
type cheeses at 70oC at shear rates up to 250 s-1. 24

3
1. Introduction 25
Accurate measurement of the rheological properties of food materials is important for 26
equipment design, product development, quality control and process modelling. Mozzarella 27
cheese is rheologically complex over its processing and consumption conditions because it is 28
viscoelastic, exhibiting varying amounts of solid- and liquid-like character depending upon 29
temperature, rate of deformation and extent of working during manufacture. Many studies 30
have been reported on small angle oscillatory shear measurements on Mozzarella-like 31
cheeses (Tunick et al., 1993; Hsieh, Yun, & Rao, 1993; Ak & Gunasekaran, 1996; 32
Subramanian & Gunasekaran 1997; Guinee, Feeney, Auty & Fox 2002; Venugopal & 33
Muthukumarappan, 2003; Karoui, Laguet & Dufour, 2003; Joshi, Muthukumarappan & 34
Dave, 2004; Rock et al., 2005; Udayarajan, Horne & Lucey, 2007; Hussain et al., 2012; Ma, 35
Balaban, Zhang, Emanuelsson-Patterson & James, 2014) as it is relatively easy to perform 36
such experiments on rotational rheometers. However, there are fewer reports on steady shear 37
viscosity measurements on such cheeses with rotational rheometers because of the difficulty 38
in performing steady shear experiments (Lee, Imoto & Rha, 1978; Ruegg, Eberhard, 39
Popplewell & Peleg, 1991; Guinee & O’ Callaghan 1997; Yu & Gunasekaran, 2001). Most of 40
the steady shear reports were conducted using empirical methods or devices, and did not 41
produce data at shear rates >10 s-1. Capillary rheometers have been used successfully to 42
achieve higher shear rates but various flow instabilities were noted during their use (Smith, 43
Rosenau & Peleg, 1980; Cavella, Chemin, & Masi, 1992; Taneya, Izutsu, Kimura & Shioya, 44
1992; Muliawan & Hatzikiriakos, 2008; Bahler & Hinrichs, 2013). 45
We are commencing a study on the cooking/stretching stage in Mozzarella manufacture as it 46
is poorly understood. The deformation regime in rotational rheometers is closer to the 47
processing conditions in this process stage than that in capillary rheometers. Reported 48
average shear rates during cooking/stretching vary from ~40 s-1 for a batch pilot-scale twin 49
4
screw cooker (Glenn & Daubert, 2003; Glenn, Daubert, Farkas & Stefanski, 2003) to 70-150 50
s-1 for a laboratory scale, single impeller mixing device (Lai, Steffe & Ng, 2000; Kapoor, 51
Lehtola & Metzger, 2004). We estimate maximum shear rates between the screw tip and the 52
wall in a batch pilot-scale Blentech cooker to be about 200 s-1. It is therefore useful to 53
determine shear viscosity of molten cheese at higher shear rates. 54
The presence of a no-slip condition at the wall is an important pre-requisite in accurately 55
measuring steady shear viscosity. In the case of Mozzarella-like cheeses in the molten state, 56
liquid fat at the cheese surface starts lubricating the wall (Ruegg et al., 1991; Muliawan & 57
Hatzikiriakos, 2008). This lubrication violates the classical no-slip boundary condition, 58
leading to erroneous viscosity data (Yoshimura & Prud’homme, 1988) particularly at shear 59
rates > 10 s-1. A rheologically complex material such as Mozzarella cheese exhibits time 60
dependency arising from two separate phenomena: 1. The viscoelastic nature of the material 61
which is important at low shear rates (<1 s-1) and 2. Structural change as a result of shearing 62
which is important after prolonged shearing at higher shear rates (Steffe, 1996; van Vliet, 63
2014). We use the term viscoelastic time dependency to refer to the first and structural 64
change to refer to the second. Because of these difficulties of wall slip and time dependency, 65
a limited amount of work has been conducted on steady shear rheology of Mozzarella cheese. 66
It is desirable to have a method that takes account of the viscoelastic time dependency and 67
measures the viscosity before significant structural change has occurred. The main aim of this 68
study was to develop such a method that is suitable at higher shear rates and higher 69
temperatures. A secondary aim was to understand the physical phenomena that occur during 70
shear viscosity measurement as these same phenomena will also occur in processing 71
equipment that imparts shear. 72
73

5
2. Materials and Methods 74
2.1 Materials 75
Samples of commercial Mozzarella cheese, a model Mozzarella cheese and renneted casein 76
gel were obtained as frozen blocks from Fonterra Co-operative Group Limited, Palmerston 77
North, New Zealand. Model Mozzarella cheese was prepared by mixing and working 78
renneted casein gel, cream, water and salt at 70 oC in a twin screw batch cooker (Blentech, 79
model CC-0045, Blentech Corporation, Rohnert Park, CA, USA). Renneted casein gel was a 80
dewatered, renneted and acidified curd made from skim milk. The compositions of the 81
cheeses were determined by the Analytical Services Group of Fonterra Research and 82
Development Centre (Table 1). Each cheese block was thawed at 4 oC for at least 24 h before 83
use in experiments. Cheese cylinders of 20 mm diameter were drawn from a cheese block 84
using a cork borer. Discs 2-3 mm thick were cut from the cheese cylinder using a wire cutter. 85
Cheese discs were wrapped in food wrap to prevent moisture loss and stored at 4 oC. 86
2.2 Rheological properties 87
Initial experiments (as noted in figure legends) were conducted on a stress controlled AR-G2 88
rheometer (TA Instruments, New Castle, DE, USA) using parallel plate geometry (diameter 89
20 mm). Unless otherwise noted in figure legends, all other rheological measurements were 90
conducted on a MCR 301 rheometer (Anton Paar, Graz, Austria) using a Peltier temperature 91
hood (H-PTD 200), a 20 mm serrated parallel plate geometry and using the following 92
conditions. 93
Cheese discs were equilibrated to room temperature (21 oC) for at least 30 min and then 94
placed between the parallel plates of the rheometer. To ensure good rheometer/sample 95
contact the measurement gap was set by closing the gap at room temperature until the normal 96

6
force was 5 N. While closing the gap, the velocity of the rheometer moving head was 50 97
µm/s. The sample was then heated to 70 oC using the in-built Peltier heating system for both 98
the bottom plate and the upper temperature hood. The sample was then held at 70 oC for 2 99
min to ensure isothermal conditions and to allow some stress relaxation. To avoid drying 100
soybean oil was applied around the edges of the cheese disc. All rheological measurements 101
were performed at 70 oC. Oscillatory rheological measurements on renneted casein gel were 102
conducted in the linear viscoelastic range using 1 Hz frequency and 0.5% amplitude at 70 oC. 103
Temperature gradients across the samples were explored using a temperature probe (Q1437 104
digital thermometer, Dick Smith Electronics, Auckland, New Zealand) and a high viscosity 105
standard oil (Viscosity reference standard N4000, Cannon Instrument Company, State 106
College, PA, USA). 107
2.3 Image acquisition to illustrate wall slip 108
To visualize wall slip a digital camera, Canon EOS 650D (Canon, Tokyo, Japan), was used in 109
video mode. The camera was operated remotely by computer using software EOS digital 110
version 25.2 (Canon, Tokyo, Japan). The camera was fixed at the same height as the rotating 111
plate and sample and was able to capture the wall slip event. A reference mark was drawn 112
vertically on the sample and upper plate. The sample was heated to 55 oC using the in-built 113
Peltier heating system. The rheometer was run at a shear rate of 0.04 s-1. A video-clip was 114
captured at 50 frames s-1 and 1280 x 720 resolution for 69 s. Still images were extracted from 115
the video using the software Windows LiveTM Movie Maker (Microsoft Corporation, 116
Redmond, WA, USA). 117
2.4 Environmental scanning electron microscopy 118
7
To explore the effect of shearing on microstructure, environmental scanning electron 119
microscopy (ESEM) was conducted on cheese samples obtained before and after shearing in 120
the rheometer. For the unsheared sample, a specimen was cut assuming random protein fibre 121
orientation. However, for the sheared fibrous-looking sample, protein fibre orientation was 122
assumed to be along the length of the sample and the specimen was cut in the longitudinal 123
direction. Specimens were cut with dimensions 4x4x1 mm. ESEM was conducted in a 124
variable pressure FEI Quanta 200F scanning electron microscope (FEI, Hillsboro, OR, USA) 125
equipped with a Schottky field emission gun and a Peltier cooling stage in environmental 126
mode. Water vapour (imaging gas) was used as a gas medium for secondary electron signal 127
amplification. The chamber was pumped for four to five cycles with minimum pressure 3.2 128
Torr and maximum pressure 7 Torr to stabilise the water vapour pressure. A spot size of 3, 129
accelerating voltage of 10 kV and working distance of approximately 5-6 mm were used. In 130
order to ensure wetness of the sample, the relative humidity of the chamber was maintained at 131
60% by controlling pressure at 3.2 Torr and temperature at 2.0 °C. 132
3. Results and Discussion 133
3.1 Wall slip and shear banding 134
In an initial attempt to determine a flow curve of model Mozzarella cheese at 70 oC using 135
smooth plate geometry, a flow discontinuity was observed, evidenced by a sudden drop in 136
apparent viscosity and shear stress at shear rates ~5 s-1 (Fig. 1). Yu and Gunasekaran (2001) 137
reported a similar drop in viscosity in the shear rate range 2-5 s-1 while measuring steady 138
shear viscosity of Mozzarella cheese at 60 oC. For Mozzarella-like cheeses at temperatures 139
above 30 oC, the fat will be molten and so the cheese surface will tend to be slippery (Ruegg 140
et al., 1991; Muliawan & Hatzikiriakos, 2008). The molten fat and slippery surfaces are likely 141
to cause loss of grip resulting in early wall slip. 142
8
To confirm the hypothesis that molten fat was causing wall slip, a movie was filmed using a 143
high resolution camera (Fig. 2). Even at the very low shear rate of 0.04 s-1, the images show 144
that the mark at the top of the cheese became displaced from that on the top plate by 35 s and 145
was progressively displaced further after 45 s and 55 s. This displacement was a clear visual 146
indication of wall slip. From the polymer literature, the picture of wall slip is that of 147
accumulated strain/stress building up in polymeric chains, reaching a critical value and 148
eventually leading to permanent detachment from the interface. The molten fat in Mozzarella 149
cheese may have worsened this situation. For an isothermal sample of a Newtonian liquid or 150
Hookean solid the marker line would be expected to be linear. We suggest the curve formed 151
with little distortion near the upper plate (Fig. 2) is caused by a temperature gradient in the 152
sample from 55 oC on the lower Peltier plate to a lower temperature at the upper plate. 153
We modified the cheese contact surfaces in an attempt to eliminate or minimize the wall slip 154
effect. Best results were obtained with serrated plates, followed by sandpaper and then 155
sandblasted plates (Fig. 3). The viscosity values with the serrated plates (Fig. 3) are about 5 156
times those with smooth plates (Fig. 1) even at low shear rates indicating the large effect of 157
wall slip on the results. Flow discontinuities were still observed at shear rates > 100 s-1, so 158
surface modification has just changed the location of the apparent slip or sample fracture 159
from the walls to within the material. Patarin, Galliard, Magnin and Goldschmidt (2014) 160
described similar behaviour as macroscopic failure or fracture when a cheese sample having 161
good contact with upper rotating and bottom stationary plates was sheared in a rheometer. 162
This apparent slip or fracture within the sample is referred to as shear banding, shear 163
localisation or melt fracture in the polymer literature (Ancey, 2005). 164
A temperature gradient across the samples was observed while conducting tests on the AR-165
G2 rheometer. When the temperature of the Peltier bottom plate was 70 oC a temperature 166
gradient of ~ 5 oC was recorded across the sample with the temperature probe. The high 167

9
viscosity standard oil showed that the measured viscosity was accurate at 20 oC but high at 70 168
oC indicating that the average sample temperature was lower than the 70 oC set temperature. 169
3.2 Transient viscoelastic effects and measurement duration 170
At low shear rates (<0.1 s-1) and 70 oC, model Mozzarella cheese exhibited a transient 171
viscosity peak, a localized maximum of viscosity on the flow curve (Fig. 3). Viscoelastic 172
materials exhibit non-steady state flow conditions at low shear rates (<1 s-1) if the timescale 173
of deformation is too small. This effect is related to the slow rate of stress dissipation within 174
the material resulting in slow development of steady flow conditions. In the literature, these 175
effects are termed start-up effects or time-dependent transition effects (Mezger, 2011; van 176
Vliet, 2014). 177
The apparent viscosity of Mozzarella cheese at 0.01 s-1 and 70 oC was found to be time 178
dependent (Fig. 4). Viscosity increased with measurement time and eventually reached a 179
relatively constant steady state value at around 100 s. At a higher shear rate (10 s-1) apparent 180
viscosity attained a constant value in less than 2 s. 181
Mezger (2011) proposed a rule of thumb that measurement duration at each point should be 182
at least as long as the reciprocal of shear rate, i.e. t > 1/�� . Fig. 4 agrees with this rule of 183
thumb. Attaining steady shear conditions at each shear rate step is important for obtaining an 184
accurate flow curve for viscoelastic materials such as cheese. Van Vliet (2014) provides an 185
excellent description of the role of time scale in food rheology including cheese examples. 186
The duration of shear rate application plays a vital role in the stress response of the material. 187
Reaction to applied stress is nearly instantaneous for a rigid elastic material but is time-188
dependent for soft solids (van Vliet, 2014; Malkin, 2013). For viscoelastic materials time 189
dependency is related to the disruption and reformation of molecular interactions and to the 190
spectrum of relaxation times of these processes (van Vliet, 2014). 191
10
3.3 Structural changes/failure during shearing 192
Continuous shearing of Mozzarella cheese at higher shear rates eventually resulted in 193
structural failure and expulsion of some of the sample from the rheometer measurement gap 194
in the form of a thick strand (diameter about the same as the measurement gap) with aligned 195
protein fibres. The unsheared sample had a random ESEM structure (Fig. 5). On the other 196
hand, the sheared sample exhibited alignment of the protein and fat structure, presumably in 197
the direction of shearing. These observations plus observations on model Mozzarella cheese 198
manufactured in pilot-scale equipment led us to the conclusion that shearing of Mozzarella-199
type cheese led to changes in the structure of the material. Similar observations were reported 200
by Manski (2007), who created fat filled protein structures by shearing calcium caseinate-fat 201
dispersions and showed that shearing led to structural orientation initially and then with a 202
further increase in shear rate also resulted in failure of the material. 203
Steady-state viscosity measurement for Mozzarella cheeses therefore changes the structure of 204
the cheese thus changing the viscosity that we are trying to measure. Although viscosity 205
measurements can be used as probing tools for changes in structure we wish to measure 206
steady shear viscosity before any significant structural change has occurred. 207
3.4 Optimum flow curve 208
One way to limit structural changes during rheological measurement is to minimize shearing 209
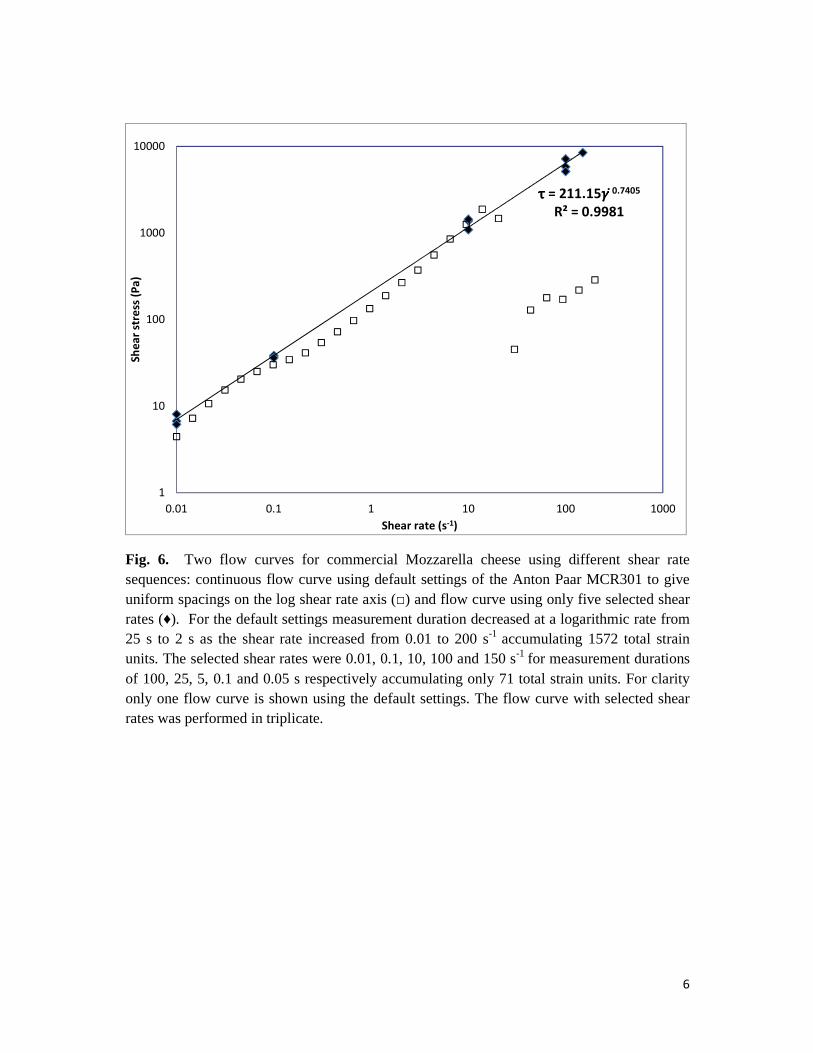
of the sample during the measurement. Fig. 6 indicates that this strategy was certainly an 210
improvement. The default shear rate settings for flow curve determination resulted in an early 211
breakdown of the flow curve at a shear rate near 10 s-1. The flow curve with only 5 shear rate 212
steps with shorter measurement durations resulted in successful measurement of shear 213
viscosity up to a shear rate of 150 s-1. The power law model fitted the data well (R2=0.998). 214
11
The practical limit of the method appeared to be about 150 s-1 with the chosen steps as only 215
one reliable data point was obtained at 150 s-1 from the triplicate runs. 216
To further check the robustness of the method two different shear step series with lower 217
accumulated strain units were attempted on commercial Mozzarella cheese. The data 218
obtained from both series also fitted very well to the power law model (R2=0.998) and the 219
flow curves for the two series were virtually identical (Fig. 7). The maximum shear rate 220
achieved was 250 s-1. Thus, a smooth flow curve up to 250 s-1 was obtained for Mozzarella 221
cheese by allowing longer measurement durations at low shear rates to avoid transient 222
viscoelastic effects and selecting only a few shear rate steps in order to limit total 223
accumulated shear strain (<50 strain units). 224
Values of the flow behaviour index for commercial Mozzarella cheese were similar (~0.74) 225
in figures 6 and 7 indicating similar moderate shear thinning behaviour. However, the 226
consistency coefficient shown in Fig. 7 is lower (~122 Pa.sn) than that in figure 6 (~211 227
Pa.sn). Fig. 7 was performed on the same material as Fig. 6 but after storage at 4oC for two 228
weeks. The lower consistency coefficient in Fig. 7 was possibly attributed to softening caused 229
by proteolysis during storage of the cheese at 4 oC. The effect of proteolysis on softening of 230
Mozzarella cheese is well reported (Metzger, Barbano & Kindstedt, 2001; Guinee et al., 231
2002; Kindstedt, Hillier & Mayes, 2010). 232
Rheological data obtained by Muliawan & Hatzikiriakos (2007) for Mozzarella cheese at 25 233
oC using both capillary and sliding plate rheometers were described by the Herschel-Bulkley 234
model (i.e. Power law with yield stress) with a higher consistency coefficient (K=3.34 235
kPa.sn), a lower flow behaviour index (n=0.25) and a yield stress (1.93 kPa). Muliawan & 236
Hatzikiriakos (2007) reported the absence of a yield stress above 60 oC and suggested this 237
was because of complete melting of the protein structure and hence easier initial flow of the 238

12
cheese. Our fit of data to the power law model therefore agrees with Muliawan & 239
Hatzikiriakos (2007) but absolute values of the model parameters were different because of 240
our higher test temperature. 241
3.5 Flow properties of molten renneted casein gel 242
Some experiments were conducted with molten renneted casein gel, effectively a fat-free, low 243
salt Mozzarella cheese, to explore the role of the protein phase in the flow instabilities such 244
as wall slip or structural failure. Fig. 8 indicates a discontinuity occurred in the flow curve for 245
molten renneted casein gel at around 25 s-1 with a sudden decrease in viscosity. Fat is absent 246
here so the occurrence of flow instability suggests breakdown of protein structures upon 247
shearing rather than wall slip. 248
3.6 Applicability of the Cox-Merz rule 249
The Cox-Merz rule is an empirical rule that seeks to relate oscillatory rheological data to 250
steady shear data. The Cox-Merz rule is represented by following equation: 251
η���� � |�η ∗ ��|� � ��" �1 � ����"��� ���
(1) 252
Where, η(��� is shear viscosity in Pa.s, η*�� complex viscosity in Pa.s, ω rotational speed in 253
rad.s-1, G’, storage modulus and G” loss modulus in Pa. 254
Reasonably good agreement was observed between complex viscosity and shear viscosity 255
with our data almost superimposing over the shear rate range 0.01-25 s-1 (Fig. 8). This 256
agreement suggested that the Cox-Merz rule was applicable to renneted casein gel and also 257
suggested the possible use of oscillatory data to estimate shear viscosity at higher shear rates 258
beyond which wall slip or structural breakdown would have occurred in rotational steady 259
shear mode. Muliawan & Hatziriakos (2007) compared complex and shear viscosities of 260
13
Mozzeralla cheese at various temperatures from 25 oC to 60 oC and reported poor agreement 261
at temperatures up to 50 oC suggesting non-compliance to the Cox-Merz rule. They suggested 262
this lack of agreement was caused by the solid-like structure and by the presence of a yield 263
stress at temperatures of 50 oC and below. However, at 60 oC or above where the cheese is 264
more molten Muliawan & Hatziriakos (2007) reported agreement between oscillatory and 265
steady shear data in agreement with Fig. 8. 266
3.7 Structural origins of rheological behaviour 267
Flow instabilities have been widely reported and discussed in the polymer melt rheology 268
literature. Two of the most common terms used for structural failure of the material during 269
rheological measurement are shear banding and melt fracture. Entangled polymeric chains or 270
aggregated gel networks both show shear banding in simple shear (Boukany & Wang, 2010). 271
Polymer chain entanglement and disentanglement (also known as the coil and stretch 272
phenomena) in concentrated polymer dispersions are the usual phenomena that have 273
consequences for rheological measurements (Ferry, 1980; Graessley, 1974; Boukany & 274
Wang, 2010). Entanglement of polymer chains may lead to an initial elastic deformation 275
before the molten material actually starts flowing. If the rate of external deformation is higher 276
than the chain relaxation rate, the chain or gel network may collapse to facilitate flow. This 277
collapse may be a localized event giving rise to a shear banding type of flow discontinuity. 278
This is a complex type of time dependency in that it is shear rate dependent and also results in 279
structural change with time. Shear banding could also arise from breakage of polymeric 280
interactions above a critical shear stress or shear rate (Callaghan & Gill, 2000). Melt fracture 281
is a stress induced structural failure of material perhaps arising from stress-induced 282
disentanglement among bulk polymer chains (Wang & Drda, 1997; Koopmans, den Doelder 283
& Molenaar, 2011). 284

14
Casein structures in Mozzarella-like cheeses can be viewed as entangled polymers, as while 285
stretching at higher temperature, they form macroscopic fibers because of calcium mediated 286
casein-casein interactions (Lucey, Johnson & Horne, 2003). These polymeric chains may also 287
have cross links to further strengthen the protein network. Self-association of α and β-caseins 288
may form worm-like polymeric chains and hedgehog-like micelles, respectively (Horne, 289
1998). Casein gels have also been considered as a heterogeneous network structure 290
consisting of strands of aggregated casein particles (van Vliet, Roeffs, Zoon & Walstra, 291
1989). In relatively concentrated and close packed conditions such as cheese these casein 292
aggregates may interact with neighboring casein aggregates through entanglement (Horne, 293
1998). 294
The fact that casein structures in Mozzarella-like cheeses can be considered as either 295
entangled polymers or aggregated gel networks suggests that insights from the polymer 296
literature are relevant. High shear rates applied to molten Mozzarella cheese in a capillary 297
rheometer result in melt fracture, which can be caused either by fat-protein separation or by a 298
stick-slip type of behaviour (Muliawan & Hatzikiriakos, 2008; Bahler & Hinrichs, 2013). 299
However, a critical shear stress or shear rate was necessary to cause melt fracture. Yu & 300
Gunasekaran (2001) reported a sharp drop in shear viscosity at 2-5 s-1 for molten Mozzarella 301
cheese and suggested that the cheese undergoes structural breakdown above some critical 302
shear rate. 303
4. Conclusions 304
Steady shear viscosity measurements are possible on molten Mozzarella-like cheeses at 305
higher shear rates. The best methods to obtain reliable and consistent data up to 250 s-1 on 306
steady shear viscosity of Mozzarella cheese were: 1. Use of 20 mm serrated plates with a 307
Peltier temperature hood; 2. Using longer measurement duration for low shear rates and; 3. 308
15
Using fewer shear rate steps in the flow curve to limit the total accumulated shear strain. The 309
flow curves obtained for Mozzarella-type cheeses at 70 oC were found to follow the power 310
law model. At higher shear rates flow inconsistencies may arise from the combined effect of 311
wall slip and structural failure of the material. The Cox-Merz rule was found to be applicable 312
for renneted casein gel at 70 oC and is recommended as a possible tool to predict steady shear 313
viscosity from oscillatory rheological data. 314
Acknowledgements 315
The authors thank Fonterra Co-operative Group and the Ministry for Primary Industries, NZ 316
for funding this project under the Dairy Primary Growth Partnership programme in Food 317
Structure Design. The authors also wish to acknowledge the help of Seo Won Yang in 318
conducting the ESEM imaging at Auckland University. 319
References 320
Ak, M.M., & Gunasekaran, S. (1996). Dynamic rheological properties of Mozzarella cheese 321
during refrigerated storage. Journal of Food Science, 61, 556-568, 584. 322
Ancey, C. (2005). Introduction to Fluid Rheology. École Polytechnique Fédérale de 323
Lausanne. 324
Bahler, B., & Hinrichs, J. (2013). Characterisation of Mozzarella cheese curd by means of 325
capillary rheometry. International Journal of Dairy Technology, 66, 231-235 326
Boukany, P.E., & Wang, S.-Q. (2010). Shear banding or not in entangled DNA solutions. 327
Macromolecules, 43, 6950-6952 328
Callaghan, P. T., & Gill, A. M. (2000). Rheo-NMR of semidilute polyacrylamide in water. 329
Macromolecules, 33, 4116-4124. 330

16
Cavella, S., Chemin, S., & Masi, P. (1992). Objective Measurement of the stretchability of 331
Mozzarella cheese. Journal of Texture Studies, 23, 185-194. 332
Ferry, J.D. (1980). Viscoelastic Properties of Polymers. New York: John Wiley & Sons. 333
Glenn, T. A., & Daubert, C. R. (2003). A mixer viscometry approach for blending devices. 334
Journal of Food Process Engineering, 26, 1-16. 335
Glenn, T. A., Daubert, C. R., Farkas, B. E., & Stefanski, L. A. (2003). A statistical analysis of 336
creaming variables impacting process cheese melt quality. Journal of Food Quality, 337
26, 299-321. 338
Graessley, W. W. (1974). The entanglement concept in polymer rheology. Advances in 339
Polymer Science, 16,1-179. 340
Guinee, T.P., & O'Callaghan, D.J. (1997). The use of a simple empirical method for objective 341
quantification of the stretchability of cheese on cooked pizza pies. Journal of Food 342
Engineering, 31, 47-161. 343
Guinee, T.P., Feeney, E.P., Auty, M.A.E., & Fox, P.F. (2002). Effect of pH and calcium 344
concentration on some textural and functional properties of Mozzarella cheese. 345
Journal of Dairy Science, 85, 1655–1669. 346
Horne, D. S. (1998). Casein interactions: Casting light on the Black Boxes, the structure in 347
dairy products. International Dairy Journal, 8,171–177. 348
Hsieh, Y.L., Yun, J.J., & Rao, M.A. (1993). Rheological properties of Mozzarella cheese 349
filled with dairy, egg, soy proteins, and gelatin. Journal of Food Science, 58, 1001-350
1004. 351
Hussain, I., Grandison, A.S., & Bell, A.E. (2012). Effects of gelation temperature on 352
Mozzarella-type curd made from buffalo and cows’ milk. 1: Rheology and 353
microstructure. Food Chemistry, 134, 1500-1508. 354
17
Joshi, N.S, Muthukumarappan, K., & Dave, R.I. (2004). Viscoelastic properties of part skim 355
Mozzarella cheese: Effects of calcium, storage, and test temperature. International 356
Journal of Food Properties, 7, 239-252. 357
Kapoor, R., Lehtola, P., & Metzger, L. E. (2004). Comparison of pilot-scale and rapid visco 358
analyzer process cheese manufacture. Journal of Dairy Science, 87, 2813-2821. 359
Karoui, R., Laguet, A., & Dufour, E. (2003). Fluorescence spectroscopy: A tool for the 360
investigation of cheese melting - Correlation with rheological characteristics. Lait, 83, 361
251-264. 362
Kindstedt, P.S., Hillier, A.J., & Mayes, J.J. (2010). Technology, Biochemistry and 363
Functionality of Pasta Filata/Pizza Cheese. In B. A. Law & A.Y. Tamime (Eds.), 364
Technology of Cheesemaking (pp. 330-359). West Sussex, UK : Wiley-Blackwell. 365
Koopmans, R., den Doelder, J., & Molenaar, J. (2011). Polymer Melt Fracture. Boca Raton, 366
FL, USA: CRC Press. 367
Lai, K. P., Steffe, J. F., & Ng, P. K. W. (2000). Average shear rates in the rapid visco 368
analyser (RVA) mixing system. Cereal Chemistry, 77, 714-716. 369
Lee, C. H., Imoto, E. M., & Rha, C. (1978). Evaluation of cheese texture. Journal of Food 370
Science, 43, 1600-1605. 371
Lucey, J. A., Johnson, M. E., & Horne, D. S. (2003). Invited review: Perspectives on the 372
basis of the rheology and texture properties of cheese. Journal of Dairy Science,86, 373
2725–2743. 374
Ma, X., Balaban, M. O., Zhang, L., Emanuelsson-Patterson, E. A. C., & James, B. (2014). 375
Quantification of pizza baking properties of different cheeses, and their correlation 376
with cheese functionality. Journal of Food Science, 79, E1528-E1534. 377

18
Malkin, A. Y. (2013). Non-Newtonian viscosity in steady-state shear flows. Journal of Non-378
Newtonian Fluid Mechanics, 192, 48-65. 379
Manski, J. M. (2007). Flow-induced structuring of dense protein dispersions. (Doctoral 380
thesis, Wageningen University, The Netherlands). Retrieved from 381
http://www.wageningenur.nl/en/Publication-details.htm?publicationId=publication-382
way-333535313331 383
Metzger, L.E., Barbano, D.M., & Kindstedt, P.S. (2001) Effect of milk preacidification on 384
low fat Mozzarella cheese. 3: Post-melt chewiness and whiteness. Journal of Dairy 385
Science, 84, 1357–1366 386
Mezger, T.G. (2011). The Rheology Handbook: for Users of Rotational and Oscillatory 387
Rheometers. (3rd ed.). Hannover, Germany: Vincentz Network GmbH & Co. 388
Muliawan, E.B., & Hatzikiriakos, S.G. (2007). Rheology of Mozzarella Cheese. International 389
Dairy Journal, 17, 1063-1072. 390
Muliawan, E. B., & Hatzikiriakos, S. G. (2008). Rheology of Mozzarella cheese: extrusion 391
and rolling. International Dairy Journal, 18, 615-623. 392
Patarin, J., Galliard, H., Magnin, A., & Goldschmidt, B. (2014). Vane and plate-plate 393
rheometry of cheeses under oscillations and large strains: A comparative study and 394
experimental conditions analysis. International Dairy Journal, 38, 24-30. 395
Rock, S., Stenz, B., Hahn, A., Sedlmeyer, F., Fischer, U., & Kulozik U. (2005). Rheological 396
characterisation of the meltability of cheese products: influence of gap width, the 397
measuring mode and geometry. Milchwissenschaft, 60, 154–158. 398
Ruegg, M., Eberhard, P., Popplewell, L. M., & Peleg, M. (1991). Melting properties of 399
cheese. Bulletin of the International Dairy Federation, 268, 36-43. 400

19
Smith, C.E., Rosenau, J.R., & Peleg. M. (1980). Evaluation of the flowability of melted 401
Mozzarella cheese by capillary rheometry. Journal of Food Science, 45, 1142-1145. 402
Steffe, J. F. (1996). Rheological methods in food process engineering (2nd ed.) (pp 27-28). 403
East Lansing, MI, USA: Freeman Press. 404
Subramanian, R., & Gunasekaran, S. (1997). Small amplitude oscillatory shear studies on 405
Mozzarella cheese. Part I. Region of linear viscoelasticity. Journal of Texture Studies, 406
28, 633-642. 407
Taneya, S., Izutsu, T., Kimura, T., & Shioya. T. (1992). Structure and rheology of string 408
cheese. Food Structure, 11, 61-71. 409
Tunick, M. H., Mackey, K. L., Shieh, J. J., Smith, P. W., Cooke, P., & Malin, E. L. (1993). 410
Rheology and microstructure of low-fat Mozzarella cheese. International Dairy 411
Journal, 3, 649–662. 412
Udayarajan, C.T., Horne, D.S., & Lucey, J.A. (2007). Use of time–temperature superposition 413
to study the rheological properties of cheese during heating and cooling. International 414
Journal of Food Science and Technology, 42, 686–698. 415
van Vliet, T., Roeffs, S.P.F.M., Zoon, P., & Walstra, P. (1989). Rheological properties of 416
casein gels. Journal of Dairy Research, 56, 529-534. 417
van Vliet, T. (2014). Rheology and fracture mechanics of foods. Boca Raton, FL, USA: CRC 418
Press. 419
Venugopal, V., & Muthukumarappan, K. (2003). Rheological properties of cheddar cheese 420
during heating and cooling. International Journal of Food Properties, 6, 99-114. 421
20
Wang, S. Q., & Drda, P. (1997). Molecular instabilities in capillary flow of polymer melts: 422
Interfacial stick-slip transition, wall slip and extrudate distortion. Macromolecular 423
Chemistry and Physics, 198, 673-701. 424
Yoshimura, A. S., & Prud’homme, R. K. (1988). Wall slip effects on dynamic oscillatory 425
measurements. Journal of Rheology, 32, 575-584. 426
Yu, C., & Gunasekaran, S. (2001). Correlation of dynamic and steady flow viscosities of food 427
materials. Applied Rheology, 11, 134-140. 428
429

Figure Legends 430
Fig. 1. Flow curves of model Mozzarella431
(TA Instruments) rheometer using smooth plates. Shear viscosity (432
Fig. 2. Visualization of wall slip of model 433
plates on the AR-G2 (TA Instruments) rheometer at 0.04 s434
on the cheese becomes displaced from that on the upper plate suggesting wall slip. The 435
images were taken at 0, 10, 25, 35, 45 and 55 s from the start of she436
Fig. 3. Effect of surface modification of the rotating parallel plates on the flow curves of 437
model Mozzarella cheese. Experiments used 40 grit sand paper (438
Instruments) rheometer and sandblasted plates (439
(Anton Paar) rheometer. 440
Fig. 4. Transient start-up effects on shear v441
constant shear rates 0.01 s-1 ( ) and 10 s442
Fig. 5. Environmental scanning electron microscopy (E443
Mozzarella cheese (upper row) and of a thick strand of sheared cheese that had come out 444
from the measurement gap of the rheometer after shearing for 3529 strain units (bottom row). 445
Globular structures represent fat globules.446
Fig. 6. Two flow curves for commercial 447
sequences: continuous flow curve using default settings of the Anton Paar MCR301 to give 448
uniform spacings on the log shear rate axis (449
rates (♦). For the default settings measurement duration decreased at a logarithmic rate from 450
25 s to 2 s as the shear rate increased from 0.01 to 200 s451
units. The selected shear rates were 0.01, 0.1, 10, 100 and 150 s452
Mozzarella cheese showing wall slip obtained in the AR
(TA Instruments) rheometer using smooth plates. Shear viscosity ( ), Shear stress (
model Mozzarella cheese at 55 oC using smooth pa
G2 (TA Instruments) rheometer at 0.04 s-1 shear rate. The black marker line
on the cheese becomes displaced from that on the upper plate suggesting wall slip. The
images were taken at 0, 10, 25, 35, 45 and 55 s from the start of shearing.
Effect of surface modification of the rotating parallel plates on the flow curves of
Experiments used 40 grit sand paper () on the AR-G2 (TA
Instruments) rheometer and sandblasted plates () or serrated plates ( ) on the MCR301
up effects on shear viscosity of commercial Mozzarella cheese at
) and 10 s-1 ( ).
Environmental scanning electron microscopy (ESEM) images of unsheared model
cheese (upper row) and of a thick strand of sheared cheese that had come out
from the measurement gap of the rheometer after shearing for 3529 strain units (bottom row).
Globular structures represent fat globules.
commercial Mozzarella cheese using different shear rate
sequences: continuous flow curve using default settings of the Anton Paar MCR301 to give
uniform spacings on the log shear rate axis (□) and flow curve using only five selected shear
). For the default settings measurement duration decreased at a logarithmic rate from
25 s to 2 s as the shear rate increased from 0.01 to 200 s-1 accumulating 1572 total strain
were 0.01, 0.1, 10, 100 and 150 s-1 for measurement durations
cheese showing wall slip obtained in the AR-G2
), Shear stress ( ).
C using smooth parallel
shear rate. The black marker line
on the cheese becomes displaced from that on the upper plate suggesting wall slip. The
Effect of surface modification of the rotating parallel plates on the flow curves of
G2 (TA
) on the MCR301
at
unsheared model
cheese (upper row) and of a thick strand of sheared cheese that had come out
from the measurement gap of the rheometer after shearing for 3529 strain units (bottom row).
sequences: continuous flow curve using default settings of the Anton Paar MCR301 to give
selected shear
). For the default settings measurement duration decreased at a logarithmic rate from
accumulating 1572 total strain
for measurement durations

22
of 100, 25, 5, 0.1 and 0.05 s respectively accumulating only 71 total strain units. For clarity 453
only one flow curve is shown using the default settings. The flow curve with selected shear 454
rates was performed in triplicate. 455
Fig. 7. Two flow curves of commercial Mozzarella cheese using different series of shear rate 456
steps; Series 1: 0.01-0.1-1-10-100-200 s-1 (■) with measurement durations of 100, 12.5, 5, 457
0.05, 0.05, 0.05 s respectively, performed in duplicate; Series 2: 0.05-0.5-5-50-150-250 s-458
1(▲) with measurement durations of 50, 6.25, 2.5, 0.05, 0.05, 0.05 s respectively. The dotted 459
line represents the power law regression model fitted on the pooled series. Total accumulated 460
strain was 23 units for series 1 and 41 units for series 2. 461
Fig.8. Shear viscosity, η (♦) and complex viscosity, η* (□) as a function of shear rate and 462
angular frequency to explore the applicability of the Cox-Merz rule to molten renneted casein 463
gel. For oscillatory measurements the strain amplitude was 0.5%. 464
465
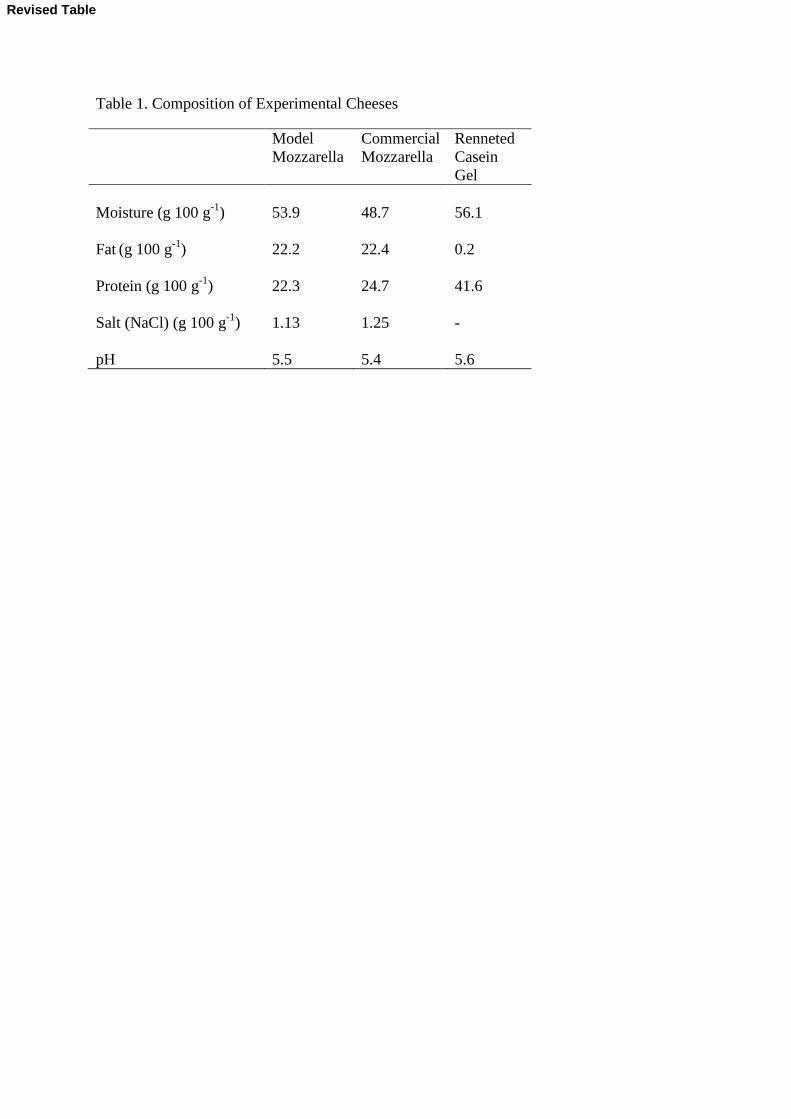
Table 1. Composition of Experimental Cheeses
Model
Mozzarella
Commercial
Mozzarella
Renneted
Casein
Gel
Moisture (g 100 g-1
)
53.9
48.7
56.1
Fat (g 100 g
-1) 22.2 22.4 0.2
Protein (g 100 g-1
) 22.3 24.7 41.6
Salt (NaCl) (g 100 g-1
) 1.13 1.25 -
pH 5.5 5.4 5.6
Revised Table

Fig. 1. Flow curves of model AR-G2 (TA Instruments) rheometer stress ( ).
Shear rate (s
0.001 0.01 0.1
She
ar v
isco
sity
(P
a.s)
0.1
1
10
100
1000
of model Mozzarella cheese showing wall slip obtained in G2 (TA Instruments) rheometer using smooth plates. Shear viscosity ( ),
Shear rate (s-1)
0.1 1 10 100
She
ar s
tres
s (P
a)
0.1
1
10
100
1000
in the ), Shear
Revised Figure

2
Fig
. 2.
Vis
ualiz
atio
n of
wal
l slip
of
mod
el M
ozza
rella
che
ese
at 5
5 o C
usi
ng s
moo
th p
aral
lel p
late
s on
the
AR
-G2
(TA
Ins
trum
ents
) rh
eom
eter
at
0.04
s-1
she
ar r
ate.
The
bla
ck m
arke
r li
ne o
n th
e ch
eese
bec
omes
dis
plac
ed f
rom
that
on
the
uppe
r pl
ate
sugg
estin
g w
all s
lip. T
he im
ages
wer
e ta
ken
at 0
, 10,
25,
35,
45
and
55 s
fro
m th
e st
art o
f sh
eari
ng.
1

Fig. 3. Effect of surface modificationmodel Mozzarella cheese. Experiments Instruments) rheometer and sandblasted plates (Anton Paar) rheometer.
0.01 0.1
App
aren
t vis
cosi
ty (
Pa.
s)
1
10
100
1000
10000
modification of the rotating parallel plates on the flow curve. Experiments used 40 grit sand paper ( ) on the AR-G2 (TA
sandblasted plates ( ) or serrated plates ( ) on the MCR301
Shear rate (s-1)
1 10 100
on the flow curves of G2 (TA
MCR301

Fig. 4. Transient start-up effects onconstant shear rates 0.01 s-1 ( ) and 10 s
0 20 40
Vis
cosi
ty (
Pa.
s)
0
100
200
300
400
500
600
700
up effects on shear viscosity of commercial Mozzarella cheeseand 10 s-1 ( ).
Time (s)
60 80 100 120 140
ozzarella cheese at

Fig
. 5.
ESE
M i
mag
es o
f un
shea
red
mod
el M
ozza
rella
che
ese
mea
sure
men
t gap
of
the
rheo
met
er a
fter
she
arin
g fo
r 35
29 s
trai
n un
its
ozza
rella
che
ese
(upp
er r
ow)
and
of a
thi
ck s
tran
d of
she
ared
che
ese
mea
sure
men
t gap
of
the
rheo
met
er a
fter
she
arin
g fo
r 35
29 s
trai
n un
its (
botto
m r
ow).
Glo
bula
r st
ruct
ures
rep
rese
nt f
at g
lobu
les.
chee
se t
hat
had
com
e ou
t fr
om t
he
Glo
bula
r st
ruct
ures
rep
rese
nt f
at g
lobu
les.
6
Fig. 6. Two flow curves for commercial Mozzarella cheese using different shear rate sequences: continuous flow curve using default settings of the Anton Paar MCR301 to give uniform spacings on the log shear rate axis (□) and flow curve using only five selected shear rates (♦). For the default settings measurement duration decreased at a logarithmic rate from 25 s to 2 s as the shear rate increased from 0.01 to 200 s-1 accumulating 1572 total strain units. The selected shear rates were 0.01, 0.1, 10, 100 and 150 s-1 for measurement durations of 100, 25, 5, 0.1 and 0.05 s respectively accumulating only 71 total strain units. For clarity only one flow curve is shown using the default settings. The flow curve with selected shear rates was performed in triplicate.
ττττ = 211.15���� ̇0.7405
R² = 0.9981
1
10
100
1000
10000
0.01 0.1 1 10 100 1000
Sh
ea
r st
ress
(P
a)
Shear rate (s-1)

7
Fig. 7. Two flow curves of commercial Mozzarella cheese using different series of shear rate steps; Series 1: 0.01-0.1-1-10-100-200 s-1 (■) with measurement durations of 100, 12.5, 5, 0.05, 0.05, 0.05 s respectively, performed in duplicate; Series 2: 0.05-0.5-5-50-150-250 s-
1(▲) with measurement durations of 50, 6.25, 2.5, 0.05, 0.05, 0.05 s respectively. The dotted line represents the power law regression model fitted on the pooled series. Total accumulated strain was 23 units for series 1 and 41 units for series 2.
1
10
100
1000
10000
0.001 0.01 0.1 1 10 100 1000
Sh
ea
r st
ress
(P
a)
Shear rate (s-1)
τ = 121.61� ̇0.7447
R² = 0.9978

8
Fig.8. Shear viscosity, η (♦) and complex viscosity, η* (□) as a function of shear rate and angular frequency to explore the applicability of the Cox-Merz rule to molten renneted casein gel. For oscillatory measurements the strain amplitude was 0.5%.
0.1
1
10
100
1000
0.01 0.1 1 10 100
Ap
pa
ren
tS
he
ar
or
Co
mp
lex
Vis
cosi
ty (
Pa
.s)
Shear rate (s-1)/angular frequency (rad.s-1)

Fig
. 2.
Vis
ualiz
atio
n of
wal
l sli
p of
Moz
zare
lla c
hees
eat
55s-1
she
ar r
ate.
The
bla
ck m
arke
r li
ne o
n th
e ch
eese
bec
omes
disp
lace
dfr
omth
aton
the
uppe
rpl
ate
sugg
esti
ngw
alls
lip.
The
imag
at 0
, 10,
25,
35,
45
and
55 s
fro
m th
e st
art o
f sh
eari
ng.
Bla
ck a
nd w
hite
ver
sion
of
Fig
. 2
ozza
rella
chee
se a
t 55o C
usi
ng s
moo
th p
aral
lel p
late
s on
the
AR
-G2
(TA
Ins
trum
ents
)rh
eom
eter
at0.
04sh
ear
rate
.The
blac
k m
arke
rli
neon
the
chee
sebe
com
es d
ispl
aced
fro
m th
at o
n th
e up
per
plat
e su
gges
ting
wal
l slip
.The
imag
the
star
tof
shea
ring
.
9
G2
(TA
Inst
rum
ents
) rh
eom
eter
at 0
.04
shea
rra
te.T
hebl
ack
mar
ker
line
onth
ech
eese
beco
mes
disp
lace
dfr
omth
aton
the
uppe
rpl
ate
sugg
esti
ngw
alls
lip.
The
imag
es w
ere
take
n


![Zwick testXpo 2017 · Zwick testXpo 2017 © 2017 Malvern Instruments Limited Outline ... Unit: [ ] = 1 Pas * Isothermal, isobaric, steady state dynamic shear viscosity of an incompressible,](https://static.fdocuments.net/doc/165x107/5b94165809d3f2a65f8c3535/zwick-testxpo-2017-zwick-testxpo-2017-2017-malvern-instruments-limited-outline.jpg)


![1 Interfacial Rheology System. 2 Background of Interfacial Rheology Interfacial Shear Stress Interfacial Shear Viscosity = [ ]](https://static.fdocuments.net/doc/165x107/56649d1f5503460f949f3d29/1-interfacial-rheology-system-2-background-of-interfacial-rheology-interfacial.jpg)