1 Measurably Shifting the Trend in Children’s Travel Toward Sustainable Mobility ACT Canada –...
25
1 Measurably Shifting the Trend in Children’s Travel Toward Sustainable Mobility ACT Canada – Sustainable Mobility Summit – November 2012 Jennifer Lay Program Advisor – School Travel, Metrolinx [email protected] www.metrolinx.com/schooltravel
-
Upload
corey-ferguson -
Category
Documents
-
view
219 -
download
1
Transcript of 1 Measurably Shifting the Trend in Children’s Travel Toward Sustainable Mobility ACT Canada –...

1
Measurably Shifting the Trend in Children’s Travel Toward Sustainable MobilityACT Canada – Sustainable Mobility Summit – November 2012
Jennifer LayProgram Advisor – School Travel, [email protected] www.metrolinx.com/schooltravel
2
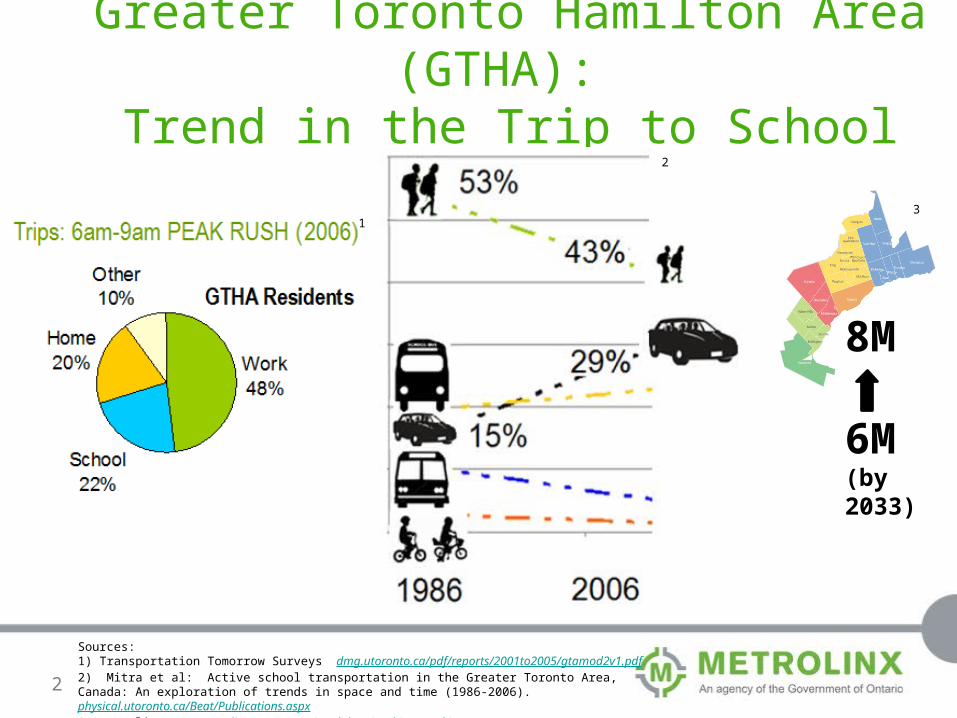
Greater Toronto Hamilton Area (GTHA): Trend in the Trip to School
8M 6M(by 2033)
Sources: 1) Transportation Tomorrow Surveys dmg.utoronto.ca/pdf/reports/2001to2005/gtamod2v1.pdf2) Mitra et al: Active school transportation in the Greater Toronto Area, Canada: An exploration of trends in space and time (1986-2006).physical.utoronto.ca/Beat/Publications.aspx3) Metrolinx. www.metrolinx.com/en/regionalplanning/bigmove/big_move.aspx
1
2
3

3
The School Travel Challenge• ‘school run’ has added 20-30% to traffic volume during morning peak1
• Traffic crashes are #1 killer of children below age 15 in OECD countries1
• >80% of Canadian municipalities do not require safe walking/biking routes when developing new areas of reconstructing roads2
• $250,000 for a student drop off loop - now required at schools in many areas
• 26% children and youth are overweight or obese3
Sources: 1) OECD www.internationaltransportforum.org/Pub/pdf/04ChildrenSafeE.pdf2)Active Healthy Kids Canada.
www.sportsdome.ca/wp-content/uploads/2012/02/ahkc2011-factsheet-final.pdf3)Statistics Canada.
www5.statcan.gc.ca/bsolc/olc-cel/olc-cel?catno=82-003-X20050039277&lang=eng
4
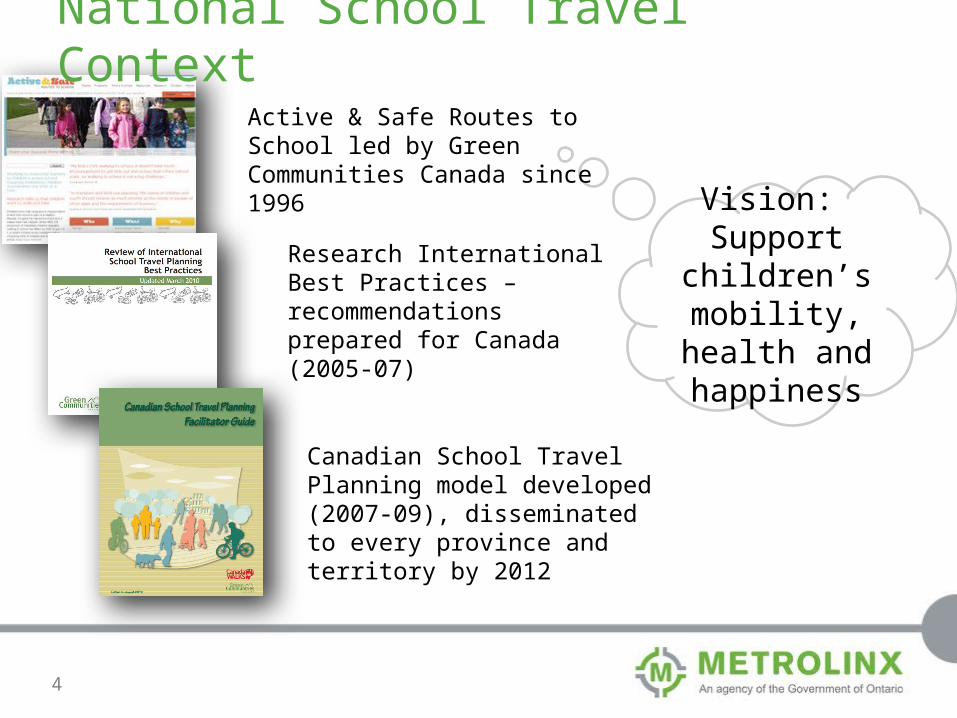
National School Travel Context
Vision: Support
children’s mobility, health and happiness
Active & Safe Routes to School led by Green Communities Canada since 1996
Canadian School Travel Planning model developed (2007-09), disseminated to every province and territory by 2012
Research International Best Practices – recommendations prepared for Canada (2005-07)
5
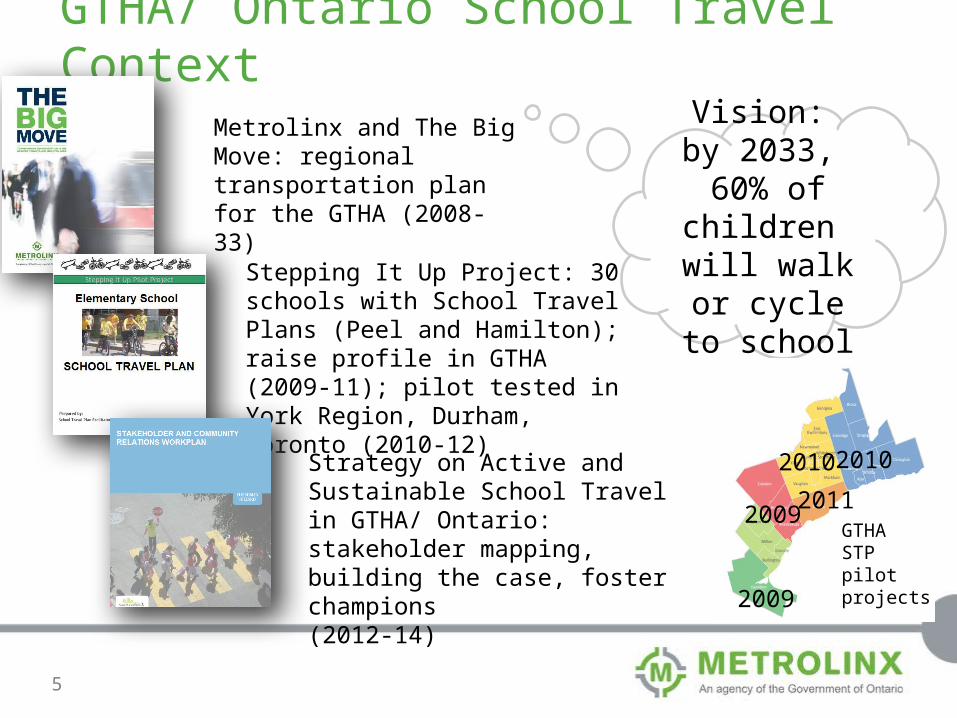
GTHA/ Ontario School Travel Context
Vision: by 2033,
60% of children will walk or cycle
to school
Metrolinx and The Big Move: regional transportation plan for the GTHA (2008-33)
Stepping It Up Project: 30 schools with School Travel Plans (Peel and Hamilton); raise profile in GTHA (2009-11); pilot tested in York Region, Durham, Toronto (2010-12)
Strategy on Active and Sustainable School Travel in GTHA/ Ontario: stakeholder mapping, building the case, foster champions(2012-14)
2009
2009
2010 2010
2011GTHA STP pilot projects
6
Why Put Resources Toward Active and Sustainable School Travel Now?
• Address the second largest trip generator in the morning peak• Healthier children now• Influence behaviour of future commuters• Captive audience • Opportunity to influence travel of current adult commuters• Existing Canadian STP community-based toolkit

7
Is there Room & Opportunity…
…for Change?

8
32%
26%
21%
16%
35%
30%
39%
33%
3%
3%
2%
1%
5%
5%
2%
2%
24%
25%
3%
4%
24%
22%
45%
49%
3%
3%
2%
2%
5%
5%
36%
40%
72%
76%
31%
38%
7%
8%
1%
1%
1%
1%
1%
1%
0% 20% 40% 60% 80% 100%
To school
From school
To school
From school
To school
From school
To school
From school
Driven Carpool School bus Public transit Walk Bicycle
Base: All respondents (n=1,016)
Overall
Within 1 km
Between 1- 2 km
More than 2 km
DistanceMode of School Travel – By Home to School Distance (GTHA parents)
Source: GTHA School Travel Household Attitudinal Studymetrolinx.com/en/projectsandprograms/schooltravel/ENG-2011GTHASchoolTravelStudy.pdf
9
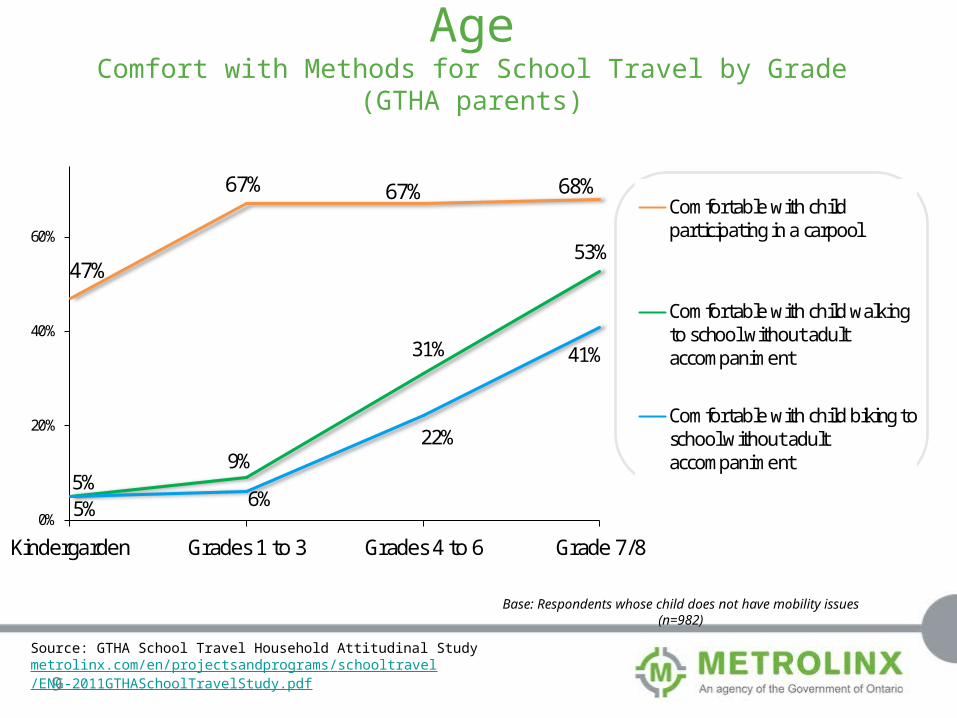
47%
67% 67% 68%
5%9%
31%
53%
5% 6%
22%
41%
0%
20%
40%
60%
Kindergarden Grades 1 to 3 Grades 4 to 6 Grade 7/8
Comfortable with childparticipating in a carpool
Comfortable with child walkingto school without adultaccompaniment
Comfortable with child biking toschool without adultaccompaniment
Base: Respondents whose child does not have mobility issues (n=982)
AgeComfort with Methods for School Travel by Grade (GTHA parents)
Source: GTHA School Travel Household Attitudinal Studymetrolinx.com/en/projectsandprograms/schooltravel/ENG-2011GTHASchoolTravelStudy.pdf
10
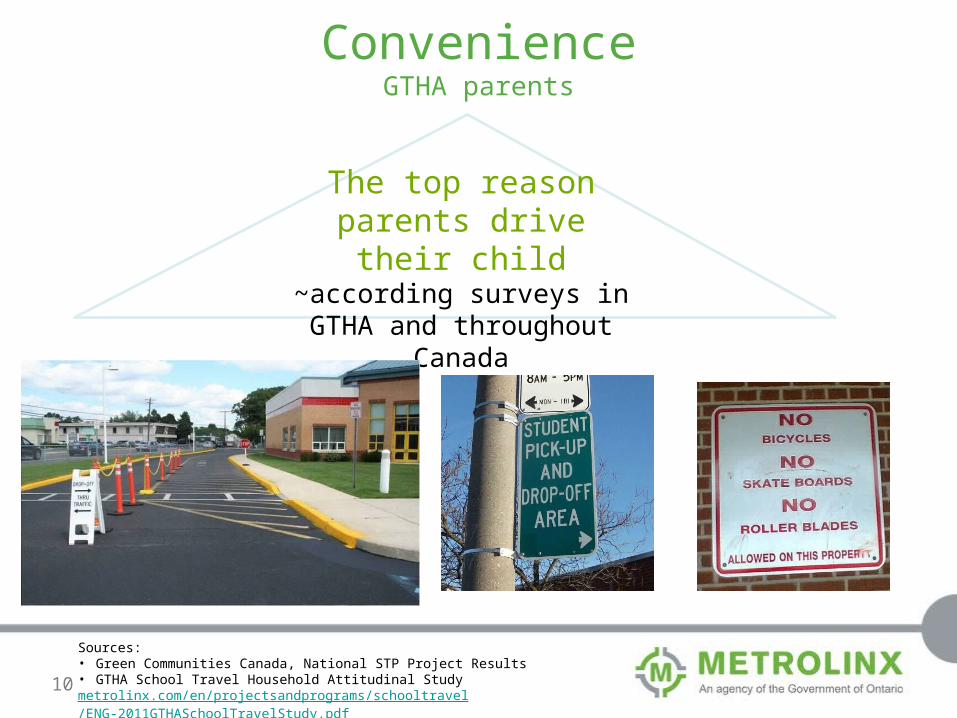
ConvenienceGTHA parents
The top reason parents drive their child
~according surveys in GTHA and throughout Canada
Sources: • Green Communities Canada, National STP Project Results• GTHA School Travel Household Attitudinal Studymetrolinx.com/en/projectsandprograms/schooltravel/ENG-2011GTHASchoolTravelStudy.pdf

11
.
Active & Sustainable School Travel Target Groups
“Close Drivers <2km” (20%)• Drivers who live within 2km and drive their
child at least one way to school
“Carpool Target >2km” (11%)• Drivers who live greater than 2km from
school and would be open to carpooling
“School Bus Target >2km” (6%)• Drivers who live greater than 2km from
school and have access to a school bus
Region Close Drivers
School Bus
Target
Carpool Target Group
Overall 20% (n=181)
6%(n=51)
11%(n=101)
Durham 20% 15% 15%
York 18% 6% 12%
Toronto 16% 3% 9%
Peel 28% 5% 11%
Halton 23% 9% 12%
Hamilton 20% 7% 10%
Source: GTHA School Travel Household Attitudinal Studymetrolinx.com/en/projectsandprograms/schooltravel/ENG-2011GTHASchoolTravelStudy.pdf

12
62%
71%
66%
48%
45%
40%
32%
21%
73%
67%
44%
56%
52%
51%
39%
10%
85%
66%
51%
48%
12%
55%
43%
38%
78%
77%
52%
53%
37%
47%
48%
29%
0% 20% 40% 60% 80% 100%
Walk with an organized group
Walking with them to school
Ride the School Bus
Bike with an organized group
Biking with them to school
Driving them to school
Participating in carpool
Having them ride public transit
Target Group Bases: Overall (n=982), Close Drivers (n=181), School Bus Target (n=51), Carpool Target (n=101)
Target Groups – Appeal of Travel Methods
Overall
Close Drivers
School Bus Target
CarpoolTarget
Methods that ‘appeal’ to them for their child’s school travel…
Source: GTHA School Travel Household Attitudinal Studymetrolinx.com/en/projectsandprograms/schooltravel/ENG-2011GTHASchoolTravelStudy.pdf

13
36%
39%
52%
35%
35%
44%
41%
41%
40%
39%
0% 20% 40% 60%
Well-maintained sidewalks to the school,cleared of debris and snow
Crossing guards and marked crossings in frontof the school
A school closer to home
Signs along your child’s route to school letting drivers know to drive safe and watch for …
Slower speeds on roads around schools
Overall
Close Drivers
Base: Respondents whose child does not have mobility issues and does not walk or bike to or from schoolOverall (n=571), Close Drivers (n=136)
Tested Infrastructure/ Enforcement Measures (Close Drivers)
Would ‘greatly increase’ likelihood of my child walking or biking for school travel…
Source: GTHA School Travel Household Attitudinal Studymetrolinx.com/en/projectsandprograms/schooltravel/ENG-2011GTHASchoolTravelStudy.pdf
14
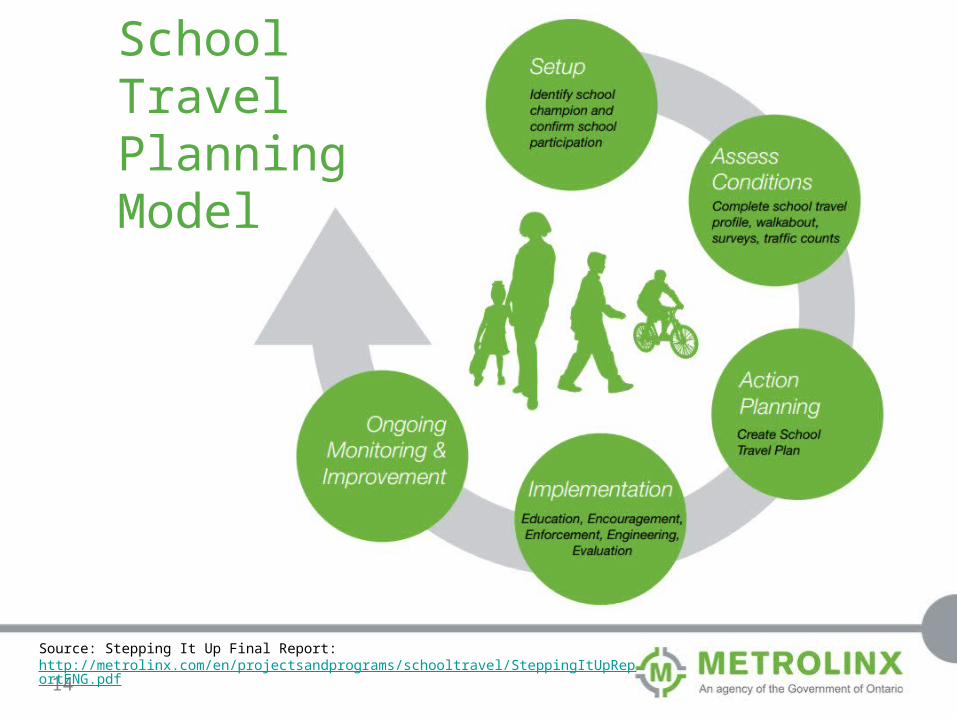
School Travel Planning Model
Source: Stepping It Up Final Report: http://metrolinx.com/en/projectsandprograms/schooltravel/SteppingItUpReportENG.pdf
15
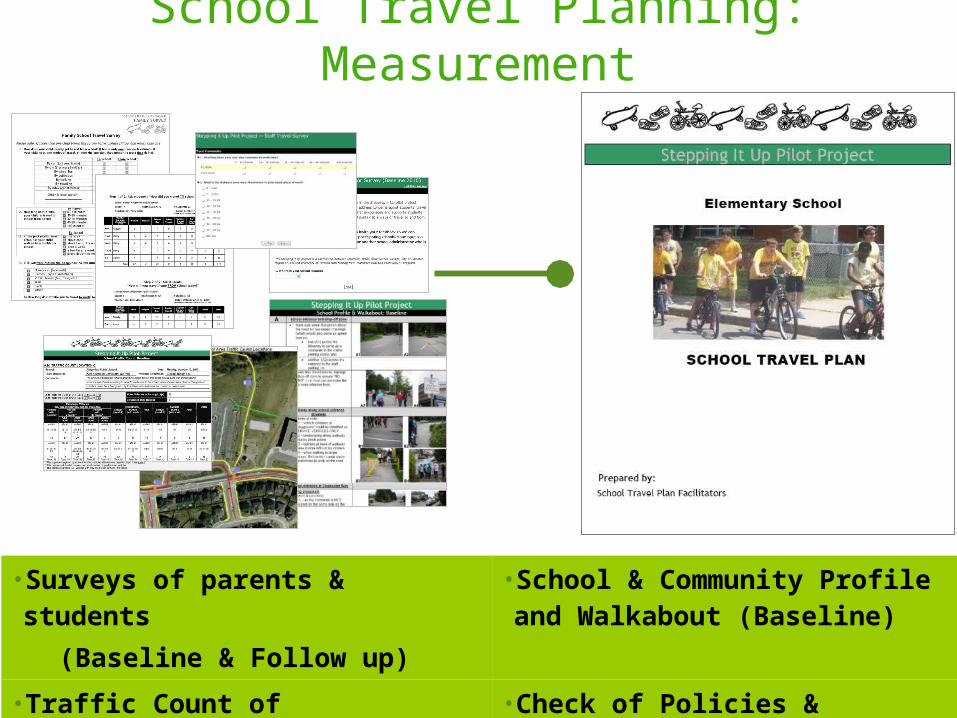
School Travel Planning: Measurement
• Surveys of parents & students (Baseline & Follow up)
• School & Community Profile and Walkabout (Baseline)
• Traffic Count of pedestrians, cars, cyclists (Baseline and Follow up)
• Check of Policies & Historic Traffic Data (Baseline)

16Source: Hinckson et al. Preventive Medicine 52 (2011) 332–336
17
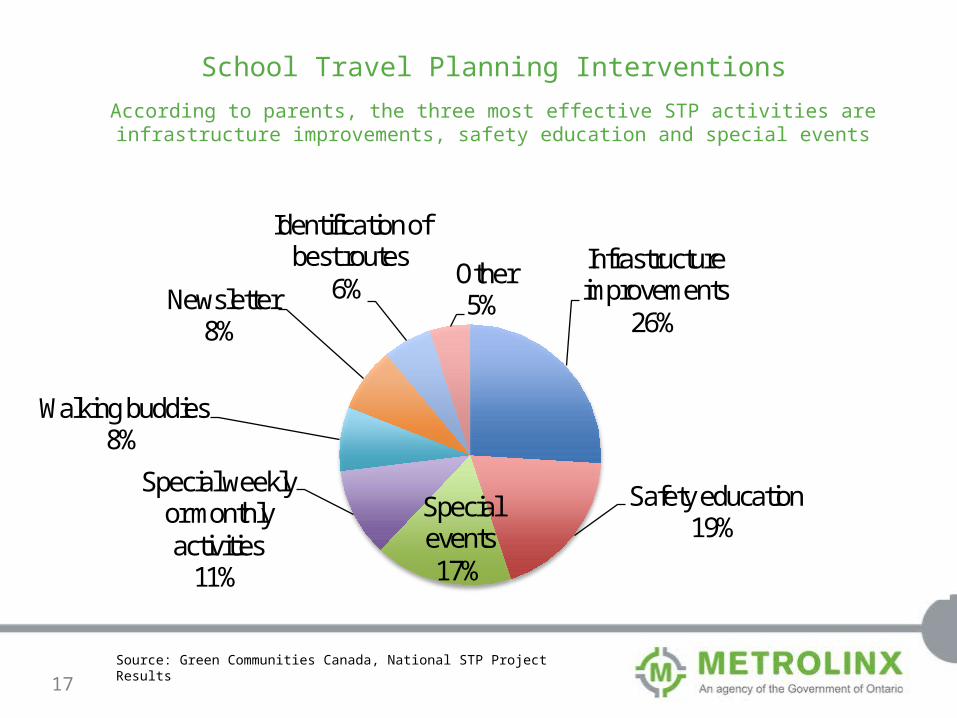
School Travel Planning Interventions
According to parents, the three most effective STP activities are infrastructure improvements, safety education and special events
Infrastructure improvements
26%
Safety education19%
Special events17%
Special weekly or monthly activities
11%
Walking buddies8%
Newsletter8%
Identification of best routes
6% Other5%
Source: Green Communities Canada, National STP Project Results
18
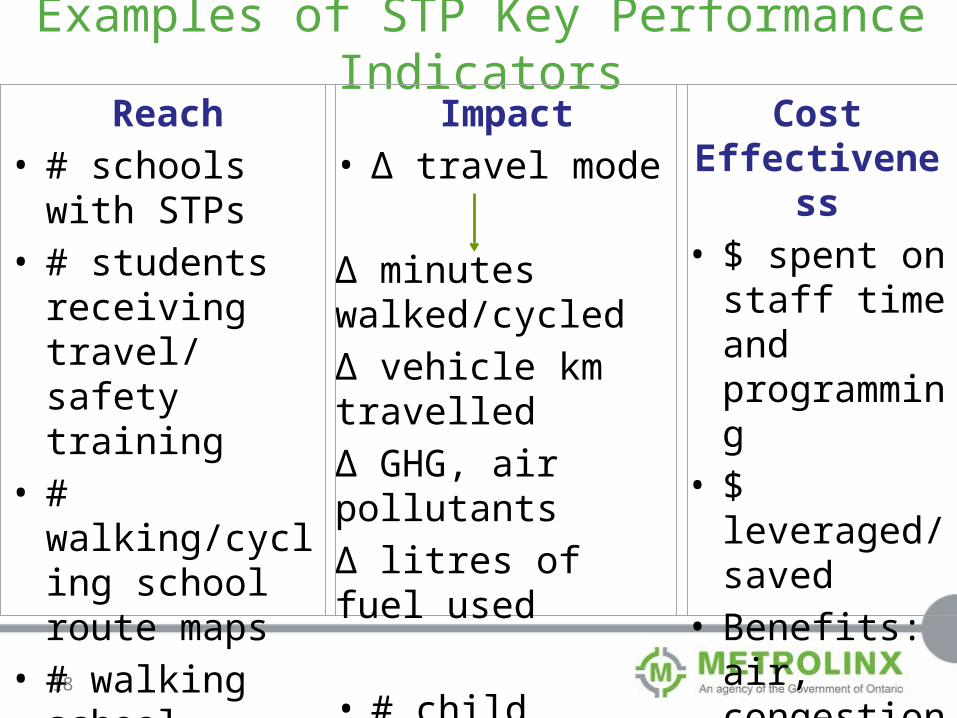
Examples of STP Key Performance IndicatorsImpact
• ∆ travel mode
∆ minutes walked/cycled∆ vehicle km travelled∆ GHG, air pollutants∆ litres of fuel used
• # child injury pedestrian collisions
Reach• # schools with STPs• # students receiving
travel/ safety training
• # walking/cycling school route maps
• # walking school buses/ park and stride programs
Cost Effectiveness
• $ spent on staff time and programming
• $ leveraged/ saved
• Benefits: air, congestion, health, safety

19
STP Results in Canada• Across 78 schools (across Canada): 17% of
families reported driving less to school and saw a decrease in traffic volume (2010-2012)1
• Across 210 schools (Quebec): schools observe 4% increase in walking/cycling; 5% decrease in auto use in one year
• Across 10 schools (GTHA): 7% decline in car trips in morning peak, increase in walking; annually: 750,000 minutes of walking added; prevented 100,000 vehicle kms, 22 tonnes GHGs, 884 kg air pollutants (2009-11)2
Sources: 1) Green Communities Canada, National STP Project Results2) Metrolinx http://metrolinx.com/en/projectsandprograms/schooltravel/SteppingItUpReportENG.pdf
20
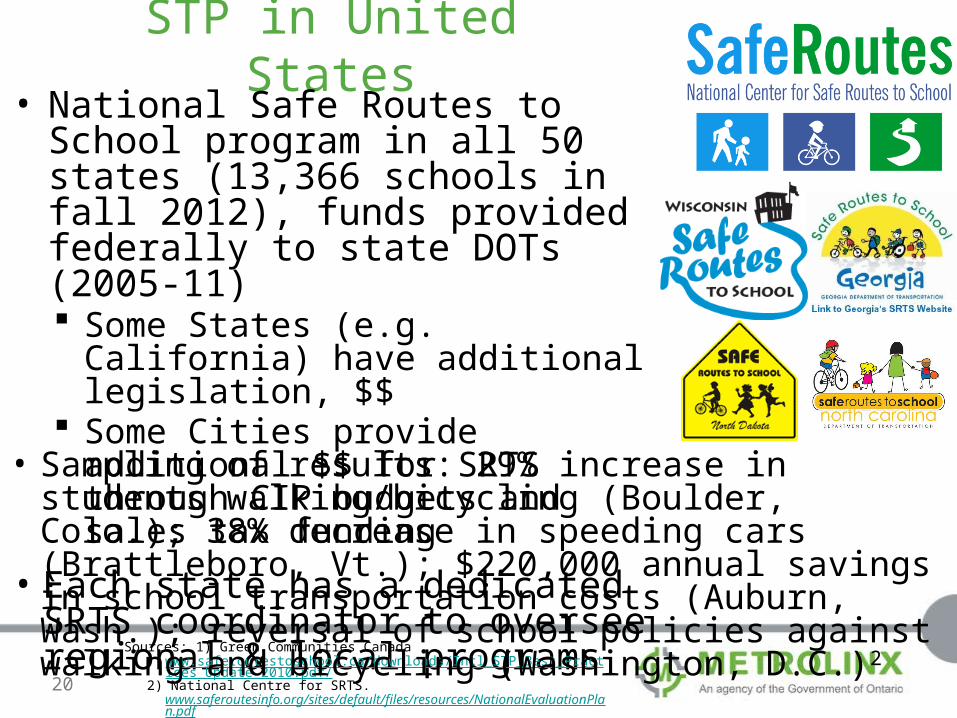
STP in United States• National Safe Routes to School program in all
50 states (13,366 schools in fall 2012), funds provided federally to state DOTs (2005-11) Some States (e.g. California) have additional
legislation, $$ Some Cities provide additional $$ for SRTS
through CIP budgets and sales tax funding
• Each state has a dedicated SRTS coordinator to oversee regional & local programs
Sources: 1) Green Communities Canada www.saferoutestoschool.ca/downloads/Intl_STP_Best_Practices_Update_2010.pdf/
2) National Centre for SRTS. www.saferoutesinfo.org/sites/default/files/resources/NationalEvaluationPlan.pdf
• Sampling of results: 29% increase in students walking/bicycling (Boulder, Colo.); 38% decrease in speeding cars (Brattleboro, Vt.); $220,000 annual savings in school transportation costs (Auburn, Wash.); reversal of school policies against walking and bicycling (Washington, D.C.)2

21
STP in New Zealand• National funding for STP since 2005• TravelWise in Auckland Region:
“By 2014 every school in Auckland region will have a school travel plan” Run by Auckland Regional Transport
Authority a regional STP Manager oversees STP Coordinators at city/local level and local council staff
Source:1) Green Communities Canada
www.saferoutestoschool.ca/downloads/Intl_STP_Best_Practices_Update_2010.pdf2) Auckland Transport:
www.aucklandtransport.govt.nz/moving-around/school-travel-plans/AboutSchoolTravel/Pages/default.aspx
Cost of STP Coordinator is $4,000-$8,000 per school (8-month period) and infrastructure ranges from $16,000-$160,000/ school plus in-kind time from teachers, parents, staff1
Results: 48% less crashes involving pedestrians around schools; car travel reduced by 4.76%; 7200 less car trips in morning peak; savings of 2.5M vehicle kms, $20.35M/yr on congestion, 150,000L on fuel, and 735 less tonnes of CO2/yr
22
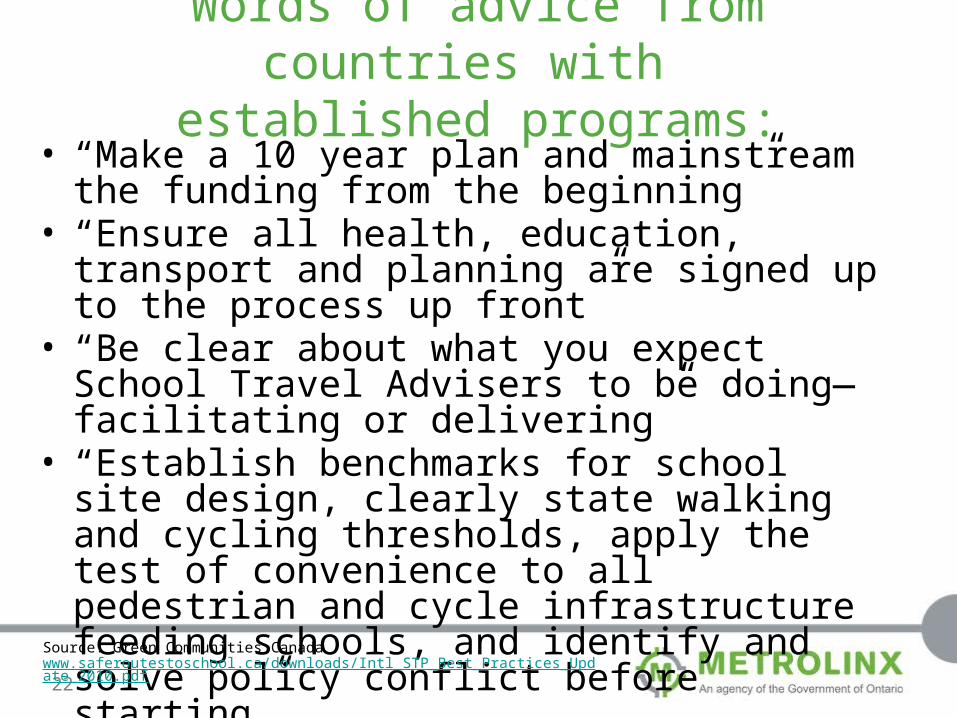
Words of advice from countries with established programs:
• “Make a 10 year plan and mainstream the funding from the beginning”
• “Ensure all health, education, transport and planning are signed up to the process up front”
• “Be clear about what you expect School Travel Advisers to be doing—facilitating or delivering”
• “Establish benchmarks for school site design, clearly state walking and cycling thresholds, apply the test of convenience to all pedestrian and cycle infrastructure feeding schools, and identify and solve policy conflict before starting”
Source: Green Communities Canada www.saferoutestoschool.ca/downloads/Intl_STP_Best_Practices_Update_2010.pdf

23
Some Foundations for Measurably Shifting School Travel Behaviour
• strong approach to infrastructure measures for pedestrian & cyclist safety• compulsory road safety & cycling education for children • conducting national/ regional road safety campaigns at least once a year • speed reduction measures, including physical traffic calming & very low
speed limits around schools• legislation that assumes driver responsibility in an accident involving a
child pedestrian • commissioned research on child pedestrian & cyclist safety• support for a range of child pedestrian & cyclist safety initiatives• policies aimed at promoting active travel and making it safer
Source: Green Communities Canada www.saferoutestoschool.ca/downloads/Intl_STP_Best_Practices_Update_2010.pdf

24
Lessons for School Travel Initiatives in GTHA and Canada
• Evidence of demand among parents (the ‘decision-makers’) for initiatives in support of active and sustainable school travel
• Identification of important target segments for school travel initiatives• Highlights need for:
Continued work on the ground with schools Outreach through parents associations and forums Combination of supportive programs, services, infrastructure
stemming from purposeful policy, planning Coordinated initiatives at all levels: municipal and school board,
regional, provincial, national

25
Thank you!
Jennifer LayProgram Advisor - School Travel [email protected] www.metrolinx.com/schooltravel