1 London 10 August 2006 Interim Results 6 months ended 30 June 2006.
39
1 London 10 August 2006 Interim Results 6 months ended 30 June 2006
-
Upload
clementine-oconnor -
Category
Documents
-
view
217 -
download
0
Transcript of 1 London 10 August 2006 Interim Results 6 months ended 30 June 2006.

1
London10 August 2006
Interim Results6 months ended 30 June 2006

2
Philip CoxChief Executive Officer

3
Highlights Strong financial performance
– profit from operations of £392m up 69% (H1 2005: £232m)
– EPS of 11.9p - up 83% (H1 2005: 6.5p)
Significant growth in European earnings– key drivers - Saltend (acquired in H2 2005)– higher earnings at First Hydro, Rugeley & IPO (Czech
Republic)
Continued improvement in US earnings – particularly Texas Free cash flow doubled
– £268m up from £134m in H1 2005
Coleto Creek acquisition (Texas) complete Expect 2006 to be a year of strong growth

4
Mark WilliamsonChief Financial Officer
Financial Review

5
All numbers exclude exceptional items and specific IAS39 mark to market movements
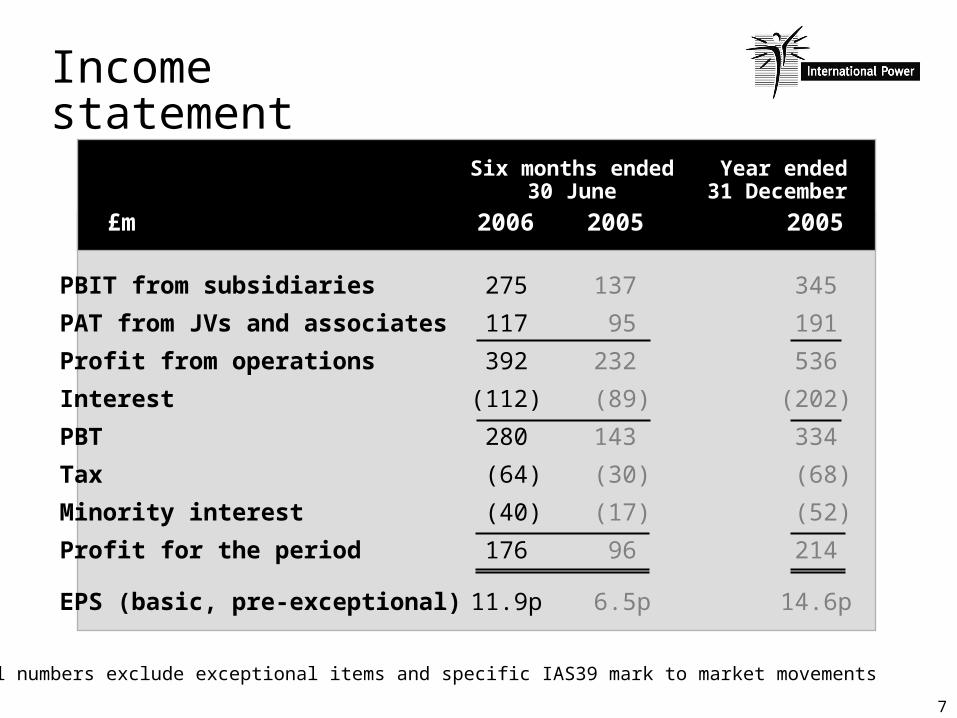
Income statement
Six months ended 30 June
20052006£m
Year ended31 December
2005
PBIT from subsidiaries
PAT from JVs and associates
Profit from operations
Interest
PBT
Tax
Minority interest
Profit for the period
EPS (basic, pre-exceptional)
137
95
232
(89)
143
(30)
(17)
96
6.5p
345
191
536
(202)
334
(68)
(52)
214
14.6p
275
117
392
(112)
280
(64)
(40)
176
11.9p

6
Effective tax rate and interest cover
Six months ended 30 June
20052006£m
Year ended31 December
2005
PBIT from subsidiaries
PBIT from JVs and associates
PBIT
Total interest*Interest cover
Profit before total tax
Total tax*
Effective tax rate*
137
172
309
(140) 2.2x
169
(55)
33%
345
342
687
(299) 2.3x
388
(121)
31%
275
191
466
(156) 3.0x
310
(94)
30%
*Includes tax and interest charges for subsidiaries and JVs and associates
7
Income statement
All numbers exclude exceptional items and specific IAS39 mark to market movements
Six months ended 30 June
20052006£m
Year ended31 December
2005
PBIT from subsidiaries
PAT from JVs and associates
Profit from operations
Interest
PBT
Tax
Minority interest
Profit for the period
EPS (basic, pre-exceptional)
137
95
232
(89)
143
(30)
(17)
96
6.5p
345
191
536
(202)
334
(68)
(52)
214
14.6p
275
117
392
(112)
280
(64)
(40)
176
11.9p
8
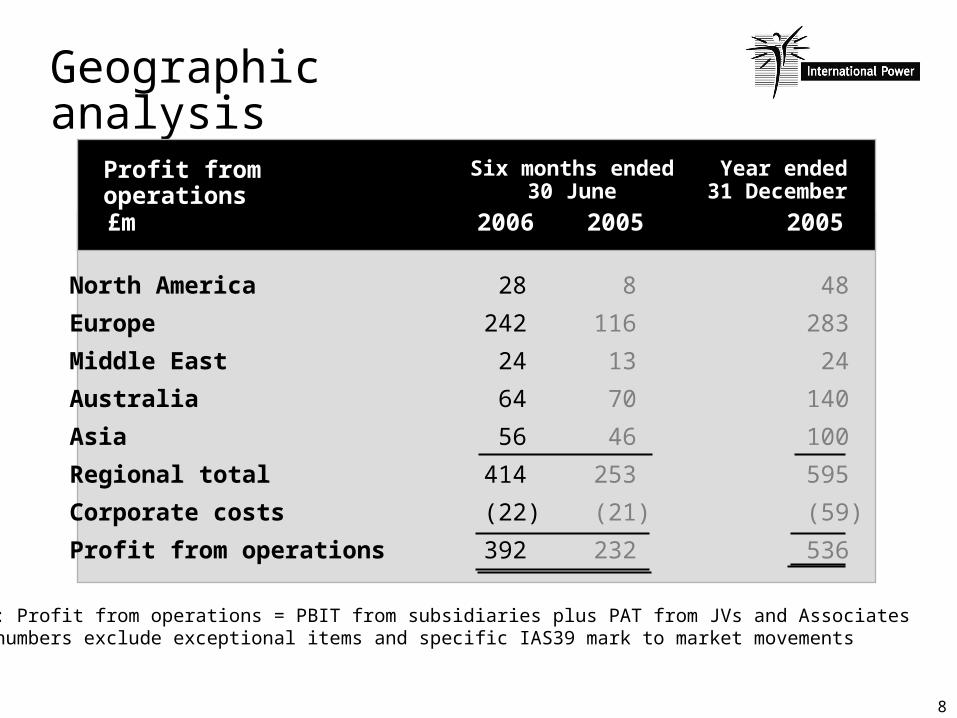
Geographic analysis
Six months ended 30 June
20052006£m
Year ended31 December
2005
North America
Europe
Middle East
Australia
Asia
Regional total
Corporate costs
Profit from operations
8
116
13
70
46
253
(21)
232
48
283
24
140
100
595
(59)
536
28
242
24
64
56
414
(22)
392
Note: Profit from operations = PBIT from subsidiaries plus PAT from JVs and AssociatesAll numbers exclude exceptional items and specific IAS39 mark to market movements
Profit from operations
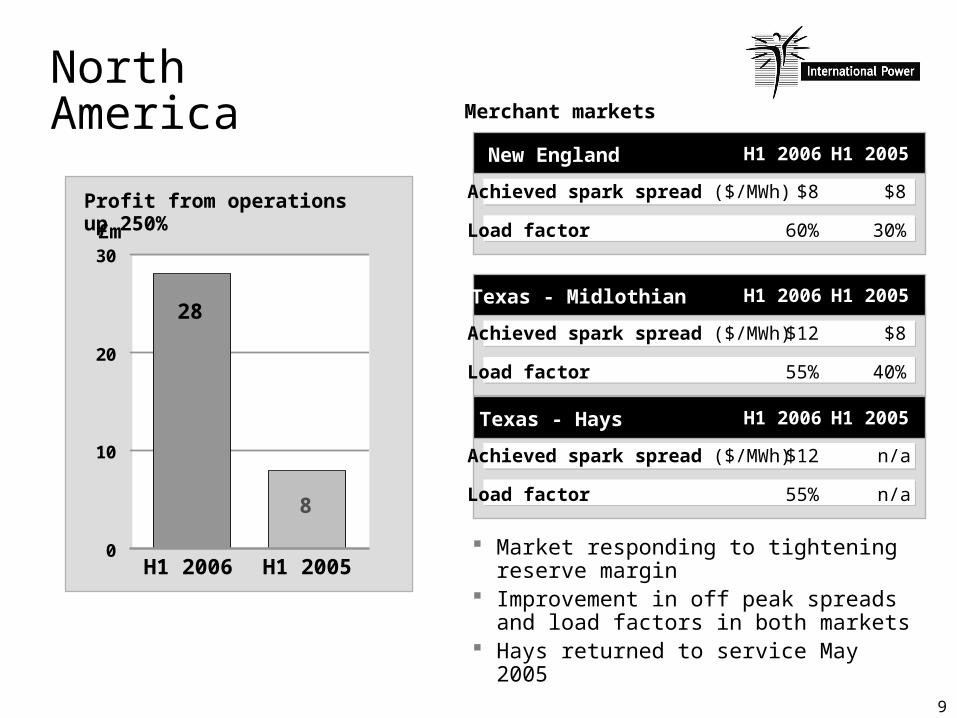
9
0
10
20
30
8
28
North America
Market responding to tightening reserve margin
Improvement in off peak spreads and load factors in both markets
Hays returned to service May 2005
H1 2006 H1 2005
Profit from operations up 250%£m
Achieved spark spread ($/MWh)
Load factor
New England H1 2006
$8
60%
$8
30%
H1 2005
Achieved spark spread ($/MWh)
Load factor
Texas - Midlothian H1 2006
$12
55%
$8
40%
H1 2005
Achieved spark spread ($/MWh)
Load factor
Texas - Hays H1 2006
$12
55%
n/a
n/a
H1 2005
Merchant markets
10
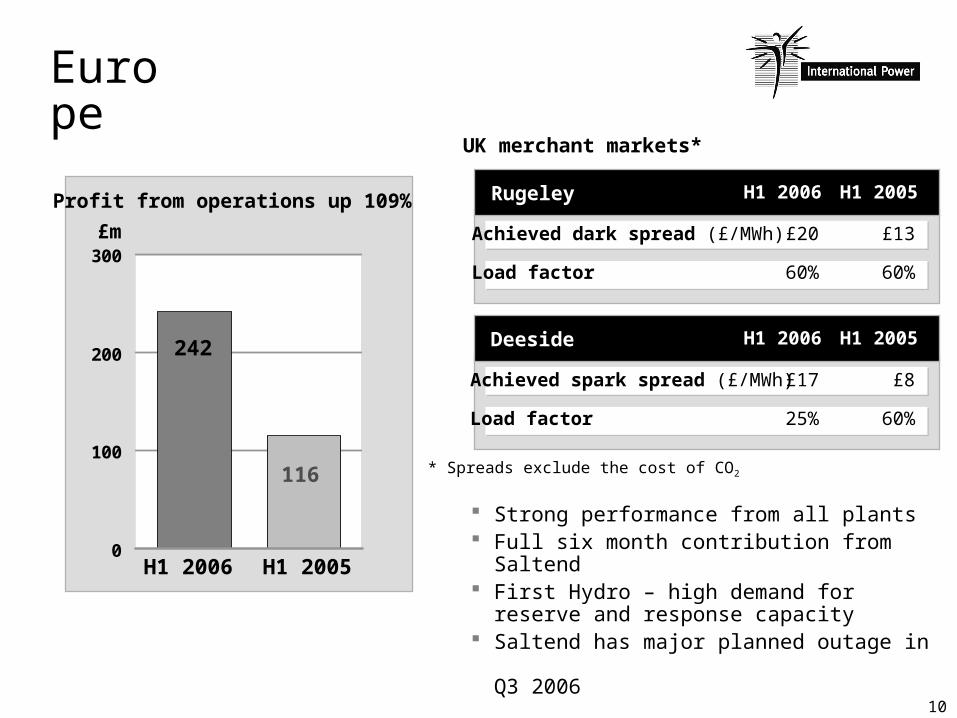
Europe
0
100
200
300
116
242
Profit from operations up 109%
£m Achieved dark spread (£/MWh)
Load factor
Rugeley H1 2006
£20
60%
£13
60%
H1 2005
Achieved spark spread (£/MWh)
Load factor
Deeside H1 2006
£17
25%
£8
60%
H1 2005
UK merchant markets*
* Spreads exclude the cost of CO2
Strong performance from all plants Full six month contribution from
Saltend First Hydro – high demand for
reserve and response capacity Saltend has major planned outage in
Q3 2006
H1 2006 H1 2005
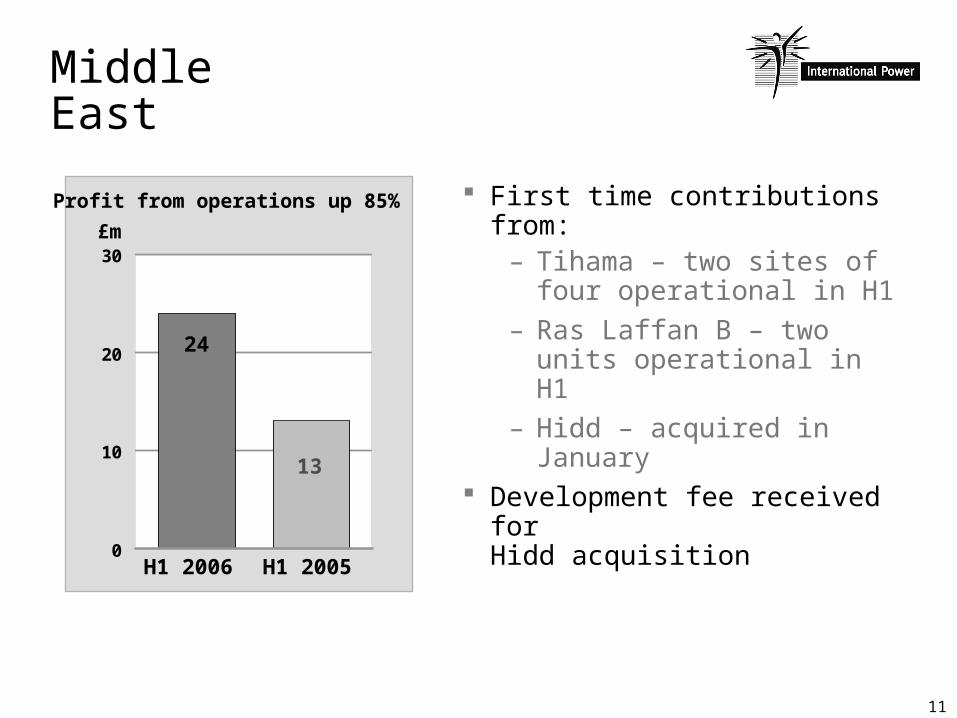
11
Middle East
0
10
20
30
13
24
Profit from operations up 85%
£m
First time contributions from:
– Tihama – two sites of four operational in H1
– Ras Laffan B – two units operational in H1
– Hidd – acquired in January
Development fee received for Hidd acquisition H1 2006 H1 2005

12
Australia
0
20
40
60
80
7064
Profit from operations down 9%
£m
Achieved price (A$/MWh)
Load factor
Hazelwood H1 2006
A$33
75%
A$36
80%
H1 2005
Merchant markets
Higher availability at Loy Yang B
Hazelwood contracts placed in prior years roll off
Loy Yang B refinancing improves debt amortisation profile
H1 2006 H1 2005
13
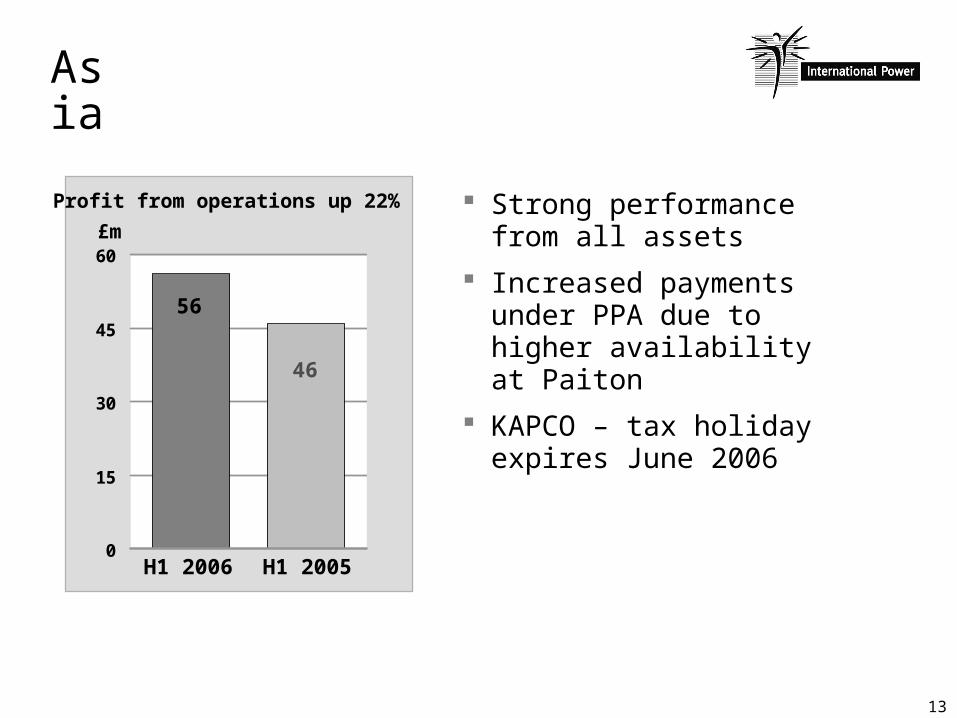
Asia
0
15
30
45
60£m
46
56
Profit from operations up 22% Strong performance from all assets
Increased payments under PPA due to higher availability at Paiton
KAPCO – tax holiday expires June 2006
H1 2006 H1 2005
14
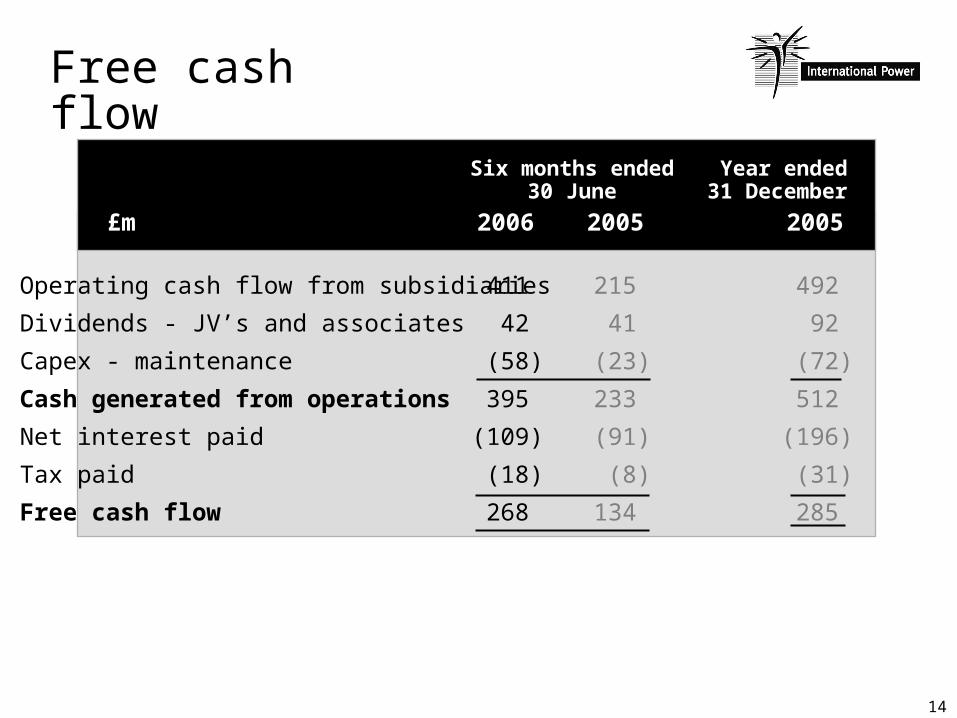
Free cash flow
Six months ended 30 June
20052006£m
Year ended31 December
2005
Operating cash flow from subsidiaries
Dividends - JV’s and associates
Capex - maintenance
Cash generated from operations
Net interest paid
Tax paid
Free cash flow
215
41
(23)
233
(91)
(8)
134
492
92
(72)
512
(196)
(31)
285
411
42
(58)
395
(109)
(18)
268

15
Movement in net debt
Six months ended 30 June
20052006£m
Year ended31 December
2005
Free cash flowGrowth capexAcquisitions, disposals & investmentsTXU recovery - exceptional Receipt of compensation - exceptional Refinancing costs - exceptional Funding from minorities, FX & otherDecrease/(increase) in net debtOpening external debtTransitional IAS32/39 adjustmentAcquired cash Closing net debt
134 (95)102
44 - -
(115)70
(2,745)44 -
(2,631)
285 (188)(360)
58 -
(5)(95)
(305)(2,745)
44 27
(2,979)
268 (52)(10)14
5 -
51 276
(2,979)- -
(2,703)
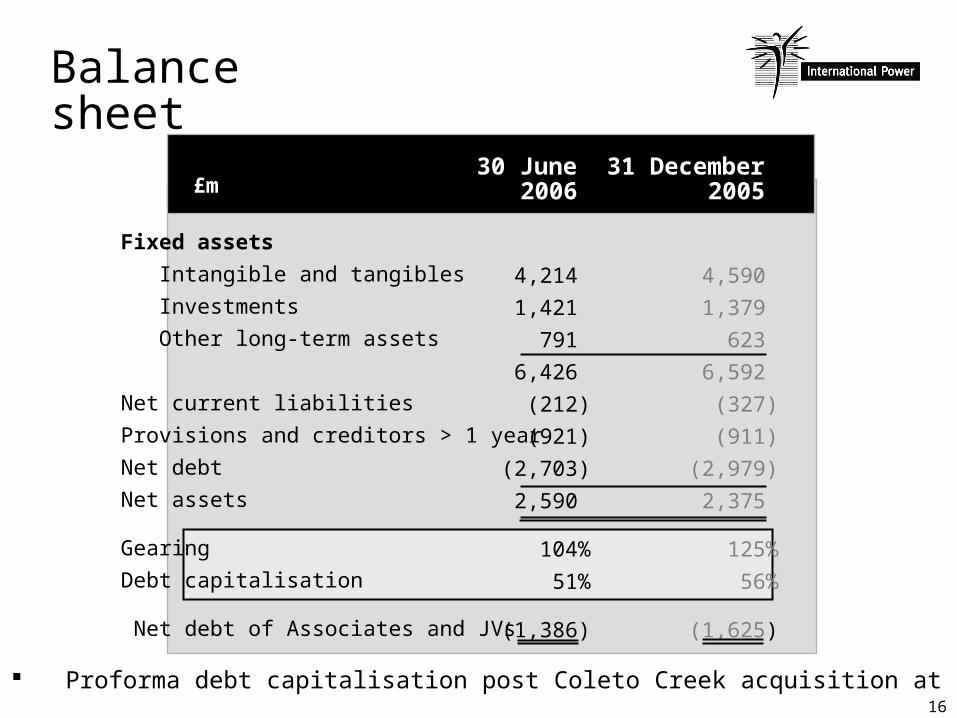
16
Balance sheet
Fixed assets
Intangible and tangibles
Investments
Other long-term assets
Net current liabilities
Provisions and creditors > 1 year
Net debt
Net assets
Gearing
Debt capitalisation
Net debt of Associates and JVs
4,214
1,421
791
6,426
(212)
(921)
(2,703)
2,590
104%
51%
(1,386)
4,590
1,379
623
6,592
(327)
(911)
(2,979)
2,375
125%
56%
(1,625)
2006£m 200531
December30 June
Proforma debt capitalisation post Coleto Creek acquisition at 56%
17
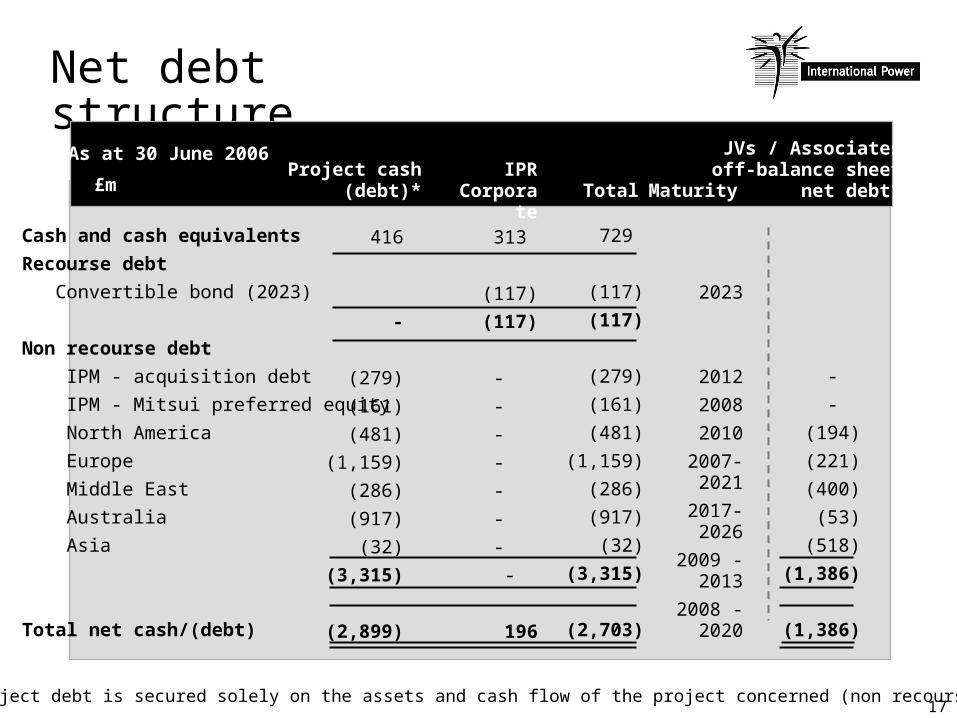
Net debt structure
Cash and cash equivalents
Recourse debt
Convertible bond (2023)
Non recourse debt
IPM - acquisition debt
IPM - Mitsui preferred equity
North America
Europe
Middle East
Australia
Asia
Total net cash/(debt)
729
(117)
(117)
(279)
(161)
(481)
(1,159)
(286)
(917)
(32)
(3,315)
(2,703)
Total£mIPR
Corporate
* Project debt is secured solely on the assets and cash flow of the project concerned (non recourse)
As at 30 June 2006Project cash
(debt)*
313
(117)
(117)
-
-
-
-
-
-
-
-
196
416
-
(279)
(161)
(481)
(1,159)
(286)
(917)
(32)
(3,315)
(2,899)
JVs / Associatesoff-balance sheet
net debt*
-
-
(194)
(221)
(400)
(53)
(518)
(1,386)
(1,386)
Maturity
2023
2012
2008
2010
2007- 2021
2017- 2026
2009 - 2013
2008 - 2020

18
Corporate liquidity - proforma
Cash and cash equivalents
Recourse debt
Convertible bond (2023)
Convertible bond (2013)
Non recourse debt
IPM - acquisition debt
IPM - Mitsui preferred equity
North America
Europe
Middle East
Australia
Asia
Corporate net cash/ (debt)
£mConverti
ble Bond
IPRCorporate
30 June 2006
313
(117)
-
(117)
-
-
-
-
-
-
-
-
196
ColetoCreek Proforma
159
-
(159)
(159)
-
-
-
-
-
-
-
-
-
(160)
-
-
-
-
-
-
-
-
-
-
-
(160)
312
(117)
(159)
(276)
-
-
-
-
-
-
-
-
36
Maintains liquidity at Corporate post Coleto Creek
Accesses convertible market at opportune time
Achieved low coupon (3.25%) and high conversion price (391p/share)
Issue of Convertible bond

19
Financing activity Loy Yang B refinancing (March 2006)
– replaced amortising tranche with a bullet repayment, improving project distributions
– decrease in margins – A$617m, 6 year term
Hidd financing (April 2006)– acquisition and construction facility– US$990m, 20 year term
Pego refinancing (June 2006)– eliminates cash sweep and extends term, improving project
distributions – FGD construction facility included – €646m, 14 year term
Coleto Creek financing (July 2006)– acquisition facility - US$935m, 7 year term – also US$230m letter of credit/working capital facilities
Convertible bond (July 2006)– replenished corporate funds following acquisition of Coleto Creek – Coupon rate of 3.25% and conversion price of 391p– €230m, 7 year term
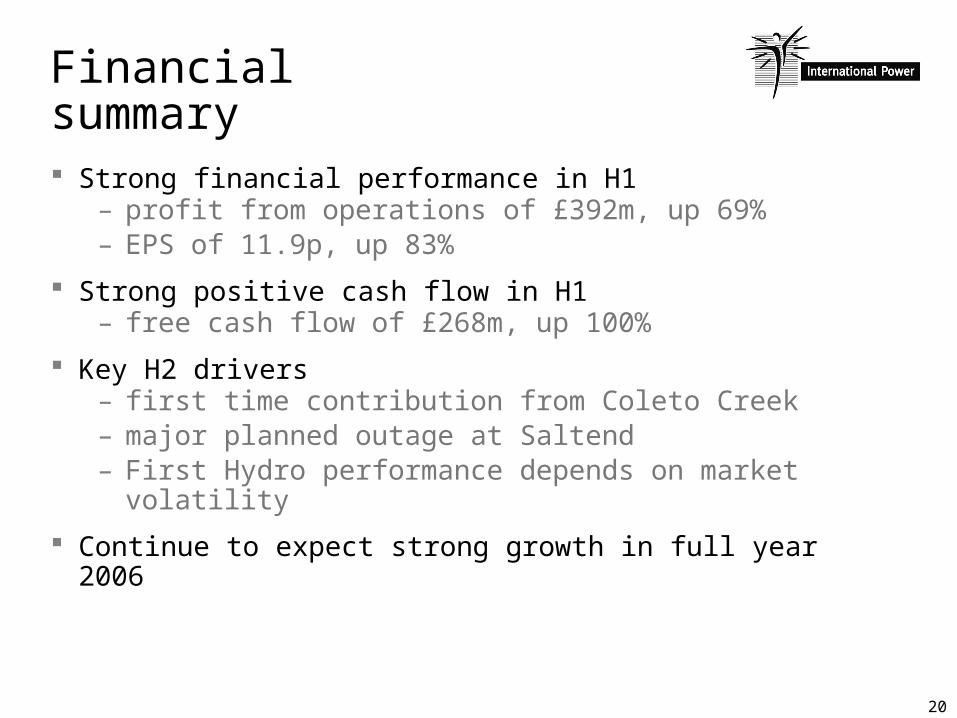
20
Financial summary Strong financial performance in H1
– profit from operations of £392m, up 69% – EPS of 11.9p, up 83%
Strong positive cash flow in H1 – free cash flow of £268m, up 100%
Key H2 drivers– first time contribution from Coleto Creek – major planned outage at Saltend– First Hydro performance depends on market
volatility
Continue to expect strong growth in full year 2006

21
Philip CoxChief Executive Officer

22
Texas Commercial update Strong demand growth
– new peak demand of 62,396 MW – up 3.5% on 2005
5,500 MW of mothballed capacity unlikely to return
– 1,100 MW of mothballed plant recently approved for retirement
New proposed capacity – required to maintain
sufficient reserve margin
– will offset retirement of mothballed units
We remain confident of market recovery
Achieved spark spread ($/MWh)
Load factor
Forward contracted
Texas - North Zone 2005
12
55%
n/a
16
55%
85%
2006
Achieved spark spread ($/MWh)
Load factor
Forward contracted
Texas - South Zone 2005
11
65%
n/a
14
50%
85%
2006 (1)
IPR forecast
% of anticipated output for the full year
Hays was mothballed till May 2005
(2)
(2)
(3)
(1)
(2)
Full Year
Full Year
(3)
(1)
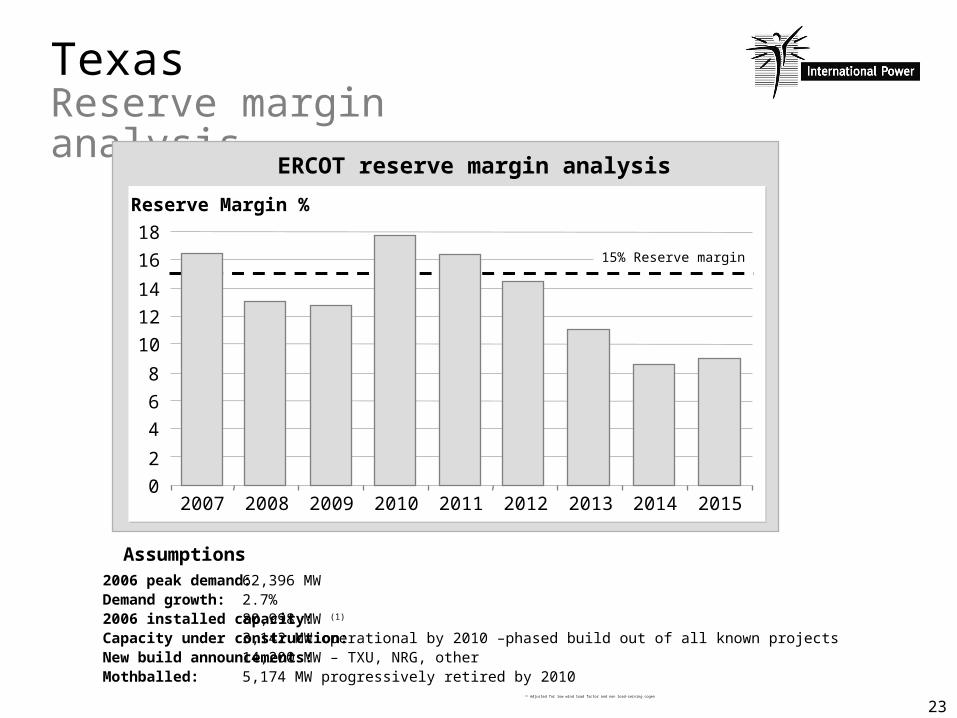
23
Texas Reserve margin analysis
ERCOT reserve margin analysis
0
2
4
6
8
10
12
14
16
18
2007 2008 2009 2010 2011 2012 2013 2014 2015
Reserve Margin %
15% Reserve margin
(1) Adjusted for low wind load factor and non load-serving cogen
2006 peak demand:Demand growth:2006 installed capacity:Capacity under construction:New build announcements:Mothballed:
62,396 MW2.7% 80,998 MW (1)
3,142 MW operational by 2010 –phased build out of all known projects 14,200 MW – TXU, NRG, other5,174 MW progressively retired by 2010
Assumptions

24
Coleto CreekAcquisition highlights Acquisition successfully completed in July 632 MW Pulverized Coal Unit
– located in ERCOT – South Zone
Purchase price $1.14 billion– 75:25 debt equity ratio– financing package supports favourable equity return– includes significant collateral support
Attractive long-term return and immediately earnings and free cash flow enhancing
Earnings and cash flow secured through long-term contracts
– 90% contracted through to 2009– 75% contracted in 2010– 50% contracted from 2011 to mid 2013

25
Access to low cost and low sulphur coal from Powder River Basin (PRB)
– a clear economic advantage– coal transportation agreement in place till 2012
Investing in emission control system to enable 100% use of PRB coal
– good for compliance under future mercury emission standards
Acquisition provides fuel diversity and expanded presence in Texas
– immediate access to Texas market recovery
Option to expand– site designed to accommodate a second 600 MW plant
Coleto CreekAcquisition highlights
26
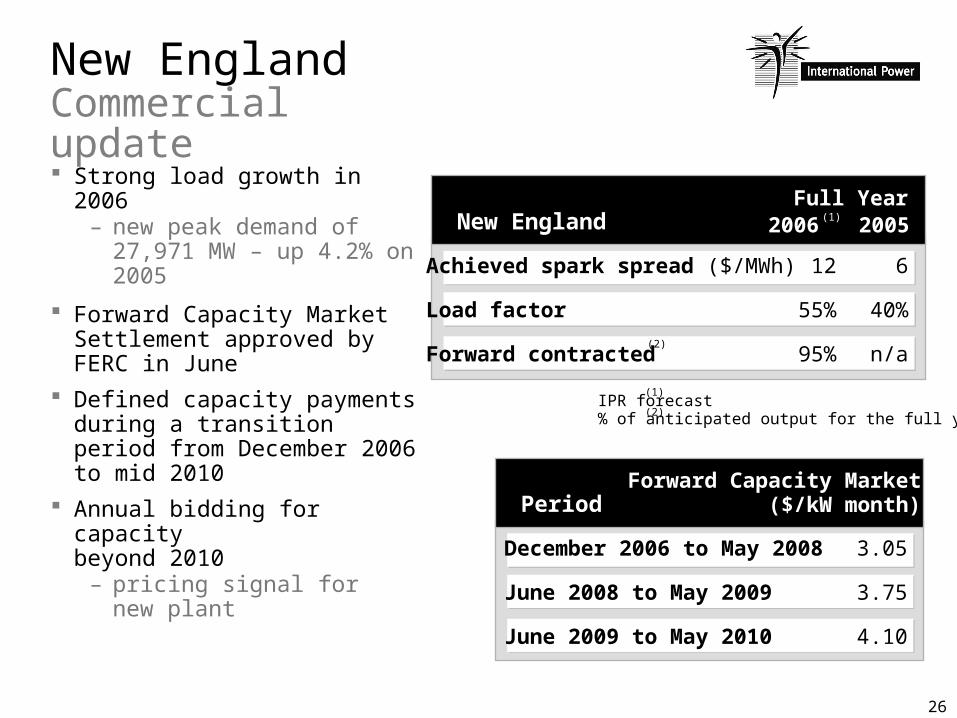
New EnglandCommercial update Strong load growth in 2006
– new peak demand of 27,971 MW – up 4.2% on 2005
Forward Capacity Market Settlement approved by FERC in June
Defined capacity payments during a transition period from December 2006 to mid 2010
Annual bidding for capacity
beyond 2010– pricing signal for
new plant
IPR forecast% of anticipated output for the full year
Achieved spark spread ($/MWh)
Load factor
Forward contracted
2005
6
40%
n/a
12
55%
95%
2006 New England
(2)
Full Year
December 2006 to May 2008
June 2008 to May 2009
June 2009 to May 2010
3.05
3.75
4.10
Forward Capacity Market($/kW month)Period
(1)
(2)
(1)
27
Europe
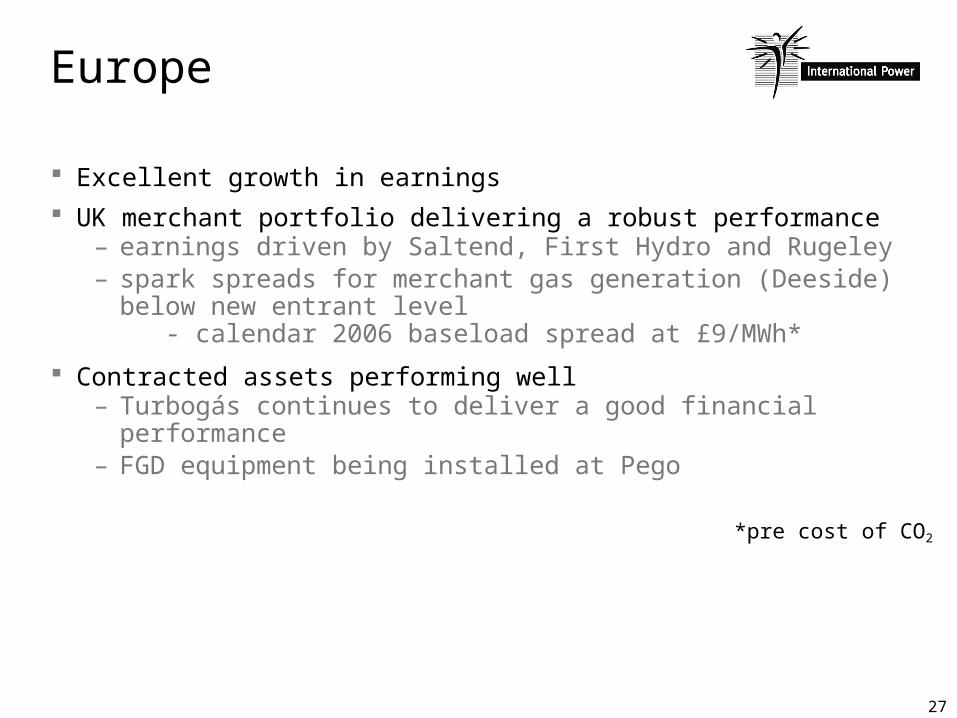
Excellent growth in earnings UK merchant portfolio delivering a robust performance
– earnings driven by Saltend, First Hydro and Rugeley – spark spreads for merchant gas generation (Deeside)
below new entrant level - calendar 2006 baseload spread at £9/MWh*
Contracted assets performing well– Turbogás continues to deliver a good financial
performance– FGD equipment being installed at Pego
*pre cost of CO2
28
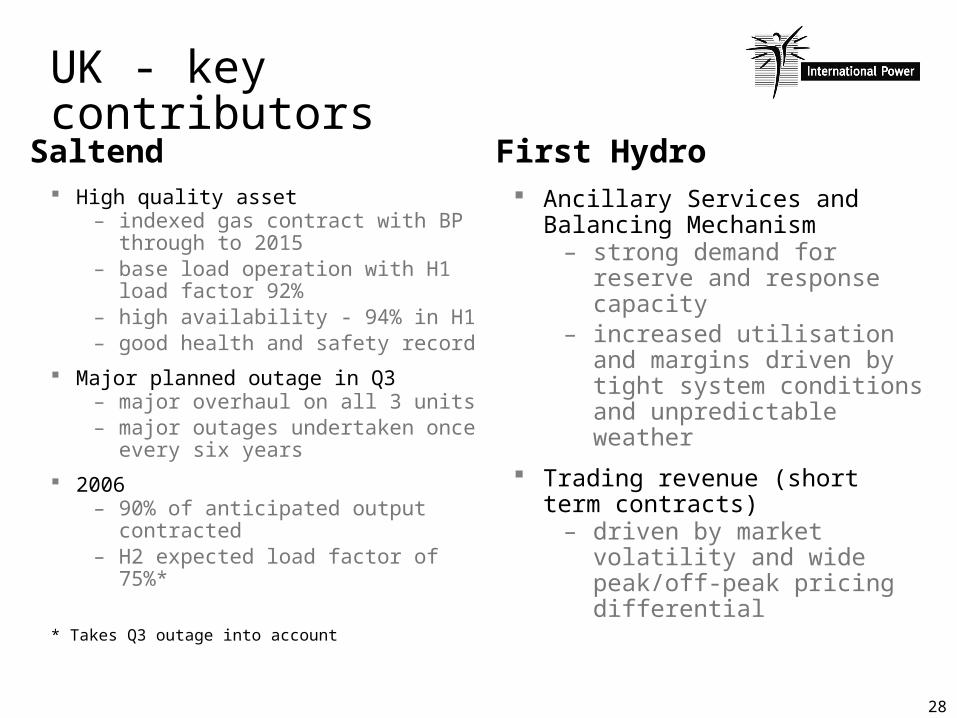
UK - key contributors
High quality asset– indexed gas contract with BP
through to 2015– base load operation with H1
load factor 92%– high availability - 94% in H1– good health and safety record
Major planned outage in Q3– major overhaul on all 3 units– major outages undertaken
once every six years
2006– 90% of anticipated output
contracted– H2 expected load factor of
75%*
* Takes Q3 outage into account
Ancillary Services and Balancing Mechanism
– strong demand for reserve and response capacity
– increased utilisation and margins driven by tight system conditionsand unpredictable weather
Trading revenue (short term contracts)
– driven by market volatility and wide peak/off-peak pricing differential
Saltend First Hydro
29
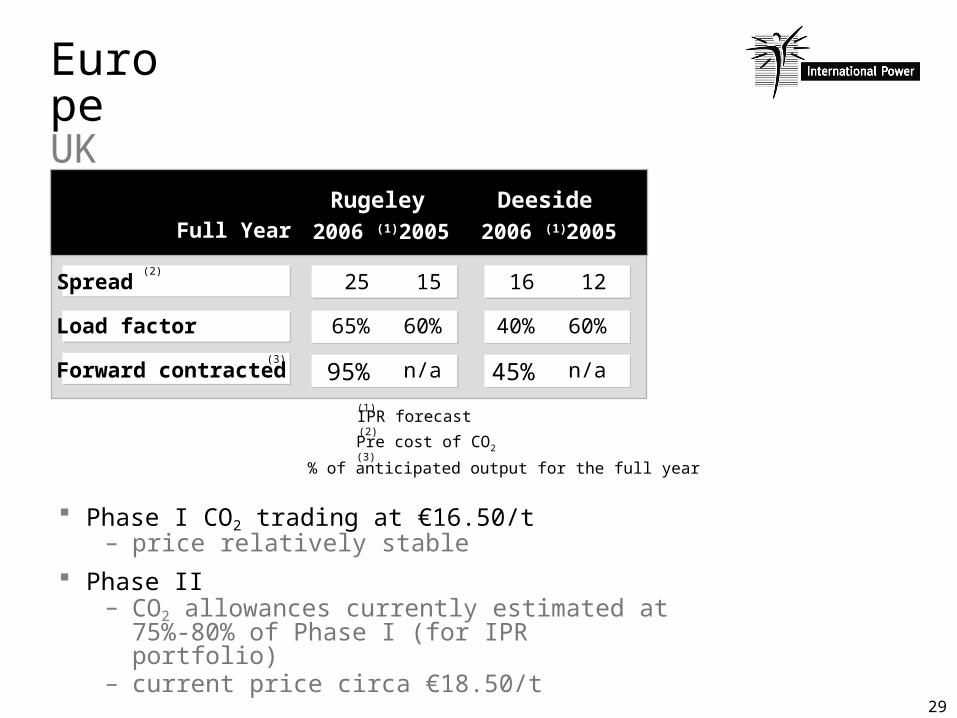
EuropeUK
Spread
Load factor
Forward contracted
16
40%
45%
12
60%
n/a
Rugeley Deeside2005
25
65%
95%
15
60%
n/a
2006 (1)
Phase I CO2 trading at €16.50/t– price relatively stable
Phase II– CO2 allowances currently estimated at
75%-80% of Phase I (for IPR portfolio)– current price circa €18.50/t
20052006 (1)
% of anticipated output for the full year
(2)
(3)
Full Year
(2)
Pre cost of CO2
(1)IPR forecast
(3)

30
Middle East
Construction programme on plan– 600 MW operational at Ras Laffan B, Qatar– 616 MW in operation at Tihama Power– UAN extension to commence operation in Q3 2006– Hidd desalination expansion on track
Continue to see pipeline of further projects– 2 bids currently under evaluation (decisions expected
Q3 2006) - 2,000 MW Mesaieed IPP, Qatar - 2,500 MW, 185 MIGD Marafiq IWPP, Saudi Arabia - future pipeline remains strong

31
4 cogeneration facilities supplying power and steam to Saudi Aramco
– under 20 year Build Own Operate Transfer, Energy Conversion Agreement
Major construction management project for IPR– single turnkey Engineer Procure Construct (EPC) contract
with Mitsui for all four plants
– 3,000 people at work during peak construction period
International Power - value addition through an active role– led $640 million project financing– O&M service provider + 20 year technical services
agreement - generating additional revenue– recruited and trained operational staff from the Middle East
and Asia
Tihama Power - a solid platform for future growth in Saudi Arabia
Middle EastTihama - a successful launch in Saudi Arabia
32
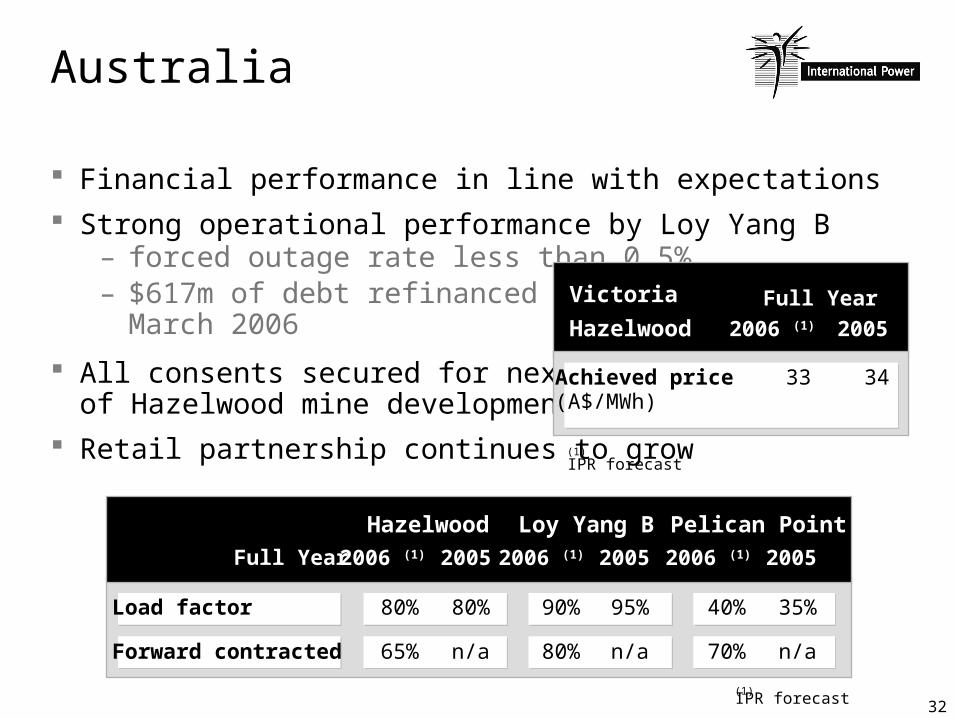
Australia
Financial performance in line with expectations Strong operational performance by Loy Yang B
– forced outage rate less than 0.5%– $617m of debt refinanced in
March 2006
All consents secured for next phase of Hazelwood mine development
Retail partnership continues to grow
Achieved price (A$/MWh)
Victoria
Hazelwood 2006 (1)
33 34
2005
Load factor
Forward contracted
2006 (1)
80%
n/a
80%
65%
20052006 (1)
95%
n/a
90%
80%
2005
Hazelwood Loy Yang B2006 (1)
35%
n/a
40%
70%
2005
Pelican Point
Full Year
Full Year
(1)IPR forecast
(1)IPR forecast

33
Australia
Base-load (and peak) prices show modest increases Recent rise predominantly driven by robust winter demand
during 2006
31
3335
3739
41
4345
4749
51
A$/MWh
January2006
Q1 2007
Calendar 2007
Victoria Baseload Power
February March April May June July

34
Asia
Strong operational performance at Paiton– high availability triggered incentive payments
TNP (Thailand) - 23 MW - plant expansion on track for completion in Q4 2006
High levels of generation at IPR’s assets in Pakistan – driven by high demand and low availability of hydro– Hubco - direct transmission connection to Karachi
load centre operational since May 2006
Malakoff – update– MMC offer - opportunity to monetise investment– offer at RM10.35 per share equates to £250m for IPR– completion expected in Q2 2007
- subject to shareholder, regulatory and other approvals

35
Summary and outlook
Portfolio performing well Improving returns in key merchant markets of the US
and the UK Coleto Creek acquired and integrated Earnings underpinned by free cash flow We expect 2006 to be a year of strong growth

36
Interim Results6 months ended 30 June 2006

37
Appendix

38
Updated Asset List

39
IAS 39 regional analysis
Six months ended 30 June
20052006£m
Year ended31 December
2005
North America
Europe
Middle East
Australia
Asia
Specific IAS39 impact on PFO
-
(4)
-
1
-
(3)
1
(23)
-
(15)
2
(35)
(2)
43
-
6
-
47
IAS 39 impact
Specific IAS39 mark to market movements on economic hedge contracts are presented separately to allow an understanding of the underlying business performance
Specific IAS39 movements are presented separately where own use treatment could not be applied, cash flow hedging could not be achieved or has not been applied
Mark to Market movements relating to proprietary trading activities continue to be included within the underlying business results.