1. Logistics & Supply Chain Management 2. Customer … · Customer Centric Reconfiguration 3....
92
AF Conf LOA Q415sjh92 AGENDA 1. Logistics & Supply Chain Management 2. Customer Centric Reconfiguration 3. Performance Metrics 4. Way Ahead in Logistics 5. Performance Improvements Winning with Logistics
-
Upload
nguyenmien -
Category
Documents
-
view
213 -
download
0
Transcript of 1. Logistics & Supply Chain Management 2. Customer … · Customer Centric Reconfiguration 3....

AF Conf LOA Q415sjh92
AGENDA
1. Logistics & Supply Chain Management
2. Customer Centric Reconfiguration
3. Performance Metrics
4. Way Ahead in Logistics
5. Performance Improvements
Winning with Logistics

AF Conf LOA Q415sjh92
LOGISTICS is the work required to efficiently and cost effectivelymove and position inventory throughout a supply chain
Best use of Resources - to move, store and apply supply chain materials

AF Conf LOA Q415sjh92
Blame and Punish
Customer Service Desk
It’s Your Fault I don’t Care
Dysfunctional Workgroup
SUPPLY CHAIN MANAGEMENT – consists of teamwork and partnering to leverage strategic advantage and to improve operating efficiency
SCM Enterprise-wide Collaboration
Technology Teamwork
Talent

AF Conf LOA Q415sjh92
• SCM Scope, Accountabilities & Importance
• Common Primary Goals & Key Differences
• Generic Processes & Supply Chains
Winning with Logistics
Logistics & Supply Chain Management
1.
AF Conf LOA Q415sjh92
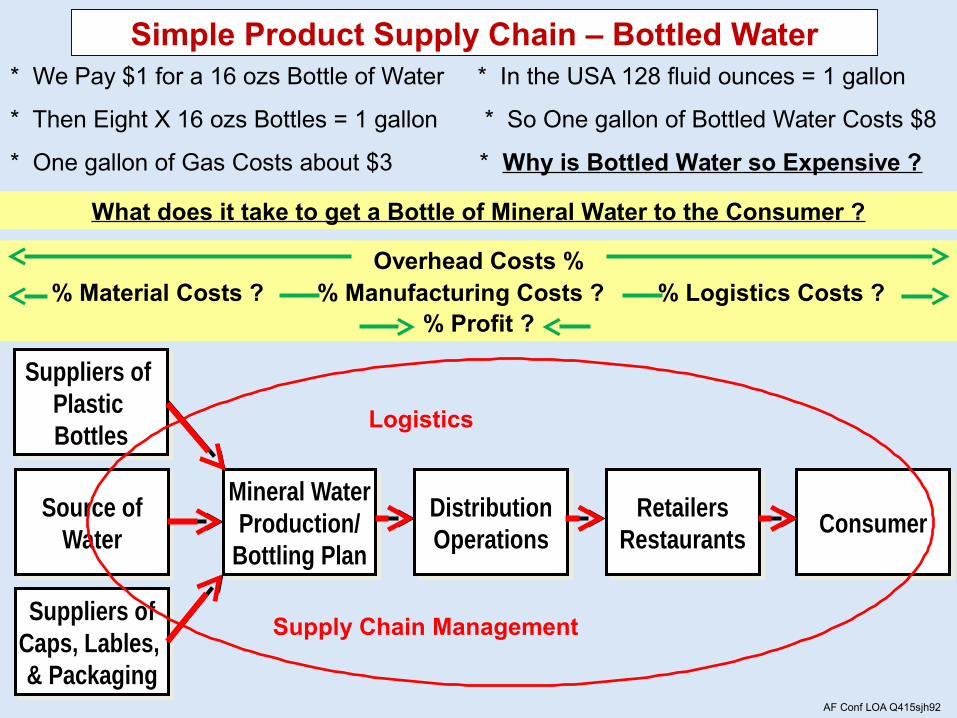
Suppliers of Plastic Bottles
Suppliers of Plastic Bottles
Source ofWater
Source ofWater
Suppliers ofCaps, Lables, & Packaging
Suppliers ofCaps, Lables, & Packaging
DistributionOperations
DistributionOperations
RetailersRestaurants
RetailersRestaurants ConsumerConsumer
Mineral WaterProduction/
Bottling Plan
Mineral WaterProduction/
Bottling Plan
Simple Product Supply Chain – Bottled Water* We Pay $1 for a 16 ozs Bottle of Water * In the USA 128 fluid ounces = 1 gallon
* Then Eight X 16 ozs Bottles = 1 gallon * So One gallon of Bottled Water Costs $8
* One gallon of Gas Costs about $3 * Why is Bottled Water so Expensive ?
What does it take to get a Bottle of Mineral Water to the Consumer ?
Logistics
Supply Chain Management
Overhead Costs %
% Profit ?% Material Costs ? % Manufacturing Costs ? % Logistics Costs ?

AF Conf LOA Q415sjh92
Supply Chain Logistics Management – Scope & Accountabilities
Typical Operations Key Functions
PurchasingPurchasing ProductionProductionMaterials Management
Materials Management DistributionDistribution ServicesServicesDemand & Supply
PlanningDemand & Supply
Planning
Inbound Logistics Outbound Logistics
Supply Chain Management
• Transport
• Warehousing
• Freight Mgt
• Production
• Quality • Output Mgt
• DemandForecasting
• Supply Chain Inventory Mgt
• Product Life Cycle Mgt
• Supplier Relationship Management
• Buying
• Expediting
• Maintenance
• Repairs
• Spares
• Raw Materials & Parts Supply
• Production Planning &
Scheduling
• Materials Control
Where does Your Job Fit ?
• Past Improvements have mainly concentrated on Operations / Manufacturing • The Low Hanging Fruit has been Harvested – Many Techniques have been used
e.g. Industrial Engineering; Total Quality Mgt; Just In Time; Six Sigma; Lean
• Future Improvements will Focus on Enterprise-wide Supply Chain Management to Gain (cross-functions and cross-businesses) Competitive Advantage and Win
Manufacturing
AF Conf LOA Q415sjh92
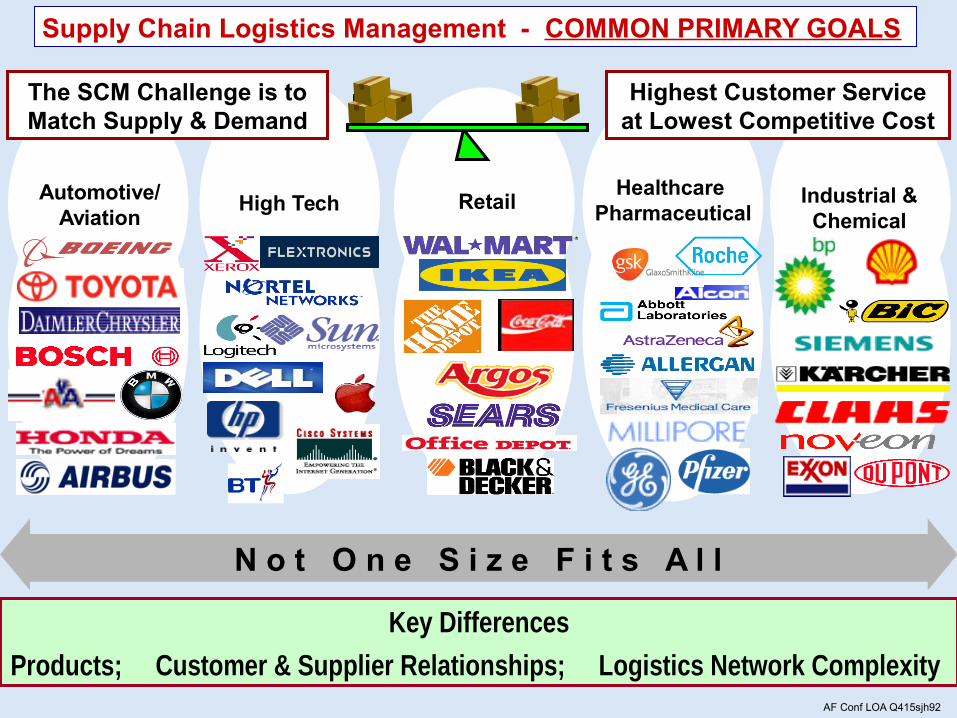
Supply Chain Logistics Management - COMMON PRIMARY GOALS
High Tech RetailAutomotive/Aviation
Healthcare Pharmaceutical
Industrial & Chemical
Key Differences
Products; Customer & Supplier Relationships; Logistics Network Complexity
N o t O n e S i z e F i t s A l l
The SCM Challenge is to Match Supply & Demand
Highest Customer Service at Lowest Competitive Cost

AF Conf LOA Q415sjh92
High Tech RetailAutomotive/Aviation
Healthcare Pharmaceutical
Industrial & Chemical
Who do you Benchmark with ?
Benchmarking
Definition – A Systematic Process of Comparing Business Practices and Performance Levels to Identify Opportunities for Improvement
From your own knowledge and experience:
(b) What process does your function/operation need to improve most ?
(a) What process is your function/operation really good at doing ?

AF Conf LOA Q415sjh92
• Predictable Supply / Demand
• Manufacturing Economies of Scale
• Lowest Possible Costs
Efficient Supply Chain Responsive Supply Chain• Unpredictable Supply / Demand
• Manufacturing Flexibility
• Reduced Lead Times
Functional Products e.g. Food
- They Satisfy Basic Unchanging Needs
- Long Product Life Cycles
- Low Margins
- Stable Demand
Innovative Products e.g. High Tech
- They Have Great Variety
- Short Product Life Cycles
- High Profit Margins
- Volatile Demand
Commodity Products E x a m p l e – M a t c h i n g P r o d u c t s & S u p p l y C h a i n s
Customised Products
Are you Driven by Cost, Service or Agility ?
Cost AgilityService
PRODUCTS Drive Different Supply Chain Logistics Requirements

AF Conf LOA Q415sjh92
= Relatively Easy = Moderately Difficult = Most Difficult
Local / In-Country (Home Based / Domestic)Regional (Same Trade Regime)Global (Worldwide Sources & Destinations)
Geography
Outbound Deliveries
Repeat Orders / Loyal CustomersSpecific Orders / Fragile Customer RelationshipUnusual Requirements / New Customers
Inbound Supplies
Common Items / Mature RelationshipCompetitive Items / Developing RelationshipScarce Items / Immature Relationship
Commodity Products / Efficient Supply ChainsDefined Products / Reactive Supply ChainsCustomised Products / Agile Supply Chains
Industry Type
Static Routine Shipments (Set Routes)Uncomplicated Product Deliveries Unique Delivery Solutions to new Locations
Complexity
Key Business Differences Impacting Supply Chain Logistics Management

AF Conf LOA Q415sjh92
Netted Forecast
Demand Forecasting
ForecastNetting
Demand Planning
3 Generic Supply Chain Management Processes
1
2
Demand Fulfillment
Demand Fulfillment Order
Fulfillment
Allocations
Supply Execution
Order Promising
Order Creation
6
789
10 Order Delivery
Supply Planning
SupplyAllocation
Supply Plan
4
5
AllocationPlanningOperational
(master)Planning
Supply Planning& Constraints
3

AF Conf LOA Q415sjh92
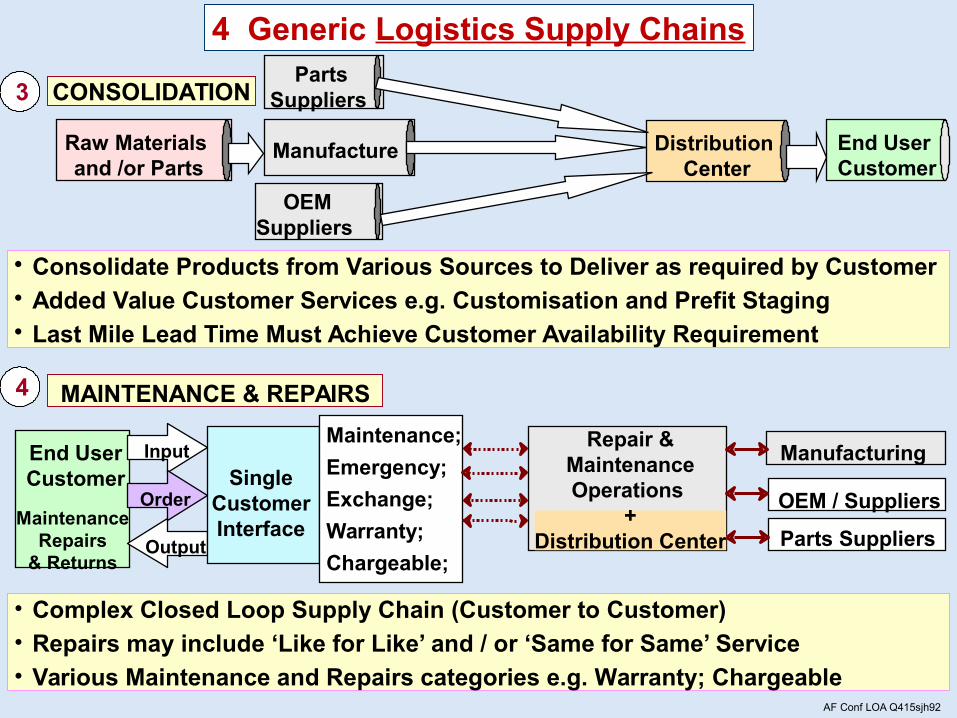
4 Generic Logistics Supply Chains
Manufacture & Distribution
Raw Materials and /or Parts
End User Customer
DIRECT SHIPMENTS1
Raw Materials and /or Parts
Manufacture Distribution Center
End User Customer
FAST FLOW MERCHANDISE 2
• Direct Ship Finished Products from Source of Supply to End User Customer• Lead Time Must Match Customer Availability Requirement (Order to Delivery)• Typically Predictable Demand with Source Closely Connected to Customers
• Last Step in Supply Chain (DC) positioned Close to Customer for Fast Delivery• Short Lead Time availability Requires Inventory Located Close to Customer• Allows Low Cost Bulk Shipments to DC then call-off Delivery to satisfy Customer
AF Conf LOA Q415sjh92
• Complex Closed Loop Supply Chain (Customer to Customer) • Repairs may include ‘Like for Like’ and / or ‘Same for Same’ Service • Various Maintenance and Repairs categories e.g. Warranty; Chargeable
Raw Materials and /or Parts
Manufacture Distribution Center
End User Customer
PartsSuppliers
OEM Suppliers
CONSOLIDATION3
• Consolidate Products from Various Sources to Deliver as required by Customer• Added Value Customer Services e.g. Customisation and Prefit Staging• Last Mile Lead Time Must Achieve Customer Availability Requirement
MAINTENANCE & REPAIRS
End UserCustomer
MaintenanceRepairs
& Returns
Input
Output
SingleCustomerInterface
Manufacturing
OEM / Suppliers
Parts Suppliers
Maintenance;
Emergency;
Exchange;
Warranty;
Chargeable;
Order
4
Repair & MaintenanceOperations
+Distribution Center
4 Generic Logistics Supply Chains

AF Conf LOA Q415sjh92
Example Supply Chain Logistics Network
Manufacturing
Reverse Logistics
Outbound Logistics
Logistics Operations
Center
CUSTOMERS
Distribution
Repairs, Spares & Returns
Repair Center
Repairs & Returns
Inbound Logistics
OEMSupplier
Supplies
Sourcing
Raw Materials.
Parts Supplier
Physical Supply Chain Logistics Networks comprise: -
Supply Locations & Inbound Transportation Modes & Connections
Manufacturing & Distribution Locations + Outbound Transportation Routes
Repairs & Returns Locations + 2-way Transportation Flows
Tier 2MaterialSupplier
Tier 1 Supplier
Manufacturing Operations
RepairsDistribution Returns
Physical Supply Chain Logistics Networks
1. Upstream Sourcing 2. Operations & Downstream Delivery 3. After Sales Services
CUSTOMERS
3
2
1
1 2
3

AF Conf LOA Q415sjh92
Logistics Complexity / Risk Matrix
Customer(Receiver)Readiness/Relationship
Supplier /ContractorReadiness/Relationship
Productand / orContractComplexity
Route;Distance;Territory
OverallDifficultyRating %
Risk ScoreperBox
PlanningTimeline
20%Row
10%Row
5%Row
New / Untested
Developing,Needs Improving
Established/Proven
High /Proven
Medium /with Some Issues
Low / Unknown
Legacy Products &CommodityServices
Low Tech Products / Special Services
Hi –Tech Products / Expert Services
Months
Weeks
Days
Home(Local)Straight - forward
Export Tradewith some PotentialProblems
NewRegion & UnknownCountry
High Risk
Low Risk
80%
35%
Medium Risk

AF Conf LOA Q415sjh92
Business Logistics Military Logistics
Shared Winning Imperatives1. Meet Customer Service Requirements
2. Optimise Resource and Asset Utilisation
3. Replace Inventory with Information
4. Drive Productivity Improvements & High ROI
5. Best SRM & Selective Outsourcing
6. Weed & Feed to Achieve Required Skills
The Same Difference?
Profit and Growth1. Service / Cost Balance
2. Eliminate Duplication / Redundancy
3. Run Lean Pipeline Inventory Levels
4. Drive Margin Improvement
5. Collaborate - Develop Alliances
6. Minimise Headcount Levels
Life and Death1. Service First
2. Be Prepared / Build in Safety Factor
3. Hold Extra Just in Case
4. Control Costs & Manage to Budgets
5. Manage Suppliers / Enforce Contracts
6. Maintain Employment Levels
AF Conf LOA Q415sjh92
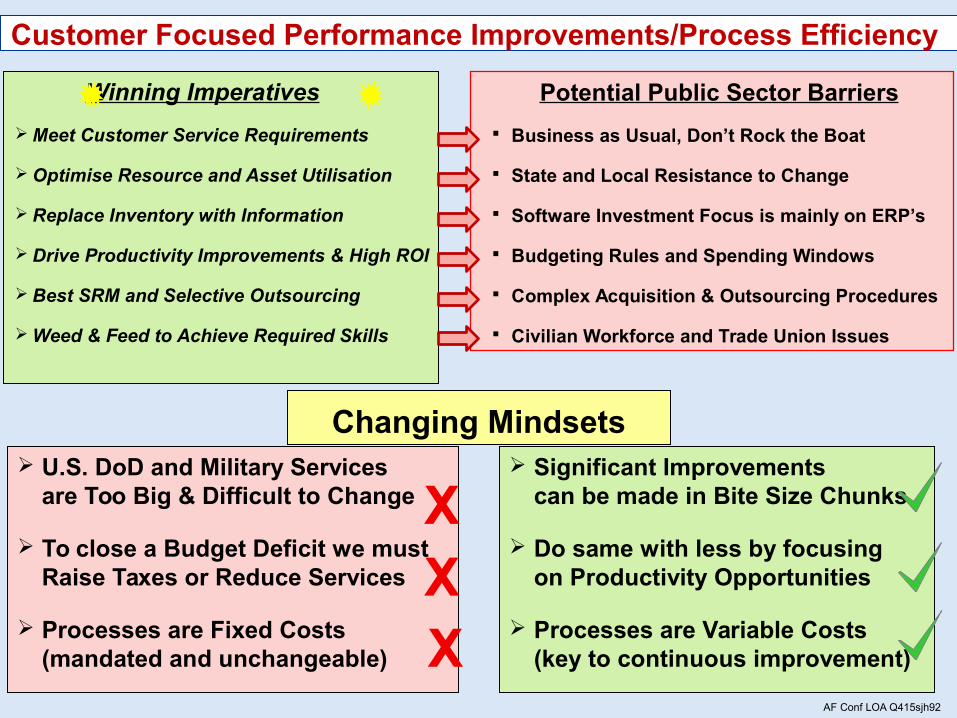
Winning Imperatives
Meet Customer Service Requirements
Optimise Resource and Asset Utilisation
Replace Inventory with Information
Drive Productivity Improvements & High ROI
Best SRM and Selective Outsourcing
Weed & Feed to Achieve Required Skills
U.S. DoD and Military Services are Too Big & Difficult to Change
To close a Budget Deficit we must Raise Taxes or Reduce Services
Processes are Fixed Costs (mandated and unchangeable)
Changing Mindsets Significant Improvements
can be made in Bite Size Chunks
Do same with less by focusing on Productivity Opportunities
Processes are Variable Costs (key to continuous improvement)
XXX
Potential Public Sector Barriers
Business as Usual, Don’t Rock the Boat
State and Local Resistance to Change
Software Investment Focus is mainly on ERP’s
Budgeting Rules and Spending Windows
Complex Acquisition & Outsourcing Procedures
Civilian Workforce and Trade Union Issues
Customer Focused Performance Improvements/Process Efficiency

AF Conf LOA Q415sjh92
• The Winning Formula – Strategy & Execution
• Customer Satisfaction is Paramount !
– Always Put Customers First
• How to Think/Plan Strategically &
Execute/Deliver Operationally
Customer Centric Reconfiguration
2. Winning with Logistics

AF Conf LOA Q415sjh92
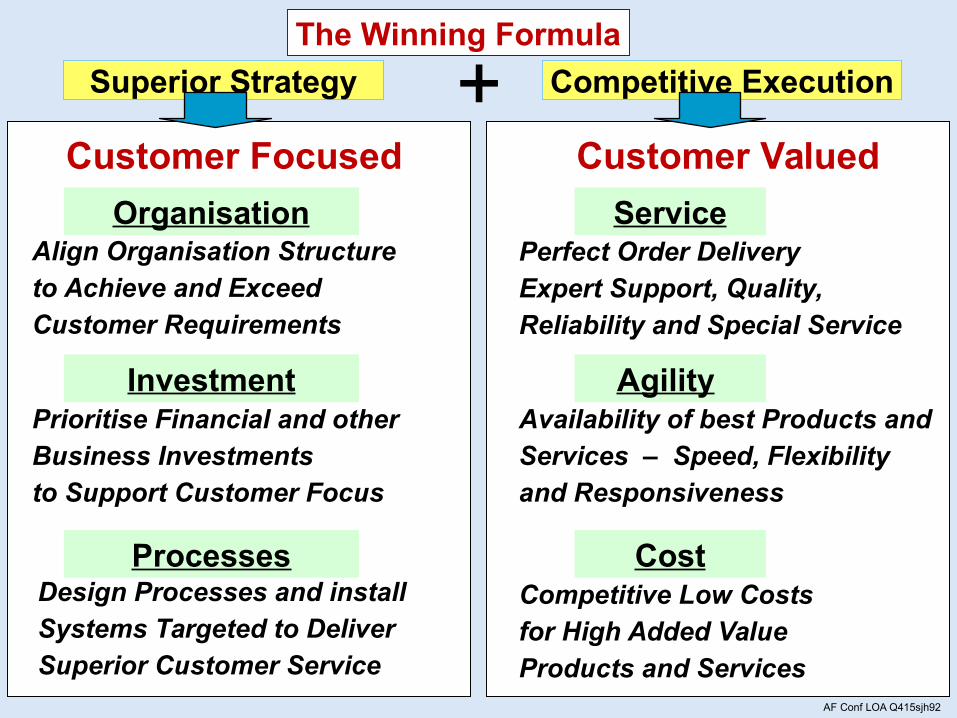
The Winning Formula
+=BusinessSuccess
SuperiorStrategy
CompetitiveExecution
Do you have Strategy to Execution Disconnects ?
A Great Strategy is Useless if it is only a Wish List
The Annual Event – Strategists Love it
Operations people Love Fire Fighting
Excellent OperationsWithout Alignment
are Wasteful
AF Conf LOA Q415sjh92
+Superior Strategy Competitive Execution
Customer Focused
OrganisationAlign Organisation Structure to Achieve and Exceed Customer Requirements
InvestmentPrioritise Financial and other Business Investmentsto Support Customer Focus
ProcessesDesign Processes and install Systems Targeted to Deliver Superior Customer Service
The Winning Formula
Service
Customer Valued
Agility
Perfect Order Delivery Expert Support, Quality,Reliability and Special Service
Competitive Low Costs for High Added Value Products and Services
Availability of best Products and Services – Speed, Flexibility and Responsiveness
Cost

AF Conf LOA Q415sjh92
What changes
have to be
made?
How should
changes
be made?
How shall we
measure
progre
ss?
Strategy
Time Line
Start with the Customer
Strategy Development - step 1
Where
are
we now?
Where do w
e
want to go?

AF Conf LOA Q415sjh92
Talk to Customers to find out What they want from Logistics
They want it NOW !
They want the BEST !
They want it FREE !
Logistics Cost Competitiveness
Cost Transparency & Value Add Services
Cost Reduction & Cost Avoidance
Cost
AgilityDelivery Speed and Responsiveness
Availability, Visibility and Flexibility
People, Process & Systems Compatibility
Perfect Order Delivery to Required Date
Dedicated Expert Logistics Leadership
Special Customised Logistics Services
Service
AF Conf LOA Q415sjh92
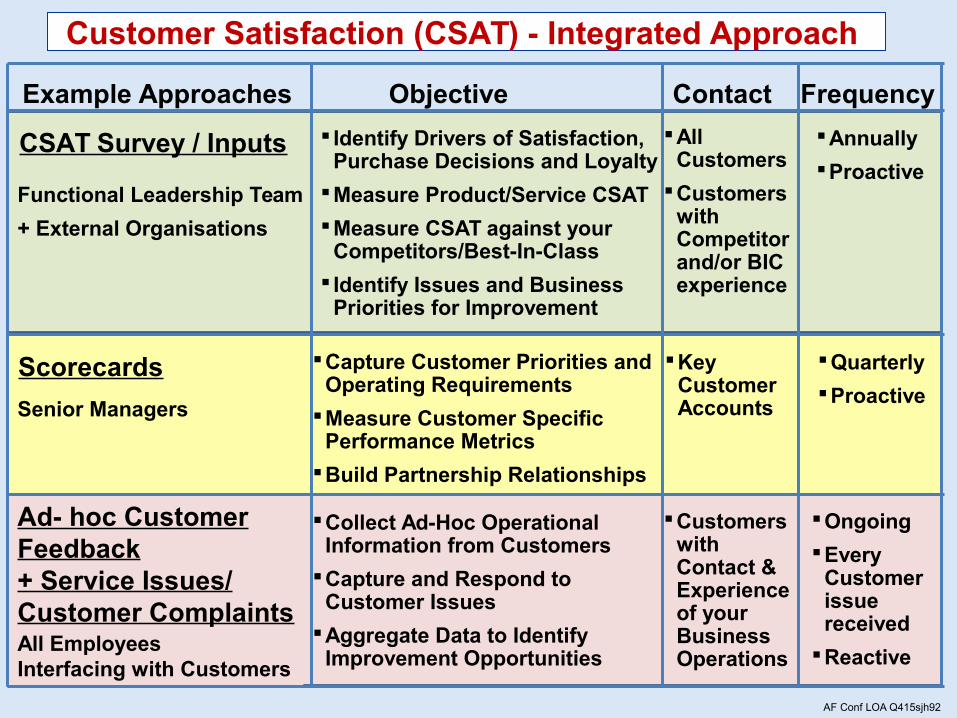
Customer Satisfaction (CSAT) - Integrated Approach
Identify Drivers of Satisfaction, Purchase Decisions and Loyalty
Measure Product/Service CSAT
Measure CSAT against your Competitors/Best-In-Class
Identify Issues and Business Priorities for Improvement
All Customers
Customers with Competitor and/or BIC experience
Annually
ProactiveFunctional Leadership Team
+ External Organisations
CSAT Survey / Inputs
Objective Contact Frequency
Capture Customer Priorities and Operating Requirements
Measure Customer Specific Performance Metrics
Build Partnership Relationships
Key Customer Accounts
Quarterly
ProactiveSenior Managers
Scorecards
Collect Ad-Hoc Operational Information from Customers
Capture and Respond to Customer Issues
Aggregate Data to Identify Improvement Opportunities
Customers with Contact & Experience of your Business Operations
Ongoing
Every Customer issue received
ReactiveAll Employees Interfacing with Customers
Ad- hoc Customer Feedback+ Service Issues/ Customer Complaints
Example Approaches
AF Conf LOA Q415sjh92
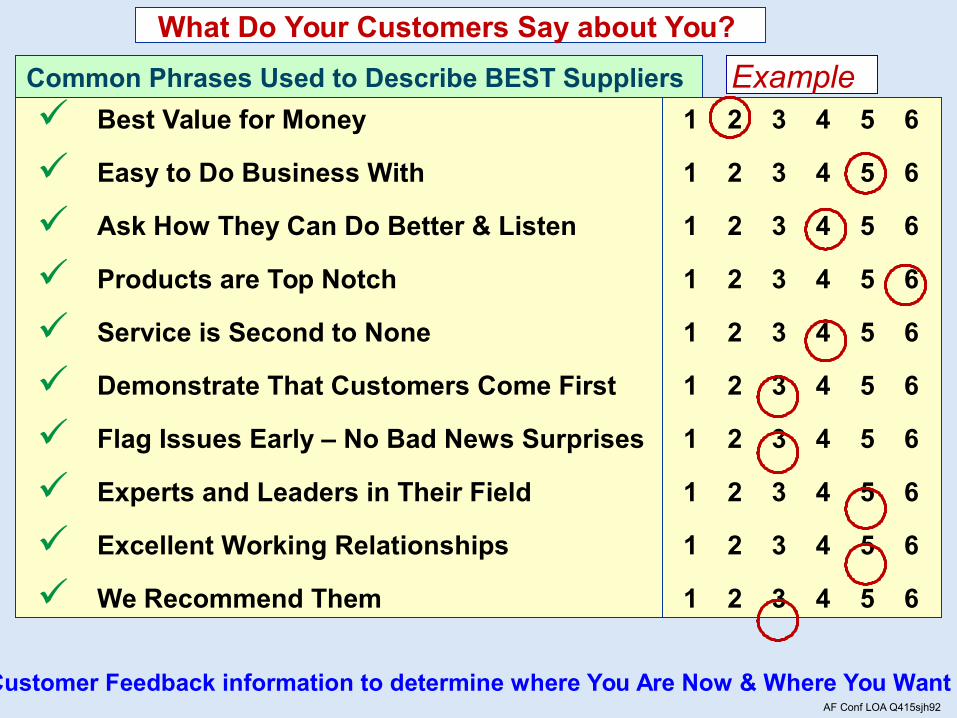
Best Value for Money
Easy to Do Business With
Ask How They Can Do Better & Listen
Products are Top Notch
Service is Second to None
Demonstrate That Customers Come First
Flag Issues Early – No Bad News Surprises
Experts and Leaders in Their Field
Excellent Working Relationships
We Recommend Them
What Do Your Customers Say about You?
Use Customer Feedback information to determine where You Are Now & Where You Want to Go
1 2 3 4 5 6
1 2 3 4 5 6
1 2 3 4 5 6
1 2 3 4 5 6
1 2 3 4 5 6
1 2 3 4 5 6
1 2 3 4 5 6
1 2 3 4 5 6
1 2 3 4 5 6
1 2 3 4 5 6
Common Phrases Used to Describe BEST Suppliers Example

AF Conf LOA Q415sjh92
Where
are
we now?
What changes
have to be
made?
How shall we
measure
progre
ss?
Strategy
Time Line
CSATFeedback
Strengths/Weaknesses + Opportunities/Threats
• Organisation• Investment• Processes
S W
O T
Strategy Development - step 2
How should
changes
be made?
Where do w
e
want to go?

AF Conf LOA Q415sjh92
Example Strengths/Weaknesses + Opportunities/Threats
SWOT Analysis
Strengths Weaknesses
Opportunities Threats
• Expert Knowledge of US Military/ Customer Requirements
• Beaurocratic Processes = Slow to React & Change
• Benchmark & Partner with other DoD Operations/Functions • Outsourcing Core Competences
AF Conf LOA Q415sjh92
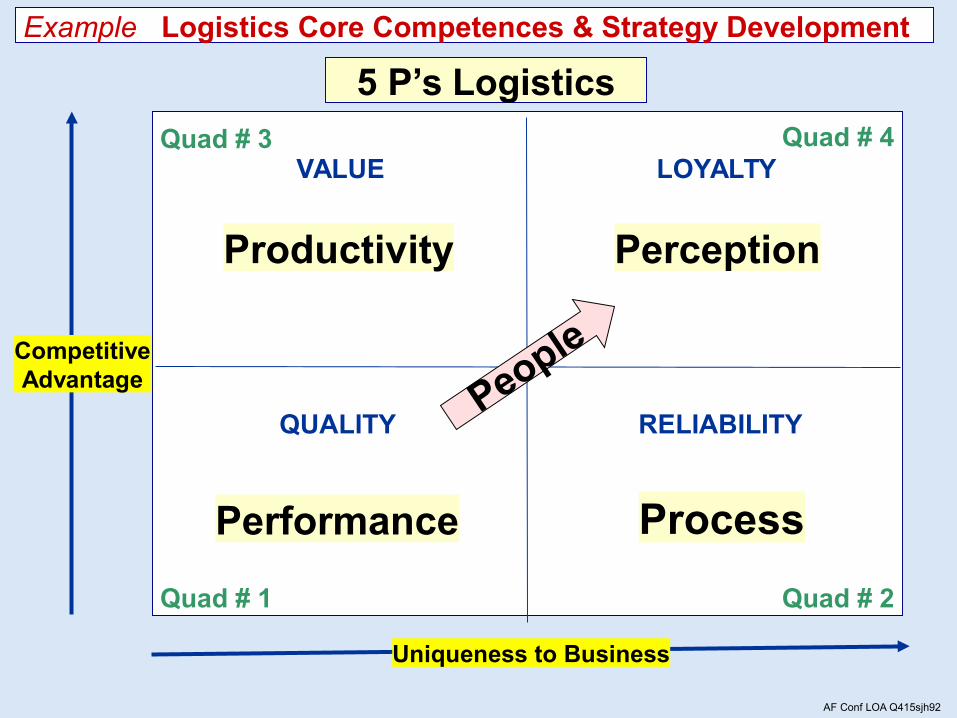
5 P’s Logistics
VALUE
Productivity
RELIABILITY
Process
QUALITY
Performance
LOYALTY
Perception
Uniqueness to Business
Quad # 3
Quad # 2Quad # 1
Quad # 4
CompetitiveAdvantage
People
Example Logistics Core Competences & Strategy Development

AF Conf LOA Q415sjh92
VALUE
Productivity
RELIABILITY
ProcessQUALITY
Performance
LOYALTY
Perception
Quad # 3
Customised Solutions
Quad # 2
Enterprise Processes Design & Control
Quad # 1
Commodity Products & Services
Quad # 4
Logistics Leadership
5 P’s Logistics
People
Uniqueness to Business
CompetitiveAdvantage
Example Logistics Core Competences/Outsourcing Opportunities

AF Conf LOA Q415sjh92
• Process Design & Improvement
• Engineering & Packaging
• Process & Systems Alignment
• Order Fulfillment Applications
• Systems & Tools Requirements
PRODUCTIVITY
• Customer Wants & Needs
• Client Relationship Mgt
• Customer Metrics / Reports
• Targeted Benchmarking
• Aligned Business Development
PERCEPTION
• Warehousing & Operations
• Transportation & Services
• Freight Forwarding
• Import / Export Process
• Freight Payables & Claims
PERFORMANCE
• Project Management
• Logistics Network Design
• Service Provider Alliances/Mgt
• Planning & Support
• Optimisation
PROCESS
Example Logistics Strategy - Functional Analysis
Uniqueness to Business
CompetitiveAdvantage

AF Conf LOA Q415sjh92
Where
are
we now?
Where do w
e
want to go?
How should
changes
be made?
Strategy
Time Line
S W
O T
CSATFeedback
• Organisation• Investment• Processes
CustomerValuedMetrics
Strategy Development
• Goals• Objectives• Action Plans
How shall we
measure
progre
ss?
What changes
have to be
made?
- step 3

AF Conf LOA Q415sjh92
Briefly describes the Organisation’s fundamental purpose • Aims of Organization• Primary Customers• Value to Stakeholders
GOALS State future targets that the organisation wants to achieve
OBJECTIVES Define specific measureable action requirements
Detail steps + deliverables – Who will do What by When?ACTIONS
Specify the performance measures to monitor progressMETRICS
Simple Strategy Framework
MISSION STATEMENT

AF Conf LOA Q415sjh92
Building a Winning Strategy
GOALGOALGOAL GOAL GOAL
OBJECTIVEOBJECTIVEOBJECTIVE OBJECTIVE OBJECTIVE
ACTIONS
METRICS
ACTIONS
METRICS
ACTIONS
METRICS
ACTIONS
METRICS
ACTIONS
METRICS
ACTIONS
METRICS
ACTIONS
METRICS
ACTIONS
METRICS
ACTIONS
METRICS
ACTIONS
METRICS
ACTIONS
METRICS
ACTIONS
METRICS
ACTIONS
METRICS
ACTIONS
METRICS
ACTIONS
METRICS
MISSION STATEMENT

AF Conf LOA Q415sjh92
Example Strategy Outline for USAF Aircraft Maintenance
Example MISSION STATEMENT
To be the Leading Provider of Aircraft Maintenance to the USAF -
Recognized for the Safest provision of Superior Quality, Service and
Competitive Prices with a Customer Satisfaction Rating that is higher
than all other similar operations/locations.
Example GOAL
Maintenance and Logistics Operations Management that provides
‘Best in Class’ Service Value by Executing Fast Turnaround On-time
Delivery and Cost Competitiveness.

AF Conf LOA Q415sjh92
Example OBJECTIVE
Maintenance and Logistics Operations Management that provides
Measureable Service and Cost Performance, Demonstrating the
Highest Competitive Customer Service Levels/Ratings and
Stakeholder Value Recognition.
Example ACTIONS
Benchmark Customer Satisfaction and Implement an Integrated CSAT
approach + Performance Metric Steve Haynes by 1st Feb 2015
Introduce a Cost Reduction & Cost Avoidance Program + Performance
Metric approved by Financial Controller Ed Smith by 1st April 2015
Example Strategy Outline for USAF Aircraft Maintenance

AF Conf LOA Q415sjh92
Best Value for Money
Easy to Do Business With
Ask How They Can Do Better & Listen
Products are Top Notch
Service is Second to None
Demonstrate That Customers Come First
Flag Issues Early – No Bad News Surprises
Experts and Leaders in Their Field
Excellent Working Relationships
We Recommend Them
How do You Think Your Customers would Score You ?
1 2 3 4 5 6
1 2 3 4 5 6
1 2 3 4 5 6
1 2 3 4 5 6
1 2 3 4 5 6
1 2 3 4 5 6
1 2 3 4 5 6
1 2 3 4 5 6
1 2 3 4 5 6
1 2 3 4 5 6
Step 1. - Always Start with the Customer Have a Go Be HonestWhere are You Now ?
AF Conf LOA Q415sjh92
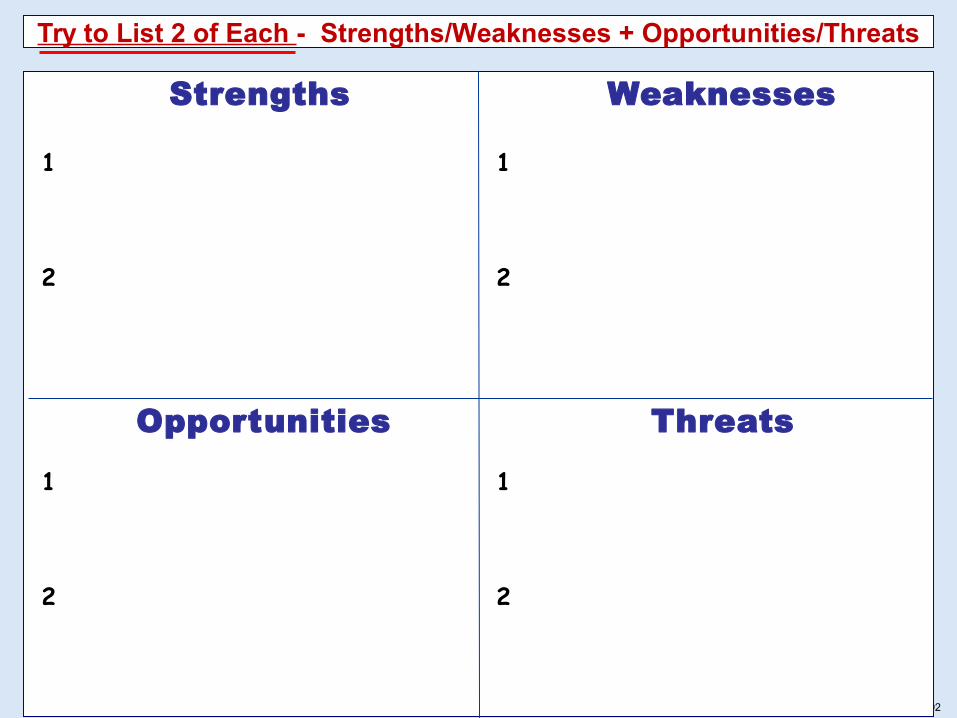
Try to List 2 of Each - Strengths/Weaknesses + Opportunities/Threats
Strengths Weaknesses
Opportunities Threats
1
2
1
2
1
2
1
2
AF Conf LOA Q415sjh92
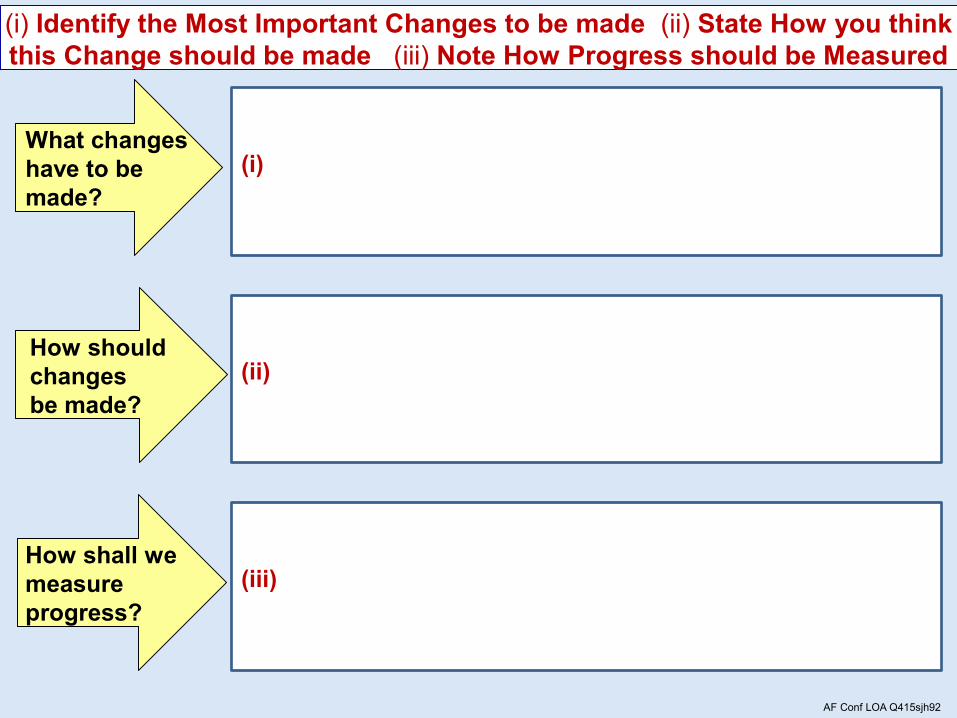
What changes have to be made?
How should changes be made?
How shall we measure progress?
(i) Identify the Most Important Changes to be made (ii) State How you think this Change should be made (iii) Note How Progress should be Measured
(i)
(ii)
(iii)

AF Conf LOA Q415sjh92
Where
are
we now?
Where do w
e
want to go?
What changes
have to be
made?
How should
changes
be made?
How shall we
measure
progre
ss?
Strategy
Time Line
CSATFeedback
• Organisation• Investment• Processes
Strategy Development
S W
O T
- step 4
• Goals• Objectives• Action Plans
CustomerValuedMetrics

AF Conf LOA Q415sjh92
Get Close to Customers to Service Their Requirements
Put Customers First in Everything You Do
Review & Agree KPI’s (Key Performance Indicators) with Customers
Ensure Strategy & Execution Alignment to Help Customers Win
Change Organisation, Investment & Processes to Match Strategy
Set Clear Goals; Objectives; Action Plans
Implement & Manage Value Add Performance Metrics
Drive Service, Agility and Cost Improvements
Collaborate Enterprise-wide with Customers & Suppliers
Orchestrate; Hold Accountable; Reward People
Summary
Customer Centric Reconfiguration

AF Conf LOA Q415sjh92
a) Metrics Maniacs or Managers ?
b) Performance Measurement – Best Metrics
c) Metrics Management Leadership
Performance Metrics
3.
Winning with Logistics

AF Conf LOA Q415sjh92
In Business - What you can’t measure is not worth doing!
Metrics Must Add Value & Be Used to Improve Performance
Most Organisations suffer from Performance Measurement Overkill
We are Metrics Maniacs who struggle to see the Forest from the Trees
We are Not Good at Deciding What to Measure and How to do it
Good Performance Metrics Drive Great Results
But
PERFORMANCE MEASUREMENT
Common Problems

AF Conf LOA Q415sjh92
Customer Valued
Business Mgt
Operational
BossBoss
Performance Measurement
What Metrics?
How Many Metrics?
Who Reviews?
Are they Valuable?
Do they Help or Hinder?
Do Your Performance Metrics………….
1. Focus on the Key Business Drivers?
2. Give Direction / Point Way Forward?
3. Motivate & Help Change Behavior?
% ?
% ?
% ?PeersPeers
#?
# ?
# ?
Your TeamYour Team

AF Conf LOA Q415sjh92
Q1 Q3 Q4Q2
DELIVERED ORDERPERFORMANCE %
TIME
TARGET
FORECAST
ACTUAL
100
99
98
97
96
95
94
Performance Measurement & Management – Clarity Not Mania
• What should we Measure?
• What should we Stop Measuring?
• How do we go about doing it well?
• Establish Agreed Best Metrics to Focus on Improvement Opportunities• Conduct Productive Metrics Reviews to Improve Performance Results
• Chart Key Performance Metrics
• Show Trends & Highlight Issues
• Agree Improvement Actions
( Who? What? When?)

AF Conf LOA Q415sjh92
Performance Measures (Metrics) must have an Owner plus:
1. Definition - a clear, unambiguous Performance Measure statement
2. Formula - quantification, the mathematical calculation method
3. Chart - a table, graph or diagram showing performance
information
CALCULATION CRD =Number of Orders On-time to CRD
Total Number of Orders
Example 100% Complete On-time Delivery to match Customer Request Date (CRD)
DEFINITION
CHART
95
96
97
98
99
100
Month
% O
n T
ime
Co
mp
lete
to
CR
D
J F M A M J J A S O N D
98 97.597.2 97.3
5867
Month Total # Orders 96.7
97.5
48924953
4563
5232
4432
5867
97.9
ON-TIME DELIVERY TOCUSTOMER REQUEST DATE
JUNE
Performance Metrics - Imperatives
1
2
3

AF Conf LOA Q415sjh92
Performance Metrics
From your own knowledge and experience:
Discussion Questions
(b) Why do You consider these to be the Most Important Metrics ?
Please be prepared to discuss your inputs in class
(a) What Top 5 Metrics do You/Should You concentrate on most ?

AF Conf LOA Q415sjh92
Metrics Structure
Customer Valued
Business Mgt
Operational
Performance Measurement – PUT CUSTOMERS 1ST
Who are the Real Customers of our Products & Services?
What are the Customer’s Prioritised Requirements?
What Performance Metrics Matter Most to Customers?
Who are the Stakeholders for Business / Financial Performance?
What are the Most Important Business Drivers - External facing?
What are the Key Business Performance Metrics?
Examples
On-time Delivery
Actual Spend V Budget
Manufacturing Responsiveness Who are the Internal Clients / Customers?
What are the Main Functional Performance Measures - Internal facing?
What Operational Performance Improvement Metrics should we Use?
What Metrics?

AF Conf LOA Q415sjh92
Lagging & Leading Metrics/Indicators
OutcomeMeasuresOutcomeMeasures
Performance Drivers
Performance Drivers
Top Level Business Metrics Should Have Some Lagging & Some Leading Indicators
LEADING
Often Measure Activities or Sometimes Processes
Leading Metrics Indicate Future Events – Drivers of Business Results
Examples – CSAT; Customer Demand Forecasts; Financial Budgets
Have a Mix & Don’t Get Hung-Up on Labeling as Lagging & Leading
LAGGING
Typically Most Performance Metrics are Lagging Indicators
Lagging Metrics report what has already happened
Examples – Customer Complaints; Production Output; Financial Results

AF Conf LOA Q415sjh92
Communicate the Importance of Performance Measures to All Stakeholders
Explain Plans for Rationalising and Improving Performance Measures
Collect and Review All Existing Performance Measures
Talk to Customers to Agree & Prioritise Value Add Performance Metrics
Publish Performance Measurement Definitions, Formulae and Metrics Charts
KEY STEPS
Performance Measurement Measurement Leadership &
HOW TO DO IT Establish Agreed Best Metrics to Focus on Improvement Opportunities

AF Conf LOA Q415sjh92
Cross- Functional Performance• Order Entry Accuracy• Product Availability• Pick, Pack, Ship On-time & Accuracy • Delivered Product Quality• On-time Delivery to Customer• Documentation & Invoice Accuracy
…….an excellent example of a Cross-functional and Hierarchical Metric
‘Perfect Order Delivery’
HierarchyPERFECT ORDER comprises several
lower level Performance Measures
Perfect Order Delivery
DEFINITION100% Complete On-time Delivery to match Customer Request Date and Ship to Address with no Product Defects or Quality Issues and all Documentation correct / No Errors
FORMULAComposite of all Sub-level Metrics
CHARTShow Order Quantities Vs Timeline And Indicate any Errors.
Used to track performance and Highlight Improvement Opportunities
1
2
3
No
of
Err
ors
On Time Delivery No. of Errors
Order Entry 59 Product Available 41 Pick Pack Ship 35 Product Quality 23 On-time Delivery 12 Documentation 6
97
98
99
100
Month% O
n T
ime
Co
mp
lete
to
C R
D
173
111104
176
127 128
97.3
Month Total # Orders
97.5
48924953
4563
5232
4432
5867
97.9150
175
125
95
96
J F M A M J J A S O N D100
97.296.7
97.1
PERFECT ORDER

AF Conf LOA Q415sjh92
DefinitionsMust Have a Clear, Unambiguous Performance Measurement Definition
• On-time Customer Delivery
• Cost Reduction
• Supply Chain Response Times
?
?
?
Service
Cost
Agility
1

AF Conf LOA Q415sjh92
Example DefinitionsClear, Unambiguous Performance
Measurement Definition
• 100% Complete On-time Delivery
to Match Customer Required Date
with No Damaged, Missing or Wrong
and Full Documentation Accuracy
Service Customer Delivery
Cost • Annualised Cost Savings resulting
from Actual Change of Process or
Practice that Reduces Real $ Spend Cost
Reduction
Agility SC Response
Times
• Total SC Responsiveness to Changes
Comprises: Source; Make;
Order Fulfillment & Customer Delivery

AF Conf LOA Q415sjh92
Must Have a Formula - Quantifiable with a Mathematical Calculation
Formula
Service Customer Delivery
Cost Cost
Reduction
Agility
100% Complete On-time Delivery to Match Customer Required
Date with No Damaged, Missing or Wrong and
Full Documentation Accuracy
Annualised Cost Savings resulting from Actual Change of
Process or Practice that Reduces Real $ Spend
Total SC Responsiveness to Changes – Comprises:
Source; Make; Order Fulfillment; Customer Delivery
= ?
= ?
= ? SC Response
Times
2

AF Conf LOA Q415sjh92
Must Have a Formula - Quantifiable with a Mathematical Calculation
Example Formulae
Service Customer Delivery
Cost Cost
Reduction
Agility
100% Complete On-time Delivery to Match Customer Required Date with
No Damaged, Missing or Wrong and Full Documentation Accuracy
Annualised Cost Savings resulting from Actual Change of Process or
Practice that Reduces Real $ Spend
=Number of Orders 100% Complete On-time to CRD
Total Number of OrdersErrorsInformation
&
Cumulative Actual Savings Shown for a 12 Month Period + Itemised Listing / Ownership Ratified by the Financial Controller=
=Total Days (Added) Supply Chain Activities (Lead Times) for - Sourcing; Making; Order Fulfillment; Delivery
SC Response Times
Total SC Responsiveness to Changes – Comprises:
Source; Make; Order Fulfillment; Customer Delivery

AF Conf LOA Q415sjh92
Must be Showable as a Chart, Table, Graph or Diagram to Track Performance Trends & Improvements
Chart
95
96
97
98
99
100
Month
% O
n T
ime
Co
mp
lete
to
CR
D
% On Time Deliveries No. of Errors
J F M A M J J A S O N D
Perfect Delivery
98
CRD Calculation Example
CRD =# Orders on time to CRD
Total Number of Orders
June Example5694
5867% On Time to CRD = X100
On Time to CRD = 97.1%
173 Errors
5867 Month Total # Orders
No
of
Err
ors
110
120
130
140
150
160
170
180
100
Forecast
171
111104
173
127 128
97.1
ERROR ANALYSIS
Order Entry 46
Product Available 37
Pick Pack Ship 19
Product Quality 16
On-time Delivery 21
Documentation 34
97.2 97.3
97.1
96.7
97.5
48924953
4563
5232
4432
5867
97.9
Example SERVICE Chart
173
3

AF Conf LOA Q415sjh92
Cost Reduction Actual v. Forecast
Example COST Improvement Chart
Actual CR Forecast CR
0
200
400
600
800
1000
1200
1400
1600
1800
J F M A M J J A S O N D
$K
Cu
mu
lati
ve S
avin
gs
$K
JUNE Monthly CR $K SavingsNew CR Introductions Switch 25% Small Parcel Deliveries from FedEx & UPS to US Post Service = $14K CR Phase Outs MRP Software Application Upgrade = ( $37K)
Cost ReductionAnnualised Cost savings resulting from an actual change of process or practice that reduces real $ spend
e.g. Transportation Mode – New Route
select Surface versus Air to deliver on-
time but save shipment costs
e.g. Reusable Packaging - Total current
disposable packaging versus new
reusable design including return
handling and transport costs = CR.
Cost AvoidanceAnnualised theoretical saving gained by doing something differently from the normal method of operation thus avoiding costs

AF Conf LOA Q415sjh92Q1 TIME
Total Working Days (Added) Supply Chain Activities (Lead Times) for : Sourcing Materials; Making; Order Fulfillment; Delivery
Q2 Q3 Q4
5
10
15
20
25
30
35
40
45
50
55
60
65
70
75
80
Forecast
SOURCE
ORDERFILL
MAKE
TOTAL SCRT(half scale)
1512
11055
28
20
60
15
113
12
26
Example AGILITY Chart
60 123
20
15
28
Metrics Must Identify Activities Included & Excluded in each Area: Source; Make; Order Fill; Deliver
Must Explain Actions & Issues for Supply Chain Response / Lead Time Reductions in each area :
Source; Make; Order Fill; Deliverye.g. MAKE Quarter 1. = Manufacturing Re-layout to Eliminate Bottlenecks & Downtime (34 to 30 days)
Supply Chain Response Times
(34 to 30 Days)
15
30
10
20
30
40
50
60
70
80
90
100
120
130
150
140
110
160
TOTAL SCRT
(half scale)80
WORKING
DAYS
145
ACTUALDAYS
DELIVER

AF Conf LOA Q415sjh92
Most Performance Measurers are Internal/Department Facing…………….........
These Measures May Actually Prove to be Dysfunctional by Attempting to
Improve Departmental Performance at the Expense of Other Activities
COST
AGILITY
SERVICE
MissingElements
Beware ‘Bad’ (Stovepipe) Performance Metrics
Lowest Cost Procurement Contracts Volume Cost Breaks; Batch Ordering; Unit Price Reductions
MATERIALS PURCHASING
Supplier Cost Reductions Achieved Contract Flexibility Pricing V
MANUFACTURING Production Labour Efficiency Headcount Levels; Labour Rates; Absenteeism Actual Hours Worked & Standard Hours Mfg ResponsivenessV
DISTRIBUTION
Highest Product Availability for Customer Service Funded Inventory Levels; Shelf Availability; No Stock Outs
Greater than 98% Order Fill Rate V Inventory Holding Costs
Department ObjectiveDriversPerformance Metric
Examples
Conflict Problem

AF Conf LOA Q415sjh92
SCOR Model – Common Metrics Definitions for SCM
Supply Chain Council Inc.
Supply Chain Operations Reference (SCOR) Model
Suppliers’Supplier
SupplierYour
Company CustomerCustomer’sCustomer
K e y P r o c e s s S t e p s
PLAN
SOURCE
MAKE
DELIVER
SERVICE
SCOR Process reference models integrate the well-known concepts of business process reengineering, benchmarking, and process measurement into a cross-functional framework
Benchmarking Best Practices Analysis
Process Reference Model
Business Process Reengineering

AF Conf LOA Q415sjh92
SJH Recommended Definitions
• 100% Complete On-time Delivery to match Customer Request Date and Ship to Address
• Total Order Availability to Pick, Pack and Ship
• Perfect Order Fulfillment includes On-time Delivery, Documentation and No Damaged items
• Number of Days / Hours from Order Receipt to Available to Ship Complete
• SCR Comprises – Cumulative Source / Make times; Planning; Order Fulfillment and Customer Delivery
• Number of Days / Hours to Upside and/or Downside Production Output by 20%
• Total Operations, Admin’ and Sales Costs
• Total SCM Costs including all aspects of Purchasing, Production and Logistics (to be stated)
• Additional Chargeable Customer Services eg. Value Add Product / Order Customisation
• Total Processing Costs for Warranty / Returns includes all Materials, Production and Overheads
• Net Inventory Days + Days Sales Outstanding - Accounts Payable Days
• Inventory Days of Supply = 365 / Inventory Turns
• Asset Turns = Annual Sales $ / Total Assets $
SCOR Level 1 Metric
• Delivery Performance
• Fill Rates
• Perfect Order Fulfillment
• Order Fulfillment Lead Times
• Supply Chain Response Times
• Production Flexibility
• Cost of Goods Sold
• Total SCM Costs
• Value Add Productivity
• Warranty / Returns Processing Costs
• Cash-to-Cash Cycle Time
• Inventory Days of Supply
• Asset Turns
Performance Metrics Definitions
SERVICE
AGILITY
COST

AF Conf LOA Q415sjh92
Cheer Leader Coach
Reward and Assist
0
50
100
150
Q1
MFG $K SPEND
FORECAST
ACTUAL
Bear Pit Killer
Punish the Innocent
Q2 Q3
What are your Reviews like ?
Most Metrics do Not Align with the Business Strategy & Key Drivers
Too Often we Fail to Share Metrics with Stakeholders and Customers
Many Metrics are Never Reviewed/Used to Improve Performance
PERFORMANCE LEADERSHIP
Common Problems

AF Conf LOA Q415sjh92
Establish New Hierarchy of Performance Metrics and Management Reviews
Optimise the Number of Metrics Produced, Sent and Reviewed at all levels
Use Performance Metrics to Focus on Key Activities & to Change Behaviour
Implement Collaborative Reviews to Monitor and Improve Performance
Benchmark Your Business Processes and Metrics against the ‘Best In Class’
KEY STEPS
Performance Measurement Measurement Leadership &
HOW TO DO IT Conduct Supportive Metrics Reviews to Improve Performance Results

AF Conf LOA Q415sjh92
Distribution Center Metrics
16. Demand Forecast Accuracy
17. Warehouse Carbon Footprint Reduction
18. On-time Delivery to Customer
19. DRP (Distribution Req’ts Plan) % Accuracy
20. Short Shipments %
21. Order Fill Rate %
22. Overtime Hours worked
23. Facility Running Cost Reductions
24. Direct / Indirect Ratio
25. Capital Equipment Utilisation %
26. Supplier Receipt to Put-away Time
27. Inventory Turns & Days of Supply
28. Inventory Obsolescence / Write Off Value
29. Employee Training Days Completed
30. Accident Reports & Prevention Actions
1. Warehouse Space % Utilisation
2. Finished Goods Inventory Levels
3. Supplier Quality – On Time & Defects %
4. Delivery Promise Date Efficacy
5. Order Receipt, Validation & Entry Time
6. Inventory Accuracy – Audit Counts
7. Order Entry Accuracy
8. Supplier On-time Delivery
9. Warehousing – Pick-to-Ship Cycle Time
10. Item Fill Rate per Order
11. Resource Utilisation V Budget
12. # of Complaints and % Resolved Time
13. 100% Complete On-time Ship Date
14. # of Customer Complaints
15. Total Warehousing Costs V Budget
Select Best 101. Warehouse Space % Utilisation
2. Finished Goods Inventory Levels
3. Supplier Quality – On Time & Defects %
4. Delivery Promise Date Efficacy
5. Order Receipt, Validation & Entry Time
6. Inventory Accuracy – Audit Counts
7. Order Entry Accuracy
8. Supplier On-time Delivery
9. Warehousing – Pick-to-Ship Cycle Time
10. Item Fill Rate per Order
11. Resource Utilisation V Budget
12. # of Complaints and % Resolved Time
13. 100% Complete On-time Ship Date
14. # of Customer Complaints
15. Total Warehousing Costs V Budget
16. Demand Forecast Accuracy
17. Warehouse Carbon Footprint Reduction
18. On-time Delivery to Customer
19. DRP (Distribution Req’ts Plan) % Accuracy
20. Short Shipments %
21. Order Fill Rate %
22. Overtime Hours worked
23. Facility Running Cost Reductions
24. Direct / Indirect Ratio
25. Capital Equipment Utilisation %
26. Supplier Receipt to Put-away Time
27. Inventory Turns & Days of Supply
28. Inventory Obsolescence / Write Off Value
29. Employee Training Days Completed
30. Accident Reports & Prevention Actions

AF Conf LOA Q415sjh92
a) Balancing Demand & Supply
b) Outsourcing Partnerships
c) SCM Software Systems
Big Issues & Lessons Learned
4.
In Your Operation Do you have Customer Service problems and/or High Inventory levels ?
In Your Experience Are we good at Outsourcing ? - Do we Outsource Too Much or Too Little ?
In Your Opinion How would you Rate Your Supply Chain Software Information Systems ?
Winning with Logistics

AF Conf LOA Q415sjh92
How to get Closer to Balanced Demand & Supply
Visibility – Clear View of Information and Operations Up and Down the Extended Supply Chain
Planning – Demand & Supply Optimisation comprehending Enterprise-wide Requirements and Constraints
Collaboration – Cooperation with Supply Chain Partners to Share Information and Synchronise Actions
Control – Measure and Manage Business Performance Across the Extended Supply Chain
Operations – Supply Chain Operations Designed to Maximise Customer Service & Minimise Inventory Levels
a
SU
PP
LIE
RS
S & O P
Consensus Demand Forecasting Committed Agile Supply Planning
Lessons Learned
CU
ST
OM
ER
SUpstream Commitments Downstream Service

AF Conf LOA Q415sjh92
End to end Collaboration
Share & Agree Forecasts
Reduce Lead & Cycle Times
Review & F/c Product Groups
Standardize & Modularize
Postponement
Countermeasures Distribution
ordersSupplier orders
BullwhipManufacturing
ordersCustomer
orders
Demand Forecastinga Lessons Learned
MUST HAVE
Qualitative Demand Forecasting Process
Quantitative Demand PlanningCalculations
Demand Information Analysis
• Customer Requirements
• Expert Inputs
• Product Life Cycle Information
Forecast Modeling Techniques
• Expectations; Trends; Seasonality
• Time Series; Moving Averages
• Exponential Smoothing

AF Conf LOA Q415sjh92
Increased Real-time Information Visibility + Allows Synchronised SC activities Minimum Pipeline Inventory Improves Turns with Less Obsolescence Risk
Build to Forecast = Economies of Scale / Linear Resource Utilisation Simple Buy / Sell Relationships and Handoffs throughout the Supply Chain
Supply Chain Design & Inventory Positioning a Lessons Learned
Flexible MfgSupplier
Make to Order
ConsumerFinishedGoods
Inventory
RawMaterial
ConsumerFinishedGoods
Inventory
Batch MfgSupplier
RawMaterial
Make to Stock
Inventory Carrying Costs (typically in Commercial Businesses = 20% per year) Money tied up in Inventory e.g. Cost of Capital & Opportunity Cost of Money Storage & Handling Costs e.g. Labor; Space; Utilities; Insurance; Taxes Cost of Deterioration & Obsolescence Write off and Disposal
Standardize & Modularize
where Possible
Use ABC Inventory Analysis
Reduce Lead Times
& Cycle Times
Review & Forecast in
Product Groups
Think Postponement Customization
AF Conf LOA Q415sjh92
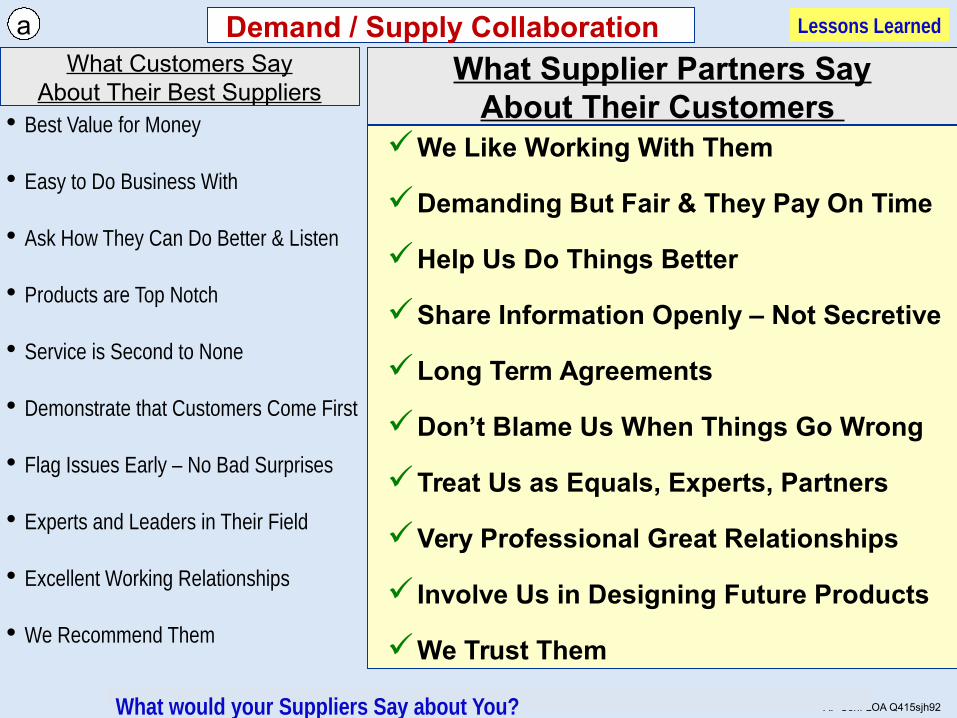
We Like Working With Them
Demanding But Fair & They Pay On Time
Help Us Do Things Better
Share Information Openly – Not Secretive
Long Term Agreements
Don’t Blame Us When Things Go Wrong
Treat Us as Equals, Experts, Partners
Very Professional Great Relationships
Involve Us in Designing Future Products
We Trust Them
• Best Value for Money
• Easy to Do Business With
• Ask How They Can Do Better & Listen
• Products are Top Notch
• Service is Second to None
• Demonstrate that Customers Come First
• Flag Issues Early – No Bad Surprises
• Experts and Leaders in Their Field
• Excellent Working Relationships
• We Recommend Them
What Customers SayAbout Their Best Suppliers
What Supplier Partners SayAbout Their Customers
a Demand / Supply Collaboration Lessons Learned
What would your Suppliers Say about You?

AF Conf LOA Q415sjh92
5 P’s Logistics
Outsourcedto 3rd PartyLogistics Service Providers
3 PLOutsourcedLogisticsManagementto 3PL or Consultants
4 PL Retain LogisticsExpertise In-house to orchestrate Hands-on Logistics Services
5 PL
Business E
volutio
n
In-HouseLogistics
VALUEProductivity
RELIABILITYProcess
QUALITYPerformance
LOYALTYPerception
Value Added
Uniqueness to Business
Logistics Outsourcing
Productivity Perception
ProcessPerformance
DoD Specifics
DoD Solutions Log’s Leadership
BIC 3PL Services
Outsource Products & Services that Others can Provide Better
Keep Core Competences & Develop Cerebral Functions & Skills
b Lessons Learned
AF Conf LOA Q415sjh92
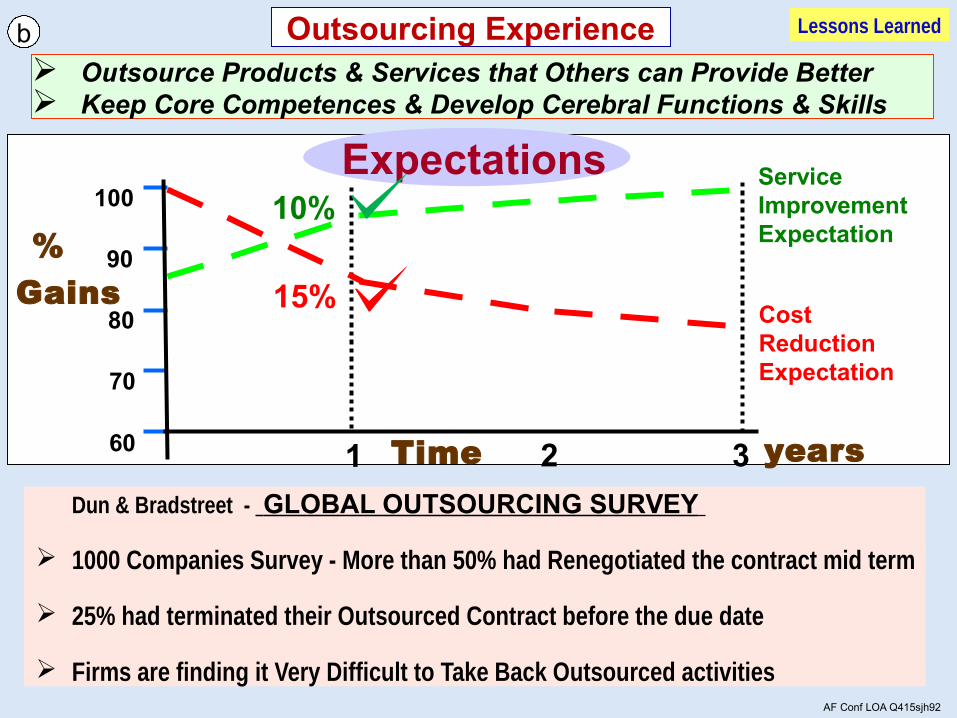
Outsourcing Experience
100
90
80
70
60 1 2 3
Expectations
CostReductionExpectation
15%
Service ImprovementExpectation
10%
Time
Gains
%years
Dun & Bradstreet - GLOBAL OUTSOURCING SURVEY
1000 Companies Survey - More than 50% had Renegotiated the contract mid term
25% had terminated their Outsourced Contract before the due date
Firms are finding it Very Difficult to Take Back Outsourced activities
b Lessons Learned
Outsource Products & Services that Others can Provide Better Keep Core Competences & Develop Cerebral Functions & Skills

AF Conf LOA Q415sjh92
Outsourcing Experience
Main Reasons Why Outsource Relationships Fail
•Oversell; Deal Confusion; Poor Planning; Handover Issues
•Trying to Replicate In-house Model and Micro-Managing Outsource Company
•Metrics Misalignment and Communications Problems
•Clash between Low Cost (Economies of Scale) & High Service (Flexibility)
Service ImprovementExpectation100
90
80
70
60 1 2 3
Reality
Time
Gains
%years
5%
X5%CostReductionExpectation
Service / CostImprovementReality
Service ImprovementExpectation
b Lessons Learned
WINNERS Differentiate between Core Competencesand Outsourcing Opportunities

AF Conf LOA Q415sjh92
2. Internal Business Integration • Cross-functional Processes & Actions• Integrated Performance Measures• Inter-department Teamwork
3. External Partnership Cooperation• Joint Business Processes & Objectives• Linked Performance Measures• Cross-Business Project Work
4. Enterprise-wide Collaboration• Enterprise-wide Aligned Processes• Shared Strategy & Execution Metrics• Joint Decision Making & Risk Taking
Organisation Readiness for Outsourcing Partnerships
1. Stand Alone Functional Focus• Discrete Departmental Processes• Functional Performance Measures• Resources Dedicated to Department
O r
g a
n i s
a t
i o n
M
a t
u r i
t y
Outsourcing Partnerships
Must be Ready at Level 3 or 4to be Successful
b Lessons Learned
BEWARE !
“Don’t give away the keys to the
Kingdom

AF Conf LOA Q415sjh92
Supply Chain Information Systems (SCIS)c Lessons Learned
Supply Chain Systems automate the flow of information enterprise-wide to help optimise the planning, sourcing, manufacturing and delivery of
materials
A p p l i c a t i o n s A p p l i c a t i o n s
Forecasting Purchasing Order Mgt Manufacturing Finance Distribution Service
D a t a W a r e h o u s e s
D a t a I n t e g r i t y D a t a I n t e g r i t y D a t a I n t e g r i t y D a t a I n t e g r i t y D a t a I n t e g r i t y D a t a I n t e g r i t y
Manufacturing Distribution Customer End User Supplier
Information Technology is Not a Solution it is Only an Enabler
Suppliers Your Business Customers
We Must Improve the Processes & Streamline the Supply Chain Network

AF Conf LOA Q415sjh92
Months Weeks Days HoursYear + Real-time
Strategic Planning• Capacity Planning
• Strategic Alliances
• Network Design
Operational Planning• MRP (Material Planning)
• Demand/Supply Planning
• Enterprise Master Plan
Execution
• Response to ATP
• Order Entry & Allocation
• Order Fulfillment
SCM Software Overview
Strategic Operational Tactical
Supply Chain Business Development Plans
• Demand & Supply Plans • Logistics Networks• Strategic Sourcing• Capacity & Production• Modeling & Analyticse.g. IBM; JDA Software
Day-to-Day Processes& Activities
• Warehouse Management• Transportation & Delivery • Inventory Management• Order Entry & Fullfilment• Reverse Logistsicse.g. RedPrairie; Roadnet
SCM Software Solutions ‘Best of Breed’
Enterprise Resource Planning (ERP)
Systems
e.g. SAP; Oracle
c Lessons Learned

AF Conf LOA Q415sjh92
SqSystems HexApps
Process1. Map Your Actual /
Required Process
2. Select Best Fit
Software
3. Align Your Process to
Match Selected Software
OctTools
OctTools
KEY STEPS
Process Refuse User Customisations
Matching Processes & Software Systems/Applications/Tools
c Lessons Learned

AF Conf LOA Q415sjh92
Processes, Systems & Tools – Implementation Experience
• Communicate Strategy to all Stakeholders and Gain unambiguous Agreement
• Establish the Foundation with Data Integrity
• Complete mapping to Match User Specification against System Capability
• Select Reputable Supplier with Best Fit Software Solution and validate Feasibility
• Align Processes with System Capability and Refuse User Customisations!
• Pilot Introduction to Prove Functionality and Build In-house Expertise.
• Use Project Management techniques to Plan, Coordinate and Control.
Golden Rules
SCM Systemsc
/2 FUNCTIONALITY – Half what you expected
*2 TIME – Takes twice the planned time to implement
*2 COST – Costs twice the amount budgeted
Lessons Learned

AF Conf LOA Q415sjh92
a) Lean Six Sigma Overview
b) Basic Process Improvement Tools
c) Case Study
Performance Improvement
5.
Winning with Logistics

AF Conf LOA Q415sjh92
Comparing Lean & Six Sigma
ProgramTheory
Key Steps
Focus
Six SigmaReduce Variation1. Define2. Measure3. Analyse4. Improve5. Control
Problem Focused
LeanImprove Speed & Value1. Identify Value2. Identify Value Stream 3. Flow4. Pull5. Perfection
Flow Focused
Assumptions • A Problem Exists• Figures & Numbers are Valued• System Output Improves if
Process Variation is Reduced
• Waste Removal will Improve Business Performance
• Many Small Improvements are the best way forward
Primary Effect
Secondary Effects
Criticisms
• Uniform Process Output
• Improved Quality• Less Waste• Fast Throughput• Less Inventory
• Processes Improved Independently
• Reduced Flow Time
• Less Variation• Uniform Output• Less Inventory• Improved Quality
• Statistical System Analysis Low Valued
Techniques

AF Conf LOA Q415sjh92
What does the Customer want?
What are we doing wrong right now?
How do we measure our success?
How well are we meeting the Customer’s needs right now?
What is going wrong?
What is the data telling us about our process variation?
What can we change to more completely satisfy the Customer?
Test and implement process changes
Maintain improvements by measuring process performance
DMAIC The Six Sigma Problem-Solving Model
Shortening the time between the customer order and delivery
Increasing the reliability of a process, product, or service to meet customer expectations
Lean Six Sigma
Define Measure Analyze ControlImprove
Techniques
Improve Service; Cost; Agility –> Target Process Cycle Times & Operations Lead Times

AF Conf LOA Q415sjh92
Tied to most Quality Improvement Approaches including Lean/Six Sigma
Relatively simple and easy to use by workers at all levels
Focused on facts and data, not opinion
Facilitate creative problem solving
• Process Map
• Check Sheet
• Histogram
• Fishbone Diagram
• Pareto Chart
• Scatter Diagram
• Control Chart
Basic Process Improvement Tools

AF Conf LOA Q415sjh92
Process Flow Chart
Check Sheet
Histogram
Fishbone Diagram
Pareto Chart
Scatter Diagram
Control Chart
Basic Process Improvement Tools
Process Quality Tool
• Define, Control
• Measure, Analyze
• Measure, Analyze
• Analyze
• Analyze
• Analyze, Improve
• Control
Maps Process Steps
Observed Process Data Collection
Shows Frequency Distributions
Cause and Effect Brainstorm Problems
Bar Chart showing Biggest Issues 1st
Collects pairs of data to study relationship
Plots Process against Upper & Lower Limits
DMAIC ApplicationCharts Typical Use

AF Conf LOA Q415sjh92
Process Flow Charts
Value of Process Flow Mapping
Identifies the sequence of activities or flow of materials and information in a process
Provides a picture of the steps needed to accomplish a task
Helps people understand the process
Sets the foundation for identifying critical to quality (CTQ) issues – selecting measurements, identifying root causes, identifying non-value added steps, reducing variation
DelayMove
ActivityProcessStep orActivity
Start or FinishPoint
Yes/NoDecision
Point
Input or
Output(Materials or Data)
DocumentCreated
Inspection
Mapping Symbols
Useful Rules Identify the entity that is the focal point (e.g. the customer, an order) Set clear boundaries including starting and ending points Keep it simple

AF Conf LOA Q415sjh92
Examine each delay symbol • What causes the delay?• How long is it?• How can we reduce the delay or
impact?
Review each activity symbol • Is it unnecessary or redundant?• What is the value relative to cost?• Can we prevent errors?
Investigate each decision • Does this step require an actual decision?
• If it is a checking activity, can it be automated or eliminated?
• Is it redundant?
Look for any loops • Would we need to repeat these activities if we had no failures?
• What are the costs for this loop?• Can this loop be eliminated? How?
Potential Improvement Opportunities
AF Conf LOA Q415sjh92
In Teams take 20 minutes to Map the Process
What is the focal point of the mapping effort? What are the boundaries of the process map? What detail is missing from this simple example?
Do the best you can to identify the major steps
Do not be overly concerned with using the “right” symbols
Calculate Min, Max and Average cycle time for the entire process
Note times and error rates against the corresponding process steps
Determine which steps Add Value and which steps do Not Add Value
Calculate the “cumulative” error rate
Process Flow Chart Mapping Exercise

AF Conf LOA Q415sjh92
Example – ORDER FULFILLMENT PROCESS
Customer Orders Part from Logistics Order Management (email or phone).
1% lost in communication
Order Pending Action (sits in “in box” around 2 hours (up to 4) until Work Order Raised.
Work Order emailed to Inventory Control to check stock availability and allocations.
Order sits in Inventory Clerk’s in-box until processed (0 - 2 hours). Process time 5 minutes.
Inventory Control Releases Order to Distribution Center if stock is available. If not Inventory Control notifies Logistics Order Management and provides estimated part availability date. (Supplier Lead Time?)
Logistics Order Management notifies Customer accordingly.
If stock is available pick list is prepared and held for stores worker. (0 – 1 hour)
Stores worker picks & packs order (average = 20 minutes)
Order waits for Inspection (average = 30 minutes)
Inspector takes 5 minutes to check order. Still, 1 out of 200 are wrong
Order released and prepared for shipment.
Transport collects order for delivery to Customer (1 - 3 hours)

AF Conf LOA Q415sjh92
• Helps Team Explore Possible Causes of the identified Problem (Effect)
• Framework for Brainstorming Root Causes under Main Categories (bones)
Effect e.g. Poor Cycle Time
Manpower Methods
Machines Materials
Fishbone Diagram – Cause and Effect
• For each bone drive down to root cause by asking “WHY” …. ……… (usually about 3 Levels to get at the real root cause)
• Each time there may be many reasons Why – you are looking for the primary “Why”
• Root Cause is an identified reason for contributing to the defect/problem
• Write down your ideas and Circle the Primary Whys on the diagram
• Primary Whys are the Root Cause that you prove-out with statistical tests
Problem Statement

AF Conf LOA Q415sjh92
Example Fishbone Diagram – Gas Mileage
Effect
Manpower Methods
Machines Materials
Poor Gas Mileage
Drives Too Fast
Always Late ImpatienceNo Awareness
Poor Maintenance
No $
In Car Temp & Climate
Windows Always Open
Over Use of Heat /Cool
Fuel Mix Too Rich
Carburetor Adjustment
Maintenance Issue
No Training
Poor Driving Habits
Over Use of Brake &
Accelerator
Wrong Tire Pressures
Tires Need Attention
Unbalanced Tires Don’t Know
Recommended Octane
Wrong Octane Gas
No Owners ManualLubrication Issue
No Oil Change
No $ Wrong Oil
No Clock
No Instruction
Final Why? = Root Cause

AF Conf LOA Q415sjh92
Define the Problem Statement EFFECT Draw a Fishbone Diagram using 4 categories
Manpower; Methods; Machines; Materials Use the Case Study issues described and your own
hypothesis to Identify Potential Root Causes
Case Study – Maintenance Turnaround On-time Delivery
Read through the Case Study
Put your teams choices for the top 6 root causes on a check sheet Randomly assign each of the 6 a number (1-6) Use a dice to generate 50 “observations” and plot them on your
check sheet Draw a Pareto Diagram of the data on the check sheet Prepare to present top 3 causes + recommended improvements
In Teams take 40 minutes to draw the Fishbone Diagram

AF Conf LOA Q415sjh92
88
Operations View• Too often Maintenance delays cause Operations readiness problems.
• Maintenance parts shortages are an ongoing issue.
• Maintenance keeps asking us to predict our requirements – they don’t appear to understand Operations difficulties and complexity.
• Maintenance always claim to be understaffed to meet our requirements.
• We frequently get bad news surprises from Maintenance (e.g. Your job is more difficult than expected so there will be a cost increase/time delay).
• Planned Maintenance should be matched against Operations requirements Not visa versa.
• Maintenance records are not as accurate as they need to be.
• Turnaround times are unreliable unless jobs are on the urgent list.
• The time it takes to repair and the types of corrective actions can be very different from one job to another even when discrepancies are similar.
• Maintenance don’t seem to understand that we are the Customers and they should try to do everything possible to meet our requirements.
Case Study – Maintenance Turnaround On-time Delivery
AF Conf LOA Q415sjh92
89
Maintenance View• Operations always want everything immediately - they don’t understand that
we have limited resources and equipment.
• Inventory levels are impossible to plan without a robust workload forecast.
• Maintenance staff are constantly re-prioritising work to suit Operations changes but nobody is interested in the disruption/difficulty this causes.
• Maintenance personnel should receive more credit and time for multi-skilled training.
• We have to share some specialised tools and this causes delays.
• High skilled Maintenance Engineers often have to undertake unskilled work.
• Operations constantly keep changing their planned maintenance schedules.
• The Maintenance high workload pressure and changes cause mislaid and lost parts throughout the Maintenance and Logistics Departments.
• Inventory stock levels and records are hard to match and frequently incorrect because of constant work fluctuations.
• Too often urgent supplier purchase orders have to be placed for critical parts and we have to pay premiums for fast production and delivery.
Case Study – Maintenance Turnaround On-time Delivery

AF Conf LOA Q415sjh92
90
Finance & Admin View• Maintenance costs are out of control – way above budget.
• Maintenance staff work too much overtime and it is questionable if this is necessary or productive.
• Overall Inventory levels are very high but we still have too many shortages.
• The ongoing conflict between Maintenance and Operations is unproductive.
• Perhaps we should outsource more of our Maintenance to Aircraft Manufacturers - this should be investigated.
• Maintenance administration processes should be streamlined and automated.
• Poor Maintenance workload forecasts cause excessive overspend costs.
• Maintenance has a skills profiling gap that needs to be resolved as soon as possible.
• We are often in conflict with our parts suppliers because they typically require longer lead times to deliver on-time at standard cost.
• We should benchmark our Maintenance activities against other similar Military and Commercial to identify improvement opportunities.
Case Study – Maintenance Turnaround On-time Delivery

AF Conf LOA Q415sjh92
4 or 5 6 or 7 8 or 9 10 or 11 12
1 2 3 4 5 6
2 or 3DICE ROLL
CAUSE
DESCRIPTION
Fishbone Diagram – Check Sheet Team Name
AF Conf LOA Q415sjh92
Performance Improvement
Summary
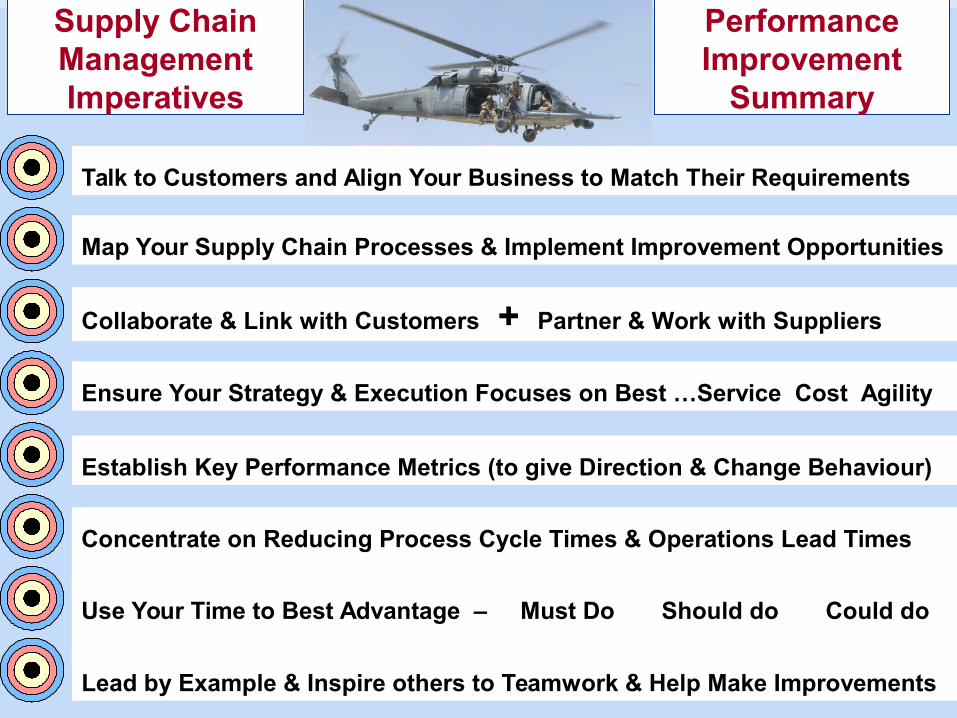
Supply Chain ManagementImperatives
Ensure Your Strategy & Execution Focuses on Best …Service Cost Agility
Talk to Customers and Align Your Business to Match Their Requirements
Collaborate & Link with Customers + Partner & Work with Suppliers
Lead by Example & Inspire others to Teamwork & Help Make Improvements
Map Your Supply Chain Processes & Implement Improvement Opportunities
Use Your Time to Best Advantage – Must Do Should do Could do
Establish Key Performance Metrics (to give Direction & Change Behaviour)
Concentrate on Reducing Process Cycle Times & Operations Lead Times