
1 Investor Relations Banco do Brasil 3Q06 Results Banco do Brasil 3Q06 Results Investor Relations.
15
1 Investor Relations Banco do Brasil 3Q06 Results Investor Relations
-
date post
20-Dec-2015 -
Category
Documents
-
view
224 -
download
1
Transcript of 1 Investor Relations Banco do Brasil 3Q06 Results Banco do Brasil 3Q06 Results Investor Relations.
1Investor Relations
Banco do Brasil3Q06 Results
Banco do Brasil3Q06 Results
Investor Relations

2Investor Relations
2Q06 9M05Net Income 1,438 1,546 907 3,417 4,796 -41.3 40.4
Net Interest Income 4,199 4,312 4,403 12,336 13,121 2.1 6.4Allowance for Loan Losses¹ (966) (1,757) (1,385) (3,029) (4,487) -21.2 48.1Fee Income 1,952 2,246 2,252 5,648 6,601 0.3 16.9Administrative Expenses 3,338 3,451 3,443 9,637 10,131 -0.2 5.1
Sep/05 Dec/05 Jun/06Total Assets 245,511 252,977 273,836 281,615 14.7 11.3 2.8
Loan Portfolio 94,685 101,789 113,103 118,349 25.0 16.3 4.6Securities Portfolio 68,610 66,470 70,677 73,766 7.5 11.0 4.4Deposits 122,672 137,658 139,939 144,902 18.1 5.3 3.5Assets Under Management 150,378 153,508 171,154 180,629 20.1 17.7 5.5Shareholders' Equity 16,826 16,850 19,178 20,197 20.0 19.9 5.3
% 3Q05 2Q06 3Q06 9M05 9M06ROE - Annualized 40.8 36.3 19.8 30.5 35.9
NIM - Annualized 9.0 8.1 7.9 8.6 7.9Efficiency 44.9 43.3 48.7 47.5 46.5Delinquency ² 3.9 3.6 3.8Allowance / Deliquency ² 161.2 203.9 196.6
BIS Ratio 17.4 17.3 17.7
Sep/05 Jun/06Change % over
Dec/05 Sep/06
3Q05 2Q06Change % over
3Q06 9M05 9M06
HighlightsHighlightsHighlightsHighlights
(1) Credit Operations characteristics only(2) Past Due Loans + 60 days
R$ million
3Investor Relations
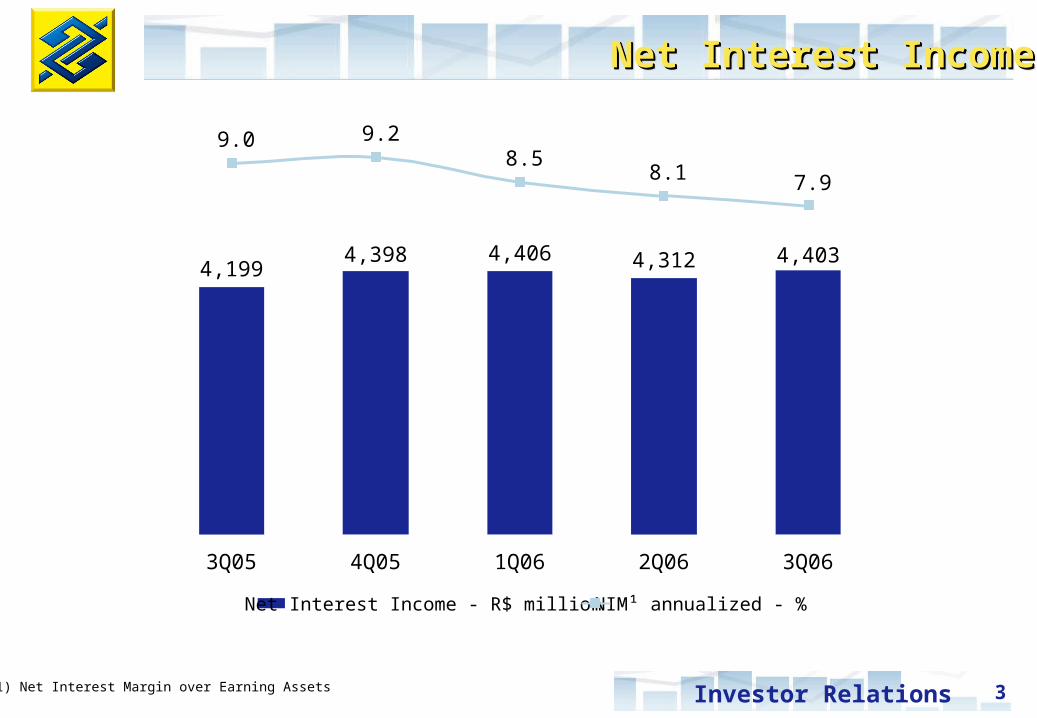
Net Interest Income - R$ million NIM¹ annualized - %
Net Interest IncomeNet Interest IncomeNet Interest IncomeNet Interest Income
(1) Net Interest Margin over Earning Assets
3Q05 4Q05 1Q06 2Q06 3Q06
4,1994,398 4,406 4,312 4,403
9.0 9.28.5
8.1 7.9

4Investor Relations
Sep/05 Dec/06 Jun/06 Sep/06 %Dec/05 %Jun/06Loan Portfolio 94,685 101,789 113,103 118,349 16.3 4.6Domestic 86,146 92,612 103,209 107,922 16.5 4.6
Individuals 18,510 18,386 21,637 23,155 25.9 7.0Free Funds 16,560 16,685 20,201 21,681 29.9 7.3
Payroll Loans 3,286 3,810 6,040 7,356 93.1 21.8Car Loans 202 188 409 618 229.1 51.0
SMEs 15,006 15,204 16,847 16,813 10.6 -0.2Businesses 21,383 23,315 24,811 27,630 18.5 11.4Agribusiness 31,247 35,708 39,914 40,324 12.9 1.0
Abroad 8,539 9,177 9,894 10,427 13.6 5.4
R$ million
Loan PortfolioLoan PortfolioLoan PortfolioLoan Portfolio
Individuals SMEs Businesses Agribusiness Abroad
2Q06 - % 3Q06 - %
19.6
14.0
23.6
34.1
8.819.1
14.7
22.2
35.3
8.7
5Investor Relations
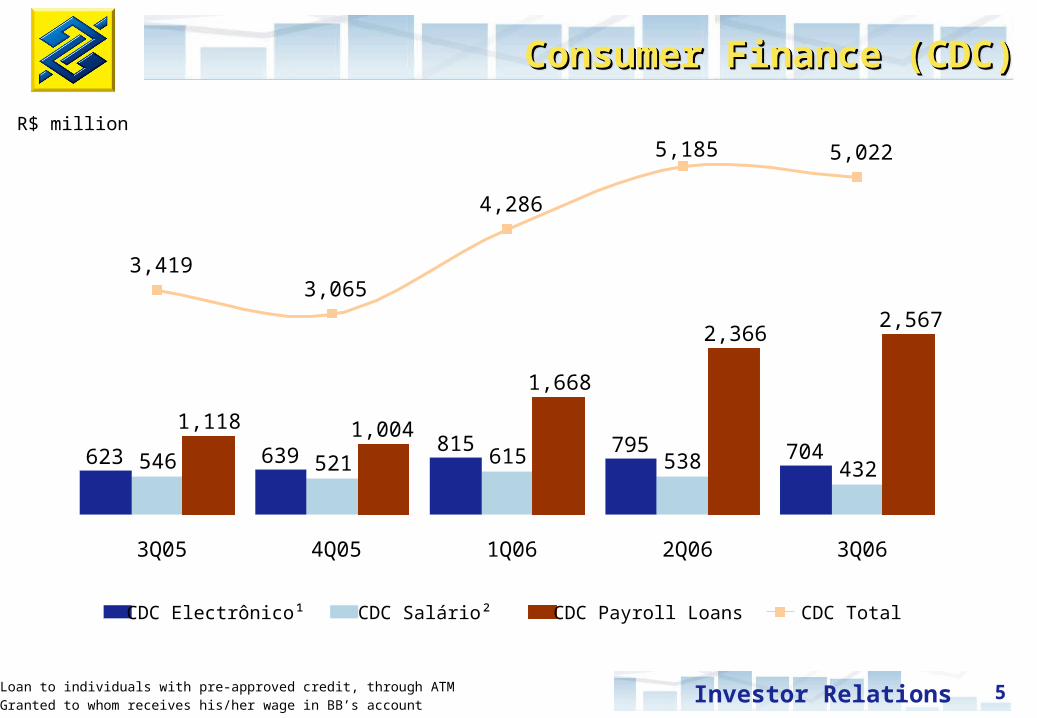
R$ million
CDC Electrônico¹ CDC Salário² CDC Payroll Loans CDC Total
(1) Loan to individuals with pre-approved credit, through ATM(2) Granted to whom receives his/her wage in BB’s account
Consumer Finance (CDC)Consumer Finance (CDC)Consumer Finance (CDC)Consumer Finance (CDC)
623 639815 795 704546 521 615 538 432
1,118 1,004
1,668
2,3662,567
3,4193,065
4,286
5,185 5,022
3Q05 4Q05 1Q06 2Q06 3Q06

6Investor Relations
BBAA-C D-HAA-C D-H
2Q06 3Q06
Credit Risk - %Credit Risk - %Credit Risk - %Credit Risk - %
(1) Source: Brazilian Central Bank
BankingIndustry¹
Retail Commercial Agribusiness ForeignTrade
Abroad
88.9 89.6 94.9 95.1 84.8 81.5 98.1 97.5 98.6 98.6
18.5 1.9 2.5 1.4 1.415.24.95.110.411.1
88.4 87.6 89.5 89.6
10.5 10.412.411.6

7Investor Relations
Delinquency and Provision for Credit RiskDelinquency and Provision for Credit RiskDelinquency and Provision for Credit RiskDelinquency and Provision for Credit Risk
Quarterly Provision Expenses - R$ million
Provision Expenses / Loan Portfolio¹ - %
Allowance for loan losses / Loan Portfolio - %Past Due Loans + 15 days / Loan Portfolio - %Past Due Loans + 60 days / Loan Portfolio - %
(1) Average Portfolio and Expenses of the last 12 months
6.3 6.67.3 7.4 7.4
5.9
5.66.0
5.0 5.2
3.9 4.0 4.33.6 3.8
3Q05 4Q05 1Q06 2Q06 3Q06
4.24.7 4.9
5.5 5.6
966
3Q05
1,498
4Q05
1,345
1Q06
1,757
2Q06
1,385
3Q06

8Investor Relations
Individuals Credit Deliquency¹Individuals Credit Deliquency¹Individuals Credit Deliquency¹Individuals Credit Deliquency¹
Banking IndustryBB BB
Past Due Loans + 15 days - % Past Due Loans + 90 days - %
(1) Free Funds Operations except Funds e Programs, Credit Card Fin., Leasing.
Banking Industry
14.9 14.8 14.713.9
14.513.8
14.5 14.7
13.3 12.8 12.4 12.1 12.113.1 13.4 13.8
12.913.7 13.6 14.0 14.3
14.8 14.2 14.5 14.5 14.5
8.1 8.2 8.2 8.5 8.2 8.1 7.5 7.4
7.1 6.8 6.8 6.8 6.86.5 6.5 6.8 6.7 6.9 7.2 7.3 7.4
7.7 7.2 7.5 7.6 7.8
Sep/05 Nov/05 Jan/06 Mar/06 May/06 Jul/06 Sep/06
9Investor Relations
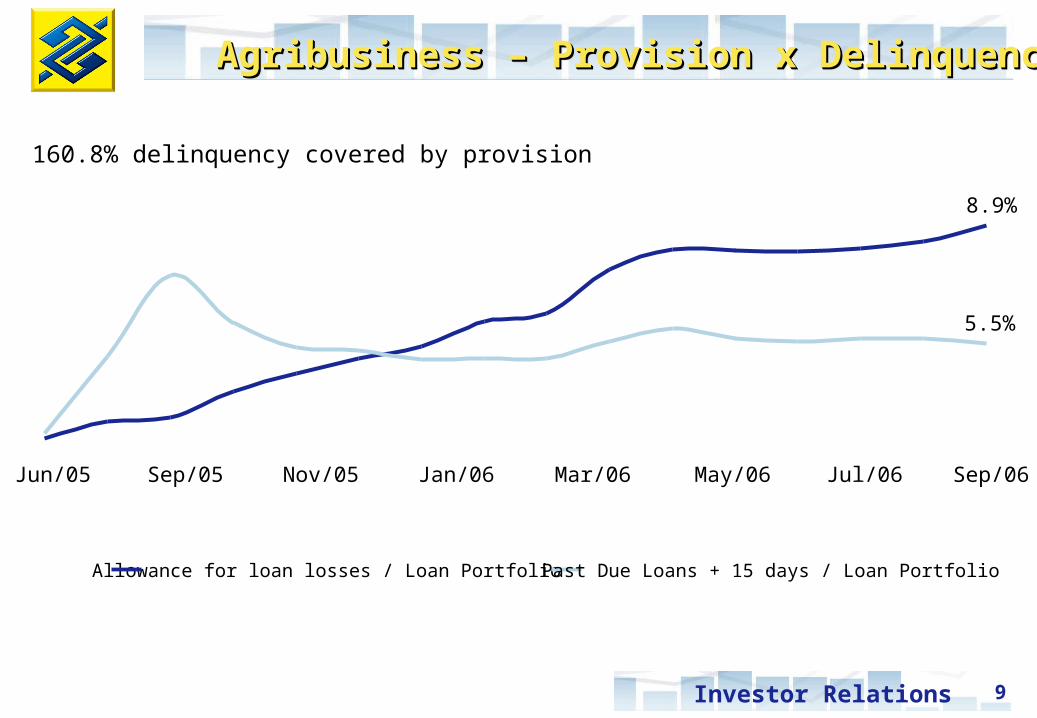
Allowance for loan losses / Loan Portfolio Past Due Loans + 15 days / Loan Portfolio
160.8% delinquency covered by provision
8.9%
5.5%
Jun/05 Sep/05 Nov/05 Jan/06 Mar/06 May/06 Jul/06 Sep/06
Agribusiness – Provision x DelinquencyAgribusiness – Provision x DelinquencyAgribusiness – Provision x DelinquencyAgribusiness – Provision x Delinquency
10Investor Relations
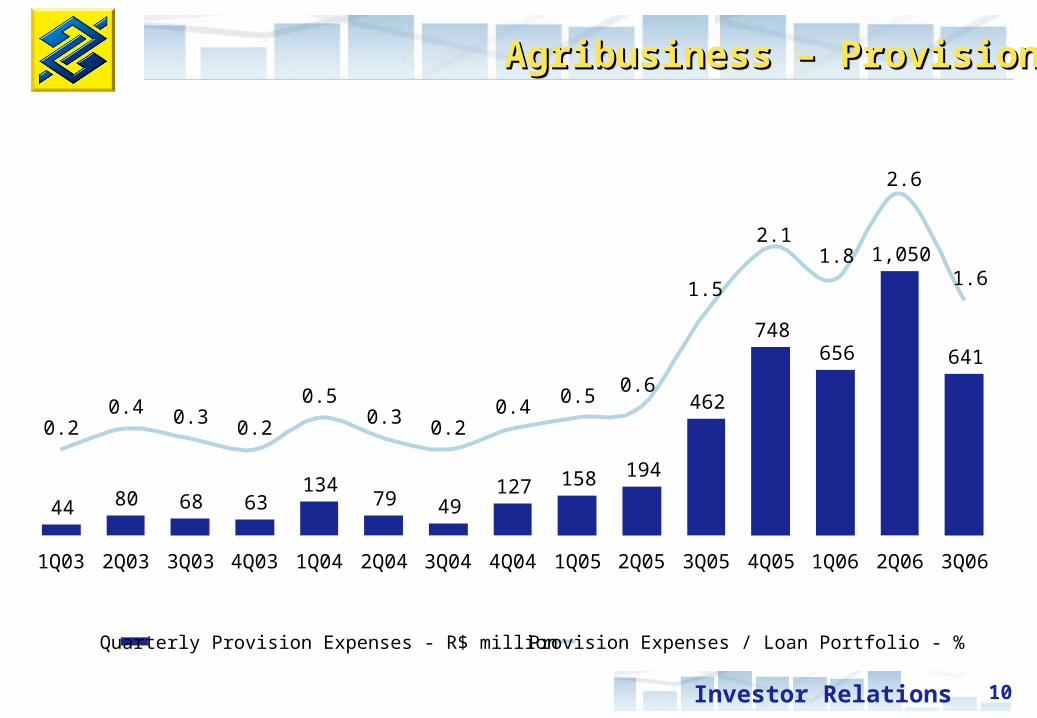
Quarterly Provision Expenses - R$ million Provision Expenses / Loan Portfolio - %
Agribusiness – ProvisionAgribusiness – ProvisionAgribusiness – ProvisionAgribusiness – Provision
44 80 68 63134
79 49127 158 194
462
748656
1,050
641
0.20.4 0.3 0.2
0.50.3 0.2
0.4 0.5 0.6
1.5
2.11.8
2.6
1.6
1Q03 2Q03 3Q03 4Q03 1Q04 2Q04 3Q04 4Q04 1Q05 2Q05 3Q05 4Q05 1Q06 2Q06 3Q06
11Investor Relations
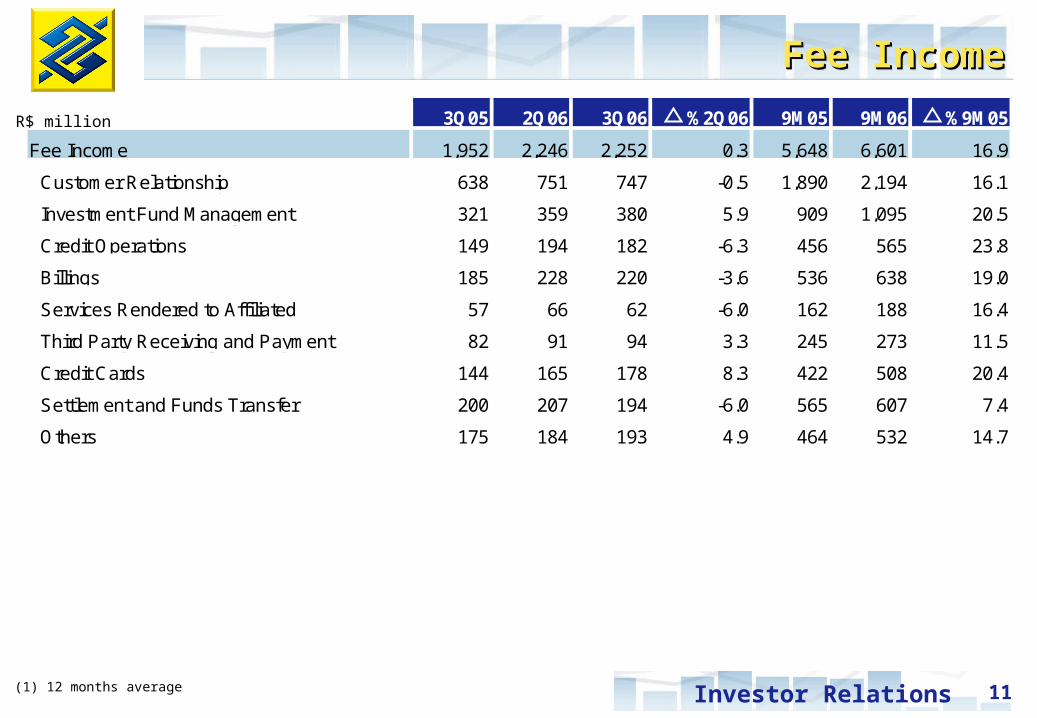
3Q05 2Q06 3Q06 %2Q06 9M05 9M06 %9M05
Fee Income 1,952 2,246 2,252 0.3 5,648 6,601 16.9
Customer Relationship 638 751 747 -0.5 1,890 2,194 16.1
Investment Fund Management 321 359 380 5.9 909 1,095 20.5
Credit Operations 149 194 182 -6.3 456 565 23.8
Billings 185 228 220 -3.6 536 638 19.0
Services Rendered to Affiliated 57 66 62 -6.0 162 188 16.4
Third Party Receiving and Payment 82 91 94 3.3 245 273 11.5
Credit Cards 144 165 178 8.3 422 508 20.4
Settlement and Funds Transfer 200 207 194 -6.0 565 607 7.4
Others 175 184 193 4.9 464 532 14.7
R$ million
Fee IncomeFee IncomeFee IncomeFee Income
(1) 12 months average
12Investor Relations
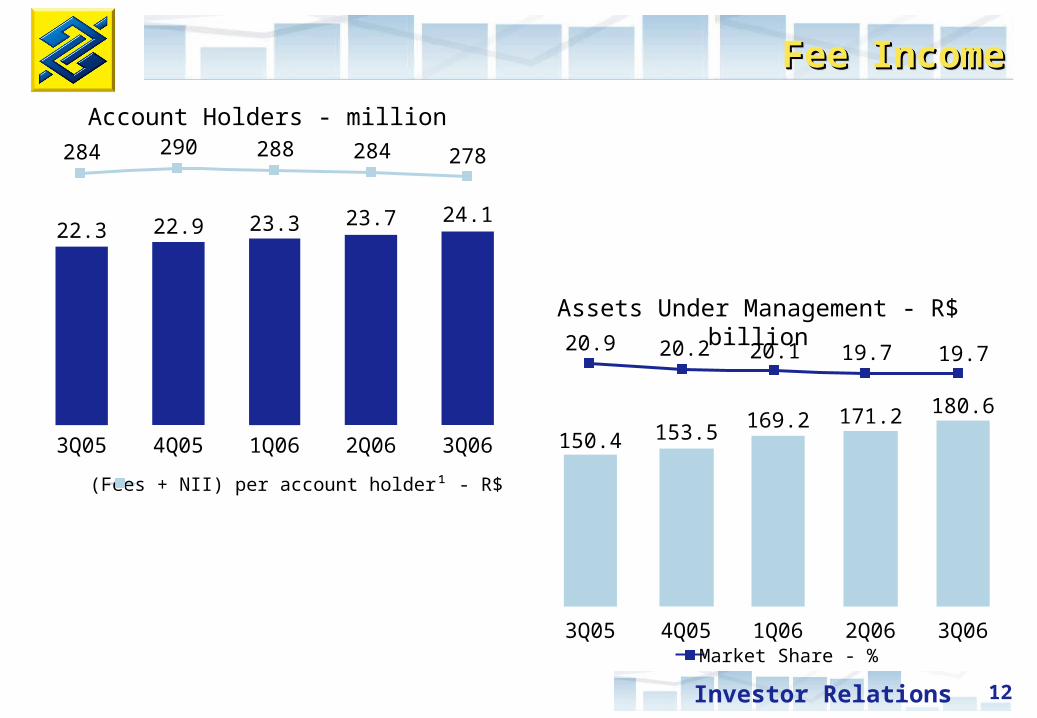
(Fees + NII) per account holder¹ - R$
Market Share - %
Account Holders - million
Assets Under Management - R$ billion
19.7
150.4 153.5169.2 171.2 180.6
20.9 20.2 20.1 19.7
3Q05 4Q05 1Q06 2Q06 3Q06
22.3 22.9 23.3 23.7 24.1
284 290 288 284 278
3Q05 4Q05 1Q06 2Q06 3Q06
Fee IncomeFee IncomeFee IncomeFee Income

13Investor Relations
3Q05 2Q06 3Q06 %2Q06 9M05 9M06 %9M05
Administrative Expenses (3,106) (3,253) (3,216) -1.1 (9,133) (9,624) 5.4
Personnel Expenses (1,709) (1,839) (1,804) -1.9 (5,034) (5,424) 7.7
Other Administrative Expenses (1,362) (1,383) (1,378) -0.3 (3,991) (4,091) 2.5
Telecom. and Data Processing (375) (362) (374) 3.3 (1,052) (1,110) 5.4
Amortization and Depreciation (157) (171) (177) 3.8 (477) (517) 8.6
Security, Guard and Transp. Serv. (177) (193) (214) 11.0 (543) (593) 9.3
Exp. with Premises and Equipment (172) (187) (189) 1.2 (521) (568) 8.9
Marketing and Public Relations (114) (108) (90) -16.5 (319) (270) -15.2
Exp. with Outsourced Services (129) (135) (129) -4.8 (404) (393) -2.8
Other Administrative Expenses (238) (226) (204) -9.6 (676) (641) -5.2
Other Tax Expenses (36) (31) (34) 10.0 (108) (109) 0.5
Legal Risk (268) (229) (192) -16.2 (503) (616) 22.4
Legal Claims (40) (67) (51) -24.3 (183) (219) 19.3
Labor Claims (228) (162) (141) -13.0 (319) (397) 24.4
R$ million
Administrative ExpensesAdministrative ExpensesAdministrative ExpensesAdministrative Expenses
14Investor Relations
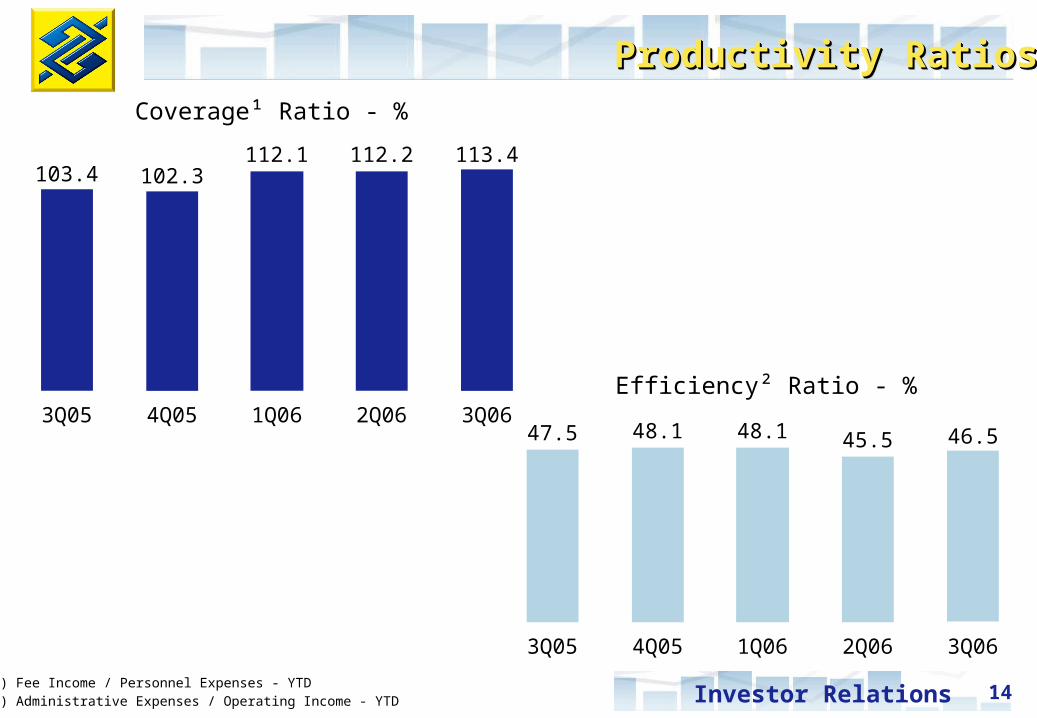
Coverage¹ Ratio - %
(1) Fee Income / Personnel Expenses - YTD(2) Administrative Expenses / Operating Income - YTD
Productivity RatiosProductivity RatiosProductivity RatiosProductivity Ratios
Efficiency² Ratio - %
47.5 48.1 48.1 45.5 46.5
103.4 102.3112.1 112.2 113.4
3Q05 4Q05 1Q06 2Q06 3Q06
3Q05 4Q05 1Q06 2Q06 3Q06
15Investor Relations
Investor Relations DivisionSBS - Quadra 1 - Bloco C - Ed. Sede III - 5° floor
70073-901 - Brasília (DF)Phone: 55 (61) 3310.3980
Fax: 55 (61) 3310.3735
DisclaimerDisclaimer - This presentation contains references and statements, planned synergies, increasing estimates, projections of results and future strategy for Banco do Brasil, it’s Associated and Affiliated Companies and Subsidiaries. Although these references and statements reflect the
management’s belief, it also involves imprecision and high difficult risks to be foreseen, consequently, it may conduct to a different result than the one anticipated here. These expectations are highly depended on market conditions, on the Brazilian economic performance, on the sector and the
international market. Banco do Brasil is not responsible for bringing up to date any estimate in this presentation.
For further information access www.bb.com.br/ri


![TSKB 3Q07 IR Presentation[1].ppt · 3Q07 BRSA RESULTS INVESTOR PRESENTATION. TSKB BANKING SECTOR vs TSKB APPENDICES 3. ... (000 USD) 3Q06 3Q07 Change Adj. Net Interest Income 82,829](https://static.fdocuments.net/doc/165x107/5f3cb90e3398b3456406d2bb/tskb-3q07-ir-presentation1-3q07-brsa-results-investor-presentation-tskb-banking.jpg)
