1 Intrafish Seafood Investment Forum May 22, 2013 New York Kelly Nelson, EVP & CFO Heather...
31
1 Intrafish Seafood Investment Forum May 22, 2013 New York Kelly Nelson, EVP & CFO Heather Keeler-Hurshman Director of Investor Relations
-
Upload
mason-steverson -
Category
Documents
-
view
215 -
download
0
Transcript of 1 Intrafish Seafood Investment Forum May 22, 2013 New York Kelly Nelson, EVP & CFO Heather...
1
Intrafish Seafood Investment Forum
May 22, 2013 New York
Kelly Nelson, EVP & CFO
Heather Keeler-HurshmanDirector of Investor Relations
2
Disclaimer
Certain statements made in this presentation are forward-looking and are subject to important risks, uncertainties and assumptions concerning future conditions that may ultimately prove to be inaccurate and may differ materially from actual future events or results. Actual results or events may differ materially from those predicted. Certain material factors or assumptions were applied in drawing the conclusions as reflected in the forward-looking information. Additional information about these material factors or assumptions is contained in High Liner's annual MD&A and is available on SEDAR (www.sedar.com).

3
Presentation Currencies
• HLF is traded on the Toronto Stock Exchange and references to stock price and dividends are in Canadian dollars.
• Effective with the company’s 2012 annual report all financial statements are presented in USD.– 2010, 2011 and 2012 are fully converted and
restated under IFRS rules to USD– Previous years Canadian GAAP statements are
converted from Canadian dollars at the annual period end & average USD/CAD exchange rates and remain under Canadian GAAP.
4
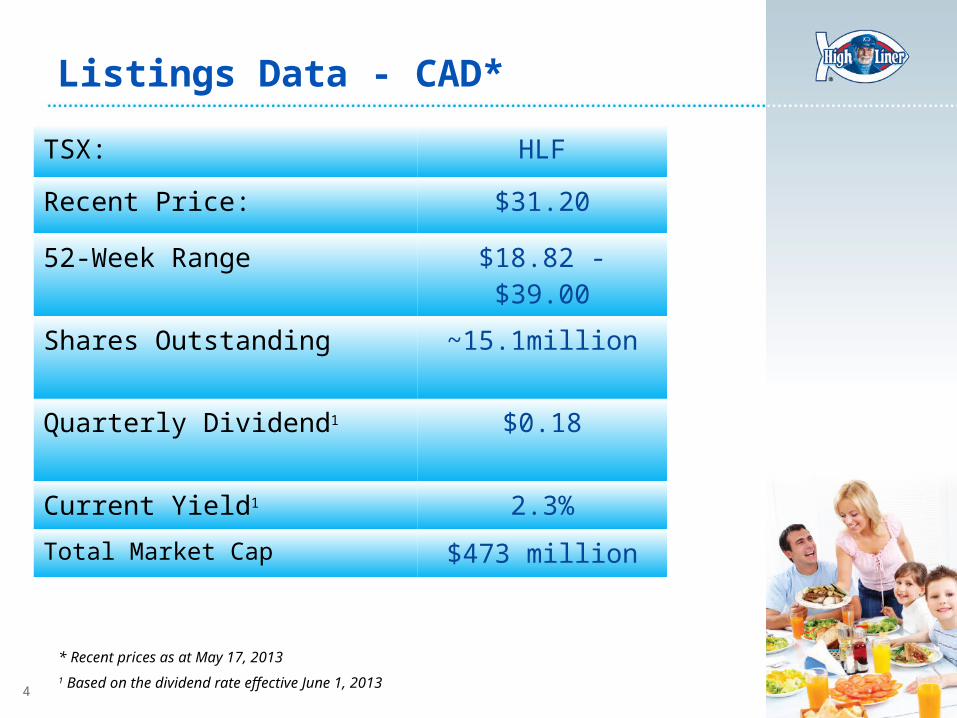
Listings Data - CAD*
TSX: HLF
Recent Price: $31.20
52-Week Range $18.82 - $39.00
Shares Outstanding ~15.1million
Quarterly Dividend1 $0.18
Current Yield1 2.3%
Total Market Cap $473 million
* Recent prices as at May 17, 20131 Based on the dividend rate effective June 1, 2013
5
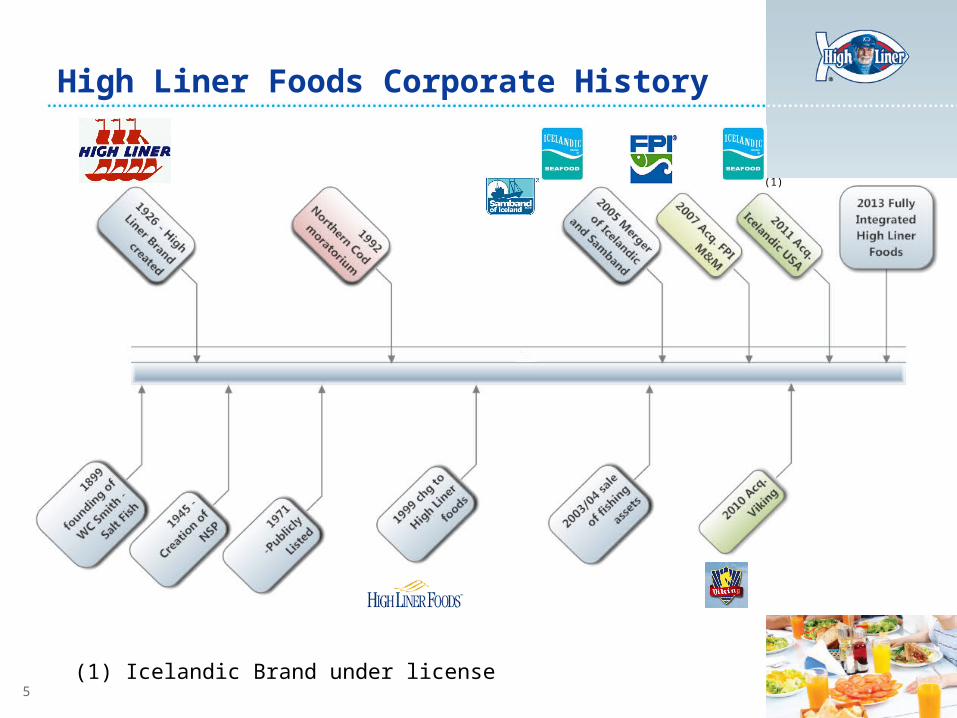
High Liner Foods Corporate History
(1) Icelandic Brand under license
(1)
6
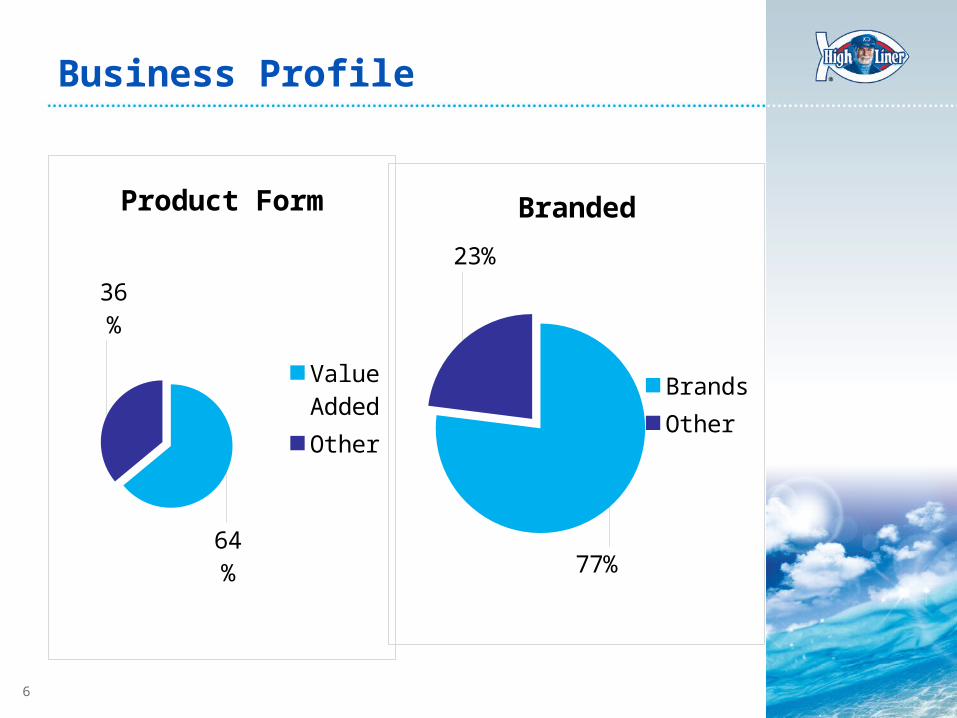
Business Profile
64%
36%
Product Form
Value AddedOther
77%
23%
Branded
BrandsOther
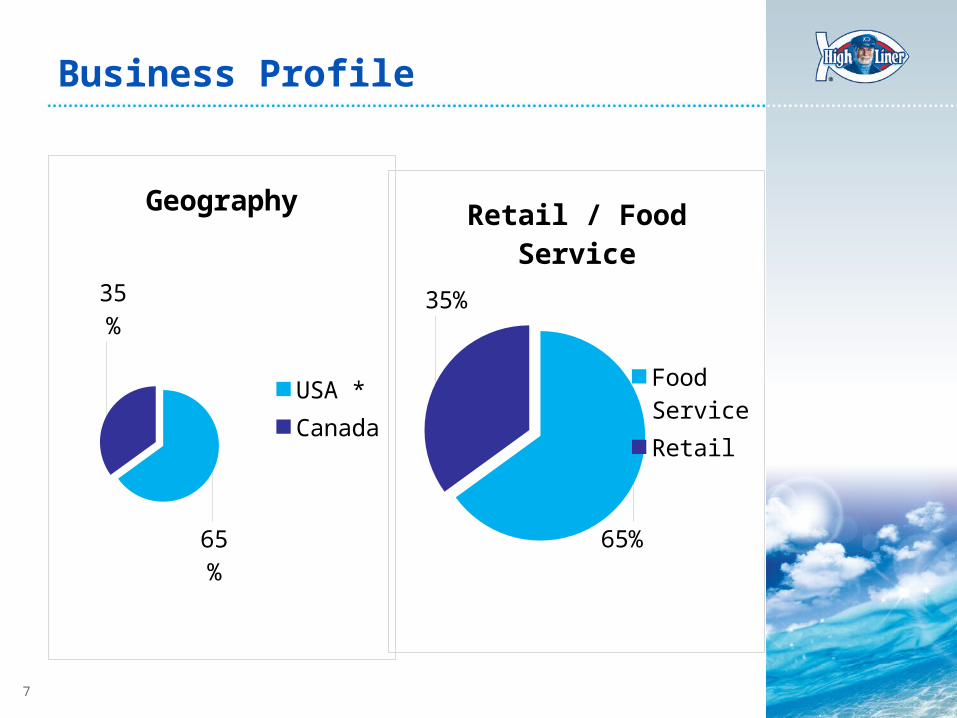
7
Business Profile
65%
35%
Geography
USA *Canada
65%
35%
Retail / Food Service
Food ServiceRetail
8
Our Business Model
Broadest market reach in industry
Market leading brands
Diversified global procurement
Frozen food logistics expertise
Innovative product development
9
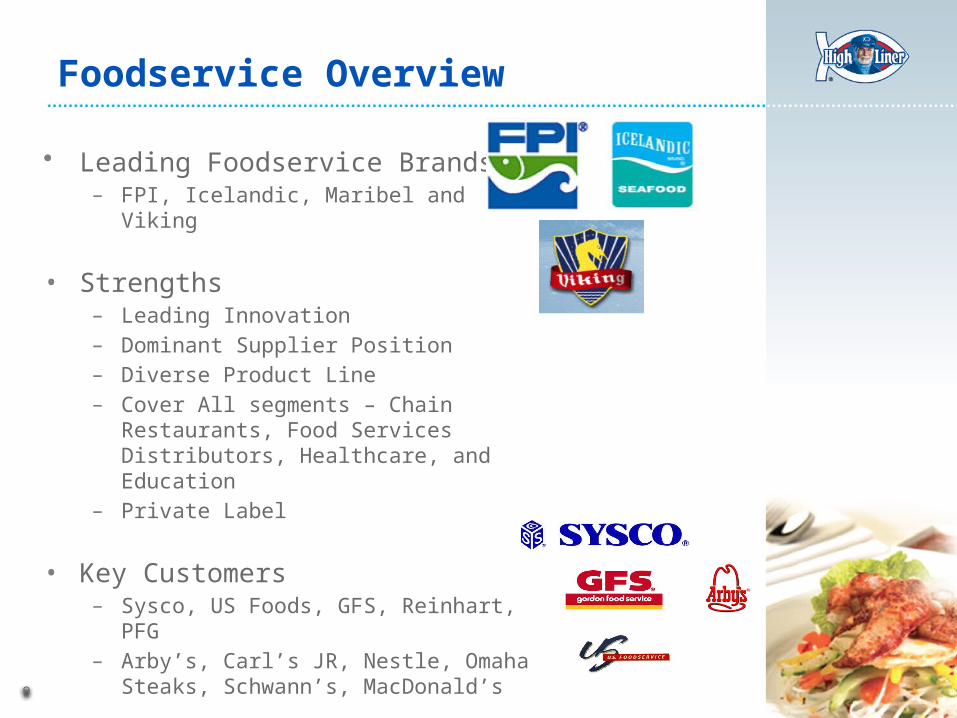
Foodservice Overview
• Leading Foodservice Brands– FPI, Icelandic, Maribel and Viking
• Strengths– Leading Innovation– Dominant Supplier Position– Diverse Product Line– Cover All segments – Chain Restaurants,
Food Services Distributors, Healthcare, and Education
– Private Label
• Key Customers – Sysco, US Foods, GFS, Reinhart, PFG– Arby’s, Carl’s JR, Nestle, Omaha Steaks,
Schwann’s, MacDonald’s
10
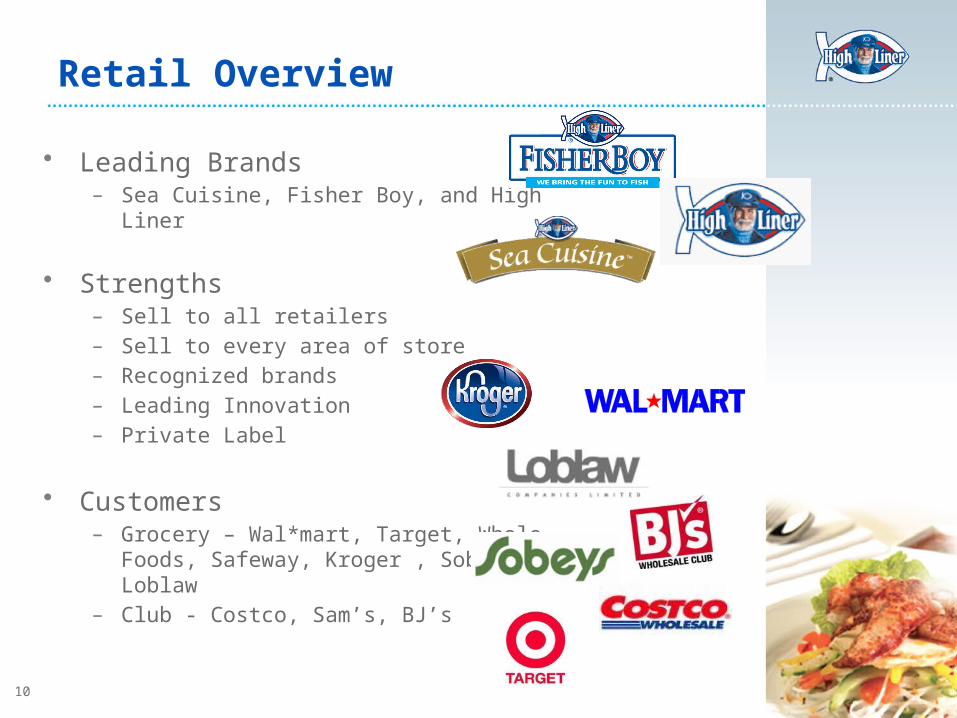
Retail Overview
• Leading Brands – Sea Cuisine, Fisher Boy, and High Liner
• Strengths– Sell to all retailers– Sell to every area of store– Recognized brands– Leading Innovation– Private Label
• Customers– Grocery – Wal*mart, Target, Whole Foods,
Safeway, Kroger , Sobeys, Loblaw– Club - Costco, Sam’s, BJ’s
11
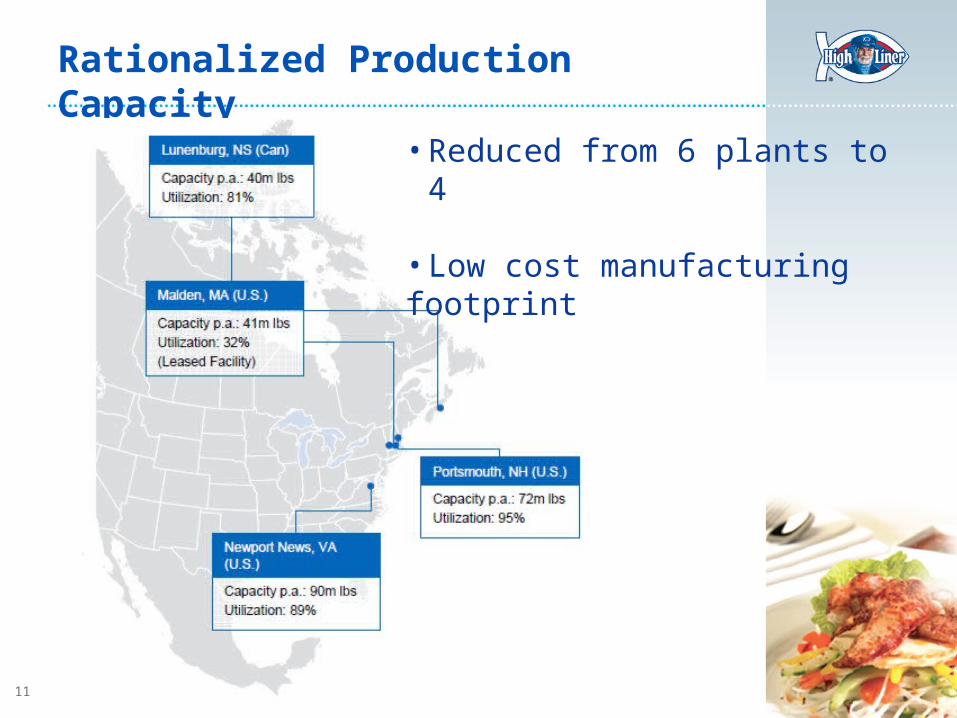
Rationalized Production Capacity
• Reduced from 6 plants to 4
• Low cost manufacturing footprint
12
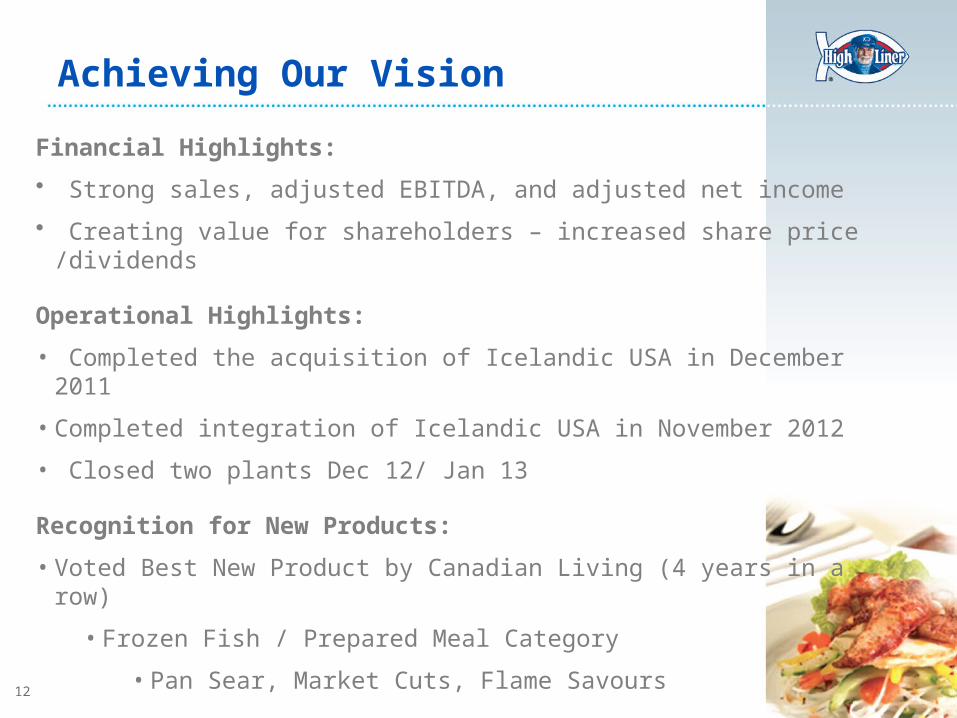
Achieving Our Vision
Financial Highlights:
• Strong sales, adjusted EBITDA, and adjusted net income
• Creating value for shareholders – increased share price /dividends
Operational Highlights:
• Completed the acquisition of Icelandic USA in December 2011
• Completed integration of Icelandic USA in November 2012
• Closed two plants Dec 12/ Jan 13
Recognition for New Products:
• Voted Best New Product by Canadian Living (4 years in a row)
• Frozen Fish / Prepared Meal Category
• Pan Sear, Market Cuts, Flame Savours
Financial Review
13
14
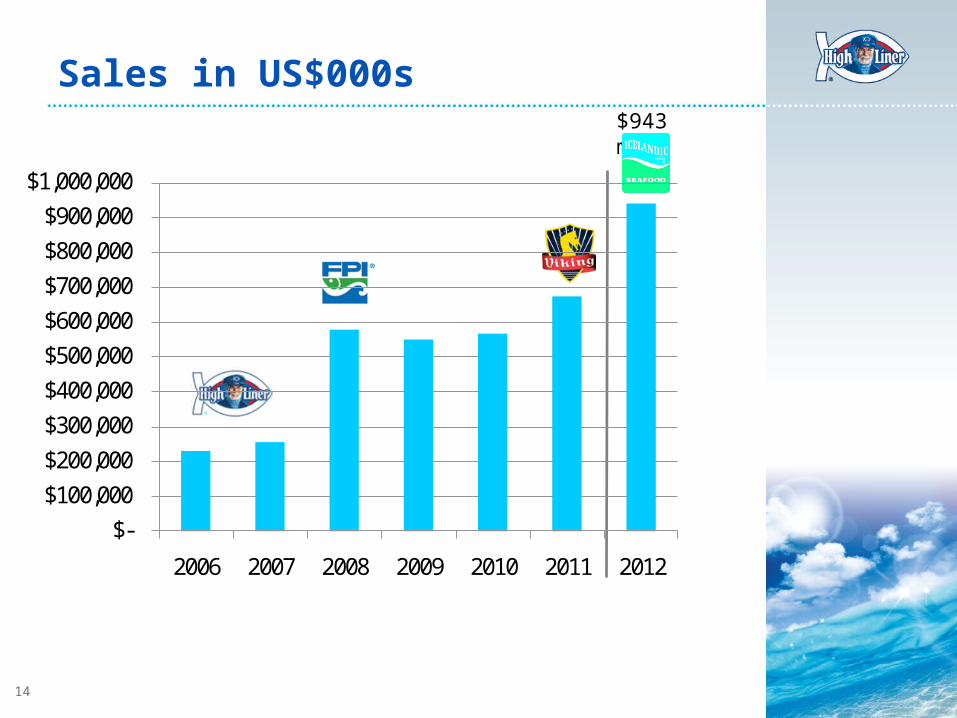
Sales in US$000s
$-$100,000 $200,000 $300,000 $400,000 $500,000 $600,000 $700,000 $800,000 $900,000
$1,000,000
2006 2007 2008 2009 2010 2011 2012
$943 mm
15
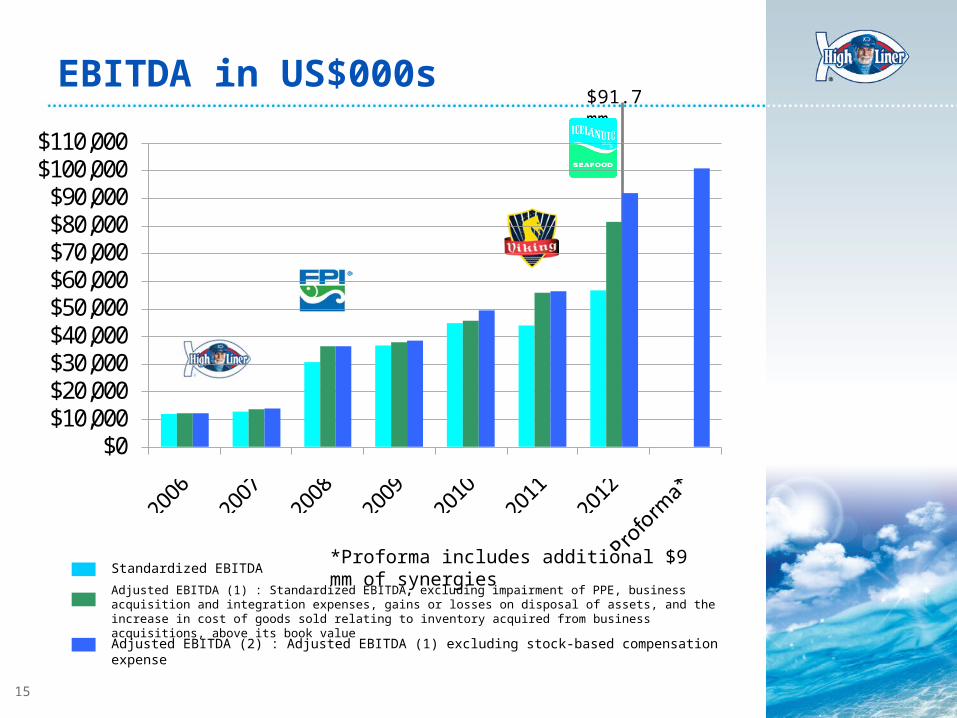
EBITDA in US$000s
$0$10,000$20,000$30,000$40,000$50,000$60,000$70,000$80,000$90,000
$100,000$110,000
Standardized EBITDA
Adjusted EBITDA (1) : Standardized EBITDA, excluding impairment of PPE, business acquisition and integration expenses, gains or losses on disposal of assets, and the increase in cost of goods sold relating to inventory acquired from business acquisitions, above its book value
Adjusted EBITDA (2) : Adjusted EBITDA (1) excluding stock-based compensation expense
$91.7 mm
*Proforma includes additional $9 mm of synergies
16
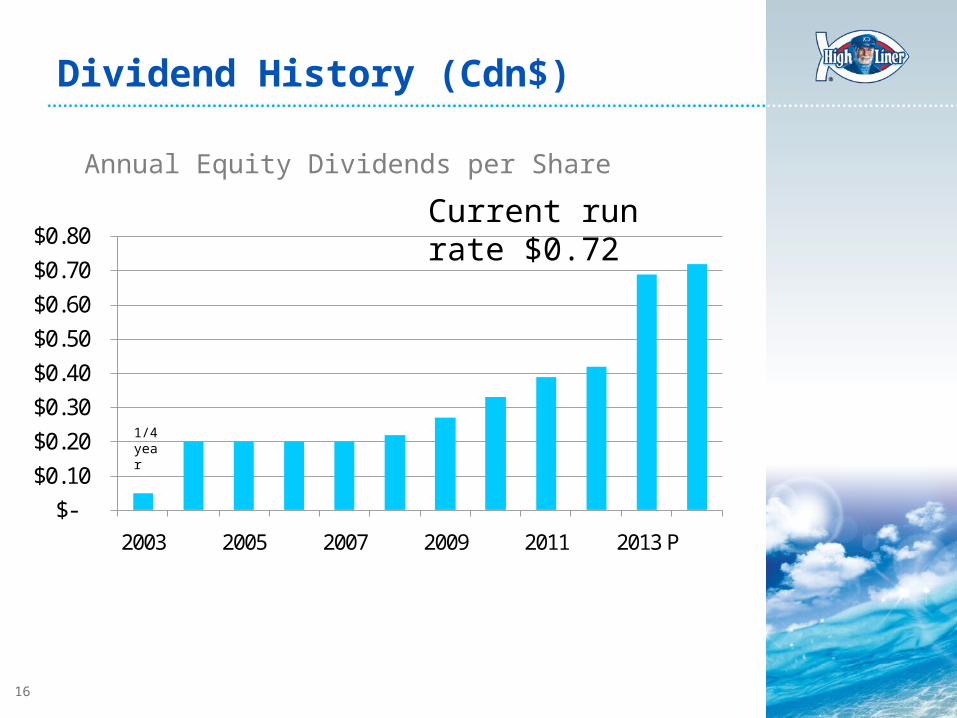
Dividend History (Cdn$)
$-
$0.10
$0.20
$0.30
$0.40
$0.50
$0.60
$0.70
$0.80
2003 2005 2007 2009 2011 2013 P
Annual Equity Dividends per Share
Current run rate $0.72
1/4 year
17
YTD 2012 – Strong Momentum
• Integration of Icelandic USA completed ahead of schedule
• Now expecting annual ongoing synergies of at least $18 million, the high end of original estimate of $16-$18 million
• Plant consolidation completed
• Strong sales, Adjusted EBITDA and Adjusted EPS growth
• Canadian Retail operations turnaround continues• 9.9% sales volume growth• New Flame Savours product contributed to sales growth
Q1 2013 - A Challenging Quarter
• Decline in selling prices for commodity products
• Weak private label sales
• Soft U.S. restaurant sales and early Lent
• Production and distribution challenges with move
to Newport News
• On track for annual projected synergies
• Reduced interest expense and leverage ratio
18
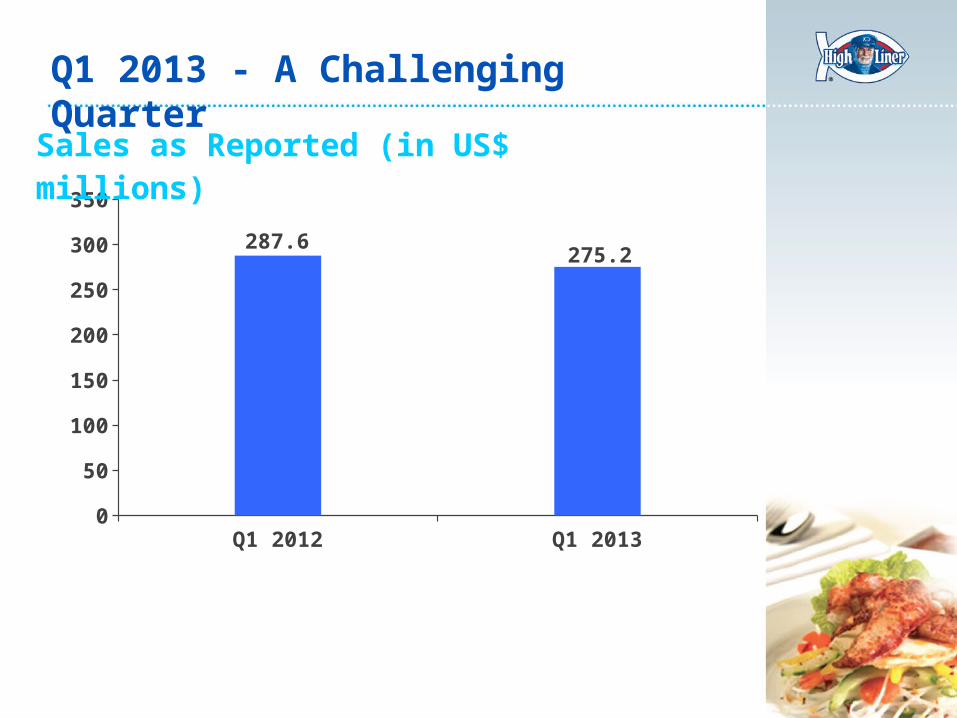
Q1 2013 - A Challenging Quarter
Q1 2012 Q1 20130
50
100
150
200
250
300
350
287.6275.2
Sales as Reported (in US$ millions)
Q1 2013 - A Challenging Quarter
• Decline in selling prices for commodity products
• Weak private label sales
• Soft U.S. restaurant sales and early Lent
• Production and distribution challenges with move
to Newport News
• On track for annual projected synergies
• Reduced interest expense and leverage ratio
19
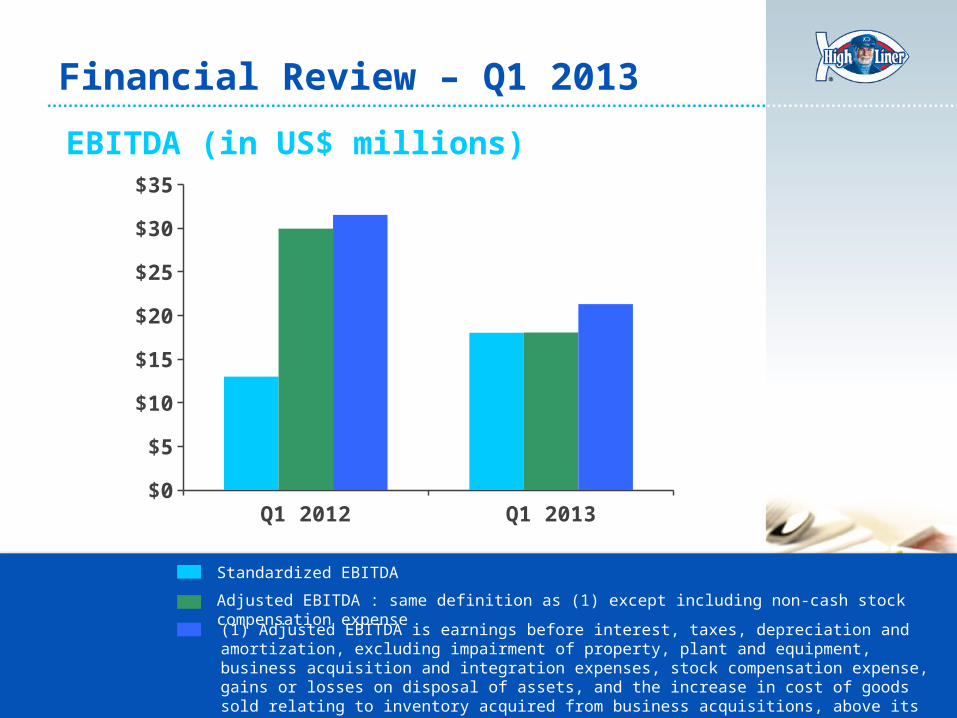
Financial Review – Q1 2013
Q1 2012 Q1 2013$0
$5
$10
$15
$20
$25
$30
$35
EBITDA (in US$ millions)
Standardized EBITDA
(1) Adjusted EBITDA is earnings before interest, taxes, depreciation and amortization, excluding impairment of property, plant and equipment, business acquisition and integration expenses, stock compensation expense, gains or losses on disposal of assets, and the increase in cost of goods sold relating to inventory acquired from business acquisitions, above its book value, as part of the fair value requirements of purchase price accounting.
Adjusted EBITDA : same definition as (1) except including non-cash stock compensation expense
Q1 2013 - A Challenging Quarter
• Decline in selling prices for commodity products
• Weak private label sales
• Soft U.S. restaurant sales and early Lent
• Production and distribution challenges with move
to Newport News
• On track for annual projected synergies
• Reduced interest expense and leverage ratio
20
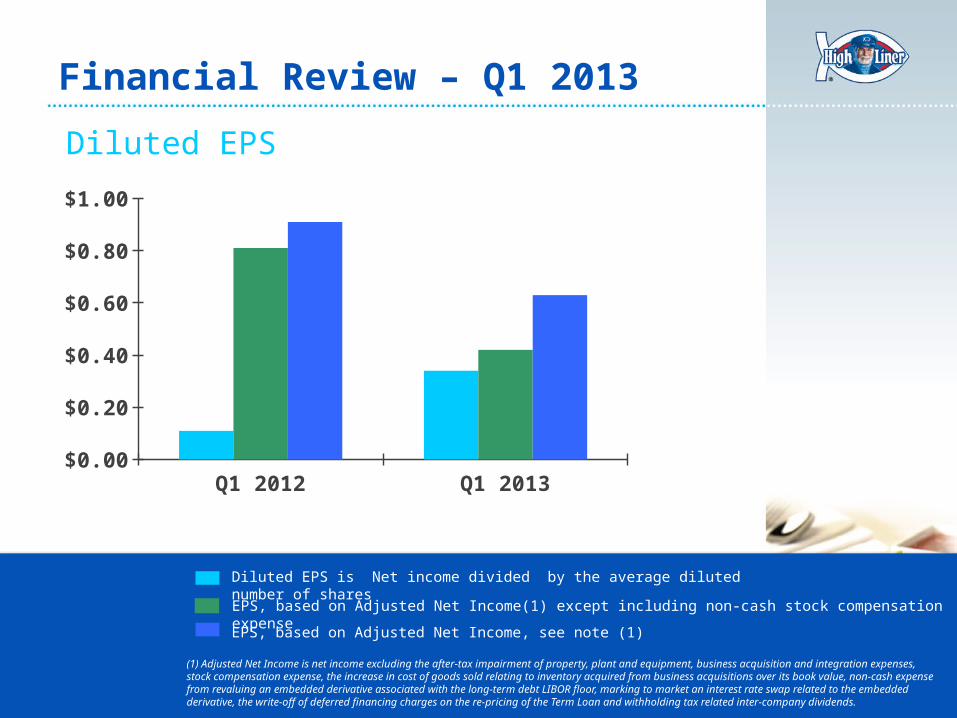
Diluted EPS
Q1 2012 Q1 2013$0.00$0.10$0.20$0.30$0.40$0.50$0.60$0.70$0.80$0.90$1.00
Diluted EPS is Net income divided by the average diluted number of shares
EPS, based on Adjusted Net Income(1) except including non-cash stock compensation expense
EPS, based on Adjusted Net Income, see note (1)
(1) Adjusted Net Income is net income excluding the after-tax impairment of property, plant and equipment, business acquisition and integration expenses, stock compensation expense, the increase in cost of goods sold relating to inventory acquired from business acquisitions over its book value, non-cash expense from revaluing an embedded derivative associated with the long-term debt LIBOR floor, marking to market an interest rate swap related to the embedded derivative, the write-off of deferred financing charges on the re-pricing of the Term Loan and withholding tax related inter-company dividends.
Financial Review – Q1 2013
Q1 2013 - A Challenging Quarter
• Decline in selling prices for commodity products
• Weak private label sales
• Soft U.S. restaurant sales and early Lent
• Production and distribution challenges with move
to Newport News
• On track for annual projected synergies
• Reduced interest expense and leverage ratio
21
• Decline in selling prices for commodity products
• Weak private label sales
• Soft U.S. restaurant sales and early Lent
• Production and distribution challenges with move
to Newport News
• On track for annual projected synergies
• Reduced interest expense and leverage ratio
Q1 2013 - A Challenging Quarter
22
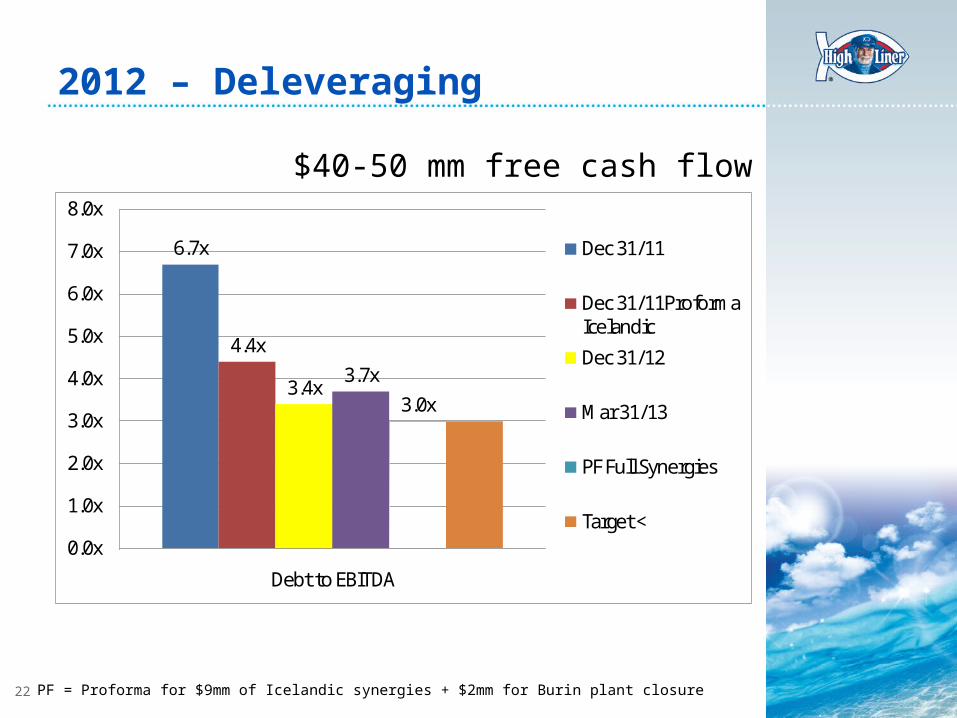
2012 – Deleveraging
6.7x
4.4x
3.4x3.7x
3.0x
0.0x
1.0x
2.0x
3.0x
4.0x
5.0x
6.0x
7.0x
8.0x
Debt to EBITDA
Dec 31/11
Dec 31/11Proforma Icelandic
Dec 31/12
Mar 31/13
PF Full Synergies
Target <
$40-50 mm free cash flow
PF = Proforma for $9mm of Icelandic synergies + $2mm for Burin plant closure
23
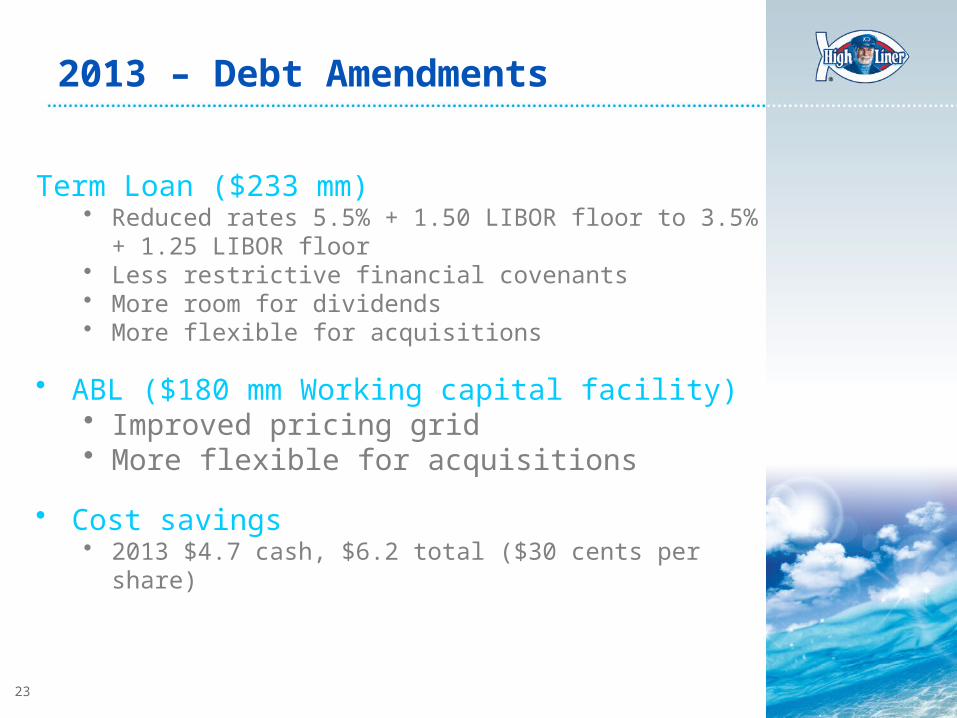
2013 – Debt Amendments
Term Loan ($233 mm)• Reduced rates 5.5% + 1.50 LIBOR floor to 3.5% + 1.25
LIBOR floor• Less restrictive financial covenants• More room for dividends• More flexible for acquisitions
• ABL ($180 mm Working capital facility)• Improved pricing grid• More flexible for acquisitions
• Cost savings• 2013 $4.7 cash, $6.2 total ($30 cents per share)
Outlook & Growth Strategy
24
25
Our Vision
26
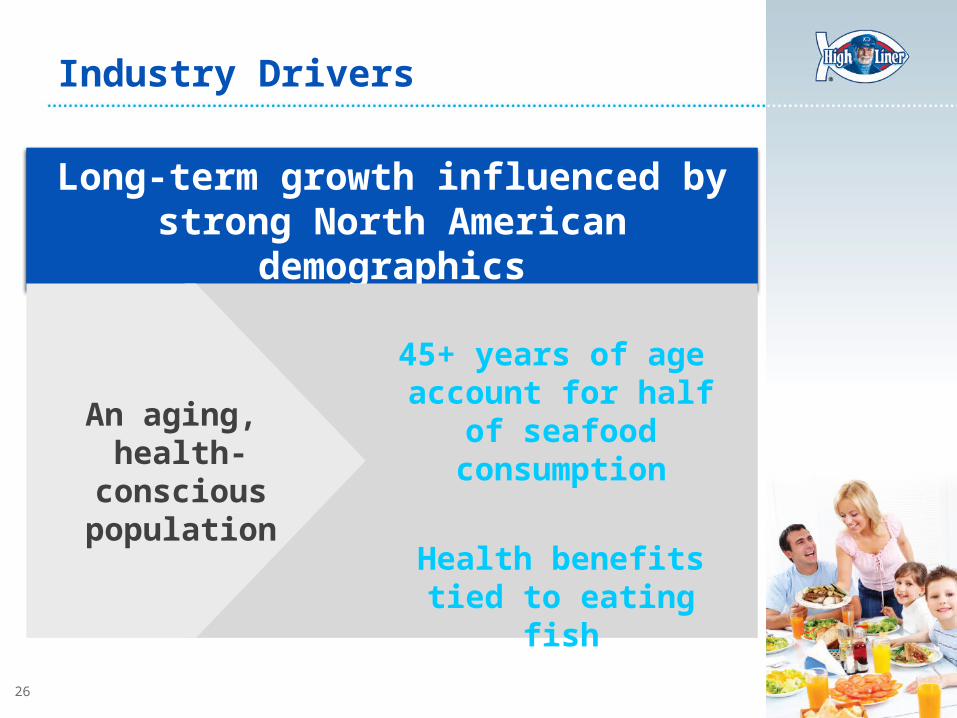
Industry Drivers
Long-term growth influenced by strong North American demographics
An aging, health-conscious
population
45+ years of age account for half of
seafood consumption
Health benefits tied to eating fish
27
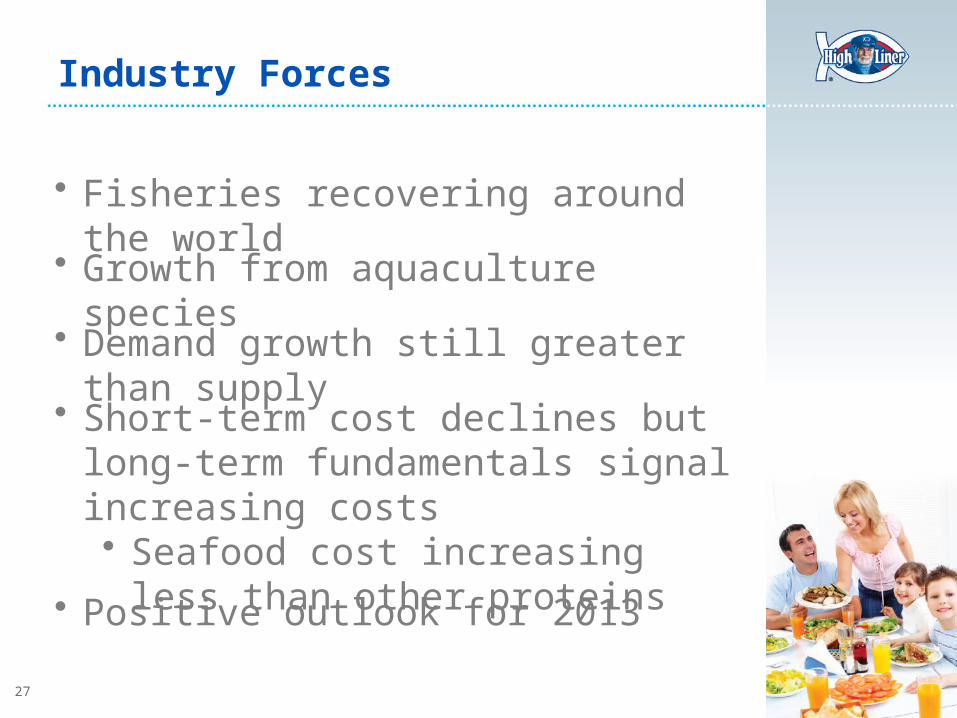
• Fisheries recovering around the world
• Growth from aquaculture species
• Demand growth still greater than supply
• Positive outlook for 2013
• Short-term cost declines but long-term fundamentals signal increasing costs• Seafood cost increasing less than
other proteins
Industry Forces

28
Areas of Strategic Focus
#1: PROFITABLE GROWTH
• Icelandic SynergiesSupply Chain Cost savings (Goal #3)
• Organic Growth• Leverage scale• Product innovation
• Acquisitions• Expand product portfolio• Strengthen market leadership
Achieve $150 million in EBITDA by 2015 (1)
(1) Run rate
29
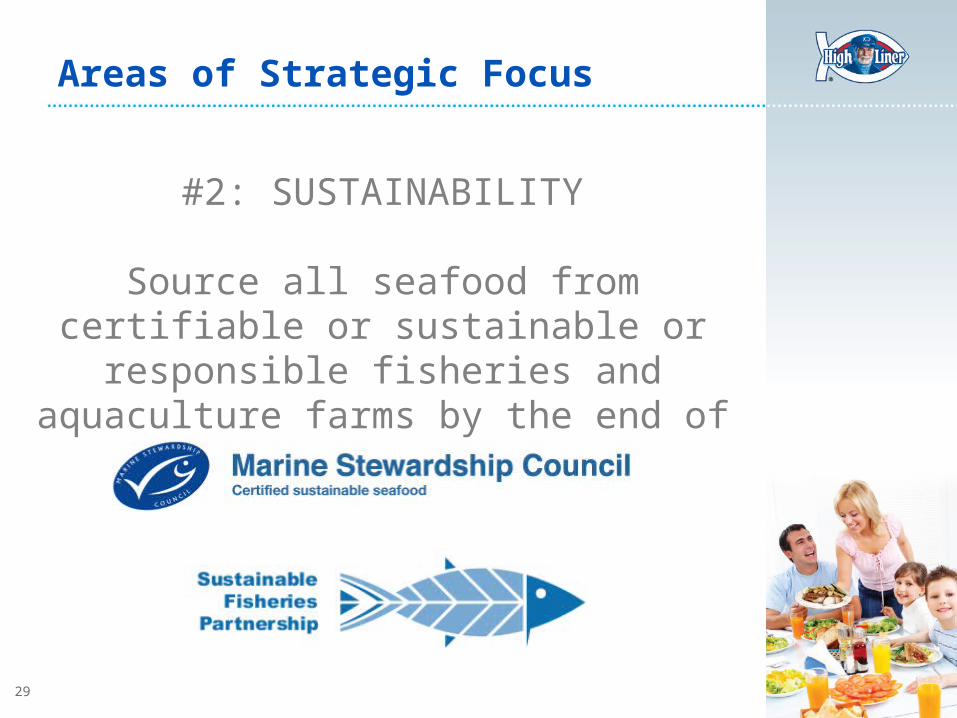
Areas of Strategic Focus
#2: SUSTAINABILITY
Source all seafood from certifiable or sustainable or responsible fisheries and aquaculture farms by the end of 2013
30
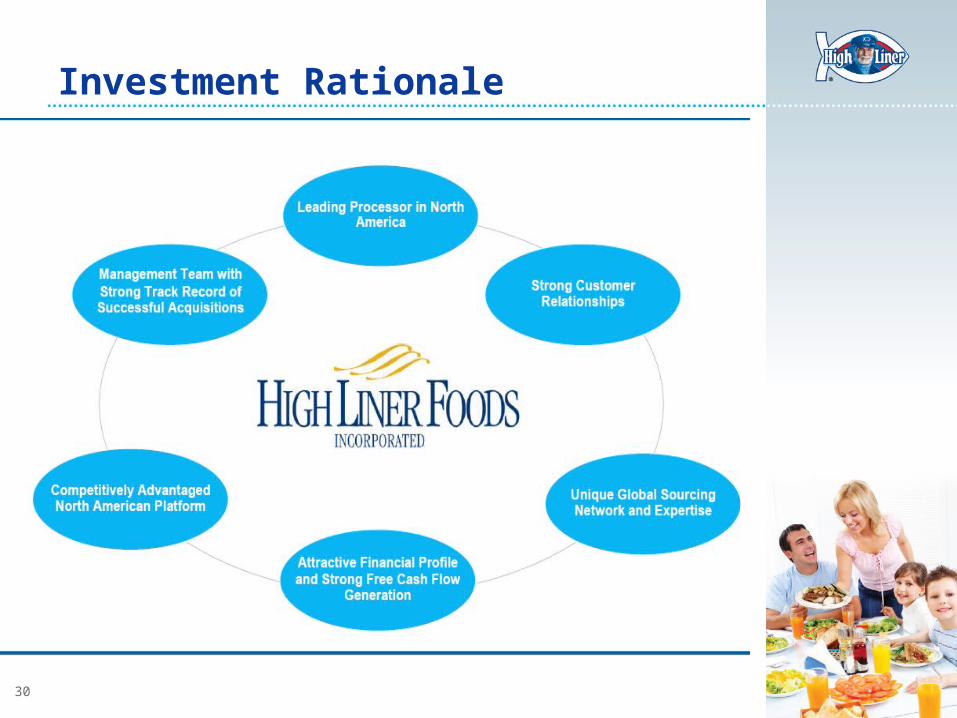
Investment Rationale

31
InvestorPresentation
Questions?