1 Identification of Causal Variables for Building Energy Fault Detection by Semi-supervised LDA &...
44
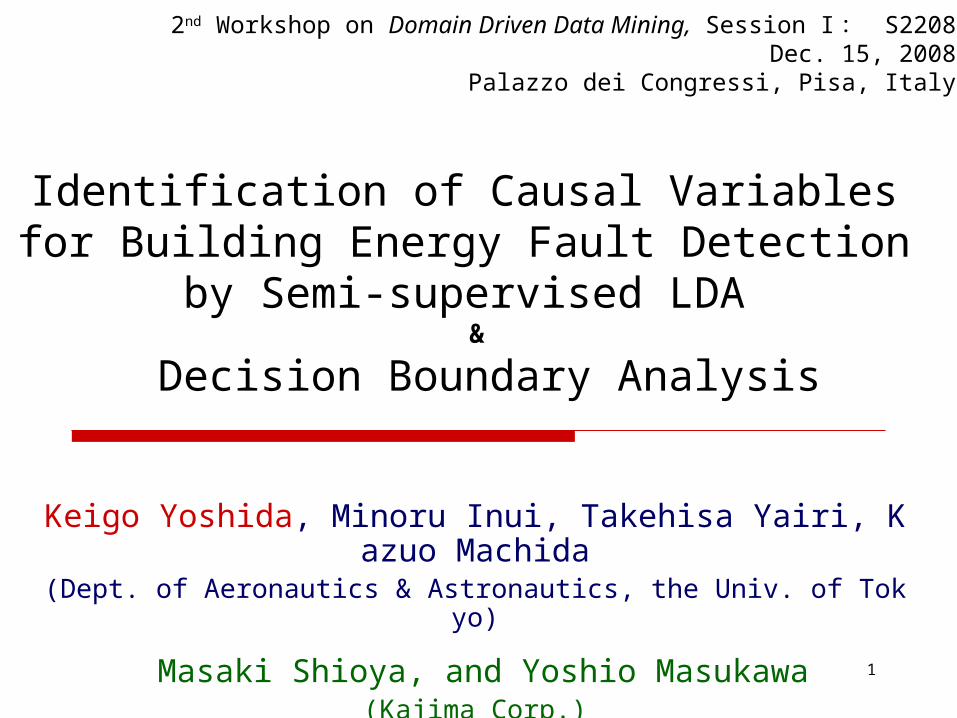
1 Identification of Causal Variables for Building Energy Fault Detection by Semi-supervised LDA & Decision Boundary Analysis Keigo Yoshida, Minoru Inui, Takehisa Yairi, K azuo Machida (Dept. of Aeronautics & Astronautics, the Univ. of Tok yo) Masaki Shioya, and Yoshio Masukawa (Kajima Corp.) 2 nd Workshop on Domain Driven Data Mining, Session I : S2208 Dec. 15, 2008 Palazzo dei Congressi, Pisa, Italy
-
Upload
rolf-nelson -
Category
Documents
-
view
216 -
download
1
Transcript of 1 Identification of Causal Variables for Building Energy Fault Detection by Semi-supervised LDA &...
1
Identification of Causal Variables for Building Energy Fault Detection
by Semi-supervised LDA &
Decision Boundary Analysis
Keigo Yoshida, Minoru Inui, Takehisa Yairi, Kazuo Machida(Dept. of Aeronautics & Astronautics, the Univ. of Tokyo)
Masaki Shioya, and Yoshio Masukawa(Kajima Corp.)
2nd Workshop on Domain Driven Data Mining, Session I : S2208Dec. 15, 2008
Palazzo dei Congressi, Pisa, Italy

2
Main Point of the Presentation
We propose …
A Supportive Method for Anomaly Cause Identificationby
Combining Traditional Data Analysis and Domain Knowledge
Applied to Real Building Energy Management System (BEMS)
Root cause of energy wastes was found successfully

3
Outline
Introduction
Theories
Experiments for Real Data
Conclusions

4
Introduction: What is BEMS ?
Building Energy Management Systems
Collect/Monitor Sensor Data in BLDG(temperature, heat consumption etc…)
Energy-efficient Control Discover Energy Faults (wastes)
I/F
BEMS

5
Introduction: Problem of BEMS Hard to identify root causes of Energy Faults
(EF) Complex Relation between Equipments Data Deluge from Numerous Sensors
(approx. 2000 sensors, 20000 points for 20-story)
Current EF Detection:
Heuristics Based on Expert’s Empirical Knowledge,
usually fuzzy “IF-THEN” rules.
“Heuristic Diagnostics is Incomplete”
Fuzziness False Negative Error Detection-Only Cannot Improve Systems

6
Early Fault Diagnosis Methods
Expert SystemFuzzy Logic
Supervised Learning
Performance
UnsupervisedLearning /
Data Mining
Source DataExpertsInterpretationModeling Cost LowExpensive
HardEasy
Versatility HighPoor
Data-DrivenKnowledge-BasedModeling-Based
• FTA/FMEA• Bayesian Filtering• FDA…
• Feature Extraction• Neural Networks…
Knowledge Acquisition Bottleneck
Neglecting Useful Knowledge

7
Proposed MethodPerformance
Data-DrivenKnowledge-BasedModeling-Based
Source DataExpertsInterpretationModeling Cost LowExpensive
HardEasy
Versatility HighPoor
Expert SystemFuzzy Logic
Supervised Learning
UnsupervisedLearning /
Data Mining
ProposalDomain Knowledge
+Data Analysis
Interpretation: exploit domain knowledge Cost: not so high, empirical knowledge only
Versatility: easy to apply to various domains & problems
Performance: better than heuristics
- Characteristics -

8
Conceptual Diagram
Experts
Acquire Reliable Labelswith Given Rule
Data Distribution
e.g.
Detection RuleLearning Boundary
Semi-supervised LDA Variable #
Contribution to EFVariable Identification
DBA
Feedback
* Assumption *
Incomplete heuristics surelyrepresent abnormal
phenomena

9
Outline
Introduction
Theories Semi-Supervised Linear Discriminant Analysis Decision Boundary Analysis
Experiments for Real Data
Conclusions

10
Semi-supervised LDA
Acquire Reliable Labelswith Given Rule
Data Distribution
Learning Boundary

11
Manifold Regularization [M. Belkin et al. 05]
Regularized Least Square
Squared loss for labeled data
Penalty Term(usually squared function norm)
Labeled data only

12
Manifold Regularization [M. Belkin et al. 05]
Regularized Least Square
Laplacian RLS:
Squared loss for labeled data
Penalty Term(usually squared function norm)
Squared loss Penalty Term Additional term for intrinsic geometry
Use labeled & unlabeled data
Assumption:Geometrically close⇒ similar label
Labeled data only
: graph Laplacian

13
Semi-Supervised Linear Discriminant Analysis (SS-LDA)
LDA seeks projection for small within-cov. & large between-cov.
Regularized Discriminant Analysis:[Friedman 89]
Semi-Supervised Discriminant Analysis (SS-LDA):
Regularizer
Between-class
Within-class

14
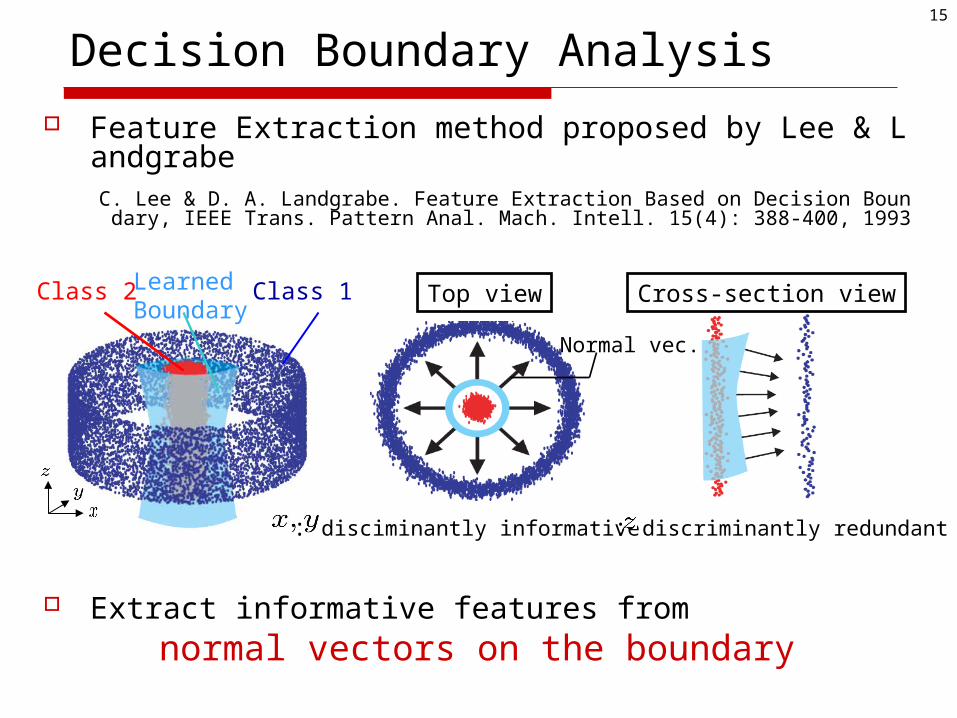
Decision Boundary Analysis
Acquire Reliable Labelswith Given Rule
Data Distribution
Learning Boundary
Semi-supervised LDA
15
Feature Extraction method proposed by Lee & LandgrabeC. Lee & D. A. Landgrabe. Feature Extraction Based on Decision Boundary, IEEE Trans.
Pattern Anal. Mach. Intell. 15(4): 388-400, 1993
Extract informative features from normal vectors on the boundary
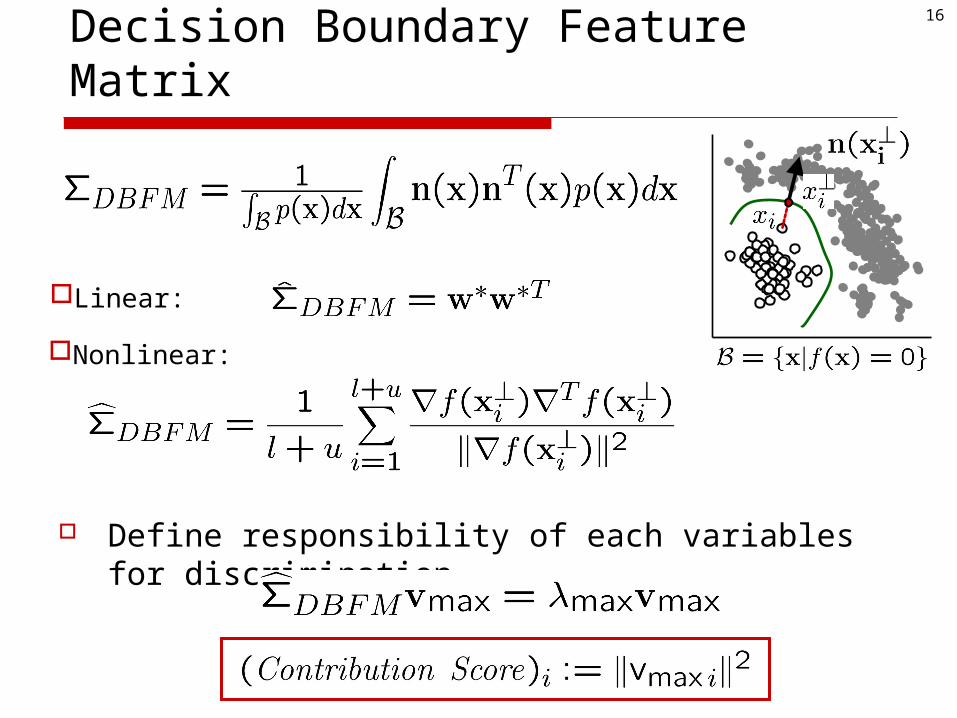
Decision Boundary Analysis
Top view Cross-section viewClass 1Class 2 Learned Boundary
: disciminantly informative : discriminantly redundant
Normal vec.
16
Decision Boundary Feature Matrix
Define responsibility of each variables for discrimination
Linear:
Nonlinear:
17
Outline
Introduction
Theories
Experiments Application to Energy Fault Analysis
Conclusions

18
Inverter
coil
cold
hot
humidity
Air Handling Unit
Energy Fault Diagnosis Problem
EF: Inverter overloaded
… but I don’t know the cause
Detection Rule6h M.A. of Inverter output = 100 EF

19
Inverter
coil
cold
hot
humidity
Air Handling Unit
Energy Fault Diagnosis Problem
EF: Inverter overloaded
Detection Rule6h M.A. of Inverter output = 100 EF
… but I don’t know the cause
Find out root cause of inverter overload
DATA
RULE
&

20
Energy Fault Diagnosis - Settings
Air-conditioning time-series sensor data for 1 unit
instances: 744
Labeled sample: 10 for each (3% of all)
(based on probability proportional to distance from boundary)
Hyper-parameters:
13 attributes, all continuous
1. Supply Air (SA) Temp. 8. Humidifier Valve Opening2. Room Tempe. 9. Return Air Temperature
3. Supply Air Temp. Setting 10. Pressure Diff. between In-Outside
4. Room Humidity 11. Moving Ave. of Pressure Difference5. Inverter Output 12. Outside Air Temperature6. Cooing Water Valve Opening 13. Outside Humidity7. Hot Water Valve Opening
NN = 5,
21
Experimental Results
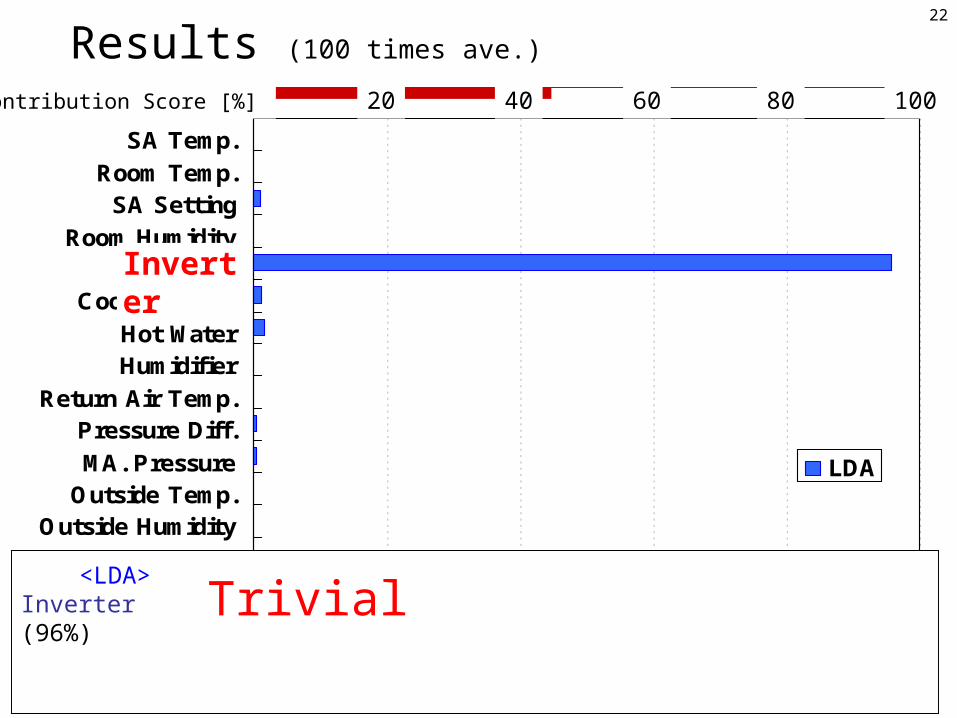
22
SA Temp.Room Temp.SA Setting
Room HumidityInverter
Cooling WaterHot WaterHumidifier
Return Air Temp.Pressure Diff.MA. Pressure
Outside Temp.Outside Humidity
LDA
Inverter
<LDA>Inverter (96%) Trivial
0 20 40 60 80 100Contribution Score [%]
Results (100 times ave.)

23
SA Temp.Room Temp.SA Setting
Room HumidityInverter
Cooling WaterHot WaterHumidifier
Return Air Temp.Pressure Diff.MA. Pressure
Outside Temp.Outside Humidity
LDASSLDA
Cooling water
SA Temp.
<SSLDA>Cool water (75%)SA temp. (12%)
<LDA>Inverter (96%)
0 20 40 60 80 100Contribution Score [%]
Results (100 times ave.)

24
SA Temp.Room Temp.SA Setting
Room HumidityInverter
Cooling WaterHot WaterHumidifier
Return Air Temp.Pressure Diff.MA. Pressure
Outside Temp.Outside Humidity
LDASSLDAKDA
Not Distinctive !
<SSLDA>Cool water (75%)SA temp. (12%)
<KDA>Cool water (19%)MA. Pressure (15%) Inverter (15%)
<LDA>Inverter (96%)
…
0 20 40 60 80 100Contribution Score [%]
Results (100 times ave.)
25
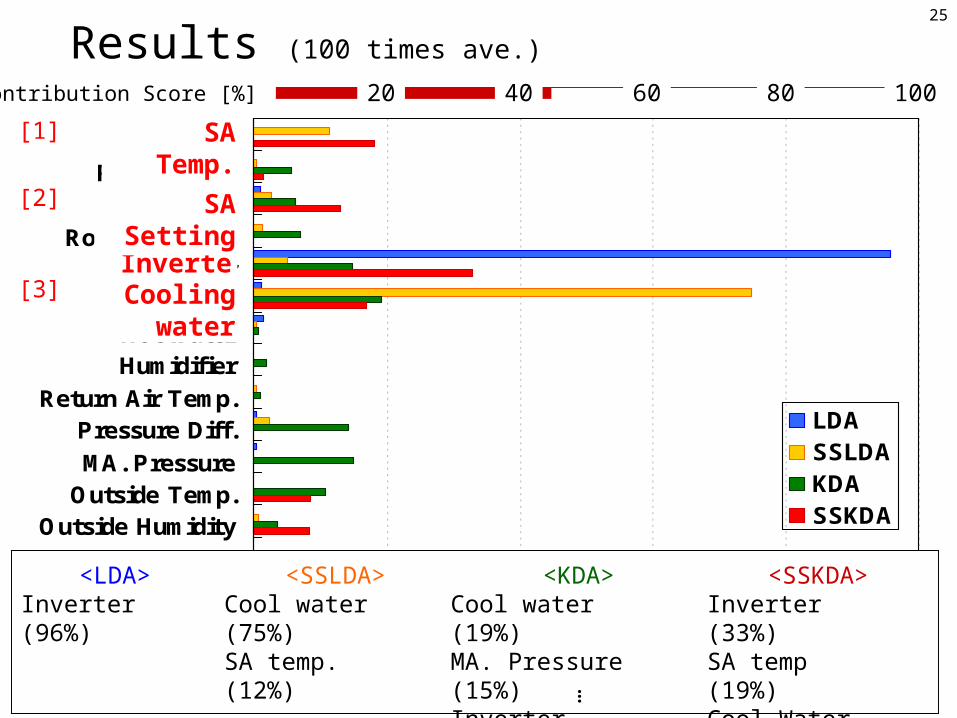
SA Temp.Room Temp.SA Setting
Room HumidityInverter
Cooling WaterHot WaterHumidifier
Return Air Temp.Pressure Diff.MA. Pressure
Outside Temp.Outside Humidity
LDASSLDAKDASSKDA
<SSLDA>Cool water (75%)SA temp. (12%)
<KDA>Cool water (19%)MA. Pressure (15%) Inverter (15%)
<LDA>Inverter (96%)
<SSKDA>Inverter (33%)SA temp (19%)Cool Water (17%)SA setting (13%)
…
InverterCooling
water
SA Temp.
SA Setting
[1]
[2]
[3]
0 20 40 60 80 100Contribution Score [%]
Results (100 times ave.)

26
Energy Fault Diagnosis: Examine Row Data
Cooling water valve Opening [3]
valve opens completely, but this is result of EF, not cause

27
Energy Fault Diagnosis: Examine Row Data
Cooling water valve Opening
valve opens completely, but this is result of EF, not cause
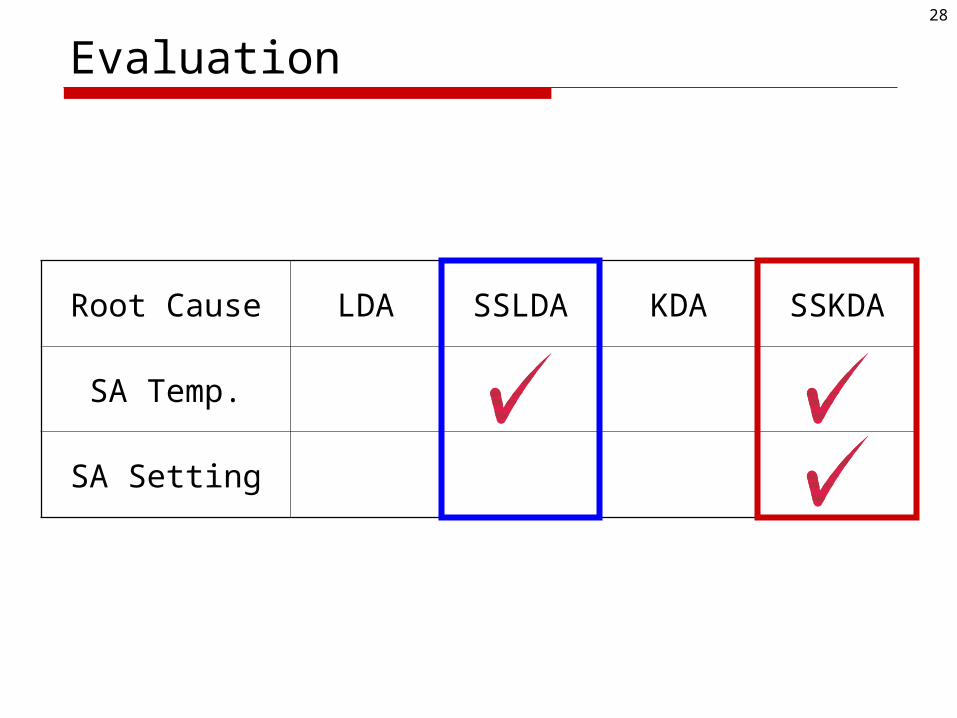
SSLDA/SSKDA show SA temp. [1] & setting [2] responsible
deviation of SA temp.
To reduce this deviation…• Operate inverter at peak power• Open cooling water valve
28
Evaluation
Root Cause LDA SSLDA KDA SSKDA
SA Temp.
SA Setting
29
Outline
Introduction
Theories
Experiments for Real Data
Conclusions
30
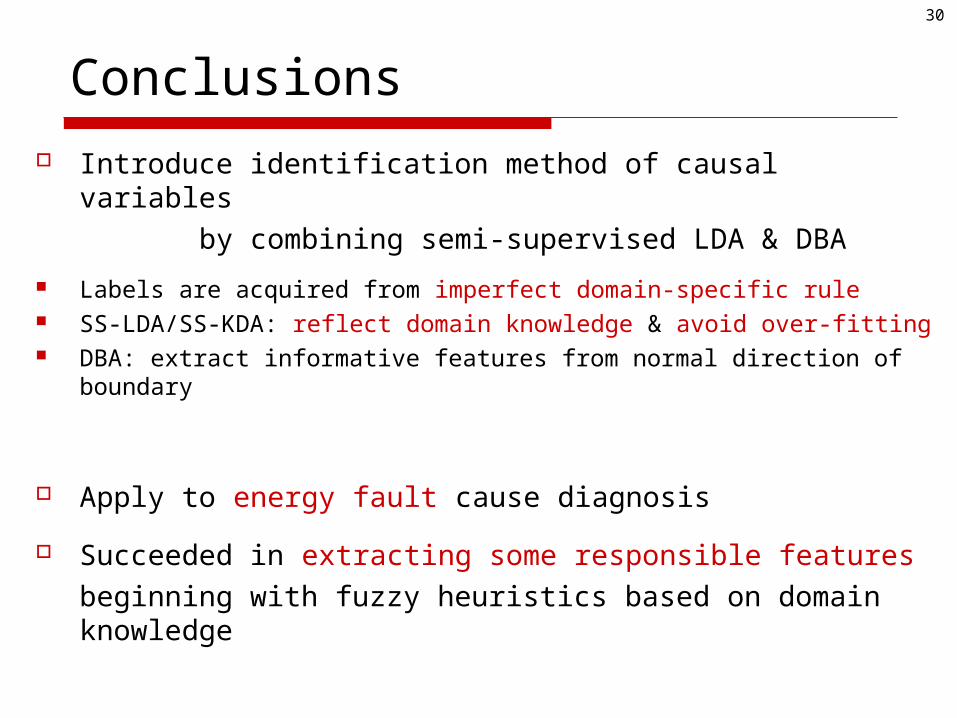
Conclusions
Introduce identification method of causal variables by combining semi-supervised LDA &
DBA
Labels are acquired from imperfect domain-specific rule SS-LDA/SS-KDA: reflect domain knowledge & avoid over-fitting DBA: extract informative features from normal direction of
boundary
Apply to energy fault cause diagnosis
Succeeded in extracting some responsible featuresbeginning with fuzzy heuristics based on domain knowledge

31
Room for improvements
Consider temporal continuity Time-series is not i.i.d.
Find True Cause from Correlating Variables

32
Thank you for your kind attention

33
Discussions

34
Minor improvements
Optimize Hyper-parameters AIC, BIC, … Cross Validation
Regularization Term L1-norm will give sparse solution
Comparison to other discrimination methods SVM Laplacian SVM… etc.
35
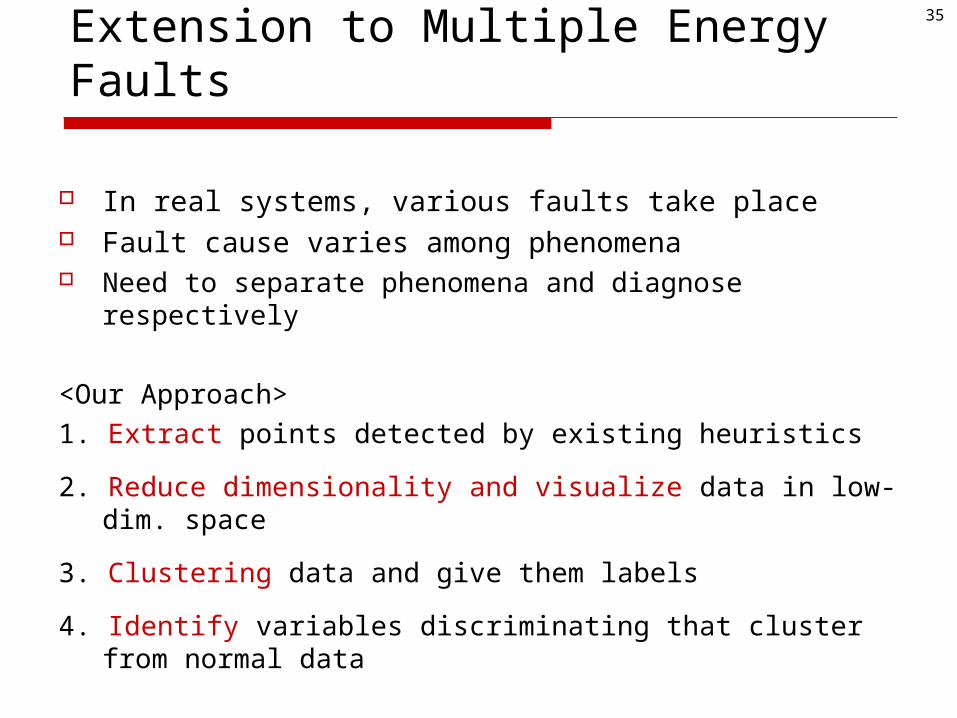
Extension to Multiple Energy Faults
In real systems, various faults take place Fault cause varies among phenomena Need to separate phenomena and diagnose respectively
<Our Approach>1. Extract points detected by existing heuristics
2. Reduce dimensionality and visualize data in low-dim. space
3. Clustering data and give them labels
4. Identify variables discriminating that cluster from normal data

36
Experimental Condition & Results
Air-conditioning sensor data, 13 attributes, same heuristics 748 instances, operating time only (hourly data for 2 months) 137 points are detected by heuristics Reduce dimensionality by isomap [J.B. Tenenbaum 00] (kNN = 5) Contribution score is given by SS-KDA (kNN = 5, )
<2D representation>
2 major cluster,4 anomalies

38
Experimental Condition & Results
Air-conditioning sensor data, 13 attributes, same heuristics 748 instances, operating time only (hourly data for 2 months) 137 points are detected by heuristics Reduce dimensionality by isomap [J.B. Tenenbaum 00] (kNN = 5) Contribution score is given by SS-KDA (kNN = 5, )
<2D representation>
2 major cluster,4 anomalies
Room air Temp.
superficial
Deviation of Room Air Temp. around detected points
Detected, this is EF
Contribution score for red points

39
Properly Controlled
System Deviation
Data Distribution

40
Data DistributionC
oolin
g W
ate
r V
alv
e [
%]
Linearly Separable for Cooling Water Valve [3]

41
Probabilistic Labeling
Points distant from boundary are reliable as class labels
Keep robustness against outliers
Points are stochastically given labels based on reliability
Rule
Unreliable
outlier
: Distance from boundary of point

42
Estimate DBFM
Linear Case: Nonlinear Case
Difficult to acquire points on boundary & calculate gradient vectorDisciminant function is linear in feature space
Kernelized SSLDA(SS-KDA)
Input space Feature space

43
DBFM for Nonlinear Distribution (1)
1. Generate points on boundary in feature space
2. Gradient vector at corresponding point
for Gaussian kernel
But to find pre-image is generally difficult…
By kernel trick, pre-image problem is avoidable
Input space
Feature space

44
DBFM for Nonlinear Distribution (2)
Finally we have gradient vectors on boundary for each point
3. Construct estimated DBFM
Define responsibility of each variables for discrimination Max. eigenvalue

45
質問されそうなこと
リアルタイム性は? 事後処理を想定
他の手法と比較したか?なぜ LDAか? SVMでも適用できるので試したい
なぜこういう結果になったのか 原因変数のデータを見ると線形判別は難しい