1 HIV epidemiological and Sexual Behavioural Trends in Tanzania Mainland: Implications for the HIV...
60
1 HIV epidemiological and Sexual Behavioural Trends in Tanzania Mainland: Implications for the HIV Response Joint Review 2008 Marelize Gorgens-Albino (GAMET) Dr R Kalinga (TACAIDS)
-
Upload
reynold-stewart -
Category
Documents
-
view
213 -
download
0
Transcript of 1 HIV epidemiological and Sexual Behavioural Trends in Tanzania Mainland: Implications for the HIV...

1
HIV epidemiological and Sexual Behavioural Trends in Tanzania Mainland:
Implications for the HIV Response Joint Review 2008
Marelize Gorgens-Albino (GAMET)
Dr R Kalinga (TACAIDS)

2
Methodology
• Secondary analysis of available epidemiological data• Areas investigated:
– National HIV prevalence trends– Heterogeneity in national prevalence trends– Incidence trends– Supplemented with data from community-level studies in TZ– Risk factors that have influenced trends
• At individual level (sexual behaviour)• At community level and society level
– Reviewed nine strategic objectives for HIV prevention in the 2nd NMSF – made observations and recommendations for the Joint Review

3
Data Sources
• Tanzania HIV and syphilis sentinel surveillance reports from the National AIDS Control Programme’s website
• (www.nacp.go.tz) • Other reports relating to HIV prevalence and incidence from the National AIDS Control
Programme’s website• (www.nacp.go.tz) • Purposive search of all known documents relating to HIV in Tanzania: UNGASS report,
latest Tanzania HIV and Malaria Indicator Survey Report, Global Fund Five-Year Evaluation Report
• Search for research articles from Google Scholar (http://scholar.google.com) and PubMed, using the search words “HIV incidence Tanzania”, and “HIV prevalence Tanzania”: resulted in 563 search results, of which 91 were relevant for the analysis
• Purposive search of documents from the TAZAMA project (www.tazamaproject), upon recommendation of Dr G Somi, Head of Epidemiology at MoHSW’s National AIDS Control Programme
• All national survey reports from Tanzania that were available on the MEASUREDHS website (www.measuredhs.com)
• Hard copies of reports provided by the UNAIDS country office

4
• Projected national prevalence has stabilised at a high level – just over 6 %
• Other prevalence data confirm this observation (see next slides)
0
1
2
3
4
5
6
7
8
9
1980
1983
1986
1989
1992
1995
1998
2001
2004
2007
2010
HIV
pre
vale
nce
rat
e (%
)
Projected HIV prev alence - National
National HIV prevalence trends
Source: Tanzania NACP, 2005: project HIV prevalence using EPP

5
National HIV prevalence trends
NACP, 2005: AIDS case reporting (around 7% of total new infections)

6
National HIV prevalence trends
7
8.2
6.4 6.4
7.1
9.99.6
7.78.7
6.6
7.9
5.7
0
2
4
6
8
10
12
HIV prev:ANC clients
HIV prev:blood donors
HIV prev:population-based
survey
Projected HIVprevalence
HIV
or s
yphi
lis p
reva
lenc
e (%
)
2001/02 (25 ANC sites, 152 000 blood donors) 2003/04 (57 ANC sites, 154 000 blood donors)2005/06 (92 ANC sites, 129 000 blood donors) 2007
Caution – see variance in # of ANC sites, and blood donors are 98% replacement family donors and 83% male donors

7
Despite the national stabilization, there is significant heterogeneity in HIV
prevalence

8
Women of are more likely to be HIV positive, with some exceptions
Female: male ratio in 2003: 1.2 : 1Female: male ratio in 2007 1.4 : 1
7.7
6.86.3
4.7
7
5.8
0
1
2
3
4
5
6
7
8
9
2003 2007
HIV
pre
vale
nce
(%
)
Women Men Total

9
Before 2003, women of young ages and men of older ages are more likely to be HIV positive, but this is changing
Sources: Graph 1.2 from NACP (2007)
Source: THIS, 2003-04
0
2
4
6
8
10
12
14
15-19 20-24 25-29 30-34 35-39 40-44 45-49
HIV
pre
vale
nce
(%)
0.0
0.2
0.4
0.6
0.8
1.0
1.2
1.4
1.6
Fem
ale:
Mal
e H
IV p
reva
lenc
e ra
tio
Women Men F:M ratio
2003
10
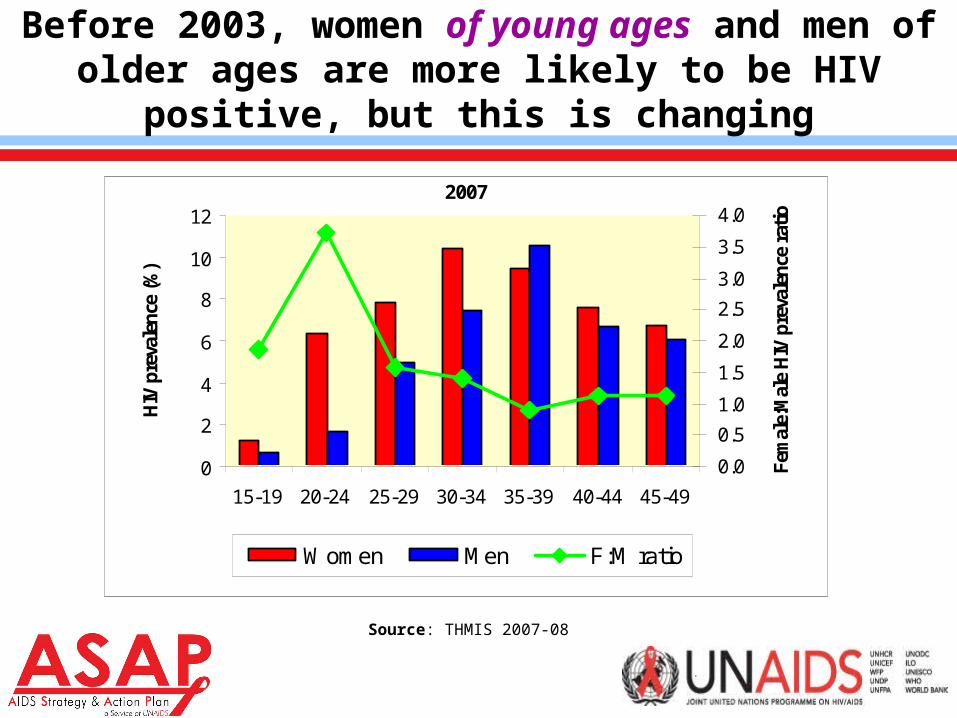
Before 2003, women of young ages and men of older ages are more likely to be HIV positive, but this is changing
Source: THMIS 2007-08
0
2
4
6
8
10
12
15-19 20-24 25-29 30-34 35-39 40-44 45-49
HIV
pre
vale
nce
(%)
0.0
0.5
1.0
1.5
2.0
2.5
3.0
3.5
4.0
Fem
ale:
Mal
e H
IV p
reva
lenc
e ra
tio
Women Men F:M ratio
2007

11
Amongst discordant couples, males are more likely to be HIV positive
0
5
10
15
20
25
30
35
40
45
50
Lesotho 2004 (Pop Prev 24%)
Kenya 2003 (Pop Prev 7%)
Malawi 04 (Pop Prev 12%)
Tanzania 03/04(Pop Prev 7%)
Uganda 05 (Pop Prev 6%)
Swaziland 07 (Pop Prev 26%)
Typ
es o
f di
scor
dan
t co
uple
s (%
)
0
5
10
15
20
25
30
35
40
45
50
Pop
ulat
ion
HIV
pre
vale
nce
(%)
Concordant (both positive) Male positive
Female positive Population-based prevalence
12
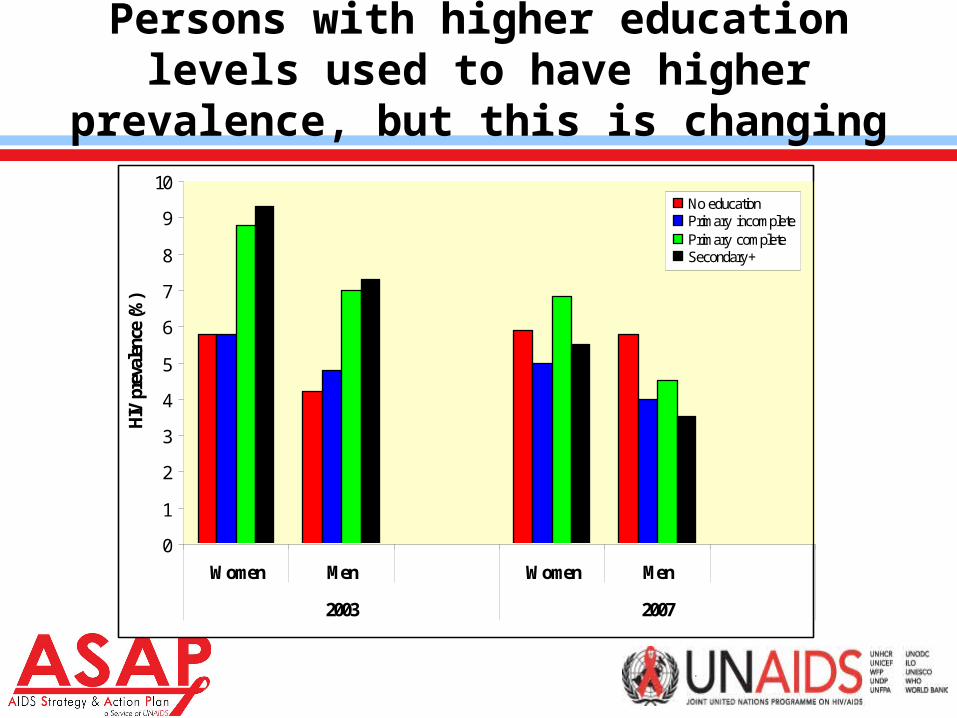
Persons with higher education levels used to have higher prevalence, but this is changing
0
1
2
3
4
5
6
7
8
9
10
Women Men Women Men
2003 2007
HIV
pre
vale
nce
(%)
No education Primary incomplete Primary complete Secondary +

13
More wealthy persons are more likely to be HIV positive
0
2
4
6
8
10
12
Women 2003 Men 2003 Total 2003
HIV
pre
vale
nce
(%)
Lowest wealth quintile Second wealth quintileMiddle wealth quintile Fourth wealth quintileHighest wealth quintile
Keep in mind: wealth and education levels strongly correlated

14
Married or formerly married men and women are most likely to have higher risk behaviour
Women, 2003
0%
20%
40%
60%
80%
100%
Never union (Ever
had sex)
Never in union
(Never had sex)
Currently married Formerly married
% women with this marital status Women - HIV prevalence

15
Men, 2003
0%
20%
40%
60%
80%
100%
Never union (Ever
had sex)
Never in union
(Never had sex)
Currently married Formerly married
Men with this marital status Men - HIV prevalence
Married or formerly married men and women are most likely to have higher risk behaviour

16
HIV prevalence is almost double in urban than in rural areas
% population who live in this location
% HIV+ (2003-04 THIS)
% HIV+ (2007-08 THMIS)
Urban 23% 10.9% 8.7%Rural 77% 5.3% 4.7%

17
HIV prevalence is almost double in urban than in rural areas
0
2
4
6
8
10
12
1419
80
1982
1984
1986
1988
1990
1992
1994
1996
1998
2000
2002
2004
2006
2008
2010
Prev
alen
ce ra
te (%
)(t
otal
pop
ulat
ion)
Projected HIV prevalence - NationalProjected HIV prevalence - UrbanProjected HIV prevalence - Rural

18
Demographics has resulted in more HIV+ persons in rural than in urban areas
0
200000
400000
600000
800000
1000000
1200000
1400000
1600000
1800000
200000019
80
1982
1984
1986
1988
1990
1992
1994
1996
1998
2000
2002
2004
2006
2008
2010
To
tal n
um
ber
of
per
son
s liv
ing
wit
h H
IV
Number HIV+ (national)
Number HIV+ (urban)
Number HIV+ (rural)

19
HIV prevalence in areas of mobility is higher than in rural areas, and prevalence in urban areas may be reducing
0.0%
5.0%
10.0%
15.0%
20.0%
25.0%
Border Roadside Rural Semi-urban Urban
HIV
pre
va
len
ce
2001 2003 2005NOTE ‘Roadside’ refers to those ANC sites that are in clinics that are close to major trading towns or transport routes in Tanzania.‘Border’ refers to the ANC site located in Kyela, on the border with Zambia
20
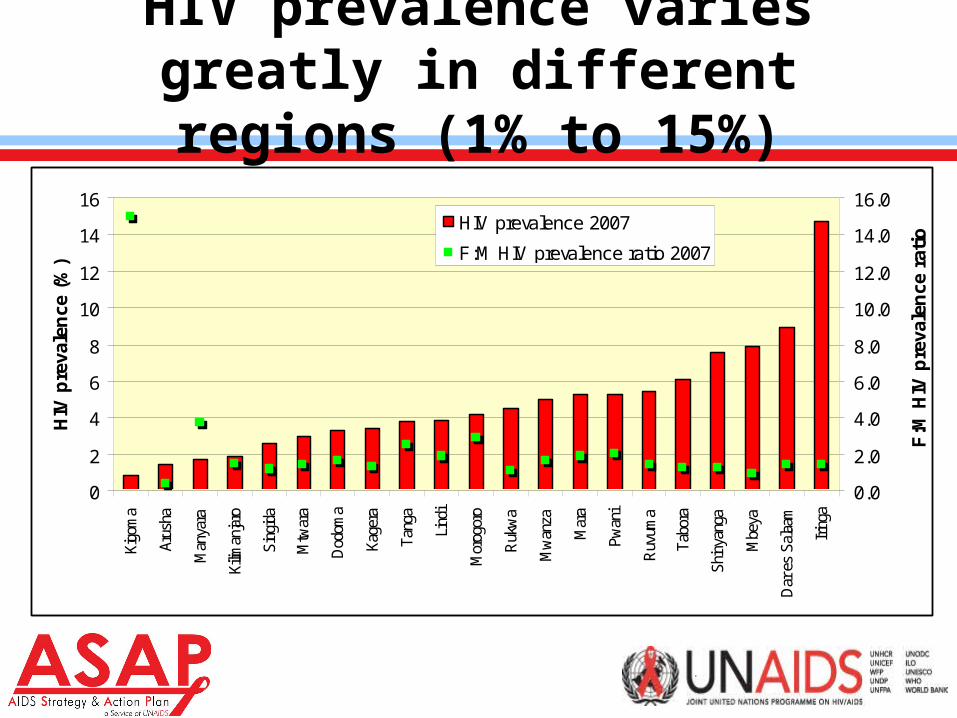
HIV prevalence varies greatly in different regions (1% to 15%)
0
2
4
6
8
10
12
14
16
Kigo
ma
Arus
ha
Man
yara
Kilim
anja
ro
Sing
ida
Mtw
ara
Dod
oma
Kage
ra
Tang
a
Lind
i
Mor
ogor
o
Ruk
wa
Mw
anza
Mar
a
Pwan
i
Ruv
uma
Tabo
ra
Shin
yang
a
Mbe
ya
Dar
es
Sala
am
Iring
a
HIV
pre
vale
nce
(%
)
0.0
2.0
4.0
6.0
8.0
10.0
12.0
14.0
16.0
F:M
HIV
pre
vale
nce
rat
io
HIV prevalence 2007
F:M HIV prevalence ratio 2007

21
Regional differences strongly associated with (a) percentage rural population; and (b) education (which are strongly correlated with
wealth, education levels and living in urban areas)
R2 = 0.18290.0
2.0
4.0
6.0
8.0
10.0
12.0
14.0
16.0
0 5 10 15
Region's HIV prevalence (%)
Rat
io o
f U
rban
: R
ura
l P
op
ula
tio
n i
n
the
Reg
ion
2003

22
However, the association between HIV prevalence and % rural population has weakened over time, implying that HIV infection
patterns in rural areas could be changing faster than in urban areas
p = 0.0001 in 2003p = 0.07 in 2007
R2 = 0.0044
0.0
2.0
4.0
6.0
8.0
10.0
12.0
14.0
16.0
0 5 10 15 20
Region's HIV prevalence in 2007 (%)
Ru
ral
to U
rban
Po
pu
lati
on
Rat
io i
n
Reg
ion
2007

23
This hypothesis confirmed by the fact that regions with larger proportions of urban populations are more likely to have had
bigger positive changes in HIV prevalence
R2 = 0.33
0.0
2.0
4.0
6.0
8.0
10.0
12.0
14.0
16.0
-4 -2 0 2 4 6
Change in regions' HIV prevalence (%) from 2003 to 2007
Ru
ral
to u
rba
n p
op
ula
tio
n r
ati
o

24
HIV prevalence and male circumcision status
• 70% of Tanzanians are circumcised• Five regions with low circumcision rates (<50%)
– Iringa (43%)– Kagera (27%)– Rukwa (31%)– Shinyanga (38%)– Tabora (26%)
• Circumcision cuts across religious lines (72% of Muslims and 68% of Protestants circumcised (THIS 2003-04))

25
HIV prevalence and male circumcision status
• Men usually get circumcised in their early 20s (Nnko et al. 2001)
• More educated men are more likely to get circumcised (THIS 2003-04)
• Highly acceptable amongst Tanzanian men for personal hygiene purposes– “Male circumcision is becoming more popular among a traditionally
non-circumcising ethnic group in Tanzania, especially in urban areas and among boys who have attended secondary schools” (Nnko et al., 2001)
• Circumcision status and HIV prevalence significantly associated at individual level or at regional level

26
Relationship between circumcision status and HIV prevalence in regions is and remains strong (strongest
predictor of HIV prevalence levels in regions)
R2 = 0.2171
0
10
20
30
40
50
60
70
80
90
100
0 2 4 6 8 10 12 14 16
HIV prevalence (%)
Me
n c
irc
um
cis
ed
(%
) p = 0.0002 in 2003p = 0.009 in 2007
27
HIV prevalence and migration
• Population-level data about HIV prevalence and migration not known (collected in DHS but not analysed)
• 3 community-level studies shows that:– HIV prevalence and incidence higher amongst short-term migrant
men and women who stay home (and alone, away from husbands) for long periods of time
– “Remarkably, risk behavior of men increased more when their wives moved than when they were mobile themselves” (Kishamawa et al, 2004)

28
Projected HIV incidence rate – change over time (national and urban stabilising, rural increasing)
0.0%
0.5%
1.0%
1.5%
2.0%
2.5%
3.0%
3.5%
4.0%19
80
1982
1984
1986
1988
1990
1992
1994
1996
1998
2000
2002
2004
2006
2008
2010
Inci
den
ce r
ate
(%)
(to
tal p
op
ula
tio
n)
Incidence rate - National
Incidence rate - Urban
Incidence rate - Rural

29
Projected number of new infections every year – changes over time (increase at national level, slow increase in urban areas,
rapid increase in rural areas)
0
50000
100000
150000
200000
250000
300000
1980
1982
1984
1986
1988
1990
1992
1994
1996
1998
2000
2002
2004
2006
2008
2010
New
HIV
infe
ctio
ns
Total new HIV infections - National
Total new HIV infections - Urban
Total new HIV infections - Rural

30
HIV incidence – trends in younger ANC clients
HIV prevalence rate amongst different age groups of ANC clients , Tanzania, 2001 to 2006(change in 15 – 24 year old falls within confidence interval and not statistically significant)
Source: NACP, 2007

31
Have risk factors for HIV transmission changed over time?

32
Age of sexual debut has increased
15
24
6966
11 13
61
55
11 11
58
46
0
10
20
30
40
50
60
70
80
Women 15 to 19 who hadsex before age 15
Men 15 to 19 who hadsex before age 15
Women 18 to 19 who hadsex before age 18
Men 18 to 19 who hadsex before age 18
Perc
enta
ge o
f res
pond
ents
TRCHS 1999
TDHS 2004-05
THMIS 2007-08

33
More men are having multiple partners, and rates of multiple partners amongst women have remained constant
FEMALE MALE
1992 1996 1999 2004 1992 1996 1999 2004
Total 4 6 12 4 9 27 35 30
Age groups: 15-19 6 9 15 5 15 37 36 26
Age groups: 20-24 4 7 15 5 13 41 42 37
Age groups: 15-24 5 7 15 5 14 39 39 33
Age groups: 25-49 - 6 10 4 - 26 34 29
Age groups: 15-49 - 6 12 4 - 30 36 30
Residence: Urban 4 8 16 5 7 30 31 23
Residence: Rural 4 6 10 4 10 26 36 33
Education: No Education 4 5 11 4 9 19 34 30
Education: Primary 4 7 12 5 10 28 36 31
Education: Secondary and Higher 2 4 11 2 3 32 25 25

34
More men are having casual partners, and rates of casual partners amongst women have remained constant
FEMALE MALE
1996 1999 2004 1996 1999 2004
Total 18 27 19 38 51 46
Age groups: 15-19 43 53 42 78 97 98
Age groups: 20-24 21 32 22 68 79 74
Age groups: 15-24 29 40 29 72 87 83
Age groups: 25-49 13 20 14 30 39 30
Age groups: 15-49 18 27 19 42 55 46

35
Rates of condom use during casual sex has rapidly increased – almost doubled over time
FEMALE MALE
1996 1999 2004 1996 1999 2004
Total 16 22 33 32 34 51
Age groups: 15-19 17 19 40 23 26 39
Age groups: 20-24 20 24 37 37 36 51
Age groups: 15-24 18 21 39 31 31 46
Age groups: 25-49 13 24 27 33 40 56
Age groups: 15-49 16 22 33 32 35 51
Urban 27 32 48 41 52 67
Rural 10 15 22 28 27 44
No Education 4 10 18 7 14 33
Primary 17 24 33 32 34 49
Secondary and Higher 35 44 56 47 65 78
36
Transactional sex
• Ethnographic study found that:– “The sex worker’s first motivation is economic.– The numbers of commercial partners are
decreasing.– Condom use has been accepted in short-term
relationships.– Condom use is rarely accepted in long term
relationships” (NACP, 2001, citing Outwater et al., 2000).

37
High percentage of men and women who accepted gifts or favours in return for sex (1994)
% of individuals that accepted gifts or favours the last time they had sex
with someone other than their regular spouse in Tanzania (1994)
% men age 15-49 reporting payment for sexual
intercourse in the past 12 months (2007)
Age group Women Men Men
15 – 19 20 16 5
20 – 24 14 16 13
25 – 29 18 15 11
30 – 39 7 21 9
40 - 49 4 11 6

38
Risk of HIV transmission through IDU needle sharing is increasing
• IDUs are present in Dar• Injecting paraphenalia found with HIV antibodies in
30% of used needles in Dar• Population-level importance not known: size of IDU
population not known

39
SUMMARY – Epi Trends
• National adult HIV prevalence peaked in 1995• HIV prevalence is expected to increase in the future with
scaled-up ARV treatment• At the onset, the epidemic was growing fastest in areas with:
– larger or border towns, – high population mobility (temporary migration due to labour factors), – more employment and wealth, – with more educated persons.
• Over time, the relationship between education and HIV risk changed with less educated persons becoming more likely to be HIV positive than more educated individuals

40
SUMMARY – Epi Trends
• Tanzania has a mature epidemic with annual HIV incidence stabilizing just below 1%
• 1.8 million persons with HIV – mostly in rural areas• Absolute number of new infections has grown steeply
over time, particularly in rural areas, due to population demographics
• Overall, females are at significantly higher risk of being HIV infected than males (2007 national survey: females 15-49 40% more likely to be HIV+)
• Bigger changes in prevalence amongst men, those educated, and those in urban areas
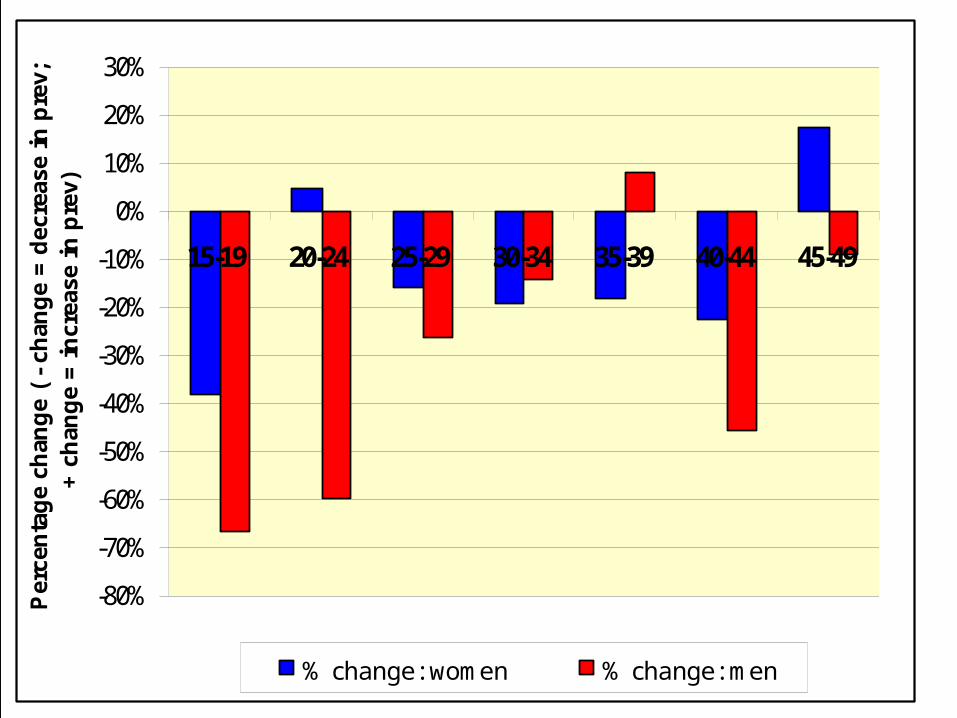
41
-80%
-70%
-60%
-50%
-40%
-30%
-20%
-10%
0%
10%
20%
30%
15-19 20-24 25-29 30-34 35-39 40-44 45-49
Per
cen
tag
e ch
ang
e (
- ch
ang
e =
dec
reas
e in
pre
v;
+ c
han
ge
= i
ncr
ease
in
pre
v)
% change: women % change: men

42
SUMMARY – Behavioural Trends

43
ABCs of Safe Sex in Tanzania1996
1996
1996
1996
1996
1996
1996
1996
1999
1999
1999
1999
1999
1999
1999
1999
2004
2004
2004
2004
2004
2004
2004
2004
2007
2007
2007
2007
2007
2007
2007
2007
0
10
20
30
40
50
60
70
80
90
100
Young men Young women Males Females Males Females Males Females
Per
cen
tag
e (%
) in
th
is c
ateg
ory
"A"(abstinence)
% of never-married young men and women who have never had sex
"B"(be faithful)
% of sexually-active persons who have had multiple parters
"B"(be faithful)
% of sexually-active persons who have had sex with non regular non co-habitating
partners
"C"(be faithful)
% of sexually-active persons who used a condom during last
higher risk sex

44
Compare this with …..

45
32.6%
6.2%
30.5%
4.5%
51.6%
33.6%
21%
49%
10%
42%
6%
50%
0%
10%
20%
30%
40%
50%
60%
70%
80%
Young men Young Women Males Females Males Females
pe
rce
nt
1998 2005
B-youthMultiple partners in the past
year, ages 15-24
B-adultsMultiple partners in the past
year, ages 15-49
CCondom use last higher-risk
sex, ages 15-49
Sources: Cote d’Ivoire 1998/99 DHS, Cote d’Ivoire 2005 AIS
No significant change in A behaviors among youth
ABCs of Safe Sex in Cote d’Ivoire (1998 to 2005)

46
7%
2%4%
0%
51%
23%
14%16%
2%
11%
2%
31%
0%
10%
20%
30%
40%
50%
60%
70%
80%
Young men Young Women Males Females Males Females
pe
rce
nt
2000 2005
ANever married ages 15-24 who
had sex in the past year
BMultiple partners in the past
year, ages 15-49
CCondom use last higher-risk
sex, ages 15-49
Sources: Ethiopia 2000 & 2005 DHS, UNAIDS Epidemic Report 2007
ABCs of Safe Sex in Ethiopia 2000 to 2005

47
There is, however, also great variation in behaviours
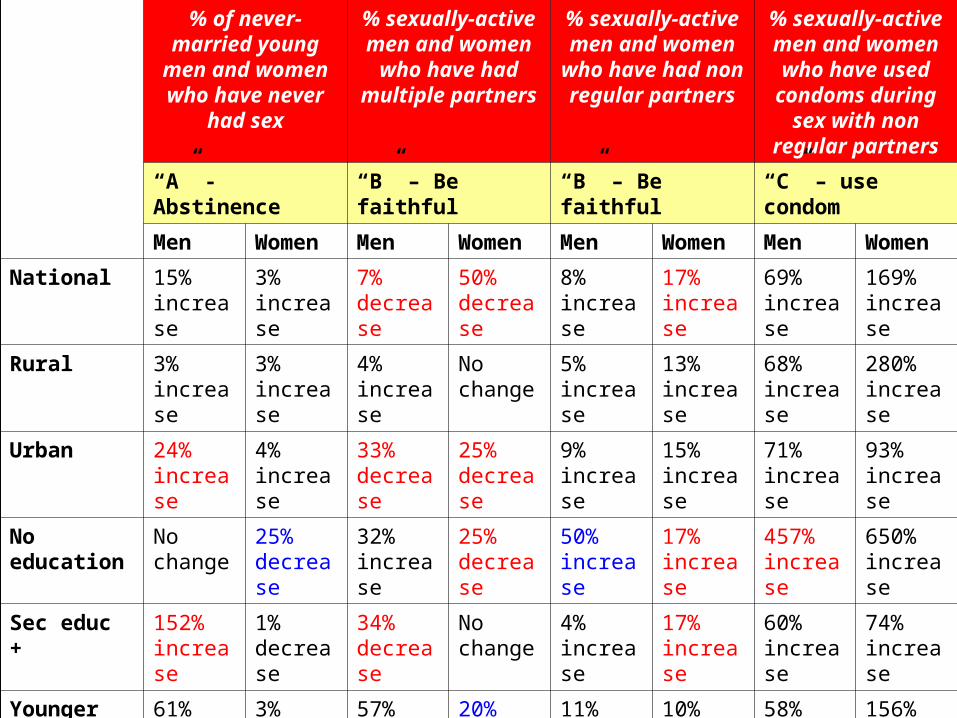
48
% of never-married young men and
women who have never had sex
% sexually-active men and women who
have had multiple partners
% sexually-active men and women who have had non regular
partners
% sexually-active men and women who have used condoms during sex with non
regular partners
“A” - Abstinence “B” – Be faithful “B” – Be faithful “C” – use condom
Men Women Men Women Men Women Men Women
National 15% increase
3% increase
7% decrease
50% decrease
8% increase
17% increase
69% increase
169% increase
Rural 3% increase
3% increase
4% increase
No change
5% increase
13% increase
68% increase
280% increase
Urban 24% increase
4% increase
33% decrease
25% decrease
9% increase
15% increase
71% increase
93% increase
No education No change
25% decrease
32% increase
25% decrease
50% increase
17% increase
457% increase
650% increase
Sec educ + 152% increase
1% decrease
34% decrease
No change
4% increase
17% increase
60% increase
74% increase
Younger 61% increase
3% increase
57% increase
20% decrease
11% increase
10% increase
58% increase
156% increase
Older 160% increase
9% decrease
No change
50% decrease
7% decrease
15% increase
88% increase
208% increase

49
In conclusion: How has sexual behaviour changed?
• Older men (20 to 24) and men with higher education were most likely to postpone sexual debut
• Older women (20 to 24) and women with no education were most likely to initiate sex earlier
• Older men (25 to 49) and men in urban areas were most likely to reduce their number of sexual partners
• Older women (25 to 49), educated women and women in urban areas were most likely to increase their sexual partners
• Older men (25 to 49) were most likely to stop having non regular partners
• More men with no education were likely to have non regular partners
• Women were most likely to increase their numbers of sexual partners
• Condom use across genders, age groups, residence and education levels has dramatically increased

50
Recommendations for the Joint Review

51
SO1: Promote abstinence, delayed sexual debut, partner reduction and consistent condom use among young
people in and out of school
• Need to expand focus from the focus on young people and urban areas
• BCC and SCC efforts need to reach rural areas, and older adults too (especially older females)

52
SO2: Reduce risk of HIV infection among the most vulnerable populations
• MARPs are in existence, but little is known about them• Size estimation studies are needed, behavioural
interactions with other MARPs and gen pop, and HIV prevalence testing
• Specific programmes for other populations with disproportionately high HIV burdens such as fishing populations, females affected by sexual and domestic violence, and the military, and short-term migrant populations

53
SO3: Expand workplace interventions, with special attention to mobile and migrant workers
• Mobile work force goes beyond truck drivers• Short term migrant workers, e.g. all of us here at
workshop today, is vulnerable• Target and focus HIV prevention programmes• Need to analyse HIV testing in DHS by ‘time spent
away from home’
54
SO4: Prevent, treat and control other sexually transmitted infections (STI)
• Plausible biological evidence that STIs increase HIV transmission
• However, despite their common behavioral pathways, STIs and HIV are not necessarily highly correlated at the population level (Gray and Wawer, 2008).
• Hypothesis that reducing STI infection reduces HIV transmission has been extensively tested and at least 8-9 trials have found no effect. There is thus insufficient evidence to support STI treatment for HIV prevention.
55
SO4: Prevent, treat and control other sexually transmitted infections (STI)
• However, offering STI treatment to vulnerable groups, including sex workers and men-having-sex-with-men, who may have a high STI burden, may help to build rapport and trust and solidarity and as such may be a component of a comprehensive intervention.
• STIs are an important health problem in their own right - greater than HIV in many countries - and as such STI control for the general population should be a priority, but in keeping with the recommendations of the Commission on AIDS in Asia, financed by non-HIV health resources.
56
SO5: Promote and expand HIV testing and counseling services
• VCT is cornerstone of many prevention programmes• Provides entry point for care and support• Effectiveness of programme for HIV prevention is mixed –
meta review shows it resulted in increased condom use, but no decreases in multiple or concurrent partners
• Focus in rural areas – this is where most HIV positive persons are

57
SO6: PMTCT
• Need to focus on preventing HIV transmission during pregnancy – increased risk for transmission (Shisana et al., 2005)
• No epi-based recommendations, except to scale up the service and ensure 100% compliance

58
SO7: Promote and distribute condoms
• Demand is clearly there. In 2007, condoms distributed :– 150 million male condoms (less than 10
condoms/man aged 15 to 49 /year)– 709 000 female condoms
• Need to scale up supply• Make available in rural areas
59
SO8: Prevent HIV transmission through blood transfusions, exposure to contaminated body fluids and contaminated
instruments
• Strengthen the volunteer blood donor programme• Male school-level donors with secondary education
is a good option: low prevalence and signs of reducing higher risk behaviour
60
SO9: Introduce new prevention interventions
• Male circumcision – implement as soon as programmatic ‘how-to’ evaluation has been completed and operational guidelines have been prepared
• HSV-2 treatment – not effective in reducing viral shedding (Cowan et al., 2008)