1 Emission and Air Quality Trends Review Utah May 2013.
25
1 Emission and Air Quality Trends Review Utah May 2013
Transcript of 1 Emission and Air Quality Trends Review Utah May 2013.

1
Emission and Air Quality Trends
Review
Utah
May 2013

2
Project Objective To develop and present publicly available
information on trends in emissions and ambient air quality in the U.S. since 1999 in easy to understand visual and tabular formats

3
Emission Trends Study Team collected and processed U.S. EPA
emission inventories for years within the study period of interest (1999-2011)
By pollutant and source category electric generation fuel combustion mobile sources industrial fuel combustion & industrial processes all other

4
Emissions Data Summary Data Obtained from EPA National Emission Inventory (NEI)
and Trends Websites
EPA’s Trends reports and emission comparisons include interpolations of all categories between key years (1999, 2002, 2005, 2008, 2011) at county-pollutant level
Represented Pollutants: VOC, NOx, SO2, and PM2.5
Project Improvement
The Study Team augmented above data with year specific CEM emissions (2002 through 2011)

5
Emission Changes The following slides also include the
tonnage-based emissions change from 1999 to 2011 for each pollutant
Negative values indicate decrease in emissions, positive values indicate an increase

6
Utah Emission Trends (VOC)
Annual Emissions (Tons)Source Category 1999 2001 2003 2005 2006 2007 2008 2009 2010 2011Electric Utility Coal Fuel Combustion 454 447 347 479 484 474 490 445 432 232Mobile Sources 72,653 70,859 78,594 63,325 60,778 58,232 57,242 55,625 54,007 52,543Industrial Fuel Combustion & Processes 73,496 65,092 68,128 95,331 95,047 94,763 94,478 94,194 93,910 159,276All Others 79 102 31 30 44 63 66 58 53 10,231
Total 146,683 136,500 147,099 159,165 156,353 153,532 152,276 150,322 148,402 222,281
Annual Emissions Change (Percent since 1999)Source Category 1999 2001 2003 2005 2006 2007 2008 2009 2010 2011Electric Utility Coal Fuel Combustion 0% -1% -24% 6% 7% 4% 8% -2% -5% -49%Mobile Sources 0% -2% 8% -13% -16% -20% -21% -23% -26% -28%Industrial Fuel Combustion & Processes 0% -11% -7% 30% 29% 29% 29% 28% 28% 117%All Others 0% 29% -62% -62% -44% -21% -17% -27% -33% 12797%
Total 0% -7% 0% 9% 7% 5% 4% 2% 1% 52%

7
Utah Emission Trends (VOC)

8
Utah Emission Trends (NOx)
Annual Emissions (Tons)Source Category 1999 2001 2003 2005 2006 2007 2008 2009 2010 2011Electric Utility Coal Fuel Combustion 72,815 71,514 69,121 64,668 70,253 69,193 68,446 61,803 61,242 49,207Mobile Sources 108,286 104,748 102,229 112,047 106,479 100,912 99,889 97,792 95,695 94,975Industrial Fuel Combustion & Processes 44,360 44,830 24,915 30,980 30,898 30,816 30,734 30,652 30,570 36,141All Others 1,139 1,593 1,021 1,290 1,587 1,499 1,439 1,353 1,140 1,226
Total 226,600 222,685 197,285 208,985 209,218 202,420 200,509 191,601 188,648 181,549
Annual Emissions Change (Percent since 1999)Source Category 1999 2001 2003 2005 2006 2007 2008 2009 2010 2011Electric Utility Coal Fuel Combustion 0% -2% -5% -11% -4% -5% -6% -15% -16% -32%Mobile Sources 0% -3% -6% 3% -2% -7% -8% -10% -12% -12%Industrial Fuel Combustion & Processes 0% 1% -44% -30% -30% -31% -31% -31% -31% -19%All Others 0% 40% -10% 13% 39% 32% 26% 19% 0% 8%
Total 0% -2% -13% -8% -8% -11% -12% -15% -17% -20%

9
Utah Emission Trends (NOx)

10
Utah Emission Trends (SO2)
Annual Emissions (Tons)Source Category 1999 2001 2003 2005 2006 2007 2008 2009 2010 2011Electric Utility Coal Fuel Combustion 31,277 29,524 34,680 34,804 37,413 24,213 21,705 20,862 21,851 20,407Mobile Sources 6,811 6,810 4,378 4,519 3,948 3,377 1,942 1,599 1,257 1,042Industrial Fuel Combustion & Processes 20,420 21,749 13,366 12,620 12,336 12,052 11,768 11,484 11,200 6,144All Others 36 38 23 19 23 28 29 26 25 35
Total 58,544 58,121 52,448 51,961 53,719 39,670 35,444 33,971 34,333 27,628
Annual Emissions Change (Percent since 1999)Source Category 1999 2001 2003 2005 2006 2007 2008 2009 2010 2011Electric Utility Coal Fuel Combustion 0% -6% 11% 11% 20% -23% -31% -33% -30% -35%Mobile Sources 0% 0% -36% -34% -42% -50% -71% -77% -82% -85%Industrial Fuel Combustion & Processes 0% 7% -35% -38% -40% -41% -42% -44% -45% -70%All Others 0% 5% -36% -49% -38% -24% -20% -29% -33% -3%
Total 0% -1% -10% -11% -8% -32% -39% -42% -41% -53%

11
Utah Emission Trends (SO2)
12
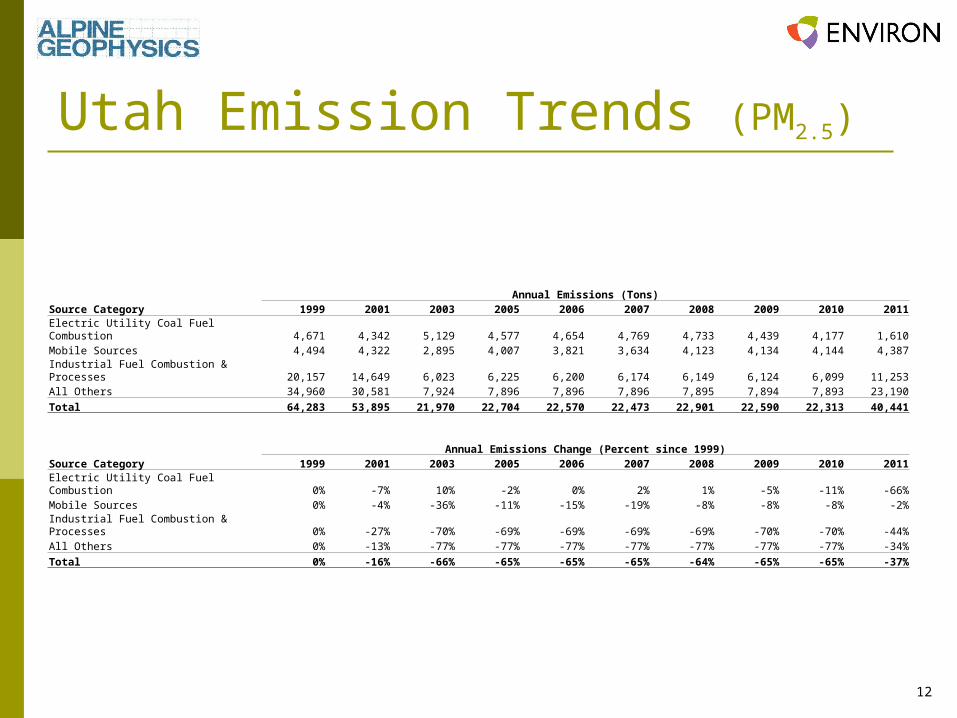
Utah Emission Trends (PM2.5)
Annual Emissions (Tons)Source Category 1999 2001 2003 2005 2006 2007 2008 2009 2010 2011Electric Utility Coal Fuel Combustion 4,671 4,342 5,129 4,577 4,654 4,769 4,733 4,439 4,177 1,610Mobile Sources 4,494 4,322 2,895 4,007 3,821 3,634 4,123 4,134 4,144 4,387Industrial Fuel Combustion & Processes 20,157 14,649 6,023 6,225 6,200 6,174 6,149 6,124 6,099 11,253All Others 34,960 30,581 7,924 7,896 7,896 7,896 7,895 7,894 7,893 23,190
Total 64,283 53,895 21,970 22,704 22,570 22,473 22,901 22,590 22,313 40,441
Annual Emissions Change (Percent since 1999)Source Category 1999 2001 2003 2005 2006 2007 2008 2009 2010 2011Electric Utility Coal Fuel Combustion 0% -7% 10% -2% 0% 2% 1% -5% -11% -66%Mobile Sources 0% -4% -36% -11% -15% -19% -8% -8% -8% -2%Industrial Fuel Combustion & Processes 0% -27% -70% -69% -69% -69% -69% -70% -70% -44%All Others 0% -13% -77% -77% -77% -77% -77% -77% -77% -34%
Total 0% -16% -66% -65% -65% -65% -64% -65% -65% -37%

13
Utah Emission Trends (PM2.5)

14
Emission Trends Summary All pollutants with the exception of VOC have decreased
since 1999 in aggregate across Utah VOC increases largely due to Industrial Processes
Onroad emission step increase seen between 2004 and 2005 is the result of EPA’s method change and MOVES model integration for estimating onroad mobile source emissions

15
Air Quality Design Values Ozone
Annual 4th highest daily maximum 8-hour average averaged over three consecutive years
Current standard = 0.075 ppm
PM2.5 Annual Annual arithmetic mean of quarterly means averaged
over three consecutive years Current standard = 12 ug/m3
PM2.5 24-Hour Annual 98th percentile of daily averages averaged over
three consecutive years Current standard = 35 ug/m3

16
State-Wide Design Value (DV) Trends Trends in state-wide maximum DV and
average DV Max DV: Maximum DVs over all valid trend
monitoring sites in the state in each overlapping three year period
Average DV: Average of DVs over all valid trend monitoring sites in the state in each overlapping three year period
Compute linear trend via least-squares regression

17
Data Handling Procedures O3 design value (DV) for each overlapping three-
year period starting with 1999-2001 and ending with 2009-2011 DV calculated using annual 4th highest daily max 8-hr
averages and percent of valid observations, based on EPA data handling conventions
Data associated with exceptional events that have received EPA concurrence are omitted
Selection of trend sites require valid DV in 9 out of 11 three-year periods between 1999 and 2011
Identification of nonattainment areas is with respect to the 2008 8-hour standard only

18
Data Handling Procedures Annual PM2.5 DV and 24-hr PM2.5 DV for each
overlapping three-year period starting with 1999-2001 and ending with 2009-2011 DV calculations based on EPA data handling conventions Data extracted from monitors that have a non-
regulatory monitoring type are omitted Selection of trend sites require valid DV in 9 out of 11
three-year periods between 1999 and 2011

19
Trend Calculation Trends based on linear least
squares fit to rolling three year design values (DVs)
Negative trend indicates improving air quality
DVs based on each 3-year period: 1999-2001, 2000-2002, … 2009-2011
Notes On plots, DVs are for three
year period ending in year shown (i.e., 2009-2011 DV plotted as 2011 value)
Ozone trend values expressed as ppb/year (1,000 ppb = 1 ppm); DVs are plotted as ppm
New York-N. New Jersey-Long Island,NY-NJ-CT Max O3 Design Values
0.04
0.05
0.06
0.07
0.08
0.09
0.1
0.11
2000 2002 2004 2006 2008 2010
Ozo
ne C
once
ntra
tion
[ppm
] Least squares trend: Slope = -2.3 ppb/yr
Scale in units of ppm
Trend in units of ppb/year

20
Max/Ave O3 DVs and Trend

21
Ozone Trends by Site in Utah
Note: Only monitoring sites meeting data completeness criteria listed
Monitoring Sites County2009-2011 DV
[ppm] Trend [ppm/yr]
4900500044420101 Cache, UT 0.061 -0.81
4903500034420101 Salt Lake, UT 0.073 -0.62
4903520044420101 Salt Lake, UT 0.072 -1.03
4903530064420101 Salt Lake, UT N/A -0.45
4903701014420101 San Juan, UT 0.068 -0.30
4904900024420102 Utah, UT 0.067 -0.55
4904950084420101 Utah, UT N/A -1.07
4904950104420101 Utah, UT 0.068 -0.94
4905710034420101 Weber, UT 0.071 -1.18

22
Max/Ave PM2.5 Annual DVs and Trend

23
Max/Ave PM2.5 24-Hour DVs and Trend

24
PM2.5 Trends by Site in Utah
Note: Only monitoring sites meeting data completeness criteria listed
2009-2011 DV [ug/m3]
Trend [ug/m3 per year]
Monitoring Site County Annual 24-Hr Annual DV 24-Hr DV
490030003 Box Elder 8.2 40 -0.11 -0.30
490050004 Cache 9.7 42 -0.47 -2.56
490350003 Salt Lake N/A 50 -0.21 -1.15
490353006 Salt Lake 9.7 45 -0.18 -1.15
490490002 Utah 8.7 35 -0.17 -0.26
490494001 Utah 9.1 41 -0.09 -0.14
490495008 Utah N/A 38 N/A -0.13
490495010 Utah 8.5 42 0.03 0.84
490570002 Weber N/A 41 N/A -1.38
490571003 Weber 8.3 37 -0.22 -0.77

25
Air Quality Trends Summary Average O3 and PM2.5 design values have
decreased since 1999 in Utah.
There are no currently designated O3 non-attainment areas in Utah; 24-hr PM2.5 design values have decreased since 1999 at Logan, UT and Salt Lake City, UT non-attainment areas but have remained steady at Provo, UT non-attainment area