
1 EFFECT OF HIGH PRESSURE PROCESSING ON WHEAT DOUGH …digital.csic.es/bitstream/10261/17292/1/LWT...
29
1 EFFECT OF HIGH PRESSURE PROCESSING ON WHEAT DOUGH AND 1 BREAD CHARACTERISTICS 2 3 María Eugenia Bárcenas b , Rossana Altamirano-Fortoul b , Cristina M. Rosell a 4 5 a Food Science Department, Institute of Agrochemistry and Food Technology (IATA-CSIC), P.O. Box 73, 6 46100 Burjassot, Valencia, Spain 7 b Department of Chemical and Food Engineering, Universidad de las Américas Puebla, Ex-Hacienda 8 Santa Catarina Mártir, Cholula, Puebla, C.P. 72820, México 9 10 Running title: High pressure processing on breadmaking 11 12 13 Correspondence should be addressed to: 14 Dr Cristina M. Rosell 15 Instituto de Agroquimica y Tecnologia de Alimentos (IATA) 16 PO Box 73, Burjasot-46100. Valencia. Spain 17 Tel: 34-96-390 0022 18 Fax: 34-96-363 6301 19 e-mail: [email protected] 20
Transcript of 1 EFFECT OF HIGH PRESSURE PROCESSING ON WHEAT DOUGH …digital.csic.es/bitstream/10261/17292/1/LWT...

1
EFFECT OF HIGH PRESSURE PROCESSING ON WHEAT DOUGH AND 1
BREAD CHARACTERISTICS 2
3
María Eugenia Bárcenasb, Rossana Altamirano-Fortoulb, Cristina M. Rosella 4
5
aFood Science Department, Institute of Agrochemistry and Food Technology (IATA-CSIC), P.O. Box 73, 6
46100 Burjassot, Valencia, Spain 7 bDepartment of Chemical and Food Engineering, Universidad de las Américas Puebla, Ex-Hacienda 8
Santa Catarina Mártir, Cholula, Puebla, C.P. 72820, México 9
10
Running title: High pressure processing on breadmaking 11
12
13
Correspondence should be addressed to: 14
Dr Cristina M. Rosell 15
Instituto de Agroquimica y Tecnologia de Alimentos (IATA) 16
PO Box 73, Burjasot-46100. Valencia. Spain 17
Tel: 34-96-390 0022 18
Fax: 34-96-363 6301 19
e-mail: [email protected] 20
2
ABSTRACT 21
Microbial, physical and structural changes in high pressured wheat dough were studied 22
as a function of pressure level (50-250 MPa) and holding time (1-4 min). Thereafter, 23
selected conditions of high hydrostatic processing (HPP) were applied to bread dough 24
and the technological quality of the obtained breads was studied. The effect of HPP on 25
wheat dough was investigated by determining microbial population (total aerobic 26
mesophilic bacteria, moulds and yeasts), color and mechanical and texture surface 27
related dough parameters (cohesiveness, adhesiveness, hardness and stickiness). HPP 28
reduced the endogenous microbial population of wheat dough from 104 colony forming 29
units/g (CFU) to levels of 102 CFU. HPP treatment significantly (P<0.05) increased 30
dough hardness and adhesiveness, whereas treatment time reduced its stickiness. 31
Scanning electron micrographs suggested that proteins were affected when subjected to 32
pressure levels higher than 50 MPa, but starch modification required higher pressure 33
levels. HPP treated yeasted doughs led to wheat breads with different appearance and 34
technological characteristics; crumb acquired brownish color and heterogeneous cell gas 35
distribution with increased hardness due to new crumb structure. This study suggests that 36
high hydrostatic processing in the range 50-200 MPa could be an alternative technique 37
for obtaining novel textured cereal based products. 38
39
40
Keywords: wheat dough, high pressure processing, microbiology, dough texture, bread. 41
42

3
INTRODUCTION 43
In the last decades, the development of non conventional methods for food processing, 44
like high pressure processing (HPP), has attracted much attention. This technology 45
consists in submitting foods to high hydrostatic pressure (usually among 100 and 1000 46
MPa) with the purpose of inhibiting both pathogen and spoiled microorganisms and of 47
inactivating enzymes that cause undesirable changes (Farr, 1990; Hoover, Metrick, 48
Papineau, Farkas & Knorr, 1989). The application of this technology in food storage has 49
been growing, even at industrial level, due to its effect on microorganisms and enzymes 50
leading to high quality food products (Mertens & Knorr, 1992; Norton & Sun, 2007). 51
Additionally, this technology is being applied to food and raw material processing for 52
obtaining innovative sensorial and functional properties (Welti-Chanes, López-Malo, 53
Palou, Bermúdez, Guerrero-Beltrán & Barbosa-Canovas, 2005; Norton et al., 2007). 54
High hydrostatic pressure has been successfully applied to different food matrices. 55
Currently, it is possible to find fruit juices, oysters, sliced jam, avocado puree, and so on 56
in the market of different countries (San Martín-González, Welti-Chanes & Barbosa-57
Canovas, 2006; Norton et al., 2007). Nevertheless, there are scarce studies about the use 58
of high hydrostatic pressure in the discipline of cereals and cereal based products. In the 59
Japanese market it can be found HPP treated sake and rice sake (Cheftel, 1995). 60
Different scientific reports described the effect of HPP on specific cereal components 61
properties or model systems, namely starch and gluten (Gomes, Clark & Ledward, 1998; 62
Apichartsrangkoon, Ledward, Bell & Brennan, 1998; Kieffer, Schurer, Köhler & Wieser, 63
2007). HPP induces starch gelatinization, following different mechanism than thermally-64
induced gelatinization (Gomes et al., 1998). HPP treatment provokes swelling of starch 65
but keeping granule integrity; as a consequence HPP treated starches modify their 66
microstructure and rheological properties in a different way than thermally treated ones 67

4
(Gomes et al., 1998; Stolt, Oinonen & Autio, 2000), and the extend of swelling highly 68
depends on the type of starch, pressure level and time of treatment (Stute, Heilbronn, 69
Klingler, Boguslawski, Eshtiaghi & Knorr, 1996; Stolt et al., 2000). In addition, thermal 70
properties of pressure-treated starches show decrease in both gelatinization temperature 71
and enthalpy; besides starch granules loose crystallinity and they are prone to aggregate 72
(Wang, Li, Wang, Chiu, Chen & Mao, 2008). Simultaneously, some studies carried out 73
on gluten showed that HPP produces a weakening effect on gluten when low pressure 74
levels (200 MPa) were applied, but an increase in pressure and temperature (800 MPa, 75
60°C) induces the opposite effect, the strengthening of gluten losing its cohesiveness 76
(Kieffer et al., 2007), because HPP brings about the formation of disulphide bonds 77
(Apichartsrangkoon et al., 1998; Kieffer et al., 2007). Nonetheless, there is no study 78
about the effect of HPP on the complete matrix of wheat dough and the potential use of 79
HPP for leading to HPP new cereal based product development with novel texture. 80
81 The aim of this study was firstly to determine the effect of diverse hydrostatic pressure 82
levels applied for different periods of time on the microbiological, physical and 83
structural characteristics of wheat dough and secondly, to explore the possible use of 84
HPP for obtaining wheat breads with novel texture characteristics. 85
86
MATERIALS AND METHODS 87
Materials 88
A commercial blend of wheat flours (14.21 g/100g moisture content, 11.44 g/100g 89
protein content, 0.61 g/100g ash content, 34.5 g/100g wet gluten) was used in this 90
study. Salt and compressed baker’s yeast were acquired in the market. 91
92
Wheat dough preparation and HPP treatment 93

5
Wheat flour was mixed with salt (1.5 g/100g , flour basis), and the amount of water 94
required for reaching 500 Brabender units dough consistency. Mixing was carried out in 95
a 300 g bowl Brabender Farinograph (Brabender, Duisburg, Germany) for 10 minutes. 96
Then dough was divided in 30 g pieces, hand moulded and packed in polyethylene bags 97
(11x12 cm), that were thermosealed under vacuum (Murtivac, España). For HPP, the 98
packed doughs were placed into the pressurization cabinet of the HPP device 99
(Engineering Pressure Systems SO 12644, Belgium), and then subjected to different 100
pressures (50, 100, 150, 200 or 250 MPa) for various holding times (1, 2, 3 or 4 101
minutes). Control dough without HPP treatment was used as reference. Samples after 102
each treatment of pressure and time were evaluated. 103
104
Microbiological analysis 105
For determining the endogenous amount of total aerobic mesophilic bacteria (TAMB) in 106
the wheat dough, 10-1 and 10-2 dilutions of the sample were prepared in water peptone 107
solutions (15g/100 mL), and then 0.1 mL aliquot was inoculated in agar plates (PCA, 108
Scharlau). Colony forming units (CFU) were counted after incubation at 38°C for 24 h.. 109
A sample of each dough (1g) was homogenized with 9 mL peptone solutions, serially 110
diluted and plating on potato-dextrose Agar (PDA, Scharlau Chemie, Barcelona, Spain) 111
for yeast and mould counts. Microbial counts were determined after aerobic incubation 112
at 25°C, for five days. Determinations were carried out in triplicate. 113
114
Dough machinability and surface related profile 115
Mechanical and surface related properties were determined in the reference (non HPP 116
treated) and in HPP treated doughs. Dough machinability was determined by assessing 117
the texture profile analysis (TPA) and dough stickiness in a TA-XT2i texturometer 118

6
(Stable Micro Systems, Godalming, UK) as described by Armero and Collar (1997) 119
using the Chen and Hoseney cell. Primary textural properties were measured in absence 120
of dough adhesiveness by using a plastic film on the dough surface to avoid the 121
distortion induced by the negative peak of adhesiveness (Collar & Bollaín, 2005). The 122
adhesiveness was measured without the plastic film. Three and ten repetitions for the 123
TPA parameters and stickiness were done, respectively. Compression test was 124
performed with a 25mm diameter cylindrical aluminium probe (SMSP/25), 60% 125
compression rate followed of 75s interval. TPA profile recorded the following 126
parameters: hardness (N), adhesiveness (Ns) and cohesiveness. The Chen and Hoseney 127
cell with a cylindrical probe of 25mm diameter was used for dough stickiness (N) 128
determination (Armero et al., 1997). 129
130
Wet gluten and gluten index determination 131
The amount of wet gluten and the gluten index were determined to assess the effect of 132
HPP on the gluten characteristics. Gluten was extracted from 10 g of wheat dough using 133
a gluten washer (Glutomatic, Stockholm, Sweden). Gluten index was determined 134
according to the approved method (ICC, 2004). Values are the average of three 135
replicates. 136
137
Scanning electron microscopy 138
The microstructure of the reference and the treated dough samples was analysed by 139
scanning electron microscopy (SEM). Freeze dried samples were mounted on metal 140
stubs using double tape active carbon and sputter-coated with 100-200Å thick layer of 141
gold and palladium by Ion Sputter (Bio-Rad SC-500). Sample analysis was performed 142

7
at an accelerating voltage of 10kV with a SEM Hitachi 4100 from the SCSIE 143
Department of the University of Valencia. 144
145
Breadmaking procedure 146
Wheat bread doughs or yeasted doughs were obtained following the same procedure as 147
described above for dough preparation but including compressed yeast (4%, flour basis) 148
in the recipe. After HPP treatment, bread dough was hand rounded and put it into pans. 149
Proofing was made in a fermentation cabinet (National MF6.C0, US) at 28ºC and 80% 150
relative humidity during the required time to reach three times the initial bread dough 151
volume. Pan breads were baked in an electric oven (Eurofours, France) at 210ºC for 11 152
min, and then they were cooled down for one hour before running the further analysis. 153
154
Dough and bread color 155
Color was determined with a Color Guard System Colorimeter (Hunter Laboratory, 156
Reston, VA). Color was determined by reflectance mode and expressed by L 157
(luminosity), a (green-red) and b (blue-yellow) Hunter parameters. The colorimeter was 158
calibrated by utilizing the black tile and the white standard (L=92.89, a=-1.05, b=0.82). 159
The net difference of color (∆E) was calculated by equation 1: 160
161
( ) ( ) ( )222mcmcmc aabbLLE −+−+−=∆ (Eq.1) 162
163
Where the subscript m corresponded to HPP treated dough or bread obtained from 164
treated bread dough, and subscript c indicated the values of the reference dough or 165
bread (without HPP treatment). 166
8
167
Bread quality assessment 168
In order to determine the bread quality, the volume (rapeseed displacement), weight, 169
height/width ratio of the slices, and moisture content were measured. Moisture content 170
was determined following the ICC Method (2004). Besides, a texture profile analysis 171
(TPA) of the breadcrumbs was performed by a Texture Analyzer TA-XT2i texturometer. 172
A bread slice of 2-cm-thickness was compressed up to 50% of its original height at a 173
crosshead speed of 1 mm/s with a cylindrical stainless steel probe (diameter 25 mm). 174
Values were the mean of four replicates. The cross-section of bread slices was visually 175
observed. Sensory perception was performed by ten trained panellists (5 women and 5 176
men), whose age ranged from 24 to 50 years old. The trained panel scored the overall 177
acceptability of the breads using a semi-structured scale (0: extremely dislike, 10: 178
extremely like). 179
180
Statistical analysis 181
Experimental data from wheat dough characterization were submitted to multifactor 182
analysis of variance (MANOVA) using Statgraphics Plus, versión 5.1 (Statistical 183
Graphics Corp., 1994-2001). Experimental data from bread quality assessment were 184
submitted to one-way analysis of variance (ANOVA). All data were presented as mean 185
values of at least three replicates ± standard error (SE). When analysis of variance 186
indicated significant F values, multiple sample comparison was also performed by 187
Tukey HSD test in order to detect significant differences (P<0.05). 188
189
RESULTS AND DISCUSSION 190
Effect of high pressure processing on the microbial population of the wheat dough 191

9
A preliminary study of the effect of HPP on wheat dough was carried out to select the 192
most adequate HPP conditions considering the endogenous microbial dough population 193
and dough mechanical and structural properties. The effect of different HPP levels, 194
applied for different duration, on the colony forming units (CFU) of total aerobic 195
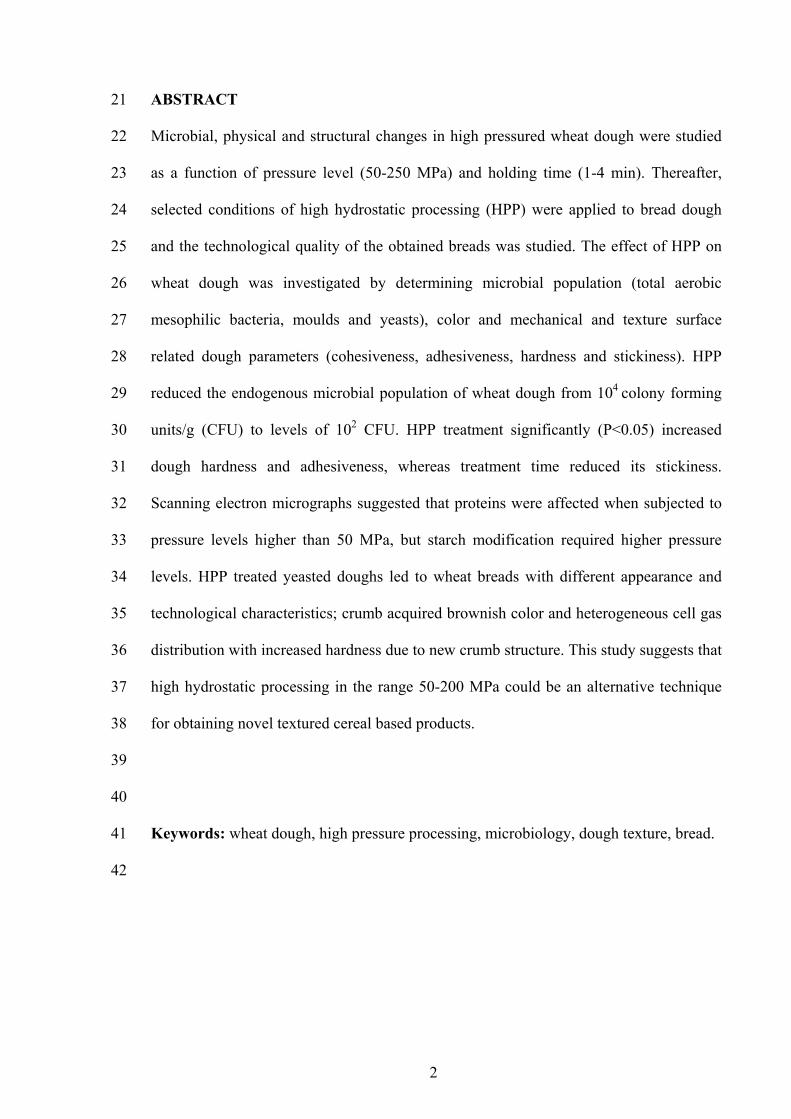
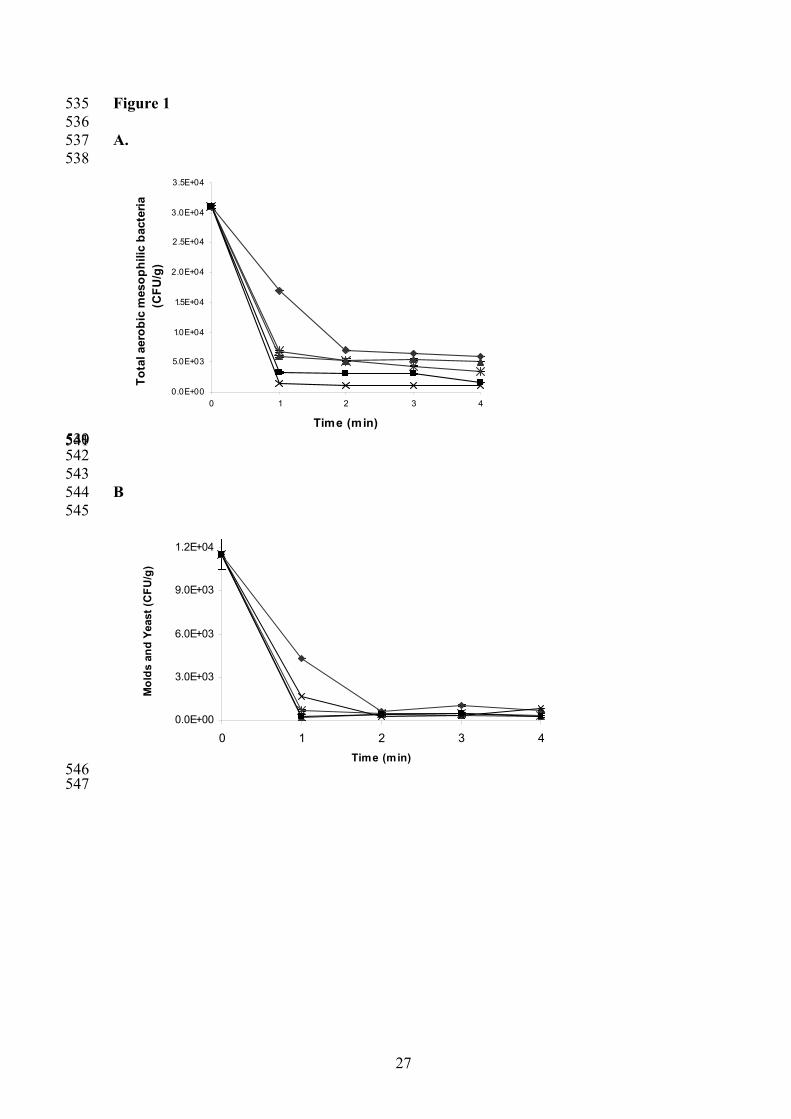
mesophilic bacteria (TAMB) of wheat dough can be observed in Figure 1. An important 196
reduction of microorganisms was observed after one minute of exposure at HPP, and no 197
further significant decrease was obtained by increasing the duration of the treatment, 198
with the exception of samples treated at hydrostatic pressure of 50 MPa, which required 199
prolonged treatment (two minutes). Generally, an increase in pressure has been related to 200
high microbial inactivation, but that relationship has not been found with the time of 201
treatment (Palou, López-Malo, Barbosa-Canovas, Welti-Chanes, Davidson & Swanson, 202
1998). In fact, it is necessary to determine the threshold HPP required for each 203
microorganism inactivation and above that an increase in the time of exposition does not 204
promote a significant reduction in the microbial counts, always having in mind the 205
essential role of the environment on the microorganism resistance to HPP (Palou et al., 206
1998). Nonetheless, HPP below 200 MPa can induce spore germination of certain 207
bacterial strains (Gould & Sale, 1970), increasing the amount of cells in vegetative state 208
and thus the colony forming units, although the present results did not suggest any 209
germination. 210
211
Similarly, it was determined the total moulds and yeasts counts presented in wheat dough 212
treated at different HPP during different time (Figure 1). Regardless the lowest HPP 213
tested, one minute of HPP was enough for reducing the moulds and yeast endogenous 214
population of the wheat dough. Similarly, with the exception of 50 MPa, no further 215
moulds and yeast counts decrease was observed by increasing treatment time. In 216

10
opposition, when doughs were HPP treated at 50 MPa, moulds and yeasts counts showed 217
additional decrease by extending the treatment time. Moulds and yeast are very sensitive 218
to HPP affecting the external shape of the cells and very high HPP treatment (500 MPa) 219
induces disruption and damage of the cell walls (Ogawa, Fukuhisa, Kubo & Fukumoto, 220
1990; Shimada, Andou, Naito, Yamada, Osumi & Hayashi, 1993). 221
The pairs HPP-time used in this study were enough to promote a significant reduction of 222
the TAMB and moulds and yeast counts, and after one or two minutes of treatment the 223
final microbial populations of the doughs were approximated 102 CFU/g. Lately, the 224
effect of HPP on the microorganism has been widely studied showing good efficiency 225
for microorganism inactivation (Carlez, Rosec, Richard, & Cheftel, 1993; Patterson, 226
Quinn, Simpson & Gilmour, 1995; Palou, López-Malo & Welti-Chanes, 2002), but 227
higher pressure and time than the ones used in the present study are usually applied. 228
Very mild HPP level and treatment time were tested in this study to ensure treatment 229
effectiveness with retention of dough functionality. 230
231
Effect of HPP on wheat dough color 232
Experimental color data were submitted to statistical analysis to determine the level of 233
significance of HPP level and the treatment duration on the color parameters (L, a, b) 234
and the total color change (∆E) (Table 1). The color of wheat dough was affected by 235
HPP treatment; nevertheless absolute differences among experimental data were rather 236
small. Luminosity (L) of the samples varied with the HPP treatment and the holding time 237
at constant pressure, but no significant differences were observed between the control 238
(untreated dough) and the treated doughs due to the pressure intensity. Pressure levels of 239
100 and 150 MPa produced the greatest effect on the a and b color parameters, showing 240
a tendency to red and yellow, respectively. Concerning the period of HPP treatment, 241

11
increasing duration of HPP resulted in decreased values of a parameter, whereas no 242
significant differences of b parameter were observed between the untreated sample (time 243
0) and the HPP treated samples. The total change of color (∆E) only was significantly 244
(P<0.05) increased when the highest HPP level (250 MPa) was applied, and regarding 245
the duration of HPP, all the times tested affected significantly (P<0.05) this parameter. 246
There is a general assumption that HPP is a preservative technique that protects food 247
color but only once circumspect treatment is applied (Norton et al., 2007). Hydrostatic 248
pressure applied to wheat dough modified the color parameters but only at the highest 249
pressure tested (250 MPa) was observed a significant change of the total color. 250
251
Effect of HPP on gluten 252
The amount of wet gluten and gluten index was determined in wheat dough samples 253
subjected to different levels of HPP (Table 2). Only the pressure level applied during 254
HPP induced significant effect on the amount of wet gluten and its quality assessed as 255
gluten index. However, no significant differences were observed between the untreated 256
dough and the HPP treated doughs. The duration of the HPP or holding time at constant 257
pressure did not have any significant effect on the characteristics of the gluten. Some 258
studies carried out on wheat gluten stated that at 20ºC, only hydrostatic pressure higher 259
than 200 MPa modifies the gluten structure and the effect was dependent on the holding 260
time (20 or 50 min) and temperature (20-60ºC) (Apichartsrangkoon et al., 1998; 261
Apichartsrangkoon, Bell, Ledward & Schofield, 1999). Conversely, Kieffer et al. (2007) 262
observed a decrease in the gluten strength when treated at low pressure (200 MPa). 263
Therefore, slightly contradictory results have been obtained when gluten was treated at 264
low pressure, but a consensus has been reached concerning that changes in gluten 265
structure associated to disulfide cross-linking only became significant at extreme 266

12
conditions (400-800MPa, 60ºC or lower temperature but prolonging the exposure) 267
(Apichartsrangkoon et al., 1998; Kieffer et al., 2007). HPP conditions applied in the 268
present study did not reveal substantial changes on gluten characteristics, either wheat 269
dough provided a shielding effect on gluten, or HPP conditions were too mild to induce 270
gluten physical changes. 271
272
Effect of HPP on the texture parameters of wheat dough 273
Data of mechanical and texture surface related parameters are included in Table 2. The 274
pressure level had a significant effect on the hardness, cohesiveness and adhesiveness, 275
whereas the holding time at constant pressure had only significant effect on the 276
stickiness. Increasing values of hardness and adhesiveness were obtained when raising 277
the hydrostatic pressure, besides a decrease in stickiness when increasing the time of 278
treatment (Table 2). No differences were detected on the cohesiveness of untreated 279
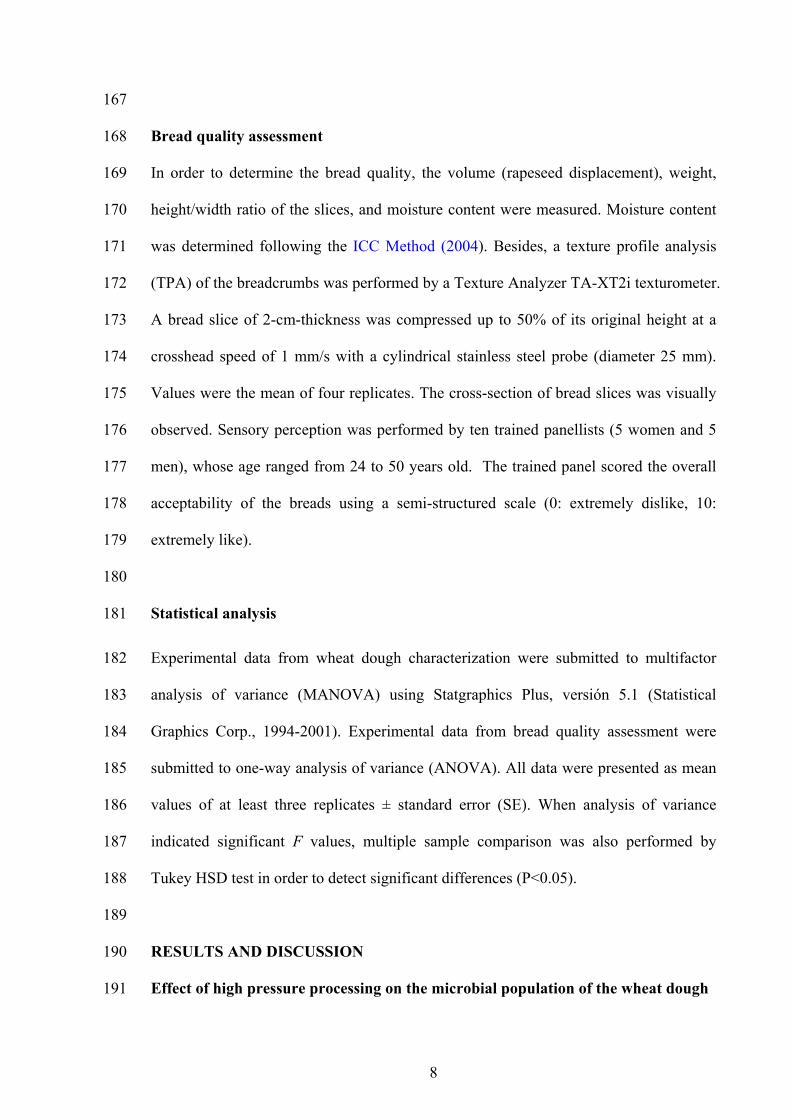
dough and HPP treated wheat doughs. Results agree with Apichartsrangkoon et al. 280
(1998) findings that described an increase in the hardness of high pressure treated wheat 281
gluten when applying hydrostatic pressure within the range 200-800 MPa, and that effect 282
was markedly dependent on the pressure, temperature and holding time of HPP. It is 283
advisable for proper breadmaking to keep dough stickiness at low levels, because it 284
seriously constrains dough machinability and that is even more important in automated 285
breadmaking processes (Armero et al., 1997). Considering that dough cohesiveness has 286
been reported as a good predictive parameter of fresh bread quality and keepability, and 287
maximized dough cohesiveness and minimized dough stickiness are recommended 288
trends for providing good bread-making performance (Armero et al., 1997), the range of 289
HPP conditions applied in this study would provide wheat dough with satisfactory 290
breadmaking performance. 291

13
292
Microstructure of HPP treated wheat dough 293
Scanning electron microscopy was used to determine the effect of the HPP on dough 294
microstructure. Scanning electron micrographs of wheat doughs treated at 50, 150 and 295
250 MPa for four minutes are showed in Figure 2. Untreated wheat dough (0 MPa) was 296
characterized by having a continuous structure with the intact starch granules embedded 297
in the matrix structure of proteins and soluble solutes. Two distinct populations of starch 298
granule sizes could be envisaged, ones with lenticular shape and the others smaller and 299
with spherical shape, which agree with previous reported two populations of A and B-300
type of starch granules (Angold, 1975). In the present study the reticular structure of the 301
wheat dough, previously reported (Rojas, Rosell, Benedito, Pérez-Munuera & Lluch, 302
2000), was not evident because samples were not subjected to sublimation, which is 303
necessary in cryo-scanning electron microscopy. After HPP treatment the continuous 304
matrix appeared disaggregated and the starch granules were clearly identified as 305
individual structures, however their structure became more distorted as the pressure level 306
increase. Dough treated at pressure of 50 and 150 MPa showed well defined starch 307
granules with diverse size, and the surrounding structures (mainly of protein nature) 308
were progressively reduced, being confined in the case of 150 MPa to agglomerates of 309
starch granules. Drastic changes were observed in dough treated at 250 MPa where 310
starch granules as individual structures disappeared adopting a discontinuous film like 311
organization similar to what happened after swelling and gelatinization. The effect of 312
high hydrostatic pressure on different types of starch has been widely studied (Stolt et al., 313
2000; Stute et al., 1996; Gomes et al., 1998; Katopo, Song & Jane, 2002). High pressure 314
induces a gelatinization process keeping intact the starch morphology (Stute et al., 1996; 315
Katopo et al., 2002). The effect of HPP on starch granules led to a limited swelling that 316
14
is highly dependent on the level of pressure, water moisture content, time of exposure, 317
and starch type (Stute et al., 1996). Studies focused on the effect of HPP on diverse 318
proteins described that pressure levels equal or higher than 1000-2000 MPa do not have 319
a significant effect on covalent bonds (Mozhaev, Heremans, Frank, Masson & Balny, 320
1994), hydrogen bonds are induced by HPP treatment and the hydrophobic linkages tend 321
to be stabilized at pressure levels higher than 100 MPa (Hoover et al., 1989). Following 322
previously reported explanations, gluten structure should not be severely affected by the 323
HPP carried out in the present study, but considering that HPP also favors unfolding and 324
dissociation of oligomeric proteins (Masson, 1992), some gluten modification could be 325
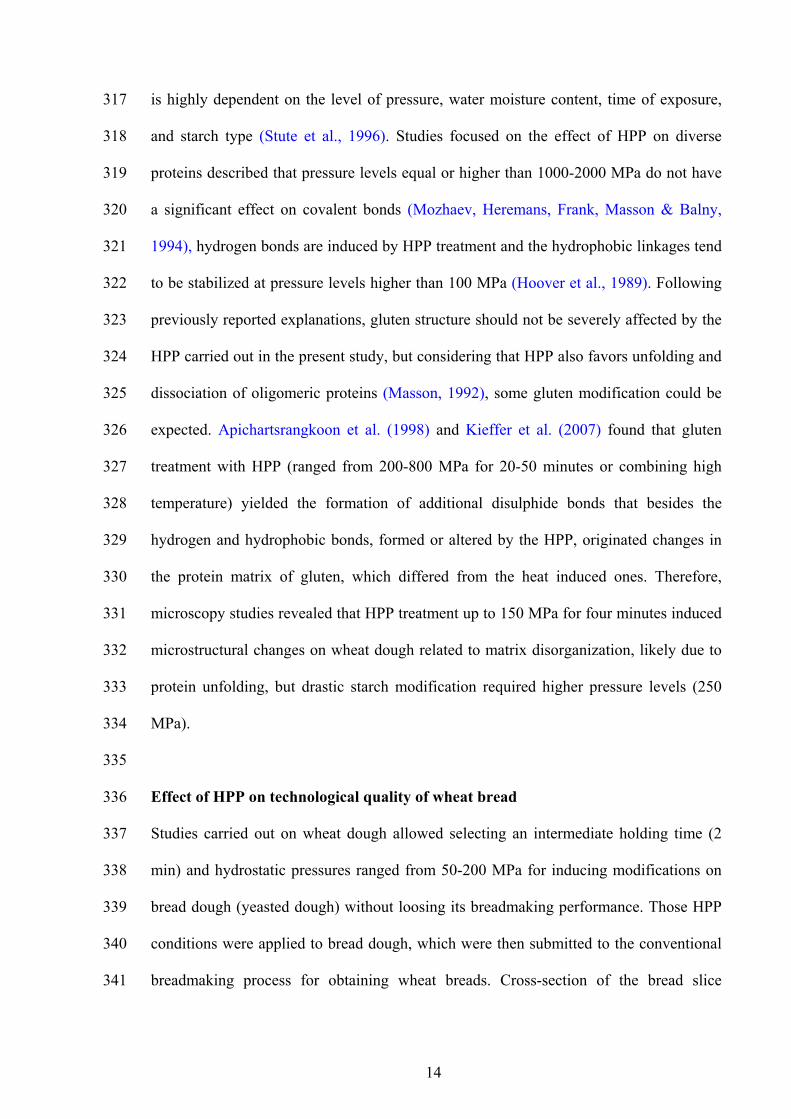
expected. Apichartsrangkoon et al. (1998) and Kieffer et al. (2007) found that gluten 326
treatment with HPP (ranged from 200-800 MPa for 20-50 minutes or combining high 327
temperature) yielded the formation of additional disulphide bonds that besides the 328
hydrogen and hydrophobic bonds, formed or altered by the HPP, originated changes in 329
the protein matrix of gluten, which differed from the heat induced ones. Therefore, 330
microscopy studies revealed that HPP treatment up to 150 MPa for four minutes induced 331
microstructural changes on wheat dough related to matrix disorganization, likely due to 332
protein unfolding, but drastic starch modification required higher pressure levels (250 333
MPa). 334
335
Effect of HPP on technological quality of wheat bread 336
Studies carried out on wheat dough allowed selecting an intermediate holding time (2 337
min) and hydrostatic pressures ranged from 50-200 MPa for inducing modifications on 338
bread dough (yeasted dough) without loosing its breadmaking performance. Those HPP 339
conditions were applied to bread dough, which were then submitted to the conventional 340
breadmaking process for obtaining wheat breads. Cross-section of the bread slice 341

15
obtained from HPP treated yeasted doughs is shown in Figure 3. Bread pictures show 342
that HPP greatly affected the crumb microstructure with uneven distribution of the gas 343
cells, and increased size of the alveoli. Even the lowest HPP level (50 MPa) induced the 344
formation of bigger gas cells compared to the control. Large gas cells were observed in 345
some places of the treated crumbs, besides a brownish color, and that appearance was 346
more noticeable when increasing pressure levels. Despite high hydrostatic processing 347
reduced the microbial population in wheat dough, the HPP treated yeasted doughs had 348
enough microbes’ survival (around 104 CFU/g in all HPP yeasted samples) for ensuring 349
dough fermentations. 350
The sensory evaluation of the treated breads revealed that, with the exception of the 351
200MPa treated sample, HPP gave acceptable products, with the same overall 352
acceptance as the non-treated bread (score 7). Judges emphasized the original layered 353
structure of the treated bread crumb that was very soft and attractive, reminding the 354
croissant structure. 355
Therefore the use of HPP on the yeasted dough might lead to the development of new 356
bakery products with novel crumb characteristics, resembling croissant structure. 357
Regarding bread technological quality (Table 3), HPP significantly (P<0.05) reduced the 358
volume and specific volume of the loaves, obtaining more compact and flat breads at 359
higher hydrostatic pressure treatment, as indicated the width/height ratio. Presumably, 360
the effect of HPP either on gluten network structure or on yeast cells fermentation ability 361
led to reduced dough expansion during proofing and baking, and in consequence lower 362
specific volume. Crumb hardness was also modified obtaining higher crumb hardness 363
with breads from treated doughs, which was expected due to the protein network 364
modification induced by HPP. Hardness increase has been always described in breads 365
that have undergone gluten network damage, for instance due to ice crystal formation 366
16
and growing like in frozen doughs or even from frozen partially baked breads 367
(Bhattacharya, Langstaff & Berzonsky, 2003; Bárcenas & Rosell, 2006). 368
The moisture content of the bread showed a steady increase as function of pressure levels. 369
Likely, crumb structure was holding higher amount of water molecules partly due to 370
chemical pressure-induced changes in proteins (Apichartsrangkoon et al., 1998; Kieffer 371
et al., 2007) and the pressure-induced gelatinization of starch that allows completing 372
starch gelatinization at lower temperatures (Stute et al., 1996; Katopo et al., 2002). 373
Color of crumb and crust of the bread was modified due to the HPP treatment of the 374
bread doughs (Table 4). Luminosity, a and b color parameters of crust were reduced with 375
the pressure levels, showing a significant (P<0.05) decrease at the higher pressure levels 376
tested. Those results agree with studies carried out by Tamaoka, Itoh and Hayashi (1991), 377
who showed that HPP in the range 50 and 500 MPa at 50° C on model systems formed 378
by glyceraldehyde, glycolaldehyde or xylose and aminoacids did not have any effect on 379
the condensation reaction but suppressed the browning process in the total course of the 380
Maillard reaction. The overall HPP effect considered as the total change of color (∆E) 381
showed a significant increase. 382
Concerning the crumb color, significant decrease in luminosity together with a large 383
increase in the total change of color were observed, in agreement with the visual 384
observation of the cross-section of the slices (Figure 3). No general trend could be 385
established regarding the a and b color parameters. Although color changes induced by 386
HPP in wheat dough were rather small, the temperature applied during baking resulted in 387
significant crumb color changes. 388
389
390

17
Treatment of wheat dough with high hydrostatic pressure induced rapid reduction of the 391
microbial population but sufficient mold and yeast survival, for ensuring bread dough 392
fermentation, can be obtained using mild pressure conditions (50-250 MPa, for two 393
minutes at 20ºC). Regarding dough properties, HPP treatment significantly (P<0.05) 394
increased hardness and adhesiveness, whereas stickiness was reduced by increasing the 395
time of exposure to HPP. SEM micrographs suggested that proteins were affected at 396
pressure levels ranged from 50 to 150 MPa, but starch modification required higher 397
pressure levels. HPP treated yeasted doughs allowed obtaining wheat breads with 398
different appearance and technological characteristics; crumb acquired brownish color 399
and uneven cell gas distribution with increased hardness due to new crumb structure. 400
This study suggests that high hydrostatic processing in the range 50-200 MPa could be 401
an alternative technique for obtaining novel textured cereal based products. 402
403
Acknowledgements 404
This work was financially supported by Spanish Ministerio de Ciencia e Innovación 405
Project (AGL2005-05192-C04-01), Consejo Superior de Investigaciones Científicas 406
(CSIC) and Mexican Consejo Nacional de Ciencia y Tecnología (CONACYT). 407
408
REFERENCES 409
Angold, R. (1975). Wheat starch (structural aspects). In: A., Spicer. Bread. Social, 410
Nutritional and Agricultural Aspects of Wheaten Bread. (pp. 141–160). London: 411
Applied Science 412
Apichartsrangkoon, A., Ledward, D.A., Bell, A.E., & Brennan, J.G. (1998). 413
Physicochemical properties of high pressure treated wheat gluten. Food Chemistry, 414
63(2), 215-220. 415
18
Apichartsrangkoon, A., Bell, A.E., Ledward, D. A., & Schofield, J. D. (1999). Dynamic 416
viscoelastic behavior of high-pressure-treated wheat gluten. Cereal Chemistry, 76, 417
777-782. 418
Armero, E., & Collar, C. (1997). Texture properties of formulated wheat doughs. 419
Relationships with dough and bread technological quality. European Food Research 420
Technology, 204,136–145. 421
Bárcenas, M.E., & Rosell, C.M. (2006). Effect of frozen storage time on the bread 422
crumb and aging of par-baked bread. Food Chemistry, 95, 438-445. 423
Bhattacharya, M., Langstaff, T.M., & Berzonsky, W.A. (2003). Effect of frozen storage 424
and freeze-thaw cycles on the rheological and baking properties of frozen doughs. 425
Food Research International, 36, 365-372. 426
Carlez, A., Rosec, J.P., Richard, N., & Cheftel, J.C. (1993). High pressure inactivation 427
of Citrobacter freundii, Pseudomonas fluorescens and Listeria innocua in 428
inoculated minced beef muscle. Lebensmittel Wissenschaft und Technologie. 26, 429
357-363 430
Cheftel, C.J. (1995). Review: High-pressure, microbial inactivation and food 431
preservation. Food Science and Technology International, 1, 75-90. 432
Collar, C., & Bollaín, C. (2005). Relationships between dough functional indicators 433
along breadmaking steps in formulated samples. European Food Research and 434
Technology, 220, 372–379. 435
Farr, D. (1990). High pressure technology in the food industry. Trends in Food Science 436
and Technology, 1, 14-17. 437
Gomes, M.R., Clark, A., & Ledward, D.A. (1998). Effects of high pressure on amylases 438
and starch in wheat and barley flours. Food Chemistry, 63, 363-372. 439

19
Gould, G.W., & Sale, A.J.H. (1970). Initiation of germination of bacterial spores by 440
hydrostatic pressure. Journal of General Microbiology, 60, 335. 441
Hoover, D.G., Metrick, C., Papineau, A.M., Farkas, D.F., & Knorr, D. (1989). 442
Biological effects of high hydrostatic pressure on food microorganisms. Food 443
Technology, 43(3), 99-107. 444
ICC. (2004). Determination of Wet Gluten Quantity and Quality (Gluten Index) of 445
Whole Wheat Meal and Wheat Flour. International Association for Cereal Science 446
and Technology. Standard method 155. Approved 1994. 447
ICC. (2004). Determination of the Moisture Content of Cereals and Cereal Products 448
(Practical method). International Association for Cereal Science and Technology. 449
Standard method 110. Approved 1960, revised 1976. 450
Katopo, H., Song, Y., & Jane J. L. (2002). Effect and mechanism of ultrahigh 451
hydrostatic pressure on the structure and properties of starches. Carbohydrate 452
Polymers, 47, 233-244. 453
Kieffer, R., Schurer, F., Köhler, P., & Wieser, H. (2007). Effect of hydrostatic pressure 454
and temperature on the chemical and functional properties of wheat gluten: studies 455
on gluten, gliadin and glutenin. Journal of Cereal Science, 45(3), 285-292. 456
Masson, P. (1992). Pressure denaturation of proteins. In C. Balny, R. Hayashi, K. 457
Heremans, & P. Masson. High Pressure and Biotechnology (pp. 89-99). Montrouge: 458
INSERM/John Libbey Eurotext Ltd. 459
Mertens, B., & Knorr, D. (1992). Development of non thermal processes for food 460
preservation. Food Technology, 46(5), 124-133. 461
Mozhaev, V.V., Heremans, K., Frank, J., Masson, P., & Balny, C. (1994). Exploiting the 462
effects of high hydrostatic pressure in biotechnological applications. Trends in 463
Biotechnology, 12, 493-501. 464

20
Norton, T., & Sun D.W. (2007). Recent advances in the use of high pressure as an 465
effective processing technique in the food industry. Food Bioprocess Technology, 466
DOI: 10.1007/s11947-007-0007-0. 467
Ogawa, H., Fukuhisa, K., Kubo, Y., & Fukumoto, H. (1990). Pressure inactivation of 468
yeast, molds, and pectinestearase in Satsuma mandarin juice: effects of juice 469
concentration, pH, and organic acids, and comparison with heat sanitation. 470
Agricultural and Biological Chemistry, 54, 1219-1225. 471
Palou, E., López-Malo, A., Barbosa-Cánovas, G.V., Welti-Chanes, J., Davidson, P.M., & 472
Swanson, B.G. (1998). High hydrostatic pressure come-up time and yeast viability. 473
Journal of Food Protection, 61(12), 1657-1660. 474
Palou, E., López-Malo, A., & Welti-Chanes, J. 2002. Innovative fruit preservation 475
methods using high pressure. In J., Welti-Chanes, G. V., Barbosa-Cánovas, J.M., 476
Aguilera. Engineering and Food for the 21st Century. (pp. 715-725). Boca Raton, FL: 477
CRC Press. 478
Patterson, M.F., Quinn, M., Simpson, R. & Gilmour, A. (1995). Sensitivity of vegetative 479
pathogens to high hydrostatic pressure treatment in phosphate-buffered saline and 480
foods. Journal of Food Protection, 58(5), 524-529 481
Rojas, J.A., Rosell, C.M., Benedito, C., Pérez-Munuera, I., & Lluch, M.A. (2000). The 482
baking process of wheat rolls followed by cryo scanning electron microscopy. 483
European Food Research and Technology, 212, 57-63. 484
San Martín-González, M.F., Welti-Chanes, J., & Barbosa-Cánovas, G. (2006). Cheese 485
manufacture assisted by high pressure. Food Reviews International, 22, 275-289. 486
Shimada, S., Andou, M., Naito, N., Yamada, N., Osumi, M., & Hayashi, R., 1993. 487
Effects of hydrostatic pressure on the ultrastructure and leakage of internal 488

21
substances in the yeast Saccharomyces cerevisiae. Applied Microbiology and 489
Biotechnology, 40(1), 123-131. 490
Stolt, M., Oinonen, S., & Autio, K. (2000). Effect of high pressure on the physical 491
properties of barley starch. Innovative Food Science and Emerging Technologies, 1, 492
167-175. 493
Stute, R., Heilbronn, R., Klingler, W., Boguslawski, S., Eshtiaghi, M.N., & Knorr, D. 494
(1996). Effects of high pressures treatment on starches. Starch/Stärke, 48, 399-408. 495
Tamaoka, T., Itoh, N., & Hayashi, R. (1991). High pressure effect on Maillard reaction. 496
Agricultural and Biological Chemistry, 55(8), 2071-2074. 497
Wang, B., Li, D., Wang, L., Chiu, Y.L., Chen, X.D., & Mao, Z. (2008). Effect of high-498
pressure homogenization on the structure and thermal properties of maize starch. 499
Journal of Food Engineering, 87, 436-444. 500
Welti-Chanes, J., López-Malo, A., Palou, E., Bermúdez, D., Guerrero-Beltrán, J.A., & 501
Barbosa-Cánovas, G.V. (2005). Fundamentals and applications of high pressure 502
processing to foods. In G.V. Barbosa-Cánovas, M.S. Tapia, & M.P. Cano. Novel 503
Food Processing Technologies (pp. 157-181). New York: Marcel Dekker/CRC Press. 504
22
Table 1. Effect of high pressure processing on color parameters of 505
wheat dough. Experimental data were submitted to multifactor analysis 506
of variance (MANOVA). 507
508
L a b ∆E Mean SE Mean SE Mean SE Mean SE
Grand mean 80.30 1.88 17.04 3.58 Pressure level (MPa)
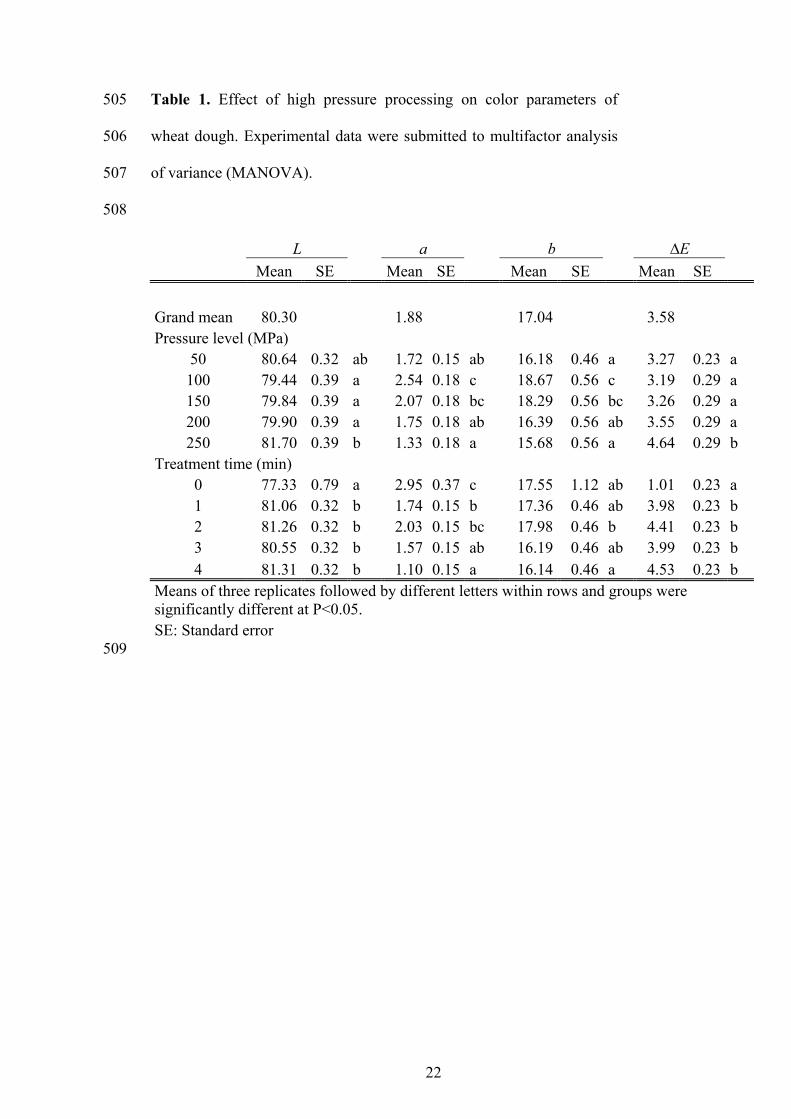
50 80.64 0.32 ab 1.72 0.15 ab 16.18 0.46 a 3.27 0.23 a 100 79.44 0.39 a 2.54 0.18 c 18.67 0.56 c 3.19 0.29 a 150 79.84 0.39 a 2.07 0.18 bc 18.29 0.56 bc 3.26 0.29 a 200 79.90 0.39 a 1.75 0.18 ab 16.39 0.56 ab 3.55 0.29 a 250 81.70 0.39 b 1.33 0.18 a 15.68 0.56 a 4.64 0.29 b
Treatment time (min) 0 77.33 0.79 a 2.95 0.37 c 17.55 1.12 ab 1.01 0.23 a 1 81.06 0.32 b 1.74 0.15 b 17.36 0.46 ab 3.98 0.23 b 2 81.26 0.32 b 2.03 0.15 bc 17.98 0.46 b 4.41 0.23 b 3 80.55 0.32 b 1.57 0.15 ab 16.19 0.46 ab 3.99 0.23 b 4 81.31 0.32 b 1.10 0.15 a 16.14 0.46 a 4.53 0.23 b
Means of three replicates followed by different letters within rows and groups were significantly different at P<0.05. SE: Standard error 509

23
Table 2. Effect of high pressure processing on gluten and mechanical and texture surface related parameters of wheat dough. Experimental data 510 were submitted to multifactor analysis of variance (MANOVA). 511 512
Wet gluten
(g) Gluten index
(%) Hardness
(N) Cohesiveness Adhesiveness
(Ns) Stickiness
(N) Mean SE Mean SE Mean SE Mean SE Mean SE Mean SE
Grand mean 16.9 51.1 4.61 0.65 4.34 0.44 Pressure level (MPa)
50 17.3 0.3 ab 53.1 2.9 ab 3.36 0.37 a 0.63 0.02 ab 2.75 0.51 a 0.41 0.03 100 16.5 0.4 ab 49.0 3.5 ab 3.81 0.45 ab 0.70 0.02 b 2.44 0.62 a 0.41 0.03 150 16.1 0.4 a 42.3 3.5 a 5.09 0.45 bc 0.65 0.02 ab 6.79 0.62 b 0.46 0.03 200 17.0 0.4 ab 56.4 3.5 b 5.48 0.45 c 0.67 0.02 ab 5.09 0.62 b 0.46 0.03 250 17.6 0.4 b 54.9 3.5 ab 5.43 0.45 c 0.60 0.02 a 4.95 0.62 b 0.43 0.03
Treatment time (min) 0 15.9 0.7 50.5 7.0 4.06 0.90 0.63 0.05 4.95 0.52 0.60 0.07 b 1 17.5 0.3 50.6 2.9 4.50 0.37 0.65 0.02 4.70 0.51 0.52 0.03 b 2 16.8 0.3 51.2 2.9 5.63 0.37 0.65 0.02 4.20 0.51 0.36 0.03 a 3 16.7 0.3 48.9 2.9 4.26 0.37 0.68 0.02 3.56 0.51 0.40 0.03 a 4 17.8 0.3 54.4 2.9 4.62 0.37 0.64 0.02 4.30 0.51 0.41 0.03 a
Means of three replicates (ten in the case of stickiness) followed by different letters within rows and groups were significantly different at P<0.05. SE: Standard error Values were not followed by letters, when ANOVA indicated no significant F values 513

24
Table 3. Effect of different levels of high pressure processing and holding time of two 514
minutes on fresh bread quality parameters. Experimental data were submitted to one-way 515
analysis of variance (ANOVA). 516
Moisture content (g/100g)
Volume (cm3)
Specific volume (cm3/g)
Width/Height ratio Hardness
(N) Pressure level
(MPa) Mean SE Mean SE Mean SE Mean SE Mean SE
0 29.6 0.0 a 126 7 d 4.2 0.0 c 1.3 0.0 a 2.48 0.10 a50 30.2 0.0 b 84 2 c 2.8 0.0 b 1.3 0.0 a 5.39 0.10 b100 34.9 0.0 c 80 1 b 2.7 0.0 b 1.6 0.0 b 6.26 0.10 c200 35.0 0.0 d 59 2 a 2.0 0.0 a 1.5 0.0 b 15.87 0.10 d
Means of three replicates followed by different letters within rows were significantly different at P<0.05. SE: Standard error 517

25
Table 4. Effect of different levels of high pressure processing and holding time of two minutes on crust and crumb color parameter of fresh bread. 518
Experimental data were submitted to one-way analysis of variance (ANOVA). 519
Crust Crumb L a B ∆E L a b ∆E Pressure level
(MPa) Mean SE Mean SE Mean SE Mean SE Mean SE Mean SE Mean SE Mean SE 0 49.87 0.33 b 10.03 0.20 bc 21.54 0.27 b 0.38 0.28 a 60.58 0.99 d -0.72 0.02 bc 8.61 0.11 b 2.08 0.65 a 50 52.03 0.33 c 9.59 0.20 b 22.76 0.27 b 2.54 0.28 b 53.66 0.99 c -0.94 0.02 a 10.59 0.11 c 7.22 0.65 b 100 47.24 0.33 a 10.50 0.20 c 17.79 0.27 a 4.69 0.28 c 44.96 0.99 b -0.65 0.02 c 7.42 0.11 a 15.67 0.65 c 200 45.96 0.33 a 8.48 0.20 a 18.46 0.27 a 5.23 0.28 c 39.62 0.99 a -0.78 0.02 b 7.38 0.11 a 21.02 0.65 d
Means of three replicates followed by different letters within rows were significantly different at P<0.05. SE: Standard error 520

26
521
FIGURE CAPTIONS 522
523
Figure 1. Effect of HPP treatment on total aerobic mesophilic bacteria (A) and on molds 524
and yeasts (B) of wheat dough. Error bars indicate standard deviation (n=3). Symbols: : 525
50MPa; ▲: 100MPa; : 150MPa; : 200MPa; : 250MPa. 526
527
Figure 2. Scanning electron micrographs (SEM) of wheat dough (2500X) exposed to 528
different levels of high pressure processing (0, 50, 150, 250 MPa) for 4 minutes. 529
530
Figure 3. Cross section of the different bread slices obtained from bread doughs treated at 531
different high pressure processing levels and two minutes of exposure. Values indicate the 532
pressure level used for HPP. 533
534
27
Figure 1 535 536 A. 537 538
0.0E+00
5.0E+03
1.0E+04
1.5E+04
2.0E+04
2.5E+04
3.0E+04
3.5E+04
0 1 2 3 4
Time (min)
Tota
l aer
obic
mes
ophi
lic b
acte
ria
(CFU
/g)
539 540 541 542 543 B 544 545
0.0E+00
3.0E+03
6.0E+03
9.0E+03
1.2E+04
0 1 2 3 4Time (min)
Mol
ds a
nd Y
east
(CFU
/g)
546 547

28
Figure 2 548 549 550
551 552 0 MPa 50 MPa 553 554 555
556 557 150 MPa 250 MPa 558

29
Figure 3. 559 560
561 Control 562 563
564 50 MPa 565 566 567
568 100 MPa 569 570
571 572 200 MPa 573