1 Discrete Probability Distributions. 2 Random Variable Random experiment is an experiment with...
29
1 Discrete Probability Distributions
-
Upload
jonathan-reed -
Category
Documents
-
view
236 -
download
3
Transcript of 1 Discrete Probability Distributions. 2 Random Variable Random experiment is an experiment with...

1
Discrete Probability Distributions

2
Random Variable
Random experiment is an experiment with random outcome.
Random variable is a variable related to a random event
3
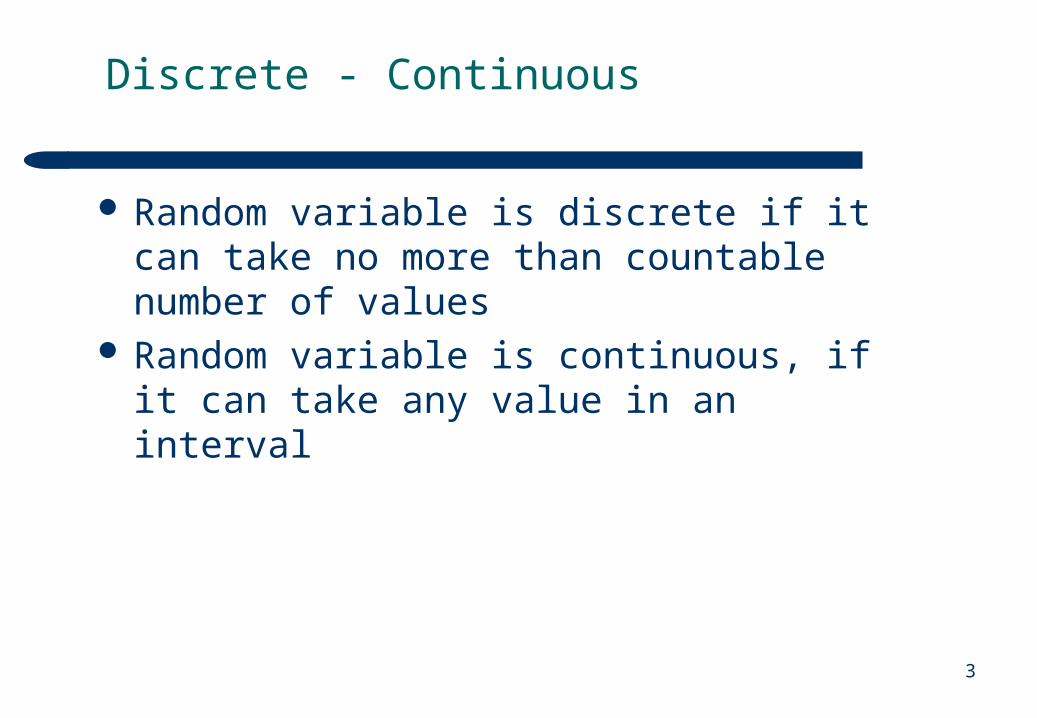
Discrete - Continuous
Random variable is discrete if it can take no more than countable number of values
Random variable is continuous, if it can take any value in an interval

4
Discrete Random Variables
The number of throws of a coin needed before a head first appears
The number of dots when rolling a dice The number of defective items in a sample of 20
items The number of customers arriving at a check-out
counter in an hour The number of people in favor of nuclear power in
a survey

5
Continuous Random Variables
The yearly income for a family The amount of oil imported into Finland in a
particular month The time that elapses between the installation of a
new component and its failure The percentage of impurity in a batch of chemicals

6
Discrete probability distribution
Discrete random variable values and their probabilities.

7
Fortune wheel
If the probability to win when rolling a fortune wheel is 15% then the probability distribution for the number of wins in 5 rolls is:
number of wins probability
0 44,3705%
1 39,1505
2 13,8178%
3 2,4384%
4 0,2152%
5 0,0076%

8
Two Dice
0
1/36
2/36
3/36
4/36
5/36
6/36
7/36
0 1 2 3 4 5 6 7 8 9 10 11 12 13Sum of outcomes
Pro
ba
bili
ty

9
Cumulative Distribution
x F(x)2 1/363 3/364 6/365 10/366 15/367 21/368 26/369 30/3610 33/3611 35/3612 36/36
Cumulative distribution function F(x) equals the probability to get at most x.
When playing two dice the sum of outcomes lies between 2-12. Using cumulative distribution we can easily find probabilities for different events:
P(X<7) = 15/36 0,42
P(X>9) = 1 – 30/36 = 6/36 0,17
P(4<X<9) = 26/36 – 6/36 = 20/36 0,56
10
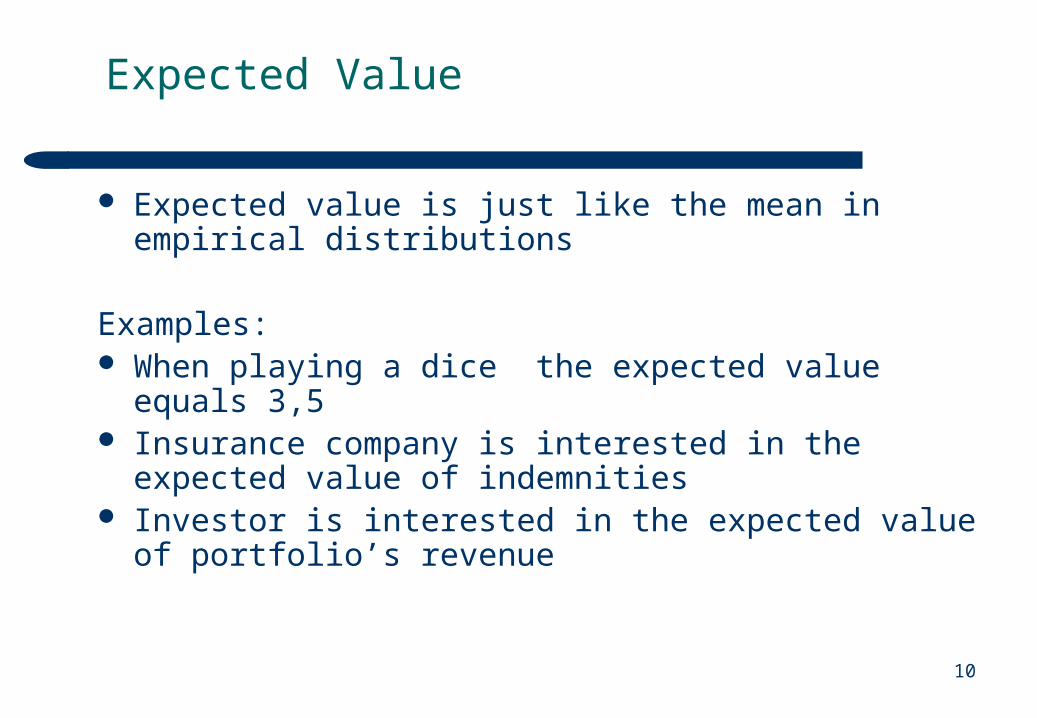
Expected Value
Expected value is just like the mean in empirical distributions
Examples: When playing a dice the expected value equals 3,5 Insurance company is interested in the expected value of
indemnities Investor is interested in the expected value of portfolio’s
revenue

11
Expected value calculation
The expected value for a discrete random variable is obtained by multiplying each possible outcome by its probability and then sum these products

12
Expected value example 1
Annual costs of an investment are estimated to be 100 000 per year for next 10 years.
Under boom estimated revenue is 180 000 per year and under recession 110 000 per year.
Probability of boom is 0,40 and probability of recession is 0,60.
Estimate the profitability of the investment.
13
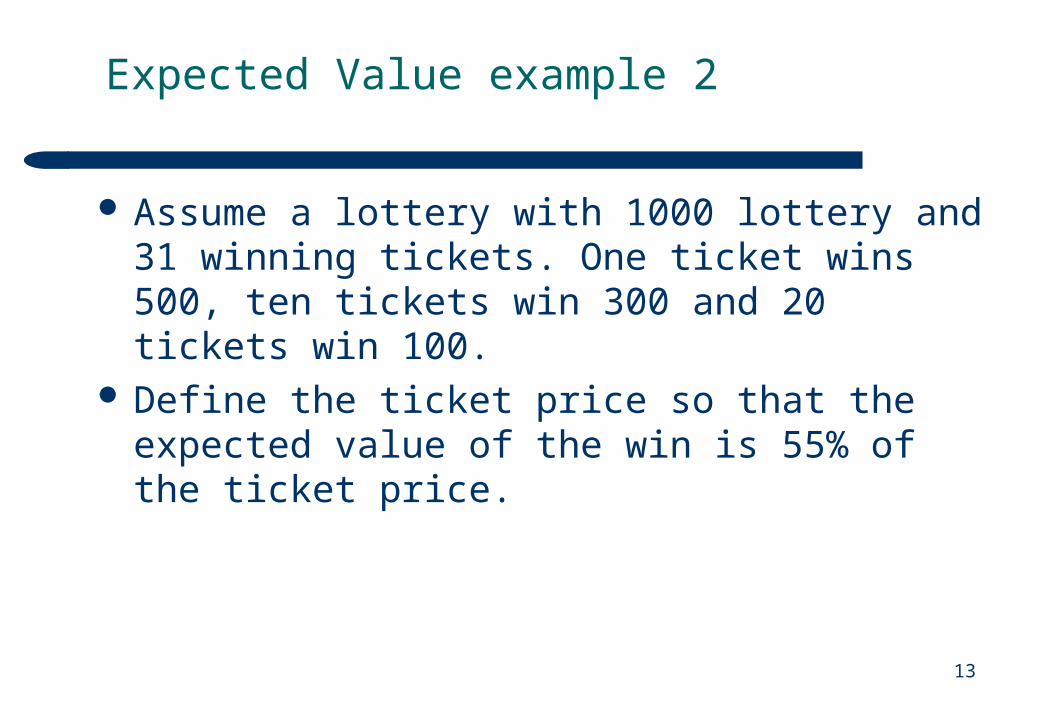
Expected Value example 2
Assume a lottery with 1000 lottery and 31 winning tickets. One ticket wins 500, ten tickets win 300 and 20 tickets win 100.
Define the ticket price so that the expected value of the win is 55% of the ticket price.
14
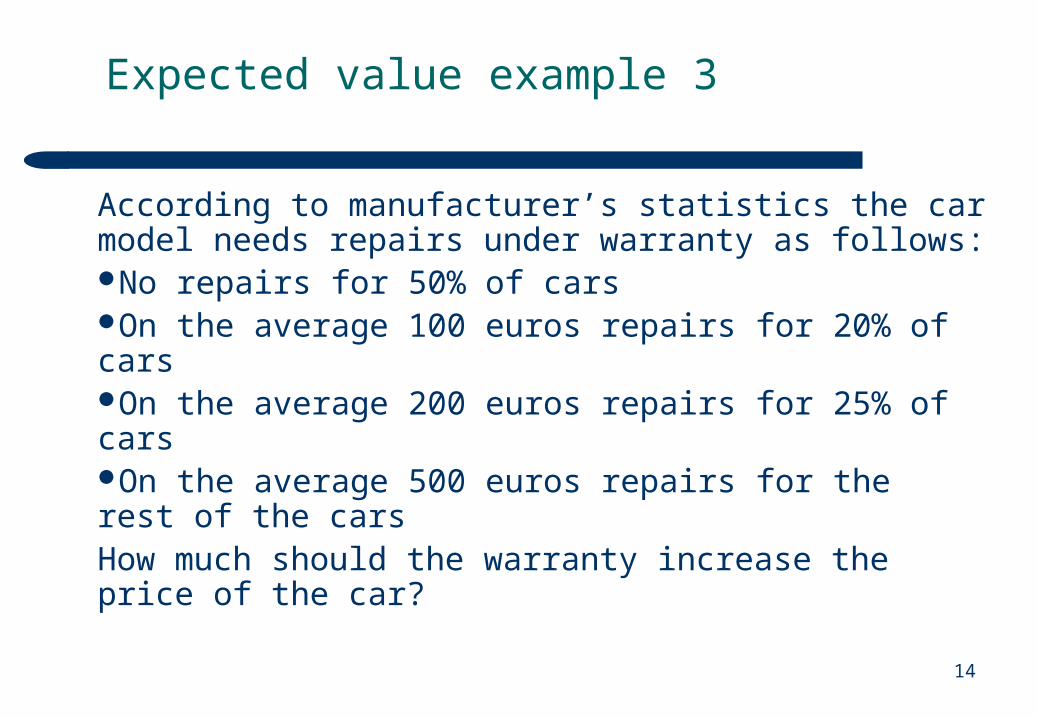
Expected value example 3
According to manufacturer’s statistics the car model needs repairs under warranty as follows:No repairs for 50% of carsOn the average 100 euros repairs for 20% of carsOn the average 200 euros repairs for 25% of carsOn the average 500 euros repairs for the rest of the carsHow much should the warranty increase the price of the car?

15
Expected Value example 4
An arranger of a sports event wants to take a rain insurance. The insurance price is defined using the probabilities of rain and the amounts of possible indemnities.
Define the price so that it is 40% higher than the expected value of indemnity.
Rain (mm) Probability Indemnity
0-2 50% -
3-5 30% 500
6-10 18% 2000
11- 2% 6000

16
Binomial Distribution Bin(n,p)
The experiment consists of a sequence of n identical trialsAll possible outcomes can be classified into two categories, usually called success and failureThe probability of an success, p, is constant from trial to trialThe outcome of any trial is independent of the outcome of any other trial
Binomial experiments satisfy the following:
17
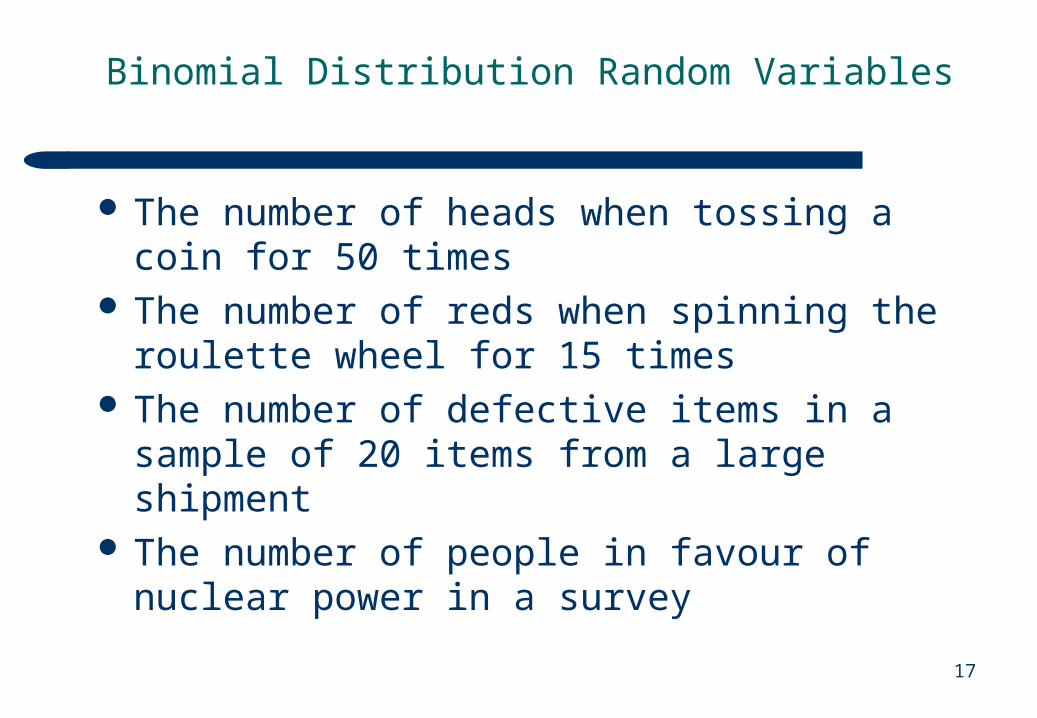
Binomial Distribution Random Variables
The number of heads when tossing a coin for 50 times
The number of reds when spinning the roulette wheel for 15 times
The number of defective items in a sample of 20 items from a large shipment
The number of people in favour of nuclear power in a survey

18
Binomial distribution and Excel
You can use Excel to find probabilities related to binomial distribution random variables (the number of successes x in the n trials:
Probability =BINOMDIST(x;n;p;0)Cumulative probability =BINOMDIST(x;n;p;1)

19
Poisson distribution
Poisson experiments satisfy the following The probability of occurrence of an event is the
same for any two intervals of equal length The occurrence or non-occurrence of the event in
any interval is independent of the occurrence or non-occurrence in any other interval
The probability that two or more events will occur in an interval approaches zero as the interval becomes smaller
20
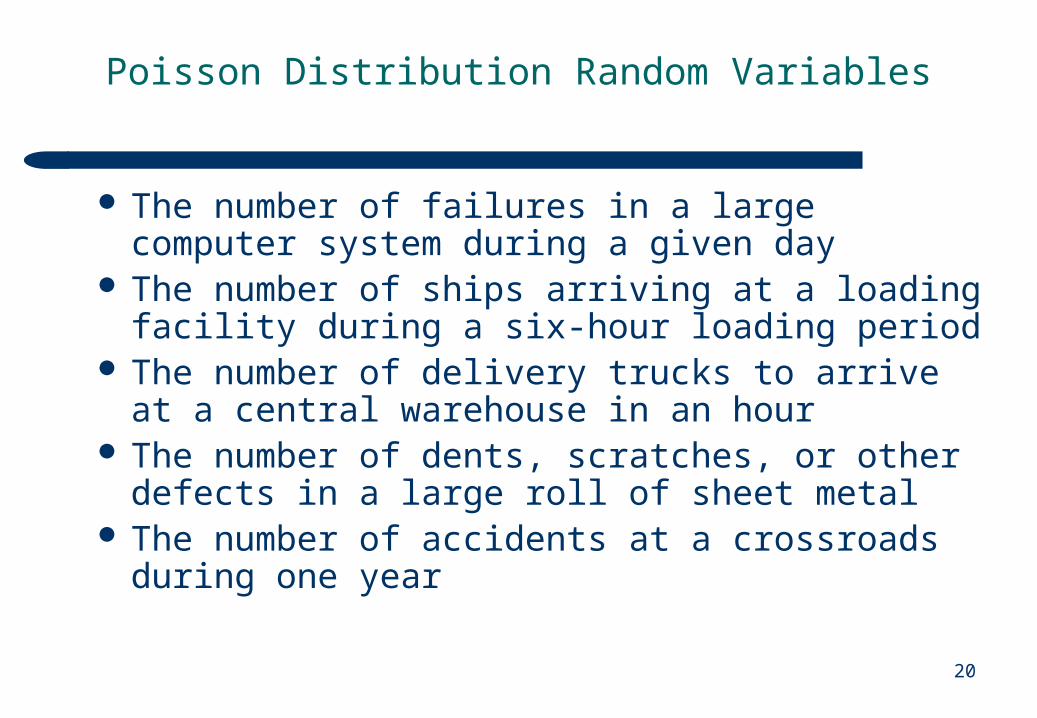
Poisson Distribution Random Variables
The number of failures in a large computer system during a given day
The number of ships arriving at a loading facility during a six-hour loading period
The number of delivery trucks to arrive at a central warehouse in an hour
The number of dents, scratches, or other defects in a large roll of sheet metal
The number of accidents at a crossroads during one year

21
Poisson and Excel
You can use Excel to find probabilities related to Poisson distribution random variables (the number of occurrences x in an interval):Probability =POISSON(x;;0)Cumulative probability =POISSON(x; ;1)
= the average number of occurrences in an interval

22
Continuous Probability Distributions

23
Normal Distribution
Many continuous variables are approximately normally distributedMeasurement errorsPhysical and mental properties of peopleProperties of manufactured productsDaily revenues of investments
24
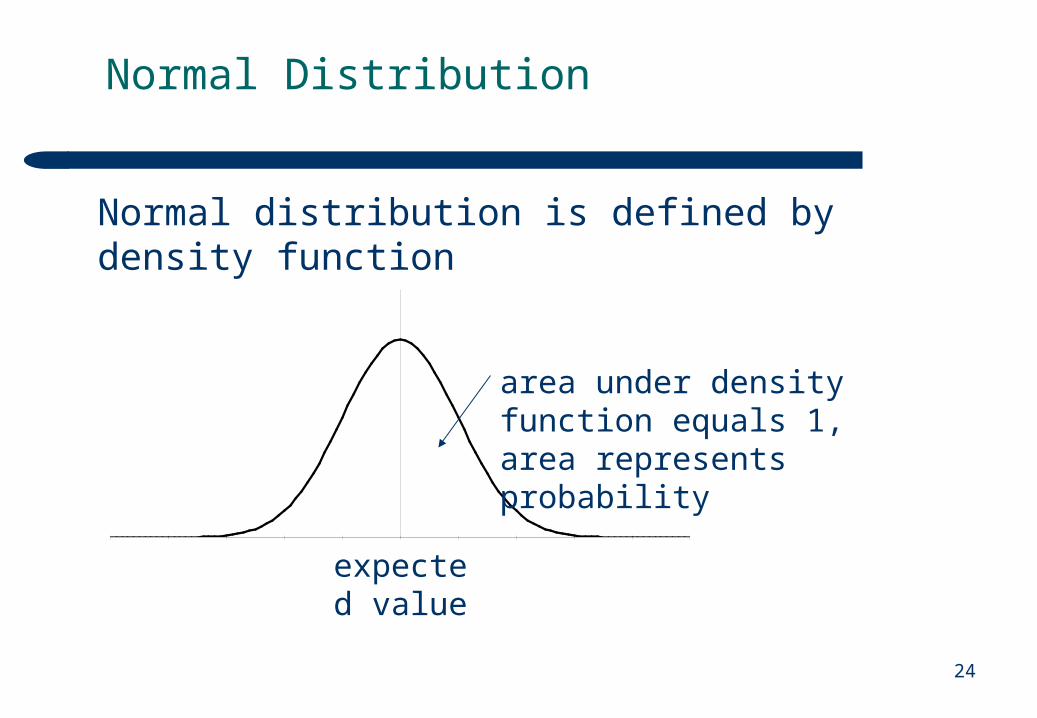
Normal Distribution
Normal distribution is defined by density function
expected value
area under density function equals 1, area represents probability

25
Cumulative Probability Function
Cumulative function for x = area to the left of x = probability to get at most x:
x
26
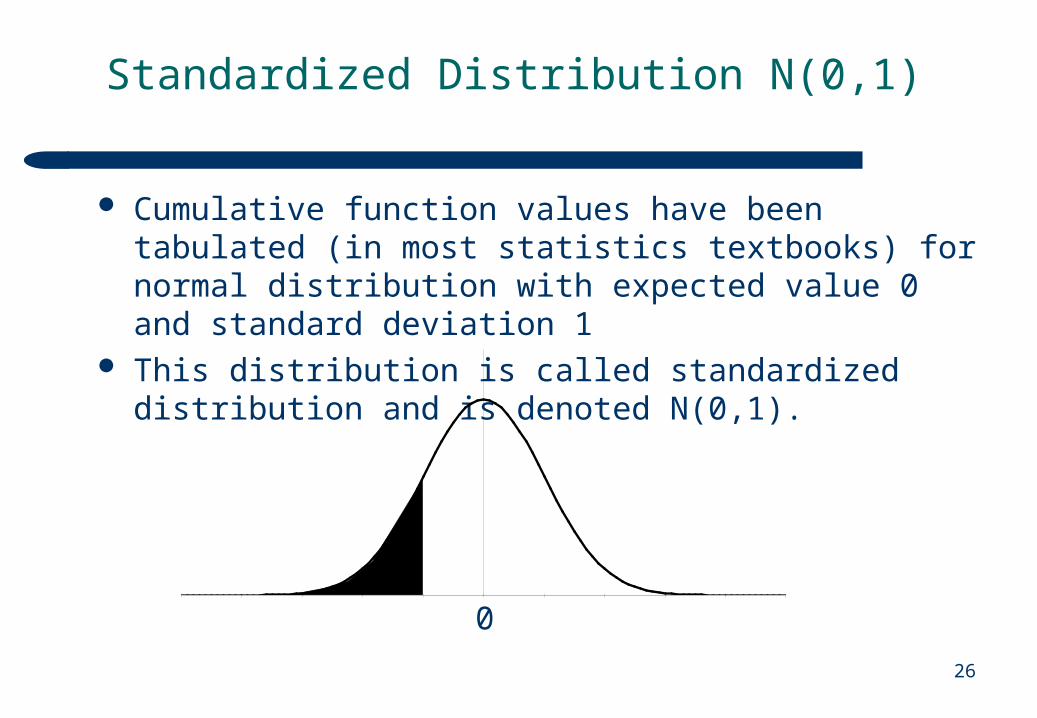
Standardized Distribution N(0,1)
Cumulative function values have been tabulated (in most statistics textbooks) for normal distribution with expected value 0 and standard deviation 1
This distribution is called standardized distribution and is denoted N(0,1).
0

27
Standardized Distribution and Excel
Cumulative probability =NORMSDIST(z) Random variable value z =NORMSINV(probability)

28
Standardizing
You can standardize any normal distribution N(,) variable to a standardized distribution N(0,1) variable
0x
x
z
z
SAME AREA! SAME PROB.!

29
Normal Distribution N(,) and Excel
Excel: =NORMDIST(x;;;1) Excel: =NORMINV(cumulative probability;;)