1 Detection of Differential Item/Test Functioning (DIF/DTF) Using IRT Implication and example.
27
1 Detection of Differential Item/Test Functioning (DIF/DTF) Using IRT Implication and example
-
Upload
lorraine-manning -
Category
Documents
-
view
225 -
download
0
Transcript of 1 Detection of Differential Item/Test Functioning (DIF/DTF) Using IRT Implication and example.

1
Detection of Differential Item/Test Functioning
(DIF/DTF) Using IRT
Implication and example

2
Why Study DIF/DTF Using IRT
comparing cultural, ethnic, or gender groups.
Meaningful comparisons require that measurement equivalence holds.
Classical test theory methods confound “bias” with true mean differences; IRT does not.
In IRT terminology, item/test bias is referred (relative) to DIF/DTF

3
Defining DIF and DTF
DIF
DBF
DTF
BIARS and IMPACT
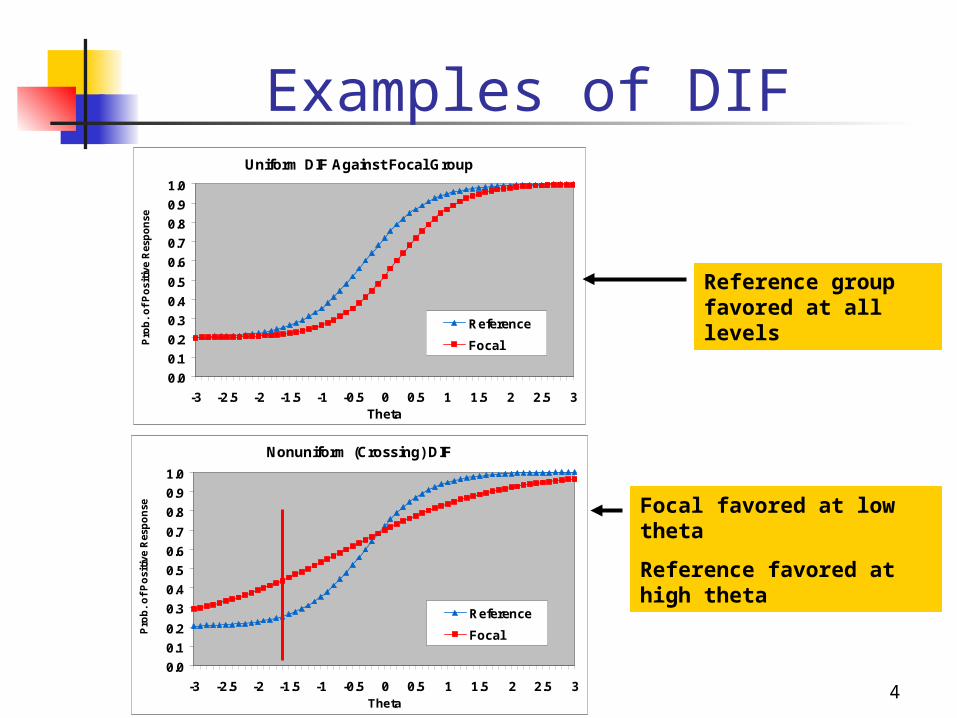
4
Examples of DIFUniform DIF Against Focal Group
0.0
0.1
0.2
0.3
0.4
0.5
0.6
0.7
0.8
0.9
1.0
-3 -2.5 -2 -1.5 -1 -0.5 0 0.5 1 1.5 2 2.5 3Theta
Pro
b.
of
Po
siti
ve R
esp
on
se
Reference
Focal
Nonuniform (Crossing) DIF
0.0
0.1
0.2
0.3
0.4
0.5
0.6
0.7
0.8
0.9
1.0
-3 -2.5 -2 -1.5 -1 -0.5 0 0.5 1 1.5 2 2.5 3Theta
Pro
b.
of
Po
siti
ve R
esp
on
se
Reference
Focal
Reference group favored at all levels
Focal favored at low theta
Reference favored at high theta

5
Example of DTF for 50-Item Test
DTF Against Reference Group
0.0
0.1
0.2
0.3
0.4
0.5
0.6
0.7
0.8
0.9
1.0
-3.0 -2.5 -2.0 -1.5 -1.0 -0.5 0.0 0.5 1.0 1.5 2.0 2.5 3.0
Theta
Pro
po
rtio
n C
orr
ec
t T
rue
Sc
ore
Focal
Reference
Most focal group members expected to score about 3 points higher

6
Procedures for Detecting DIF/DTF
DIF Parametric
Lord’s Chi-Square Likelihood Ratio Test Signed and Unsigned Area Methods
Nonparametric SIBTEST Mantel-Haenszel
DTF Parametric
Raju’s DFIT Method Nonparametric
SIBTEST

7
Detecting DIF Using Lord's Chi-Square
i1
i2i vv
vi is a vector of the differences in the estimated item parameters for the ith item between the focal and reference groups
i is the variance-covariance matrix for
the differences in item parameter estimates
Lord’s Chi-Square is sensitive to both uniform and nonuniform DIF.

8
Detecting DIF Using Lord's Chi-Square
1. Estimate item parameters and covariances for focal and reference groups separately.
2. Obtain linking constants, A and K, for putting the focal and reference parameters on a common metric.
3. Compute Lord’s chi-square to identify DIF items using the reference and transformed focal group parameters and their covariances.
4. Once the DIF items have been identified, reequate the focal and reference group metrics using only the non-DIF items.
5. Repeat steps 2 through 4 until the same items are identified on consecutive trials.
This procedure is implemented in the program ITERLINK.

9
Detecting DIF Using Mantel-Haenszel(1959)
Detect Dif of Dichotomous items Statistics S*2 *2
0<=aMH< 正无穷 (0 为无 DIF , >1有利于参照组, <1 有利于目标组 )
美国 ETS 公司做了改进。
)/)(/()/)((MH 1001 kfkrkkfkrk nffnffa

10
Detecting DIF Using Mantel-aenszel(1959)
)ln(35.2)ln(1.7
4MH aMHaMH
ETS 公司根据 MH 方法计算的结果,把项目分成三种, A ( negligible ) B(Moderate) C(Large)

11
Detecting DIF Using LOG Model
假设:如果 focal group 及 Reference group 能力相等,则有:
DIF LOG Model:
) | ( P ) | ( Pf y y r
uey
1
1
)*( 1131211 XGbXbGbu

12
Detecting DIF/DTF Using SIBTEST
Nonparametric method that can be used to examine individual items or groups of items Assumes only monotonicity Requires only item response data Works well with fairly small samples (250+)
Several variations exist Original SIBTEST: Uniform DIF Crossing SIBTEST: Nonuniform DIF PolySIB: Uniform DIF, polytomous data MultiSIB: Uniform DIF, multiple dimensions

13
Using SIBTEST
SIBTEST consists of two executable files: SIBIN.EXE : interactive, creates input file SIBTEST.EXE : performs DIF/DTF analyses
Choose “E” for either, “R” for reference, or “F” for focal group
Detailed discussion of running SIBIN and SIBTEST is presented on the web

14
LOG Model (SPSS)
在一个测验中,某道题男女同学 ( 以“ 1” 表示男,以“ 0” 表示女 ) 答对的情况 ( 以“ 1” 表示答对,以“ 0”表示答错 ) 及其总分如下表。问该题对于性别来说是否存在 DIF( 以男生为参照组,以女性为目标组 ) 。

15
答对情况 (Y) 总分 (X) 性别 (G)
1010101010
6.06.07.23.57.02.95.00.87.13.3
0100111100

16
Example (LOG Model)

17
Example (LOG Model)

18
Example (LOG Model)

19
Explore DIF Using EZDIFEZDIF measures DIF with the Mantel- Haensael and the Logistic Regression procedures.
Output files:
the common odds ratio a
the M-Hx2
the X2 significance level
the Holland & Thayer (1988) MH D-DIF statistic
the standard error of MH D-DIF
an ETS effect size code indicating A/B/C
empirical ICC, Logistic Regression output
20
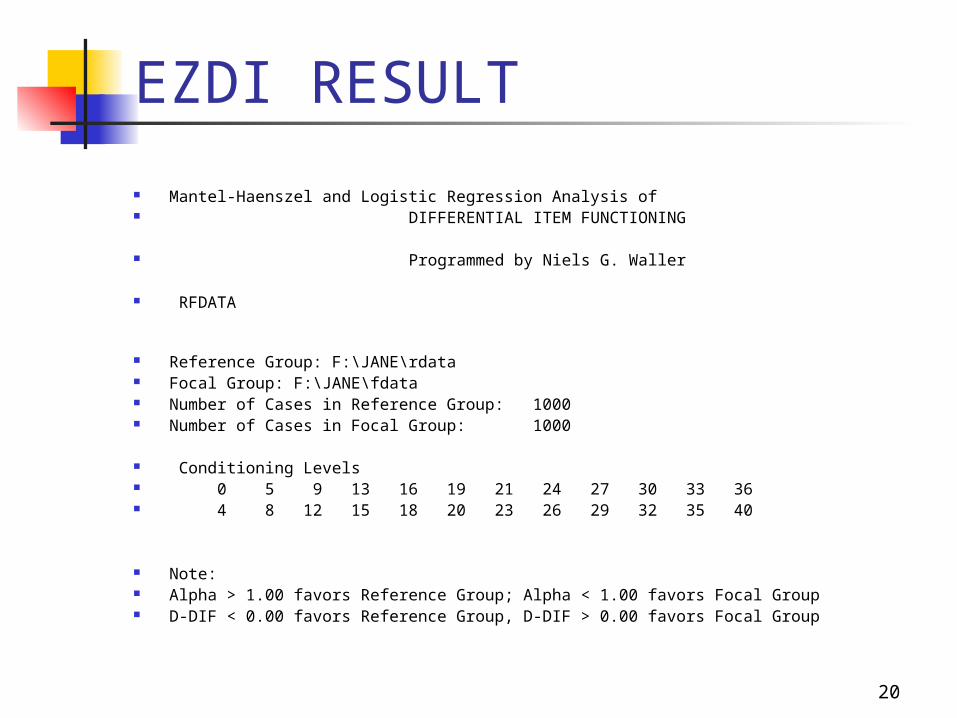
EZDI RESULT
Mantel-Haenszel and Logistic Regression Analysis of DIFFERENTIAL ITEM FUNCTIONING
Programmed by Niels G. Waller
RFDATA
Reference Group: F:\JANE\rdata Focal Group: F:\JANE\fdata Number of Cases in Reference Group: 1000 Number of Cases in Focal Group: 1000
Conditioning Levels 0 5 9 13 16 19 21 24 27 30 33 36 4 8 12 15 18 20 23 26 29 32 35 40
Note: Alpha > 1.00 favors Reference Group; Alpha < 1.00 favors Focal Group D-DIF < 0.00 favors Reference Group, D-DIF > 0.00 favors Focal Group

21
EZDIF RESULT CONT.
Results for Pass Number: 1 WARNING: Insufficient Data Found in Level: 0 - 4 SE ITEM Alpha X^2 P-Value MH D-DIF (MH D-DIF) CR 1*** 9.734 312.890 0.000 -5.348 0.332 CR 2*** 10.182 345.163 0.000 -5.453 0.323 CR 3*** 8.411 225.039 0.000 -5.004 0.363 CR 4*** 10.235 237.853 0.000 -5.466 0.400 CR 5*** 10.368 54.170 0.000 -5.496 0.871 A 6*** 0.697 8.351 0.004 0.848 0.288 A 7* 0.750 6.431 0.011 0.675 0.260 A 8 0.858 0.393 0.531 0.361 0.492 A 9 0.874 0.380 0.538 0.318 3.344 A 10* 0.747 6.584 0.010 0.686 0.262 A 11*** 0.715 8.161 0.004 0.788 0.271 B 12** 0.638 7.256 0.007 1.056 0.381 A 13 0.799 2.580 0.108 0.526 0.315 A 14*** 0.689 8.497 0.004 0.874 0.294 A 15** 0.737 6.668 0.010 0.718 0.272 A 16** 0.664 7.446 0.006 0.963 0.345 A 17 0.789 2.795 0.095 0.558 0.320

22
EZDIF RESULT cont.
Number of Items Purged in Pass 1: 5 Item Numbers: 1 2 3 4 5
Results for Pass Number: 2 WARNING: Insufficient Data Found in Level: 36 - 40 SE ITEM Alpha X^2 P-Value MH D-DIF (MH D-DIF) CR 1*** 11.796 357.628 0.000 -5.799 0.342 CR 2*** 12.610 394.589 0.000 -5.956 0.337 CR 3*** 11.565 280.040 0.000 -5.753 0.385 CR 4*** 14.334 288.049 0.000 -6.257 0.429 CR 5*** 14.755 74.687 0.000 -6.325 0.897 A 6 1.000 0.004 0.951 0.000 0.287 A 7 1.000 0.003 0.956 0.000 0.259 A 8 1.000 0.010 0.919 0.000 0.478 A 9 1.000 0.257 0.612 0.000 2.412

23
EZDIF RESULT cont.
24
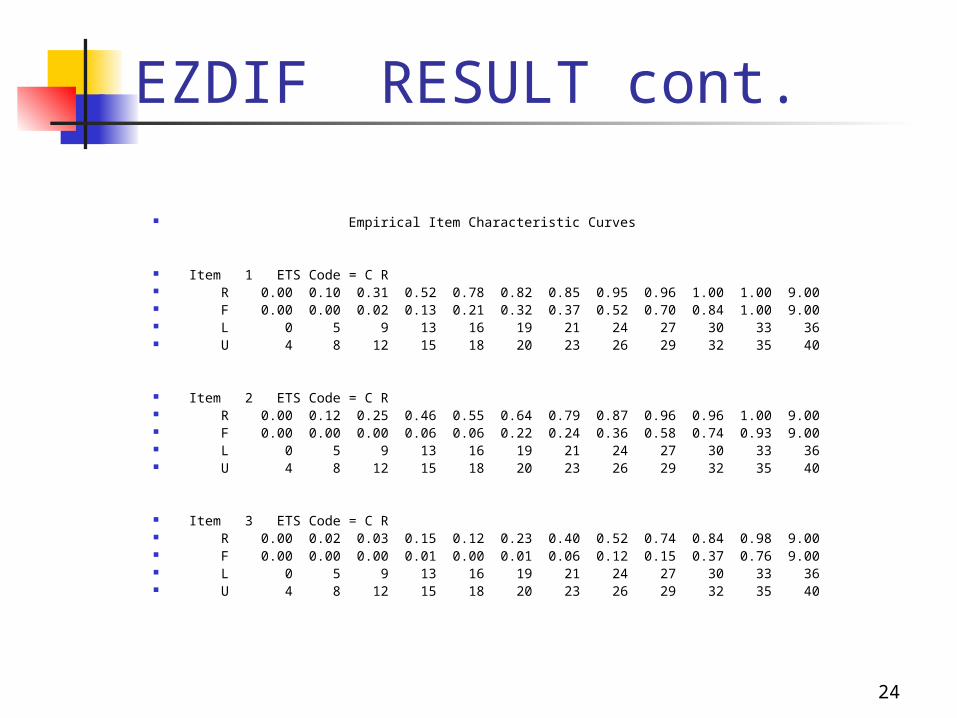
EZDIF RESULT cont.
Empirical Item Characteristic Curves
Item 1 ETS Code = C R R 0.00 0.10 0.31 0.52 0.78 0.82 0.85 0.95 0.96 1.00 1.00 9.00 F 0.00 0.00 0.02 0.13 0.21 0.32 0.37 0.52 0.70 0.84 1.00 9.00 L 0 5 9 13 16 19 21 24 27 30 33 36 U 4 8 12 15 18 20 23 26 29 32 35 40
Item 2 ETS Code = C R R 0.00 0.12 0.25 0.46 0.55 0.64 0.79 0.87 0.96 0.96 1.00 9.00 F 0.00 0.00 0.00 0.06 0.06 0.22 0.24 0.36 0.58 0.74 0.93 9.00 L 0 5 9 13 16 19 21 24 27 30 33 36 U 4 8 12 15 18 20 23 26 29 32 35 40
Item 3 ETS Code = C R R 0.00 0.02 0.03 0.15 0.12 0.23 0.40 0.52 0.74 0.84 0.98 9.00 F 0.00 0.00 0.00 0.01 0.00 0.01 0.06 0.12 0.15 0.37 0.76 9.00 L 0 5 9 13 16 19 21 24 27 30 33 36 U 4 8 12 15 18 20 23 26 29 32 35 40

25

26

27


![DTF-0507 [C] - ELECTRICAL CALCULATION.pdf](https://static.fdocuments.net/doc/165x107/563db921550346aa9a9a5270/dtf-0507-c-electrical-calculationpdf.jpg)