1 Customer Experience with Dynamic Rates: Load Impacts, Satisfaction Levels and Lessons Learned from...
42
1 Customer Experience with Dynamic Rates: Load Impacts, isfaction Levels and Lessons Learn from the California Pricing Pilot Load Management and Demand Response Programs EUCI conference, July 21-22, 2004 Mike Messenger Chief Demand Side Planner California Energy Commission [email protected]
-
date post
20-Dec-2015 -
Category
Documents
-
view
213 -
download
0
Transcript of 1 Customer Experience with Dynamic Rates: Load Impacts, Satisfaction Levels and Lessons Learned from...

1
Customer Experience with Dynamic Rates: Load Impacts,
Satisfaction Levels and Lessons Learned from the California Pricing Pilot
Load Management and Demand Response ProgramsEUCI conference, July 21-22, 2004
Mike MessengerChief Demand Side Planner
California Energy [email protected]
2
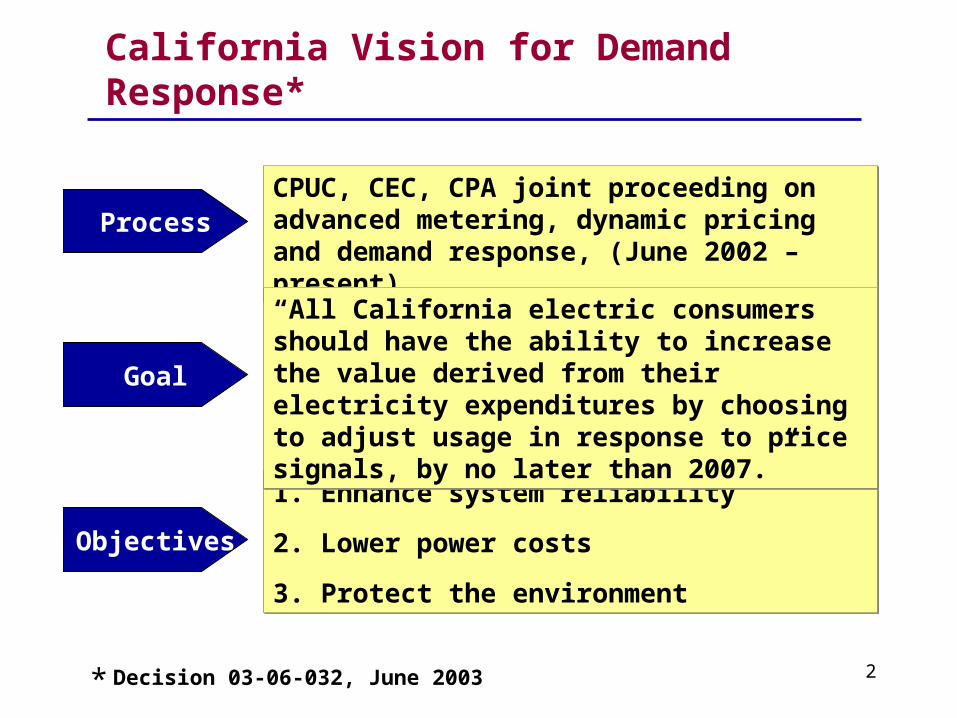
California Vision for Demand Response*
ProcessCPUC, CEC, CPA joint proceeding on advanced metering, dynamic pricing and demand response, (June 2002 – present)
CPUC, CEC, CPA joint proceeding on advanced metering, dynamic pricing and demand response, (June 2002 – present)
Objectives
1. Enhance system reliability
2. Lower power costs
3. Protect the environment
1. Enhance system reliability
2. Lower power costs
3. Protect the environment
Goal
“All California electric consumers should have the ability to increase the value derived from their electricity expenditures by choosing to adjust usage in response to price signals, by no later than 2007.”
“All California electric consumers should have the ability to increase the value derived from their electricity expenditures by choosing to adjust usage in response to price signals, by no later than 2007.”
Decision 03-06-032, June 2003*

3
Thoughts On the Transition to Dynamic Pricing and A Disclaimer
• The important thing for Government is NOT to do things which individuals and firms are doing already, or to do them a little better or a little worse, but to do and seek those things which at present are not being done at all! ( Who said this?)
• If economists were good at business, they would be rich men, instead of advisors to rich men

4
Vision Challenges
1. Dynamic Rate options require advanced metering networks and an upgrade to billing systems. This requires a thorough evaluation of the costs and benefits of advanced metering options and deployment strategy.
2. California utilities seek to identify demand elasticities for different types of customers to estimate system procurement impacts before deploying new rates.
3. Policy makers want to identify likely winners and losers under various rate deployment scenarios to avoid the risk of program failure Solution
California Statewide Pricing Pilot (SPP)California Statewide Pricing Pilot (SPP)

5
Roadmap for Today
• Pilot Objective and Sample Design• Customer Experience with Pilot and
Reaction to Rates and Need to adjust usage• Residential and Small Customer Load
results• Discuss Business Case Development• Highlight Key issues to be Resolved and
Next Steps

6
Definitions
Demand Response (DR)- Actions taken by customers on the demand side of the meter to adjust energy usage in response to changes in price or system conditions
Load Management- Programs designed to reduce peaks and fill valleys in typical system load shapes to increase overall asset utilization, ( a subset of DR)

7
Research Objectives of the Statewide Pricing Pilot
• Estimate changes in energy usage (kwh) and demand (kW) resulting from different forms of time differentiated rates.
• Estimate price elasticities based on these results and examine how they vary by weather, customer characteristics and base usage
• Estimate customer preferences for dynamic and current rate forms and features
• Evaluate effectiveness of marketing and information materials distributed during the pilot.

8
SPP Sample Design
• 2400 customers selected via random sample with requirement to sign up: 1600 participants and 800 controls
• Stratified by Residential (SF,MF) small commercial ( less than 20kw and 21kw to 200kW), high and low usage, and four climate zones
• Relatively low drop out rate (5%) after signing up for tariff; roughly 50% of those contacted chose to remain on rate

9
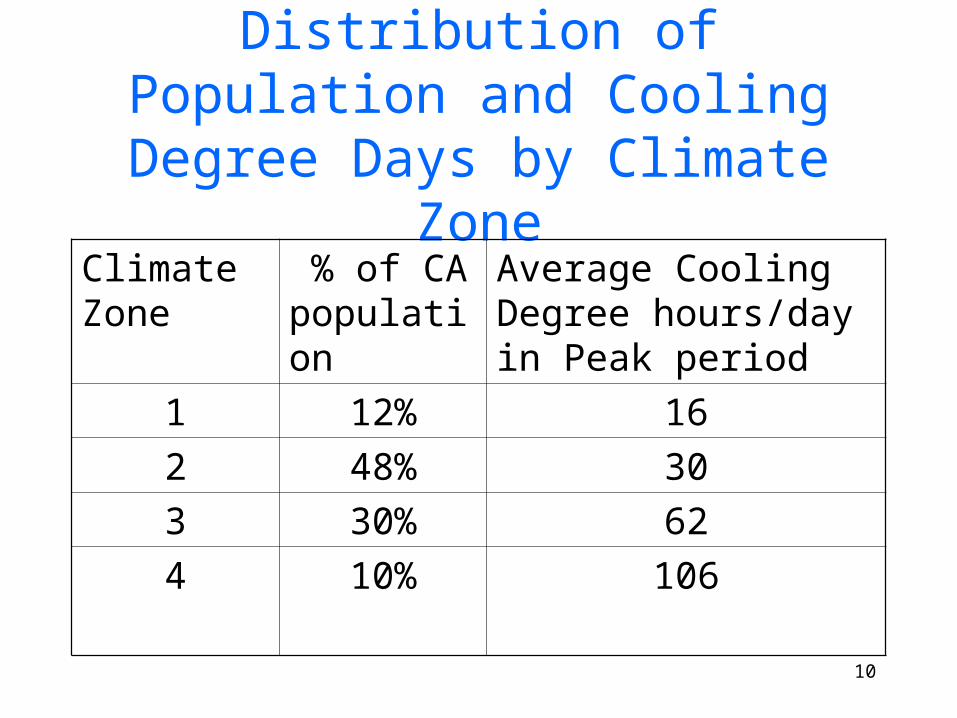
SPP climate zones vary from cool Zone 1 to very warm Zone 4
Source: CRA presentation, May 22 in Chicago Pricing conference
10
Distribution of Population and Cooling Degree Days by Climate
ZoneClimate Zone
% of CA population
Average Cooling Degree hours/day in Peak period
1 12% 16
2 48% 30
3 30% 62
4 10% 106
11
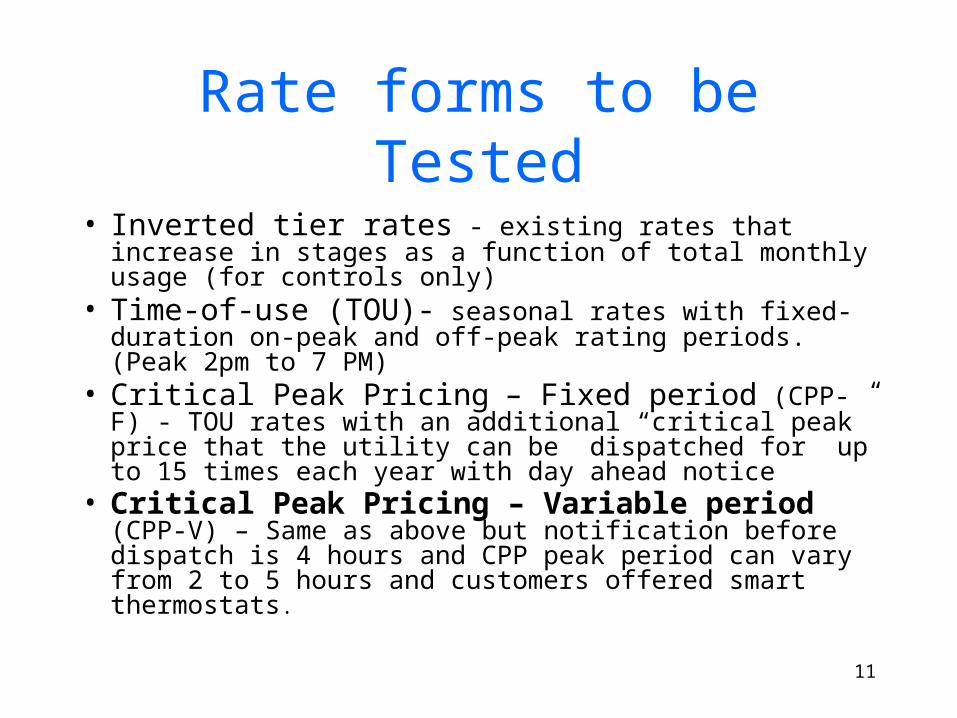
Rate forms to be Tested
• Inverted tier rates - existing rates that increase in stages as a function of total monthly usage (for controls only)
• Time-of-use (TOU)- seasonal rates with fixed-duration on-peak and off-peak rating periods. (Peak 2pm to 7 PM)
• Critical Peak Pricing – Fixed period (CPP-F) - TOU rates with an additional “critical peak” price that the utility can be dispatched for up to 15 times each year with day ahead notice
• Critical Peak Pricing – Variable period (CPP-V) – Same as above but notification before dispatch is 4 hours and CPP peak period can vary from 2 to 5 hours and customers offered smart thermostats.

12
CPP Tariff (high)TOU Tariff (high)
73.4¢
23.4¢
8.9¢
0
10
20
30
40
50
60
70
80
Cen
ts p
er k
Wh
Existing RatesAvg. Summer Price
13.4 ¢/kWh
26.0¢
10.3¢
Peak Off-Peak Peak Off-PeakCritical Peak
1,500 hrs/yr 7,260 hrs/yr
75 hrs/yr
1,425 hrs/yr 7,260 hrs/yr
SPP Experimental Rate Forms (Summer)Residential
Peak = 2:00-7:00pm weekdays; Off-Peak = all other hours
Critical Peak is dispatched from 2:00 to 7:00, 15 days per year

13
Sample CCP-V rates for Small C&I customers (0-199kW)
106.0
20.0
9.5
80.4
25.6
16.9
81.6
18.7
8.6
62.5
21.113.7
0
20
40
60
80
100
120
ce
nts
/kW
h
LT20-High Ratio LT20-Low Ratio GT20-High Ratio GT20-Low Ratio
Price For Typical C&I Customer On CPP-V Rate(Weighted Average For Treatment Customers)
CPP Period Peak Period Off-Peak Period
Control Group Average Price 15.3 cents/kWh
Control Group Average Price 18.3 cents/kWh

14
Customer Experience during the First 3 months of the Pilot
• Next slides will highlight results from a 120 question survey given to a sample of 390 participants

15
Customer Perceptions of the New Rates and Bill Formats
Did Customers like their new dynamic rate forms and if so Why?
Yes, usually to save money ( See slides 16 and 17)
What was the primary reason customers joined the pilot?
Most joined to save money or get better control of their energy use A majority report their expectations were met
Did customers report taking action( s) in response to higher prices? Was it easy to adapt and are the changes permanent?
Yes, 85% of participants report taking at least one action and 30 report multiple actions (2 or 3) ; Yes Easy to adapt (see sld 18)
Should the new rates be offered to all customers in their sector?
60% say definitely and 25-30% say probably. Slightly lower for commercial customers (slide 19)

16
Most residential participants on either TOU or CPP rates say that, given a choice, they would prefer to
continue with the new pricing plan
Total
TOU
CPP-F
CPP-V
Total
TOU
CPP-F
CPP-V
ContinueNew Plan
Return toPrevious
Rate
Why?
I’m saving money 58%
I like it 12%
Saving energy 10%
Can control/managemy energy use 7%
Why Not?
Need more time 58%
Too much hassle 22%
Note: No statistically significant difference exists across programs (Chi square = 1.52, p=.465)
Source: Momentum Market Intelligence: End of Summer Report February 2004

17
SPP Customer Rate Preferences
Original Inverted Tier Rate
New Time-Varying Rate
Res
iden
tialCPP-V
CPP-F
TOU
80%
81%
Co
mm
erci
al
CPP-V
TOU
20406080 20 40 60 80
30%
29%
Source: SPP End-of-Summer Survey Report, Momentum Market Intelligence, WG3 Report, January 21, 2004, p23-24.
Customer PreferencesS
PP
R
esu
lts
Percent that Prefer 0
20%
23%
19%
70%
71%
77%

18
% Easy (1-5) % Permanent
Shift laundry* 73% 93%
Use appliances less * 82% 88%
Turn off lights * 83% 92%
Decrease peak use (general) * 66% 78%
Turn AC off/use less * 69% 86%
Shifted dishwasher use * 89% 93%
Reduce laundry water temperature * 82% 100%
Shift pool/spa pump/filter use * 94% 95%
Made improvements to home EE * 48% 83%
Turn up AC temperature * 73% 74%
Ease and Persistence of Reported Changes in Electricity Use During the Pilot By
Residential Participants

19
Q95: In your opinion, should the new program be offered to other residential customers in California? Please tell me if the new program should definitely not be offered, probably should not be offered, probably should be offered, or definitely should be offered to other customers./ Q96: Why do you feel that way?
SPP Participants report that the new rates should be offered to all residential customers
Total
TOU
CPP-F
CPP-V
Info Only
Total
TOU
CPP-F
CPP-V
Info Only
Definitely
Probably
Why do you feel that way?
You save energy 19%
You save money 17%
It’s good/we like it 15%
It makes people aware of energy conservation 13%
Everyone should have achance to participate 12%
You can be in control/ manage your energy use
5%

20
-24.2-38.8-14--28.0CPP - Variable
-12 to --22-2.3—9.5CPP – Fixed
0 to-16.00 to-16.0Time-of-Use
CPP DaysNon-CPP
DaysRate Form
-49.4-1.4
-19.5-0.2
-23.5-0.3
PercentkWh
`Change in Coincident
Peak Demand
Percent Change in Peak Consumption
2 pm- 7 pm
Preliminary SPP Impacts on Peak Consumption and Coincident Peak
Demand- Residential Customers
Source: Statewide Pricing Pilot, Summer 2003 Impact Analysis, Charles Rivers Associates, January 16, 2004, Tables 1-1 and 1-2. and CRA updated analysis presented on June 8,2004 in Sacramento.
5.25
Conservation and Peak Load
ImpactsSP
P
Re
su
lts
CPP days= 8-12 hot days per summer when high prices are dispatched

21
Peak period impacts are larger in the hotter climate zones than in the cooler zones
Residential customersPercent Change In Energy Use By Rate Period
For Average Experimental Prices On CPP Days
-20.8
-12
4.32.2
4.4
-24
-7.1
0.3
9.55.3
-30
-25
-20
-15
-10
-5
0
5
10
15
Zone 1 Zone 2 Zone 3 Zone 4 All
% C
ha
ng
e In
kW
h
Peak Period Off-Peak Period
Source: Charles River Associates, Summer 2003 Impact Evaluation: June 9, 2004

22
Own-price elasticities of demand for the CPP-F rate vary across climate zones
Preliminary Elasticity Estimates Summer 2003
Climate Zone Peak Period Off-Peak Period
Zone 1(cool)
-0.05* -0.21
Zone 2(mild)
-0.09 -0.16
Zone 3(hot)
-0.14 +0.03*
Zone 4(hottest)
-0.24 -0.14*
All ZoneAverage
-0.12 -0.11
*Not statistically significant at the 95% confidence level: Source CRA May 21 estimates presented in Chicago.

23
Small Customer Load Impacts
• Tend to be strong and significant for customers with less than 20kW load
• Analysts still in disagreement on the findings for the greater than 20kW small Com. sample;– Own price elasticities was -.15 while elasticity of
substitution for peak price was +.05.
– Some say population is too heterogeneous and sample size too small to make conclusions. N=76

24
CPP-V rates coupled with Smart Thermostats Produce the largest peak reductions
• Reductions ranged from 28% on “cool” summer days to 55% on hottest summer days ; 1.4 kw peak/hh
• Elasticities INCREASE as a function of weather- Range reported from -.06 to -.44, average -.22;
• Automatic controls really do mater

25
Sample CPP-V rates for Small Commercial customers compared to current rates
106.0
20.0
9.5
80.4
25.6
16.9
81.6
18.7
8.6
62.5
21.113.7
0
20
40
60
80
100
120
ce
nts
/kW
h
LT20-High Ratio LT20-Low Ratio GT20-High Ratio GT20-Low Ratio
Price For Typical C&I Customer On CPP-V Rate(Weighted Average For Treatment Customers)
CPP Period Peak Period Off-Peak Period
Control Group Average Price 15.3 cents/kWh
Control Group Average Price 18.3 cents/kWh

26
NANA>20kW CPP-V
24.72.3<20kW -CPP-V
CPP DaysNon-CPP
DaysRate Form
NANA
-NANA
PercentkWh
`Change in Coincident
Peak Demand
Percent Change in Peak Consumption
2 pm- 7 pm
Preliminary SPP Impacts on Peak Consumption and Coincident Peak
Demand- Small C&I customers
Source: Statewide Pricing Pilot, Summer 2003 Impact Analysis, Charles Rivers Associates, June 9, 2004 slides 25 and 26( Presentation at the California Energy Commission. And subsequent memos on variation by characteristics
5.25
Conservation and Peak Load
ImpactsSP
P
Re
su
lts
CPP days= 9 hot days per summer when high prices are dispatched for 2 to 5 hours
NA= Not yet available, analysis in progress

27
On CPP days, LT20 customers show higher impacts than GT20 customers, but they also faced higher CPP prices
Percent Change In Energy Use By Rate Period For Average Experimental Prices On CPP Days
(Based on Log-Log Model)
-26
7 5.7
-9.1-13.3
-33.1
2.1 3.8
-40-35-30-25-20-15-10-505
10
LT20 kW Separate Dispatch
GT20 kW Separate Dispatch
LT20 kW Common Dispatch
GT20 kW Common Dispatch
% C
ha
ng
e In
kW
h
Peak Period Off-Peak Period
Estimates for the CPP-V tariff may not represent the impacts of the general population of customers
Source CRA presentation; June 9th, 2004, Sacramento, CA.

28
1. System Impacts
CPP rates can, within five years of deployment, reduce California’s residential peak load by 2,000 MW.
Peak Load Impacts
Net Present Value of Savings from Residential dynamic rate deployment ranged from $.5 billion to $2.3 billion in simulations.
Procurement Impacts
Observed short-run own-price demand elasticities are consistent with 25 years of historical findings in California and elsewhere.
Demand Elasticities
SPP Results
Confidence Further Testing
Hi
Med Lo
None
Useful Essential
None
Useful Essential
Hi
Med Lo
None
Useful Essential
Hi
Med Lo

29
Four Scenarios were created to Investigate the Impacts of Different
Dynamic Rate offerings in CA.
• Dr Faruqui of Charles River Associates (CRA) used preliminary data on price responsiveness for residential customer class and a set of assumptions about customer rate preference.
• CRA then estimated both a base case and probability estimates for each scenario using Monte Carlo simulations

30
The four Scenarios represent a variety of deployment and opt-out/opt-in scenarios
Rate Deployment Opt-Out Rate
Opt-In Rate
Pure CPP 75
Universal (95%)
20% N/A
CPP-F 75 and 2.5
Universal (95%)
20% N/A
TOU 1.5 Mandatory N/A N/A
TOU 2.5 Optional N/A 20% in five years

31
The pure CPP rate will reduce the state’s residential peak load by 2,000 MW in the
year 2007 with a probability of 95%Avoided MW
All Zones
0.000.100.200.300.400.500.600.700.800.901.001.10
1,758 2,058 2,358 2,658 2,958
MW
Pro
bab
ilit
y
2007 2012
Source: CRA , Simulating load impacts of dynamic rates, CEC workshop: March 22, 2004:

32
Own-Price Elasticities
California SPP vs. Nationwide Historical Results
1980 1985 1990 1995 2000 2005
-0.5
0.0
-0.1
-0.2
-0.3
-0.4
-0.6
-0.7
-0.8
-0.9
California 2003 SPP CPP-F Critical Peak Days
Nationwide Historical Results
Average = -0.30
Source: Predicting California Demand Response, Chris King and Sanjoy Chatterjee, Public Utilities Fortnightly, July 1, 2003, p.27-32.
5.3
Demand ElasticitiesS
PP
R
es
ult
s

33
Customers understood time-differentiated pricing better than they understood tiered rates
1. Most customers resist new rates when they are uncertain of bill impacts- (shadow bills )
2. 80% of residential and 70% of commercial participants preferred the experimental rates to their old rates
70-75% of participants received lower bills under the new rates
2. Customer Impacts
Confidence Further Testing
Hi
Med Lo
None
Useful Essential
None
Useful Essential
Hi
Med Lo
None
Useful Essential
Hi
Med Lo
Customer Understanding
Customer Preferences
Bill Impacts
SPP Results
Hi
Med Lo
None
Useful Essential
34
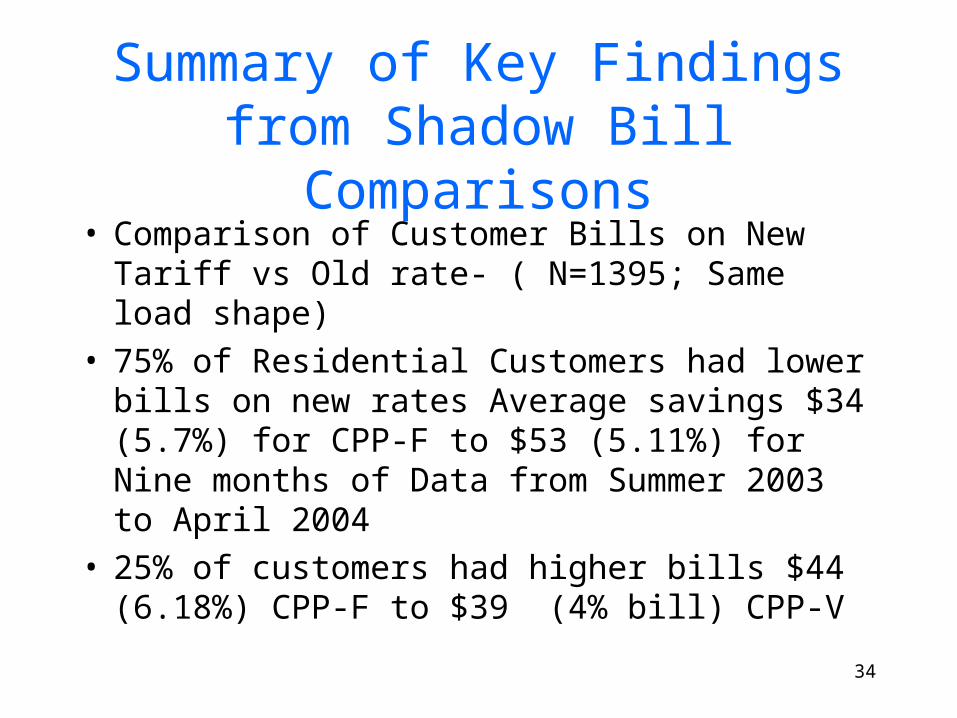
Summary of Key Findings from Shadow Bill Comparisons
• Comparison of Customer Bills on New Tariff vs Old rate- ( N=1395; Same load shape)
• 75% of Residential Customers had lower bills on new rates Average savings $34 (5.7%) for CPP-F to $53 (5.11%) for Nine months of Data from Summer 2003 to April 2004
• 25% of customers had higher bills $44 (6.18%) CPP-F to $39 (4% bill) CPP-V

35
Costs and Benefits of AMI Deployment In Process
Business Case
Major Issues
Next Steps
The utilities will each submit a business case for advanced metering infrastructure (AMI) that will include costs and benefits to the utility, customers and society
Meter Deployment: Full vs. Partial
Implementation: Utility vs. Outsource
Meter Cost allocation: Fixed vs. Volumetric
Oct’04 – IOU’s file preliminary business cases
Dec’04 – Revisions based on 2004 SPP results
Mar’05 – CPUC/CEC decision on AMI

36
Infrastructure System CostS
PP
Is
su
e
Perspective- Industry Experience worldwidePerspective- Industry Experience worldwide
Advanced Metering – Types of System Benefits
Standards and Construction
Collections
Field Work Management
Safety
Load Forecasting
Meter Management
Demand Response
Vegetation Management
Outage and Restoration
Tariff and Regulatory
Asset Management
Billing and Customer Care
System Control
Settlement
0
Reported Percentage Reduction in System Costs by Type
5 10 15 20 25
Source: “Distribution Technology Roadmap”, Report for the Canadian Electrical Association & Consortium, by Cap Gemini Ernst & Young, U.S. LLC, 2003.
7.15

37
Cost AllocationS
PP
Is
su
e
Advanced Metering - Cost Allocation
PROBLEMPROBLEMFixed meter charges disproportionately impact low use customer bills.
SOLUTIONSOLUTION kWh based volumetric cost allocation method.
Total Cost Per Residential Meter
Option #1.
Fixed Charge
$ / Meter / Month
Option #2.
Volumetric Charge
$ / Meter / Month
$85 - $265 $1.05 - $2.25
Monthly Usage Monthly Charge
0 - 300 kWh $0.33
301 - 500 kWh $0.56
501 – 1,000 kWh $1.12
> 1,000 kWh $1.67
7.2

38
SPP Conclusions
1. Results to date are supportive of the California Vision for Demand Response : Give customers rate choices that reflect real costs.
2. Customers understood and responded favorably to Critical Peak pricing rates. These rates are favored over current tariffs!
3. Customers on CPP rates, particularly those with control technologies, showed higher percentage reduction than those on TOU or inverted tier rate forms. ( however these customers self selected into program)
4. Between 60% and 80% of residential pilot customers received a lower energy bill under the experimental time differentiated tariffs.
5. Preliminary estimates indicate that dynamic rates in the California residential sector alone could produce peak demand reductions of up to 2,000 MW or more. (Key uncertainties include predictions of customer rate choices and persistence of peak reductions.)
6. Costs justification for advanced metering to be determined…

39
Challenges Going Forward
1. The 2004 summer’s SPP results will be crucial in confirming the benefits/costs of various meter rollout strategies based on summer 2003
2. If the State moves forward with AMI, default rates for residential customers should be changed to time-varying rates: either TOU or CPP
3. It will be important to understand how price responsiveness varies by energy use segments. Initial findings suggest higher proportionate impact as usage increases until last quintile of usage.
4. California has a great track record in encouraging Network Innovations: Pony Express, Interstate Railroads, the Internet: Next Step: Advanced Electricity Metering

40
Next Steps- Facilitating Introduction of Smart thermostat controls
• Vision- it will be important to make it easy for residential customers to purchase some form of demand responsive thermostats if they choose to be put on a CPP-V rate (e.g. high prices with a few hours notice) in 2006 and beyond
• CEC plans to conduct a workshop to ask manufacturers of meters and controls what steps would be necessary to ensure their product can communicate with new metering systems and respond to critical peak rates.
• Options for action may include: development of a common communication protocol via private meetings, appliance standards, building standards or as part of the CEC’s load management standards

41
Want More Information?
• Visit the CEC demand response website and download papers on evaluation results from SPP contractors and CEC staff (http://www.energy.ca.gov/demandresponse/index.html)
• Contact Mike Messenger at 916-654-4774 Or email at [email protected]• Visit the Peak load management alliance website for
information on advanced metering projects in other states. http://www.peaklma.com/i4a/pages/index.cfm?pageid=1

42
A Perspective on Change
• It must be remembered that there is nothing more difficult to plan, more doubtful of success, nor more dangerous to manage than the creation of a new system. For the initiator of change has the enmity of all who would profit by the preservation of the old institutions and merely lukewarm defenders in those who would gain in the new one.” Who said this??