1 Company Analysis Chapter 15 Jones, Investments: Analysis and Management.
24
1 Company Analysis Chapter 15 Jones, Investments: Analysis and Management
-
Upload
cassandra-oneal -
Category
Documents
-
view
229 -
download
1
Transcript of 1 Company Analysis Chapter 15 Jones, Investments: Analysis and Management.

1
Company AnalysisCompany Analysis
Chapter 15Jones, Investments:
Analysis and Management

2
Fundamental Analysis
Fundamental Analysis
Last step in top-down approach is company analysis
Goal: estimate share’s intrinsic value– Constant growth version of dividend
discount model
– Value justified by fundamentals
g-kD
P value Intrinsic 10

3
Fundamental Analysis
Fundamental Analysis
Earnings multiple could also be usedP0=estimated EPS justified P/E ratio
Stock is under- (over-) valued if intrinsic value is larger (smaller) than current market price
Focus on earnings and P/E ratio– Dividends paid from earnings– Close correlation between earnings and
stock price changes

4
Accounting Aspects of Earnings
Accounting Aspects of Earnings
How is EPS derived and what does EPS represent?
Financial statements provide majority of financial information about firms
Analysis implies comparison over time or with other firms in the same industry
Focus on how statements used, not made

5
Basic Financial Statements
Basic Financial Statements
Balance Sheet– Items listed in order of liquidity or
in order of payment– Assets
»Cash vs. non-cash assets– Non-cash assets may be worth more or
less than carried on books
»Depreciation methods for fixed assets» Inventory evaluation choices

6
Basic Financial Statements
Basic Financial Statements
Balance Sheet– Liabilities
»Fixed claims against the firm
– Equity»Residual»Adjusts when the value of assets
change»Linked to Income Statement
– Picture at one point in time

7
Income Statement
Sales or revenues- Product costs
Gross profit- Period Costs
EBIT- Interest
EBT
EBT- Taxes
Net Income available to owners
- DividendsAddition to Retained Earnings
EPS and DPS
Basic Financial Statements
Basic Financial Statements

8
The Financial Statements
The Financial Statements
Earnings per shareEPS =Net Income/average number of
shares outstanding– Net Income before adjustments in
accounting treatment or one-time events Certifying statements
– Auditors do not guarantee the accuracy of earnings but only that statements are fair financial representation

9
Problems with Reported Earnings
Problems with Reported Earnings
EPS for a company is not a precise figure that is readily comparable over time or between companies– Alternative accounting treatments
used to prepare statements– Difficult to gauge the ‘true’
performance of a company with any one method
– Investors must be aware of these problems

Current Problem Areas In GAAPs
Current Problem Areas In GAAPs
Many of the best assets today are intangible, as opposed to yesterday’s plant and equipment
Research and development may be substantial and are not reflected in balance sheet
Mergers and Acquisitions can cause confusion 10

11
Analyzing a Company’s Profitability
Analyzing a Company’s Profitability
Important to determine whether a company’s profitability is increasing or decreasing and why
Return on equity (ROE) emphasized because is key component in finding earnings and dividend growth
EPS =ROE Book value per share
12
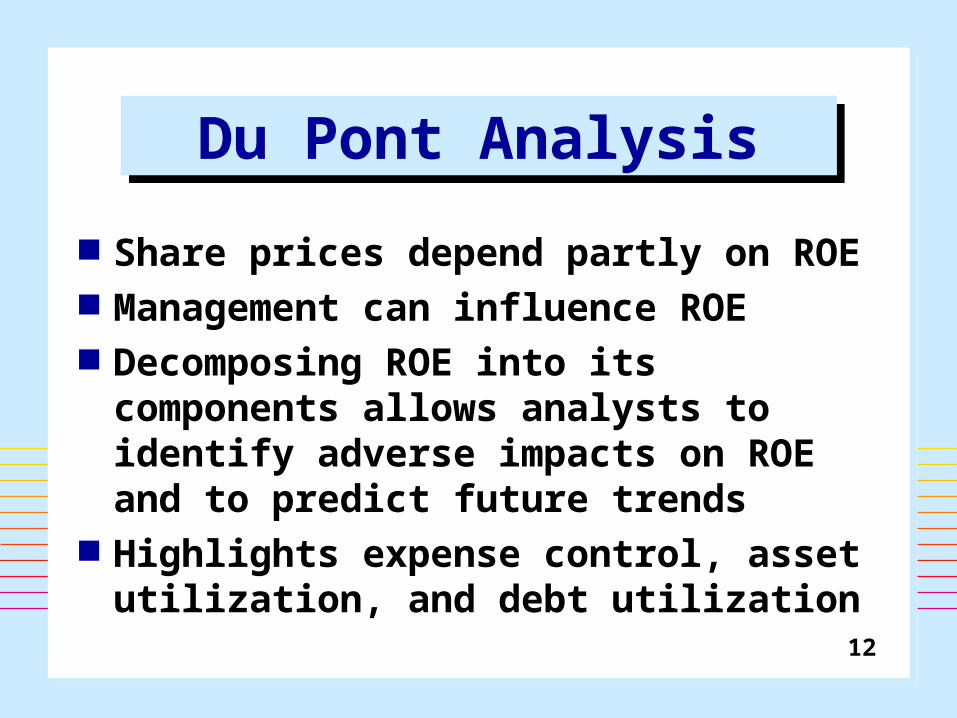
Share prices depend partly on ROE Management can influence ROE Decomposing ROE into its
components allows analysts to identify adverse impacts on ROE and to predict future trends
Highlights expense control, asset utilization, and debt utilization
Du Pont AnalysisDu Pont Analysis
13
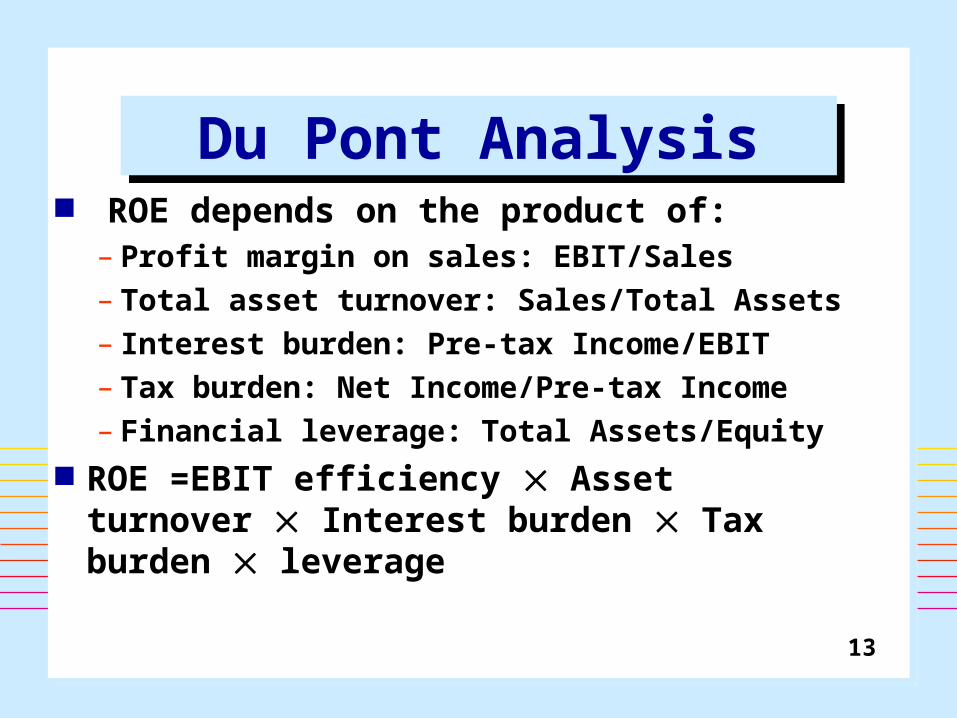
ROE depends on the product of:– Profit margin on sales: EBIT/Sales– Total asset turnover: Sales/Total Assets– Interest burden: Pre-tax Income/EBIT– Tax burden: Net Income/Pre-tax Income– Financial leverage: Total Assets/Equity
ROE =EBIT efficiency Asset turnover Interest burden Tax burden leverage
Du Pont AnalysisDu Pont Analysis
14
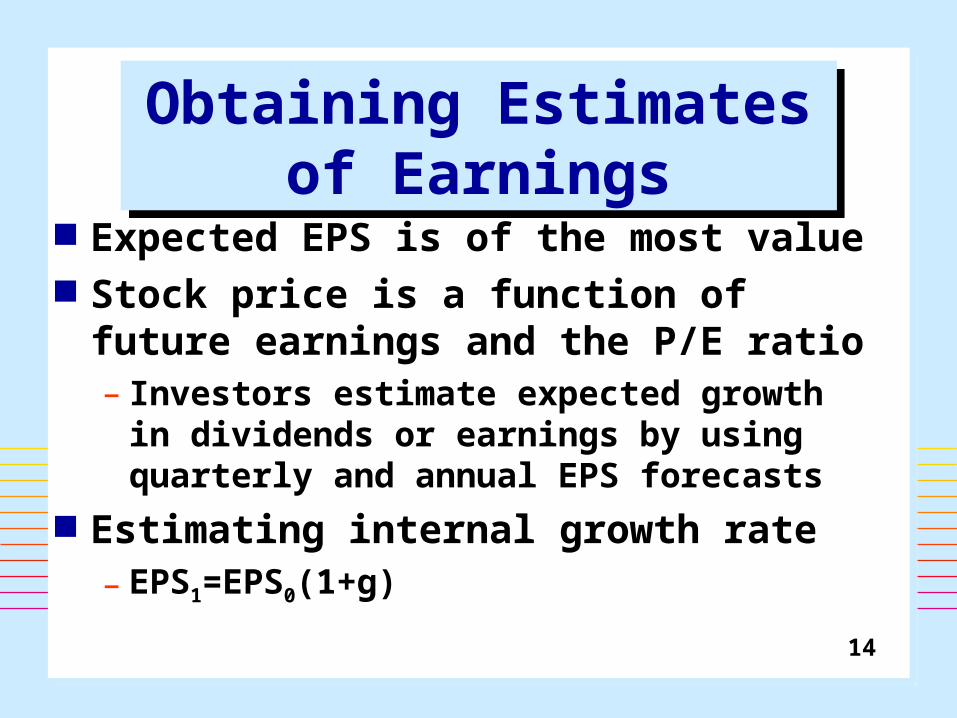
Obtaining Estimates of Earnings
Obtaining Estimates of Earnings
Expected EPS is of the most value Stock price is a function of future
earnings and the P/E ratio– Investors estimate expected growth
in dividends or earnings by using quarterly and annual EPS forecasts
Estimating internal growth rate– EPS1=EPS0(1+g)
15
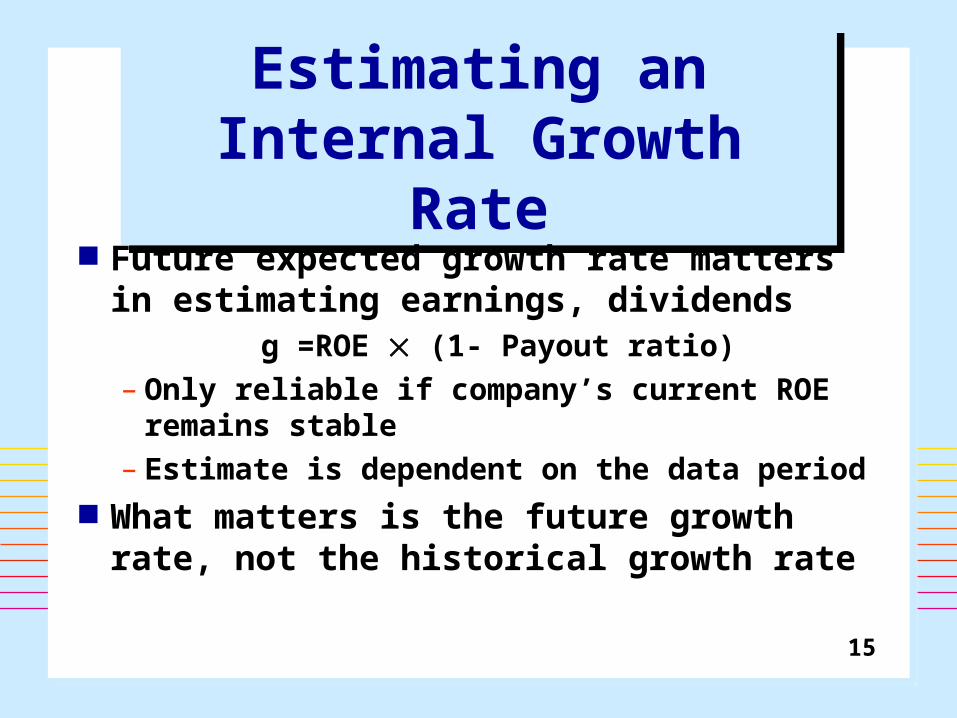
Estimating an Internal Growth Rate
Estimating an Internal Growth Rate
Future expected growth rate matters in estimating earnings, dividends
g =ROE (1- Payout ratio)– Only reliable if company’s current ROE
remains stable– Estimate is dependent on the data
period What matters is the future growth
rate, not the historical growth rate
16
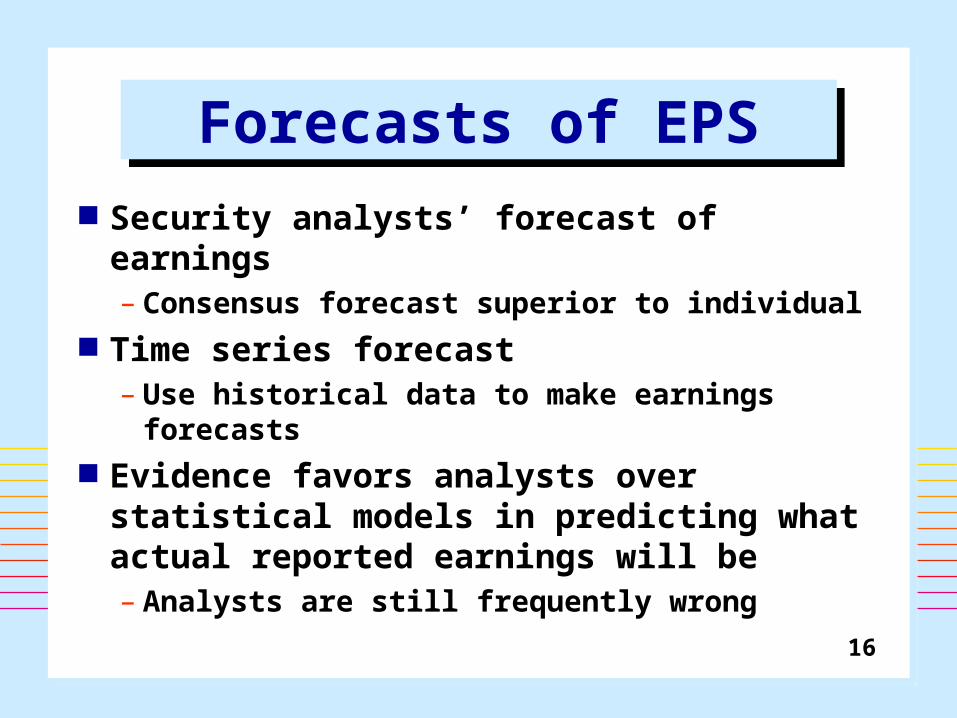
Forecasts of EPSForecasts of EPS Security analysts’ forecast of earnings
– Consensus forecast superior to individual Time series forecast
– Use historical data to make earnings forecasts
Evidence favors analysts over statistical models in predicting what actual reported earnings will be– Analysts are still frequently wrong

17
Earnings SurprisesEarnings Surprises
What is the role of expectations in selecting stocks?– Old information will be incorporated
into stock prices if market is efficient– Unexpected information implies
revision Stock prices affected by
– Level and growth in earnings– Market’s expectation of earnings

18
Using Earnings Estimates
Using Earnings Estimates
The surprise element in earnings reports is what really matters
There is a lag in adjustment of stock prices to earnings surprises
One earnings surprise leads to another– Watch revisions in analyst estimates
Stocks with revisions of 5% or more -up or down - often show above or below-average performance

19
The P/E RatioThe P/E Ratio Measures how much investors
currently are willing to pay per dollar of earnings– Summary evaluation of firm’s prospects– A relative price measure of a stock
A function of expected dividend payout ratio, required rate of return, expected growth rate in dividends
g)k/()/E(DP/E 11

20
Dividend Payout Ratio
Dividend Payout Ratio
Dividend levels usually maintained– Decreased only if no other alternative– Not increased unless can be supported– Adjust with a lag to earnings
In theory, the higher the expected payout ratio, the higher the P/E ratio– However, growth rate will probably
decline, adversely affecting the P/E ratio

21
Required Rate of Return
Required Rate of Return
A function of riskless rate and risk premium
k =RF +RP Constant growth version of
dividend discount model can be rearranged so that
k =(D1/P0) +g
– Growth forecasts are readily available
22
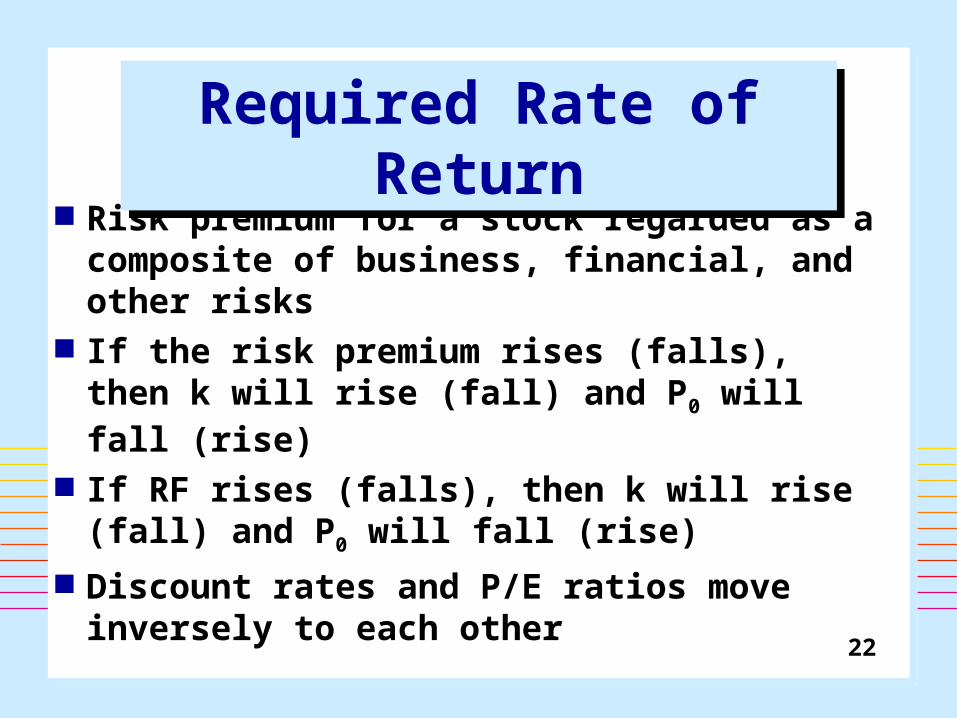
Risk premium for a stock regarded as a composite of business, financial, and other risks
If the risk premium rises (falls), then k will rise (fall) and P0 will fall (rise)
If RF rises (falls), then k will rise (fall) and P0 will fall (rise)
Discount rates and P/E ratios move inversely to each other
Required Rate of Return
Required Rate of Return

23
Expected Growth Rate
Expected Growth Rate
Function of return on equity and the retention rate
g =ROE (1- Payout ratio)– The higher the g, the higher the P/E
ratio P/E ratio depends on
– Confidence that investors have in expected growth
– Reasons for earnings growth

24
Fundamental Security Analysis in
Practice
Fundamental Security Analysis in
Practice Regardless of detail and
complexity, analysts and investors seek an estimate of earnings and a justified P/E ratio to determine intrinsic value
Security analysis always involves predicting an uncertain future and mistakes will be made and outlooks will differ