1 Chapter 12 – The Financing Mix Key Sections: Business and Financial Risk Operating, financial...
21
1 Chapter 12 – The Financing Mix • Key Sections: • Business and Financial Risk • Operating, financial and combined leverage • Capital structure and financial structure • Saucer-shaped cost of capital curve • Management practices
-
date post
21-Dec-2015 -
Category
Documents
-
view
217 -
download
2
Transcript of 1 Chapter 12 – The Financing Mix Key Sections: Business and Financial Risk Operating, financial...

1
Chapter 12 – The Financing Mix
• Key Sections:
• Business and Financial Risk
• Operating, financial and combined leverage
• Capital structure and financial structure
• Saucer-shaped cost of capital curve
• Management practices

2
Risk
• Variability in revenue or income streams• Business risk affects EBIT
– Results from investment decisions (cost structure, competition, price elasticity, etc)
• Financial risk – use of fixed rate financing sources
• Variation in net income is due to both business and financial risk

3
Sources of Risk
• Risk results from the presence of fixed costs– Fixed operating and financing costs– If present, what happens to EBIT and EPS if
sales change?– EBIT will change more than sales change with
fixed operating costs– Changes in EPS will be even greater than the
change in EBIT if fixed-rate financing used

4
Breakeven Analysis
• Find amount of sales to produce EBIT of zero– Variable or direct costs vary as output
changes but are fixed per unit – Example: raw material costs
• Fixed costs do not vary as sales change– Example: depreciation
• Semi variable (over a range of output)

5
Contribution Margin
Per unit sales price $12
Variable cost per unit -7
Unit contribution margin 5
• Unit sales price less unit variable cost equals contribution margin (left over to cover fixed costs)

6
Percentage Change
• Percentage change = New Value less Old
Old Value
• Increase from 100 to 200 = 100% increase(200 – 100) / 100 = 100%
• Decrease from 200 to 100 = 50% decrease(100 - 200) / 200 = -.5 = -50%

7
Leverage
• In finance – presence of fixed operating costs and/or fixed financing costs cause sale changes to have a magnified impact on EBIT and EPS
• Degree of Operating Leverage (DOL) =• % change in EBIT divided by sales
change– Pierce +120% in EBIT/ +20% sales = 6 times
8
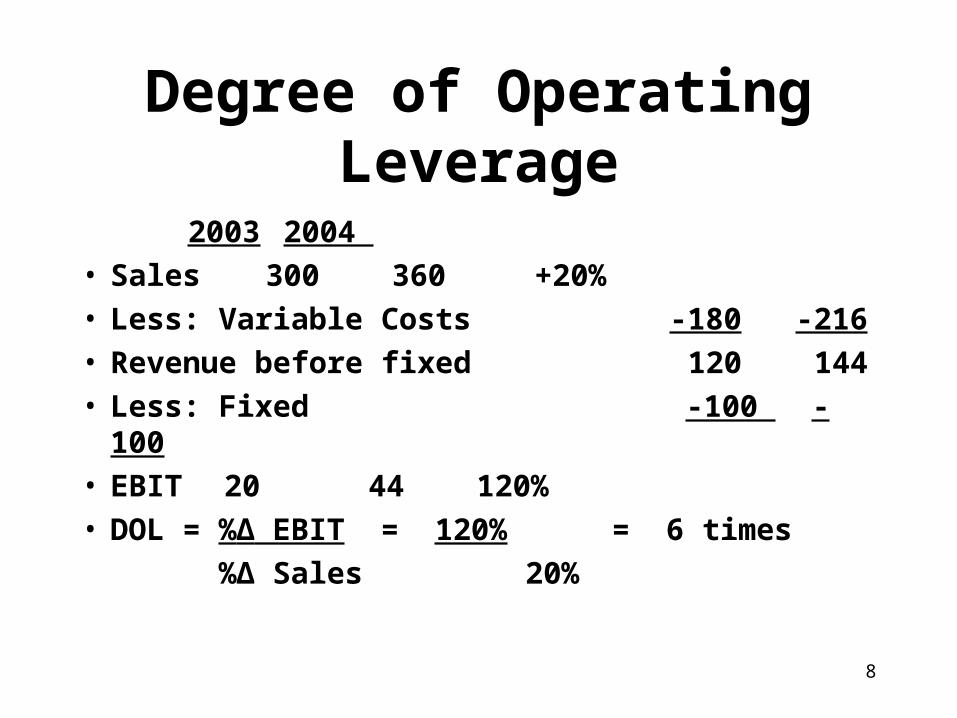
Degree of Operating Leverage
2003 2004 • Sales 300 360 +20%• Less: Variable Costs -180 -216• Revenue before fixed 120 144• Less: Fixed -100 -100• EBIT 20 44 120%• DOL = %Δ EBIT = 120% = 6 times
%Δ Sales 20%

9
Implications of DOL
• With DOL of 6 times, if sales increase 20%, EBIT will change by 120% (because the fixed costs don’t change)
• If sales fall 20% EBIT will decline 120% resulting in a $4,000 operating loss
• DOL falls as sales increase because fixed costs are spread over more units

10
Financial Leverage
• Financing a portion of the assets with fixed-rate financing (bonds, preferred stock)
• Degree of Financial Leverage = % change in EPS/ % change in EBIT, say 1.25 times
• Shows responsiveness of EPS to changes in EBIT
• Can have positive or negative effects but with greater leverage, greater changes occur

11
Degree of Financial Leverage DFL
2003 2004
EBIT 20 44 +120%
Less: Interest -4 -4
Before tax 16 40
Tax @ 50% -8 -20
Net Income 8 20 +150%
DFL = %Δ Net Inc = 150% = 1.25 times
%Δ EBIT 120%
12
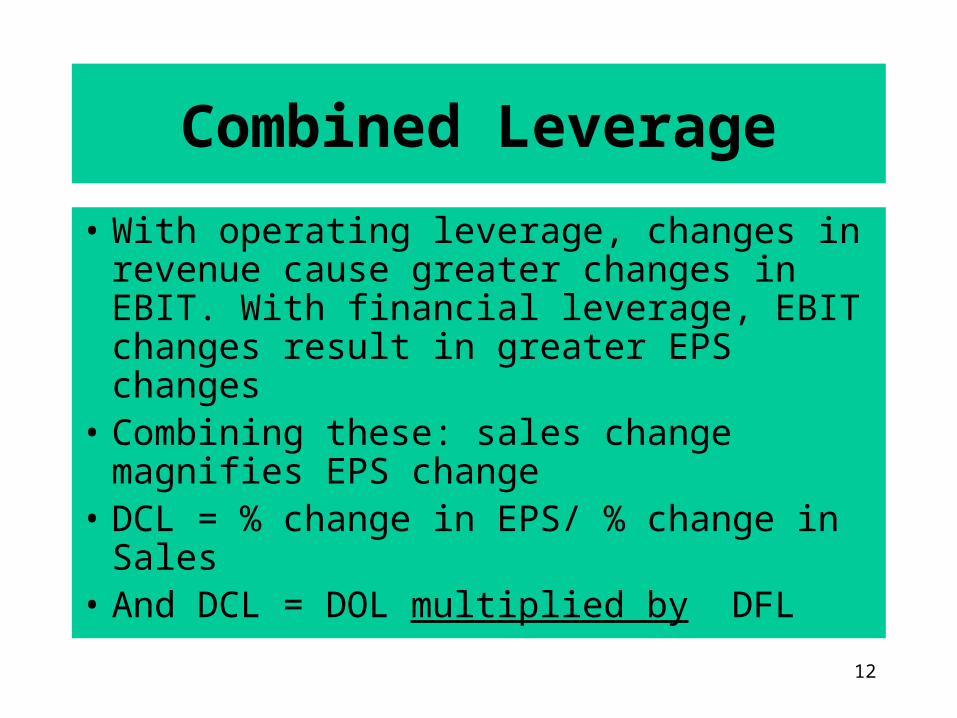
Combined Leverage
• With operating leverage, changes in revenue cause greater changes in EBIT. With financial leverage, EBIT changes result in greater EPS changes
• Combining these: sales change magnifies EPS change
• DCL = % change in EPS/ % change in Sales• And DCL = DOL multiplied by DFL

13
Combined Leverage
2003 2004
Sales 300 360 +20%
Net Income 8 20 +150%
DCL = %Δ Net Inc. = 150% = 7.50 times
%Δ Sales 20
Also = DOL * DFL = 6 X * 1.25X = 7.50 X
14
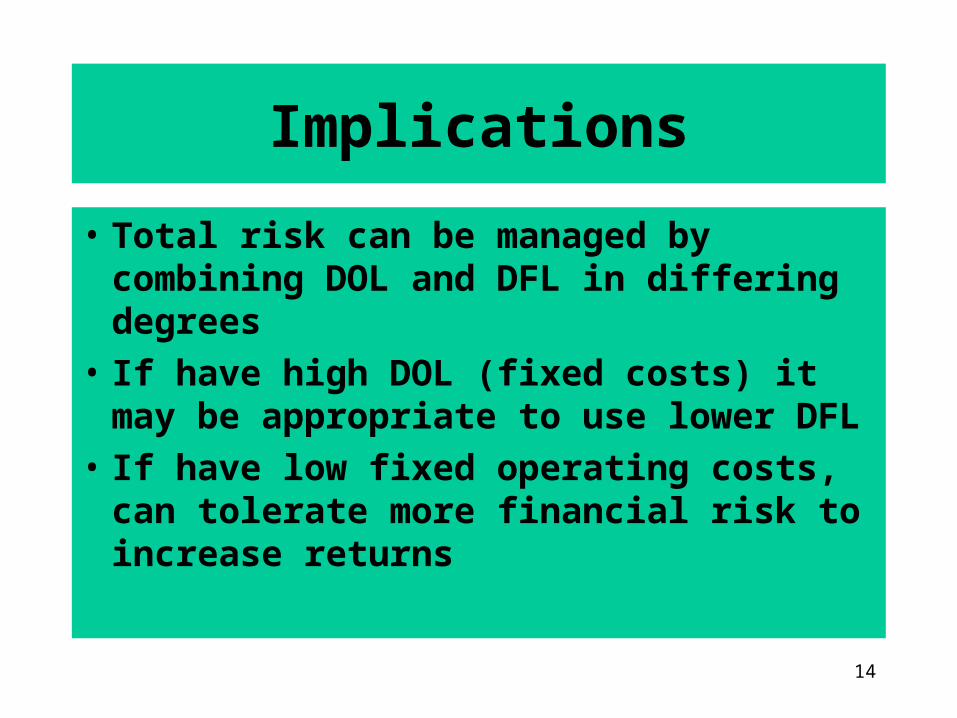
Implications
• Total risk can be managed by combining DOL and DFL in differing degrees
• If have high DOL (fixed costs) it may be appropriate to use lower DFL
• If have low fixed operating costs, can tolerate more financial risk to increase returns
15
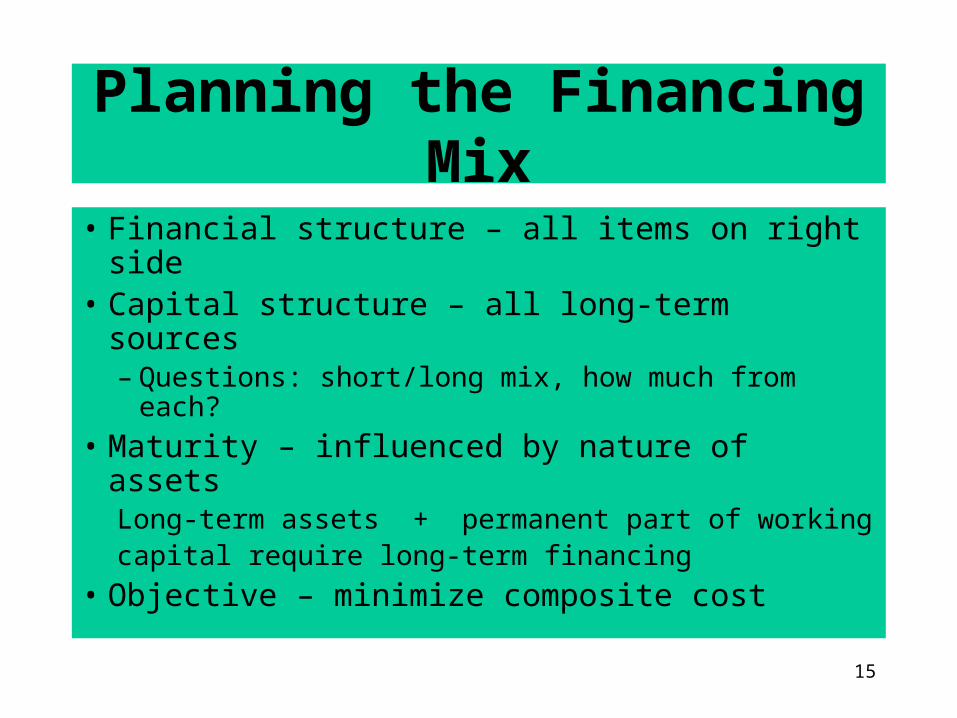
Planning the Financing Mix
• Financial structure – all items on right side• Capital structure – all long-term sources
– Questions: short/long mix, how much from each?
• Maturity – influenced by nature of assetsLong-term assets + permanent part of workingcapital require long-term financing
• Objective – minimize composite cost

16
Capital Structure Theory
• Can we affect cost by changing mix?
• Independence (Modigliani) – “no”– But assumptions may be unrealistic
• Moderate view – more realistic– Considers taxes and bankruptcy risk
• Debt encouraged by tax shield – Causes C of C to fall but only to a point
17
Optimal Capital Structure
• Where Cost of Capital is minimized– Also called debt capacity – point where costs
begin to increase– More debt, likelihood of failure increases– At a point, default risk outweighs tax shield
• Cost curve – declines with added debtMinimum cost points = optimal structure

18
Cost of Capital
0
2
4
6
8
10
12
14
100 90 80 70 60 50 40 30 20
Percent Financed by Equity
Co
st -
%
Optimal Range(Debt Capacity)
60 to 70% Equity

19
Saucer-Shaped Curve (Moderate)
• Before bankruptcy costs become detrimental, the tax shield causes share price to increase/ cost of capital to fall
• Need to find the optimal range of leverage
• Use caution in using fixed-charge capital, especially if there is operating leverage.
20
Summary of Financial Leverage
• Added variability in EPS– More leverage causes large changes
(favorable and unfavorable) in EPS for a given EBIT change.
• EBIT, EPS and Capital Structure– Above some EBIT level, EPS will be higher
with leverage but there is a debt limit
21
Management Practices
• Management sets debt targets based on evaluation of business risk (sales and EBIT variability). Influenced by– Desired bond rating– Having a borrowing reserve– Advantage of leverage
• Unwise to use large amounts of leverage with an uncertain income stream.