Towards Clinically-relevant Standardization of Image Quality
1
1 CHAPTER 1
Clinically Relevant Basics of Pacing and Defi brillation
T. Jared Bunch, David L. Hayes, Paul A. Friedman
Anatomy and physiology of the cardiac conduction system
The cardiac conduction system consists of specialized
tissue involved in the generation and conduction of
electrical impulses throughout the heart. In this book,
we review how device therapy can be optimally utilized
for various forms of conduction system disturbances,
tachyarrhythmias, and for heart failure. Knowledge
of the normal anatomy and physiology of the cardiac
conduction system is critical to understanding appro-
priate utilization of device therapy.
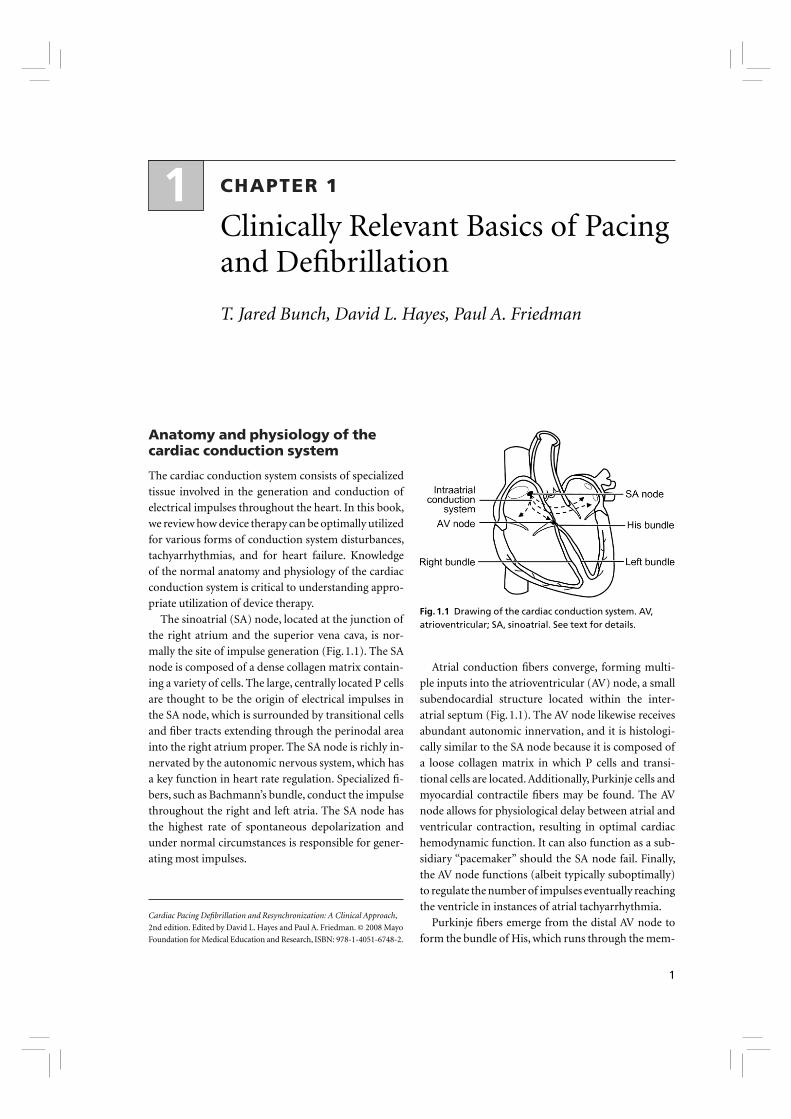
The sinoatrial (SA) node, located at the junction of
the right atrium and the superior vena cava, is nor-
mally the site of impulse generation (Fig. 1.1). The SA
node is composed of a dense collagen matrix contain-
ing a variety of cells. The large, centrally located P cells
are thought to be the origin of electrical impulses in
the SA node, which is surrounded by transitional cells
and fi ber tracts extending through the perinodal area
into the right atrium proper. The SA node is richly in-
nervated by the autonomic nervous system, which has
a key function in heart rate regulation. Specialized fi -
bers, such as Bachmann’s bundle, conduct the impulse
throughout the right and left atria. The SA node has
the highest rate of spontaneous depolarization and
under normal circumstances is responsible for gener-
ating most impulses.
Atrial conduction fi bers converge, forming multi-
ple inputs into the atrioventricular (AV) node, a small
subendocardial structure located within the inter-
atrial septum (Fig. 1.1). The AV node likewise receives
abundant autonomic innervation, and it is histologi-
cally similar to the SA node because it is composed of
a loose collagen matrix in which P cells and transi-
tional cells are located. Additionally, Purkinje cells and
myocardial contractile fi bers may be found. The AV
node allows for physiological delay between atrial and
ventricular contraction, resulting in optimal cardiac
hemo dynamic function. It can also function as a sub-
sidiary “pacemaker” should the SA node fail. Finally,
the AV node functions (albeit typically suboptimally)
to regulate the number of impulses eventually reaching
the ventricle in instances of atrial tachyarrhythmia.
Purkinje fi bers emerge from the distal AV node to
form the bundle of His, which runs through the mem-
Cardiac Pacing Defi brillation and Resynchronization: A Clinical Approach,
2nd edition. Edited by David L. Hayes and Paul A. Friedman. © 2008 Mayo
Foundation for Medical Education and Research, ISBN: 978-1-4051-6748-2.
Fig. 1.1 Drawing of the cardiac conduction system. AV, atrioventricular; SA, sinoatrial. See text for details.

2 Cardiac Pacing, Defi brillation and Resynchronization: A Clinical Approach
branous septum to the crest of the muscular septum,
where it divides into the various bundle branches. The
bundle branch system exhibits signifi cant individual
variation and is invariably complex. The right bundle
is typically a discrete structure running along the right
side of the interventricular septum to the anterior pap-
illary muscle, where it divides. The left bundle is usu-
ally a large band of fi bers fanning out over the left ven-
tricle, sometimes forming functional fascicles. Both
bundles eventually terminate in individual Purkinje
fi bers interdigitating with myocardial contractile fi b-
ers. The His-Purkinje system has little in the way of
autonomic innervation.
Because of their key function and location, the SA
and AV nodes are the most common sites of conduc-
tion system failure; it is therefore understandable that
the most common indications for pacemaker implan-
tation are SA node dysfunction and high-grade AV
block. It should be noted, however, that conduction
system disease is frequently diffuse and may involve
the specialized conduction system at multiple sites.
Although the earliest pacemakers were designed to
treat life-threatening ventricular bradyarrhythmias, in-
dications have drastically expanded to include condi-
tions that do not specifi cally involve intrinsic conduc-
tion system disease. Guidelines have been developed to
provide uniform criteria for device implantation, but
the importance of the patient’s clinical status and any
extenuating circumstances should also be considered.
Electrophysiology of myocardial stimulation
Stimulation of the myocardium by a pacemaker re-
quires the initiation of a self-propagating wave of de-
polarization from the site of initial activation, whether
from a native “pacemaker” or from an artifi cial stimu-
lus. Myocardium exhibits a biological property referred
to as “excitability,” which is a response to a stimulus out
of proportion to the strength of that stimulus.1 Excit-
ability is maintained by separation of chemical charge,
which results in an electrical transmembrane poten-
tial. In cardiac myocytes, this electrochemical gradient
is created by differing intracellular and extracellular
concentrations of sodium (Na+) and potassium (K+)
ions; Na+ ions predominate extracellularly and K+ ions
predominate intracellularly. Although this transmem-
brane gradient is maintained by the high chemical
resistance intrinsic to the lipid bilayer of the cellular
membrane, passive leakage of these ions occurs across
the cellular membrane through ion channels. Pas-
sive leakage is offset by two active transport mecha-
nisms, each transporting three positive charges out
of the myocyte in exchange for two positive charges
that are moved into the myocyte, producing cellular
polarization.2,3 These active transport mechanisms re-
quire energy and are susceptible to disruption when
energy-generating processes are interrupted.
The chemical gradient has a key role in the generation
of the transmembrane action potential (Fig. 1.2). The
membrane potential of approximately –90 mV drifts
upward to the threshold potential of approximately –70
to –60 mV. At this point, specialized membrane-bound
channels modify their conformation from an inac-
tive to an active state, which allows the abrupt infl ux
of extracellular Na+ ions into the myocyte4,5, creating
phase 0 of the action potential and rapidly raising the
transmembrane potential to approximately +20 mV.6,7
Fig. 1.2 Action potential of a typical Purkinje fi ber, with the various phases of depolarization and repolarization (described in the text). (From Stokes KB, Kay GN. Artifi cial electric cardiac stimulation. In: Ellenbogen KA, Kay GN, Wilkoff BL, eds. Clinical cardiac pacing. Philadelphia: WB Saunders Co., 1995:3–37. By permission of the publisher.)

CHAPTER 1 Clinically Relevant Basics of Pacing and Defi brillation 3
This rapid upstroke creates a short period of overshoot
potential (phase 1), which is followed by a plateau pe-
riod (phase 2) created by the inward calcium (Ca2+) and
Na+ currents balanced against outward K+ currents.8–10
During phase 3 of the action potential, the transmem-
brane potential returns to normal, and during phase 4
the gradual upward drift in transmembrane potential
repeats. The shape of the transmembrane potential
and the relative distribution of the various membrane-
bound ion channels differ between the components of
the specialized cardiac conduction system.
Depolarization of neighboring cells occurs as a re-
sult of passive conduction via low-resistance intercel-
lular connections called “gap junctions,” with active
regeneration along cellular membranes.11,12 The ve-
locity of depolarization throughout the myocardium
depends on the speed of depolarization of the various
cellular components of the myocardium and on the
geometrical arrangement and orientation of the myo-
cytes. Factors such as myocardial ischemia, electrolyte
imbalance, metabolic abnormalities, and drugs may
affect the depolarization and depolarization velocity.
Pacing basics
Stimulation thresholdArtifi cial pacing involves delivery of an electrical im-
pulse from an electrode of suffi cient strength to cause
depolarization of the myocardium in contact with that
electrode and propagation of that depolarization to the
rest of the myocardium. The minimal amount of ener-
gy required to produce this depolarization is called the
stimulation threshold. The components of the stimu-
lus include the pulse amplitude (measured in volts)
and the pulse duration (measured in milliseconds). An
exponential relationship exists between the stimulus
amplitude and the duration, resulting in a hyperbolic
strength–duration curve. At short pulse durations, a
small change in the pulse duration is associated with a
signifi cant change in the pulse amplitude required to
achieve myocardial depolarization; conversely, at long
pulse durations, a small change in pulse duration has
relatively little effect on threshold amplitude (Fig. 1.3).
Two points on the strength–duration curve should be
noted (Fig. 1.4). The rheobase is defi ned as the smallest
amplitude (voltage) that stimulates the myocardium
at an infi nitely long pulse duration (milliseconds). The
chronaxie is the threshold pulse duration at twice the
stimulus amplitude, which is twice the rheobase volt-
age. The chronaxie is important in the clinical practice
of pacing because it approximates the point of mini-
mum threshold energy (microjoules) required for
myocardial depolarization.
The relationship of voltage, current, and pulse dura-
tion to stimulus energy is described by the formula
E = V2/R × t
in which E is the stimulus energy, V is the voltage, R is
the total pacing impedance, and t is the pulse duration.
This formula demonstrates the relative increase in en-
ergy with longer pulse durations. The energy increase
due to duration is offset by a decrement in the needed
voltage.
Fig. 1.3 Relationship of charge, energy, voltage, and current to pulse duration. As the pulse duration is shortened, voltage and current requirements increase. Charge decreases as pulse duration shortens. At threshold, energy is lowest at a pulse duration of 0.5–1.0 ms and increases at pulse widths of shorter and longer duration. (Modifi ed from Furman S. Basic concepts. In: Furman S, Hayes DL, Holmes DR Jr, eds. A practice of cardiac pacing. Mount Kisco, NY: Futura Publishing Co. By permission of the publisher.)
4 Cardiac Pacing, Defi brillation and Resynchronization: A Clinical Approach
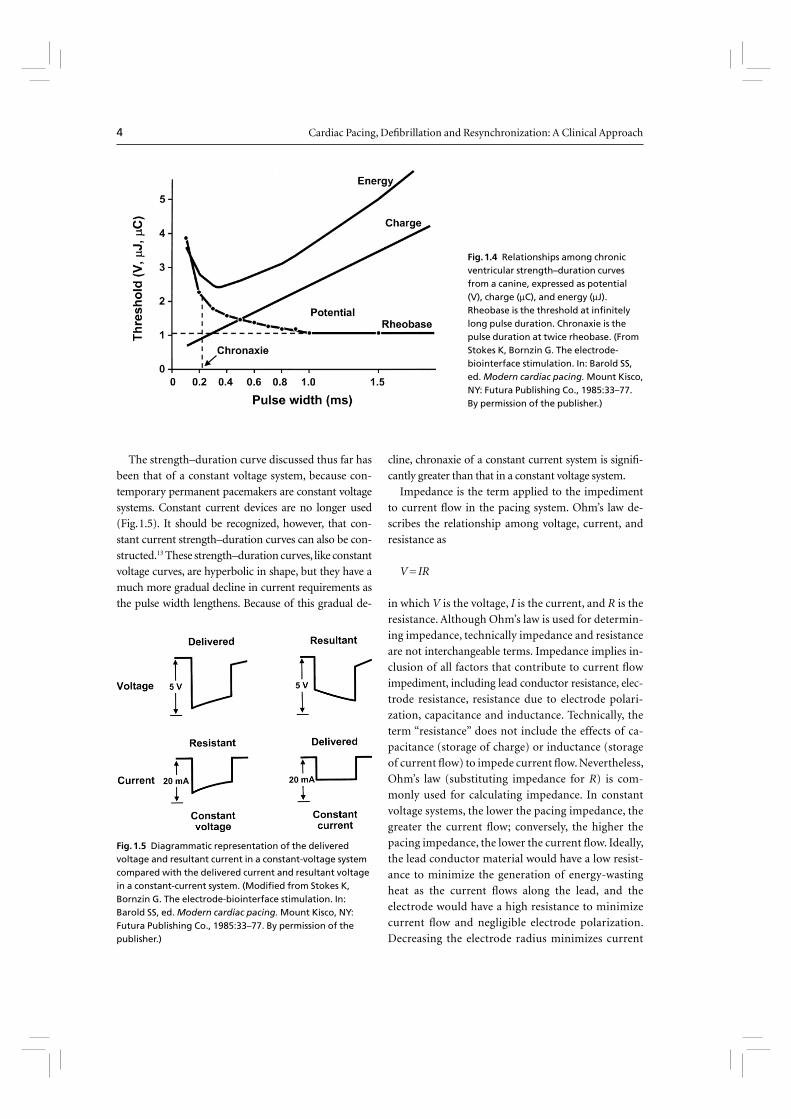
The strength–duration curve discussed thus far has
been that of a constant voltage system, because con-
temporary permanent pacemakers are constant voltage
systems. Constant current devices are no longer used
(Fig. 1.5). It should be recognized, however, that con-
stant current strength–duration curves can also be con-
structed.13 These strength–duration curves, like constant
voltage curves, are hyperbolic in shape, but they have a
much more gradual decline in current requirements as
the pulse width lengthens. Because of this gradual de-
cline, chronaxie of a constant current system is signifi -
cantly greater than that in a constant voltage system.
Impedance is the term applied to the impediment
to current fl ow in the pacing system. Ohm’s law de-
scribes the relationship among voltage, current, and
resistance as
V = IR
in which V is the voltage, I is the current, and R is the
resistance. Although Ohm’s law is used for determin-
ing impedance, technically impedance and resistance
are not interchangeable terms. Impedance implies in-
clusion of all factors that contribute to current fl ow
impediment, including lead conductor resistance, elec-
trode resistance, resistance due to electrode polari-
zation, capacitance and inductance. Technically, the
term “resistance” does not include the effects of ca-
pacitance (storage of charge) or inductance (storage
of current fl ow) to impede current fl ow. Nevertheless,
Ohm’s law (substituting impedance for R) is com-
monly used for calculating impedance. In constant
voltage systems, the lower the pacing impedance, the
greater the current fl ow; conversely, the higher the
pacing impedance, the lower the current fl ow. Ideally,
the lead conductor material would have a low resist-
ance to minimize the generation of energy-wasting
heat as the current fl ows along the lead, and the
electrode would have a high resistance to minimize
current fl ow and negligible electrode polarization.
Decreasing the electrode radius minimizes current
Fig. 1.4 Relationships among chronic ventricular strength–duration curves from a canine, expressed as potential (V), charge (μC), and energy (μJ). Rheobase is the threshold at infi nitely long pulse duration. Chronaxie is the pulse duration at twice rheobase. (From Stokes K, Bornzin G. The electrode-biointerface stimulation. In: Barold SS, ed. Modern cardiac pacing. Mount Kisco, NY: Futura Publishing Co., 1985:33–77. By permission of the publisher.)
Fig. 1.5 Diagrammatic representation of the delivered voltage and resultant current in a constant-voltage system compared with the delivered current and resultant voltage in a constant-current system. (Modifi ed from Stokes K, Bornzin G. The electrode-biointerface stimulation. In: Barold SS, ed. Modern cardiac pacing. Mount Kisco, NY: Futura Publishing Co., 1985:33–77. By permission of the publisher.)
CHAPTER 1 Clinically Relevant Basics of Pacing and Defi brillation 5
fl ow by providing greater electrode resistance and
increased current density, resulting in greater battery
longevity and lower stimulation thresholds.14
“Polarization” refers to layers of oppositely charged
ions that surround the electrode during the pulse stimu-
lus. It is related to the movement of positively charged
ions (Na+ and H3O+) to the cathode; the layer of posi-
tively charged ions is then surrounded by a layer of nega-
tively charged ions (Cl–, HPO4
2–, and OH–). These layers
of charge develop during the pulse stimulus, reaching
peak formation at the termination of the pulse stimu-
lus, after which they gradually dissipate. Polarization
impedes the movement of charge from the electrode to
the myocardium, resulting in a need for increased volt-
age. Since polarization develops with increasing pulse
duration, one way to combat formation of polarization
is to shorten the pulse duration. Electrode design has
incorporated the use of materials that discourage polar-
ization, such as platinum black, iridium oxide, titanium
nitride, and activated carbon.15 Finally, polarization is
inversely related to the surface area of the electrode. To
maximize the surface area (to reduce polarization) but
minimize the radius (to increase electrode impedance),
electrode design incorporates a small radius but a por-
ous, irregular surface construction.16 Leads designed to
maximize these principles are considered “high-imped-
ance” leads.
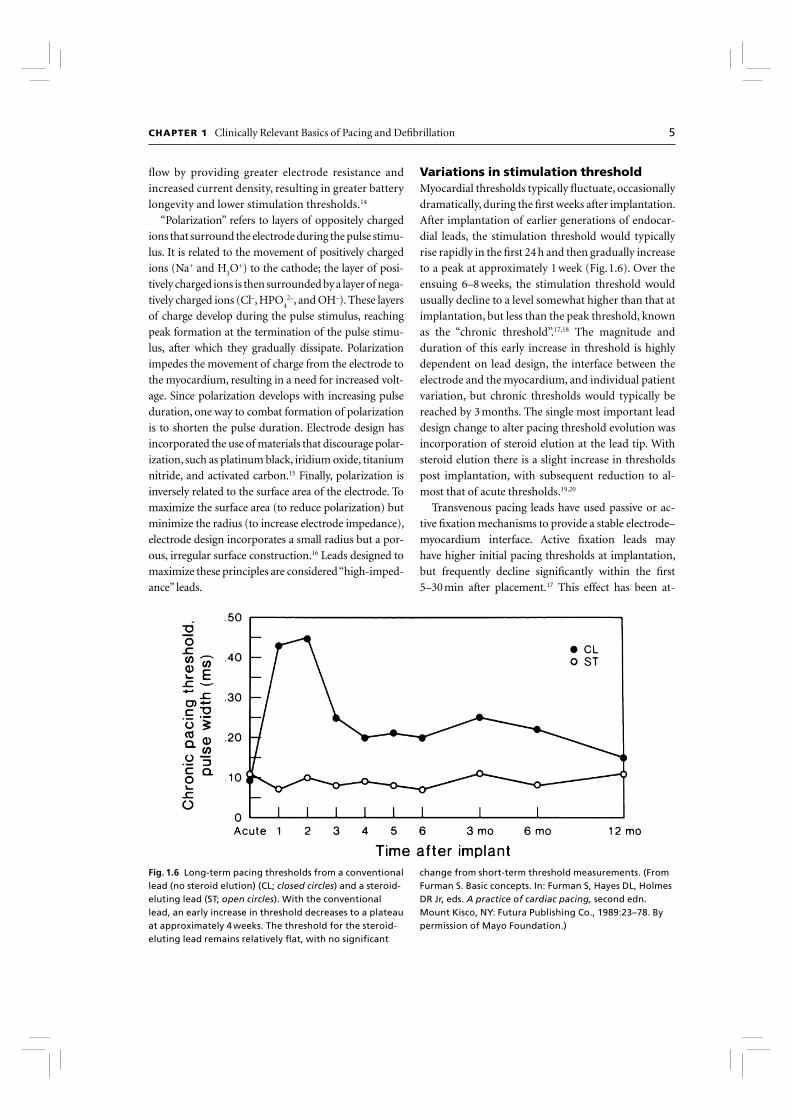
Variations in stimulation threshold Myocardial thresholds typically fl uctuate, occasionally
dramatically, during the fi rst weeks after implantation.
After implantation of earlier generations of endocar-
dial leads, the stimulation threshold would typically
rise rapidly in the fi rst 24 h and then gradually increase
to a peak at approximately 1 week (Fig. 1.6). Over the
ensuing 6–8 weeks, the stimulation threshold would
usually decline to a level somewhat higher than that at
implantation, but less than the peak threshold, known
as the “chronic threshold”.17,18 The magnitude and
duration of this early increase in threshold is highly
dependent on lead design, the interface between the
electrode and the myocardium, and individual patient
variation, but chronic thresholds would typically be
reached by 3 months. The single most important lead
design change to alter pacing threshold evolution was
incorporation of steroid elution at the lead tip. With
steroid elution there is a slight increase in thresholds
post implantation, with subsequent reduction to al-
most that of acute thresholds.19,20
Transvenous pacing leads have used passive or ac-
tive fi xation mechanisms to provide a stable electrode–
myocardium interface. Active fi xation leads may
have higher initial pacing thresholds at implantation,
but frequently decline signifi cantly within the fi rst
5–30 min after placement.17 This effect has been at-
Fig. 1.6 Long-term pacing thresholds from a conventional lead (no steroid elution) (CL; closed circles) and a steroid-eluting lead (ST; open circles). With the conventional lead, an early increase in threshold decreases to a plateau at approximately 4 weeks. The threshold for the steroid-eluting lead remains relatively fl at, with no signifi cant
change from short-term threshold measurements. (From Furman S. Basic concepts. In: Furman S, Hayes DL, Holmes DR Jr, eds. A practice of cardiac pacing, second edn. Mount Kisco, NY: Futura Publishing Co., 1989:23–78. By permission of Mayo Foundation.)
6 Cardiac Pacing, Defi brillation and Resynchronization: A Clinical Approach
tributed to hyperacute injury due to advancement of
the screw into the myocardium. On a cellular level, im-
plantation of a transvenous pacing lead results in acute
injury to cellular membranes, which is followed by the
development of myocardial edema and coating of the
electrode surface with platelets and fi brin. Subse-
quently, various chemotactic factors are released, and
an acute infl ammatory reaction develops, consisting
of mononuclear cells and polymorphonuclear leuko-
cytes. After the acute response, release of proteolytic
enzymes and oxygen free radicals by invading macro-
phages accelerates cellular injury. Finally, fi broblasts
in the myocardium begin producing collagen, leading
to production of the fi brotic capsule surrounding the
electrode. This fi brous capsule ultimately increases the
effective radius of the electrode, with a smaller increase
in surface area.21,22 Steroid-eluting leads are believed to
minimize fi brous capsule formation. In both atrial and
ventricular active fi xation leads, steroid elution results
in long-term reduction in energy consumption with
maintenance of stimulation thresholds, lead imped-
ance values, and sensing thresholds.23,24
The stimulation threshold typically has a circadian
pattern, generally increasing during sleep and decreas-
ing during the day, probably refl ecting changes in auto-
nomic tone. The stimulation threshold may also rise
after eating; during hyperglycemia, hypoxemia or acute
viral illnesses; or as a result of electrolyte fl uctuations.
These changes, as well as the circadian variation in stim-
ulation threshold, are usually minimal. Certain drugs
used in patients with cardiac disease may also increase
pacing thresholds (see Chapter 8: Programming).
The infl ammatory reaction and subsequent fi bro-
sis that occur after lead implantation may act as an
insulating shield around the electrode. These pro-
cesses effectively increase the distance between the
electrode and the excitable tissue, allowing the stimu-
lus to disperse partially before reaching the excitable
cells. These changes result in an increased threshold
for stimulation and attenuate the amplitude and slew
rate of the endocardial signal being sensed. This is a
process termed “lead maturation.” Improvements in
electrode design and materials have reduced the sever-
ity of the infl ammatory reaction and thus improved
lead maturation rates.19,25 When the capture threshold
exceeds the programmed output of the pacemaker, exit
block will occur; loss of capture will result if the cap-
ture threshold exceeds the programmed output of the
pacemaker.17,26 Exit block, a consequence of lead matu-
ration, results from the progressive rise in thresholds
over time.17,26 This phenomenon occurs despite initial
satisfactory lead placement and implantation thresh-
olds, often but not always occurs in parallel in the atri-
um and ventricle, and usually recurs with placement
of subsequent leads. Steroid-eluting leads prevent exit
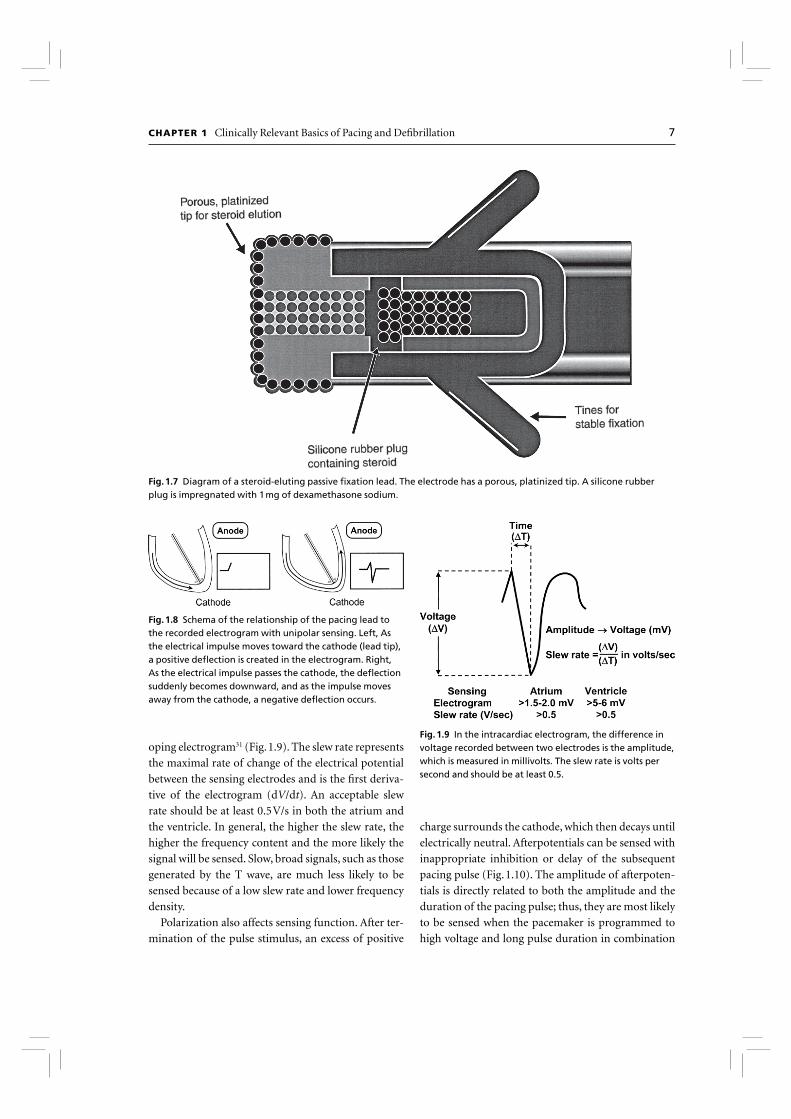
block in most, but not all patients (Fig. 1.7).
SensingThe fi rst pacemakers functioned as fi xed-rate, VOO
devices. All contemporary devices offer demand-
mode pacing, which pace only when the intrinsic
rate is below the programmed rate. For such devices
to function as programmed, accurate and consistent
sensing of the native rhythm was essential.
Intrinsic cardiac electrical signals are produced by
the wave of electrical current through the myocar-
dium (Fig. 1.8). As the wavefront of electrical energy
approaches an endocardial electrode, the electrode
becomes positively charged relative to the depolarized
region, recorded as a positive defl ection in the intrac-
ardiac electrogram. As the wavefront passes directly
under the electrode, the outside of the cell abruptly
becomes negatively charged, and a sharp negative de-
fl ection is recorded, which is referred to as the intrinsic
defl ection.27 It is considered to occur at the moment
the advancing wavefront passes directly underneath
the electrode. Smaller positive and negative defl ections
preceding and following the intrinsic defl ection repre-
sent activation of surrounding myocardium. Ventricu-
lar electrograms typically are much larger than atrial
electrograms because the ventricular mass is greater.
The maximum frequency densities of atrial and ven-
tricular electrograms have generally been found to be in
the range of 80–100 Hz in the atrium and 10–30 Hz in
the ventricle (these frequencies may differ slightly with
newer leads/technologies). Based on these frequencies,
fi ltering systems of pulse generators were designed to
attenuate signals outside these ranges. Filtering and
use of blanking and refractory periods have markedly
reduced unwanted sensing, although myopotential
frequencies (ranging from 10 to 200 Hz) considerably
overlap with those generated by atrial and ventricular
depolarization and are diffi cult to fi lter out, especially
during sensing in a unipolar confi guration.28–30 Short-
ening of the tip-to-ring spacing has also improved atri-
al sensing and rejection of far-fi eld R waves.
Another component of the intracardiac electro-
gram is the slew rate, i.e. the peak slope of the devel-
CHAPTER 1 Clinically Relevant Basics of Pacing and Defi brillation 7
oping electrogram31 (Fig. 1.9). The slew rate represents
the maximal rate of change of the electrical potential
between the sensing electrodes and is the fi rst deriva-
tive of the electrogram (dV/dt). An acceptable slew
rate should be at least 0.5 V/s in both the atrium and
the ventricle. In general, the higher the slew rate, the
higher the frequency content and the more likely the
signal will be sensed. Slow, broad signals, such as those
generated by the T wave, are much less likely to be
sensed because of a low slew rate and lower frequency
density.
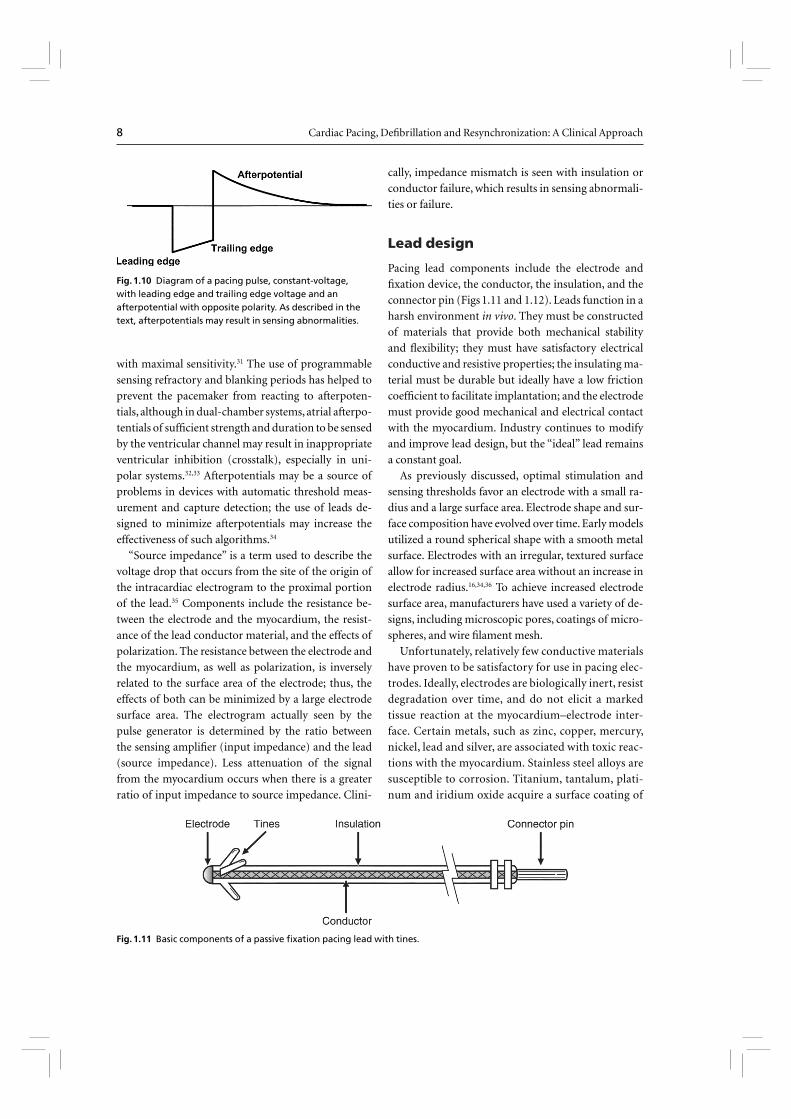
Polarization also affects sensing function. After ter-
mination of the pulse stimulus, an excess of positive
charge surrounds the cathode, which then decays until
electrically neutral. Afterpotentials can be sensed with
inappropriate inhibition or delay of the subsequent
pacing pulse (Fig. 1.10). The amplitude of afterpoten-
tials is directly related to both the amplitude and the
duration of the pacing pulse; thus, they are most likely
to be sensed when the pacemaker is programmed to
high voltage and long pulse duration in combination
Fig. 1.7 Diagram of a steroid-eluting passive fi xation lead. The electrode has a porous, platinized tip. A silicone rubber plug is impregnated with 1 mg of dexamethasone sodium.
Fig. 1.8 Schema of the relationship of the pacing lead to the recorded electrogram with unipolar sensing. Left, As the electrical impulse moves toward the cathode (lead tip), a positive defl ection is created in the electrogram. Right, As the electrical impulse passes the cathode, the defl ection suddenly becomes downward, and as the impulse moves away from the cathode, a negative defl ection occurs.
Fig. 1.9 In the intracardiac electrogram, the difference in voltage recorded between two electrodes is the amplitude, which is measured in millivolts. The slew rate is volts per second and should be at least 0.5.
8 Cardiac Pacing, Defi brillation and Resynchronization: A Clinical Approach
with maximal sensitivity.31 The use of programmable
sensing refractory and blanking periods has helped to
prevent the pacemaker from reacting to afterpoten-
tials, although in dual-chamber systems, atrial afterpo-
tentials of suffi cient strength and duration to be sensed
by the ventricular channel may result in inappropriate
ventricular inhibition (crosstalk), especially in uni-
polar systems.32,33 Afterpotentials may be a source of
problems in devices with automatic threshold meas-
urement and capture detection; the use of leads de-
signed to minimize afterpotentials may increase the
effectiveness of such algorithms.34
“Source impedance” is a term used to describe the
voltage drop that occurs from the site of the origin of
the intracardiac electrogram to the proximal portion
of the lead.35 Components include the resistance be-
tween the electrode and the myocardium, the resist-
ance of the lead conductor material, and the effects of
polarization. The resistance between the electrode and
the myocardium, as well as polarization, is inversely
related to the surface area of the electrode; thus, the
effects of both can be minimized by a large electrode
surface area. The electrogram actually seen by the
pulse generator is determined by the ratio between
the sensing amplifi er (input impedance) and the lead
(source impedance). Less attenuation of the signal
from the myocardium occurs when there is a greater
ratio of input impedance to source impedance. Clini-
cally, impedance mismatch is seen with insulation or
conductor failure, which results in sensing abnormali-
ties or failure.
Lead design
Pacing lead components include the electrode and
fi xation device, the conductor, the insulation, and the
connector pin (Figs 1.11 and 1.12). Leads function in a
harsh environment in vivo. They must be constructed
of materials that provide both mechanical stability
and fl exibility; they must have satisfactory electrical
conductive and resistive properties; the insulating ma-
terial must be durable but ideally have a low friction
coeffi cient to facilitate implantation; and the electrode
must provide good mechanical and electrical contact
with the myocardium. Industry continues to modify
and improve lead design, but the “ideal” lead remains
a constant goal.
As previously discussed, optimal stimulation and
sensing thresholds favor an electrode with a small ra-
dius and a large surface area. Electrode shape and sur-
face composition have evolved over time. Early models
utilized a round spherical shape with a smooth metal
surface. Electrodes with an irregular, textured surface
allow for increased surface area without an increase in
electrode radius.16,34,36 To achieve increased electrode
surface area, manufacturers have used a variety of de-
signs, including microscopic pores, coatings of micro-
spheres, and wire fi lament mesh.
Unfortunately, relatively few conductive materials
have proven to be satisfactory for use in pacing elec-
trodes. Ideally, electrodes are biologically inert, resist
degradation over time, and do not elicit a marked
tissue reaction at the myocardium–electrode inter-
face. Certain metals, such as zinc, copper, mercury,
nickel, lead and silver, are associated with toxic reac-
tions with the myocardium. Stainless steel alloys are
susceptible to corrosion. Titanium, tantalum, plati-
num and iridium oxide acquire a surface coating of
Fig. 1.10 Diagram of a pacing pulse, constant-voltage, with leading edge and trailing edge voltage and an afterpotential with opposite polarity. As described in the text, afterpotentials may result in sensing abnormalities.
Fig. 1.11 Basic components of a passive fi xation pacing lead with tines.

CHAPTER 1 Clinically Relevant Basics of Pacing and Defi brillation 9
oxides that impedes current transfer. Materials cur-
rently in use are platinum-iridium, platinized titani-
um-coated platinum, iridium oxide, and platinum
(Fig. 1.13). Carbon electrodes seem to be least sus-
ceptible to corrosion; they have also been improved
by a process known as activation, which roughens
the surface to increase the surface area and allow for
tissue ingrowth.37
Lead fi xation may be active or passive. Passive fi xa-
tion endocardial leads usually incorporate tines at the
tip that become ensnared in trabeculated tissue in
the right atrium or ventricle, providing lead stability.
Leads designed for coronary venous placement usu-
ally incorporate a design that wedges the lead against
the wall of the coronary vein. Active fi xation leads al-
most exclusively utilize screw mechanisms to embed
in the myocardium to provide lead stability. Some
leads incorporate screws that are electrically inactive,
and in others the screw is electrically active. There are
advantages and disadvantages to each design, and the
clinical situation and preference of the operator are
important considerations when a lead is chosen. Con-
siderable myocardial and fi brous tissue enveloping the
tip typically develops with both active and passive fi xa-
tion leads. However, the encasement of the tines of a
passive fi xation lead by fi brous tissue often makes the
extraction of passive fi xation leads more diffi cult than
that of active fi xation leads. Active fi xation leads are
Fig. 1.12 Radiographic example of an active fi xation screw-in lead with a retractable screw rather than a screw that is always extended. The screw is extended in the lower image but not in the upper image.
Fig. 1.13 Capture thresholds from implantation to 26 weeks from a variety of unipolar leads with similar geometric surface area electrodes. From top to bottom, the curves represent laser-drilled polished platinum; porous-surface platinum; activated carbon; platinized target tip; and porous steroid-eluting leads. (From Stokes KB, Kay GN. Artifi cial electric cardiac stimulation. In: Ellenbogen KA, Kay GN, Wilkoff BL, eds. Clinical cardiac pacing. Philadelphia: WB Saunders Co., 1995:3–37. By permission of the publisher.)
10 Cardiac Pacing, Defi brillation and Resynchronization: A Clinical Approach
often preferable in patients with distorted anatomy,
such as those with congenital cardiac defects or those
with surgically amputated atrial appendages. Active
fi xation leads are also preferable in patients with high
right-sided pressures. As alternative site pacing has
evolved, i.e. the placements of leads outside the right
atrial appendage and right ventricular apex, screw-in
leads have become more popular and necessary for
long-term stability.
There are various types of mechanism used to keep
the screw unexposed until it is placed in an optimal site
for fi xation. One example is a system in which the screw
is extendable and retractable from the pacemaker lead
tip. This allows the operator to designate the precise lo-
cation and timing to extend the screw from the tip. An-
other example involves covering a fi xed helix screw in
a material that dissolves in the blood stream in a time
period that is advantageous for lead positioning. For
example, screws can be covered by a mannitol com-
pound that dissolves over time in the blood stream.
Since the mannitol covers the screw, it prevents it from
catching on tissue, allowing easier lead placement.
New technologies have emerged to assist in the
placement of leads to targeted anatomical sites. Cath-
eter-delivered systems use a defl ectable catheter that
is braided to allow the simultaneous ability to torque
the catheter. A second technology developed to reach
diffi cult anatomical targets is to use an over-the-wire
lead delivery system, mainly used with placement of
coronary venous leads for left ventricular stimulation.
With this system the lead can be advanced to a stable
position, a guidewire then being advanced to navigate
tortuous regions similar to techniques used extensively
for coronary angiography, followed by advancement
of the lead over the wire. This approach not only im-
proves access to target sites, but decreases injury to
coronary venous structures. By combining these tech-
nologies, access to target sites has improved greatly, in
particular, coronary vein subselection for left ventricu-
lar lead placement.
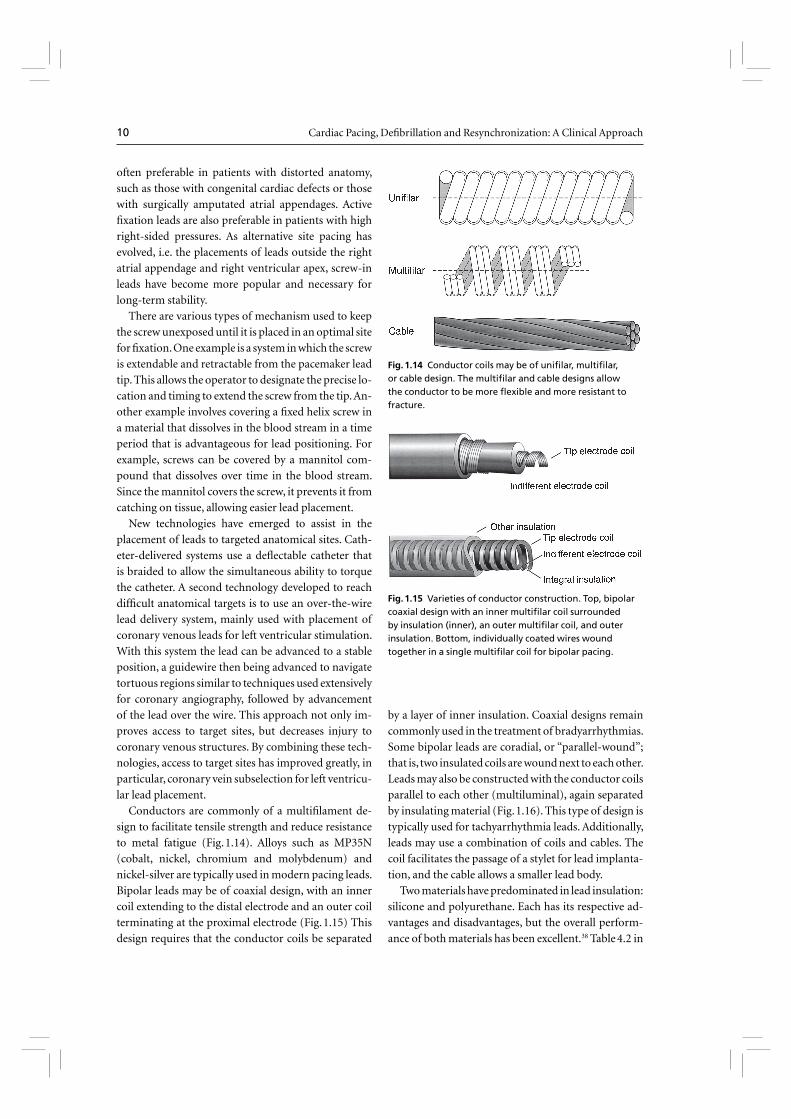
Conductors are commonly of a multifi lament de-
sign to facilitate tensile strength and reduce resistance
to metal fatigue (Fig. 1.14). Alloys such as MP35N
(cobalt, nickel, chromium and molybdenum) and
nickel-silver are typically used in modern pacing leads.
Bipolar leads may be of coaxial design, with an inner
coil extending to the distal electrode and an outer coil
terminating at the proximal electrode (Fig. 1.15) This
design requires that the conductor coils be separated
by a layer of inner insulation. Coaxial designs remain
commonly used in the treatment of bradyarrhythmias.
Some bipolar leads are coradial, or “parallel-wound”;
that is, two insulated coils are wound next to each other.
Leads may also be constructed with the conductor coils
parallel to each other (multiluminal), again separated
by insulating material (Fig. 1.16). This type of design is
typically used for tachyarrhythmia leads. Additionally,
leads may use a combination of coils and cables. The
coil facilitates the passage of a stylet for lead implanta-
tion, and the cable allows a smaller lead body.
Two materials have predominated in lead insulation:
silicone and polyurethane. Each has its respective ad-
vantages and disadvantages, but the overall perform-
ance of both materials has been excellent.38 Table 4.2 in
Fig. 1.14 Conductor coils may be of unifi lar, multifi lar, or cable design. The multifi lar and cable designs allow the conductor to be more fl exible and more resistant to fracture.
Fig. 1.15 Varieties of conductor construction. Top, bipolar coaxial design with an inner multifi lar coil surrounded by insulation (inner), an outer multifi lar coil, and outer insulation. Bottom, individually coated wires wound together in a single multifi lar coil for bipolar pacing.
CHAPTER 1 Clinically Relevant Basics of Pacing and Defi brillation 11
Chapter 4 compares the advantages and disadvantages
of these two insulating materials.
The two grades of polyurethane that have had the wid-
est use are Pellathane 80A and Pellathane 55D. Early after
the introduction of polyurethane as an insulating mate-
rial, it became clear that clinical failure rates with specifi c
leads were higher than acceptable; further investigation
revealed that the failures were occurring primarily in
leads insulated with the P80A polymer.36,39 Microscopic
cracks developed in the P80A polymer, initially occur-
ring as the heated polymer cooled during manufacture;
with additional environmental stress, these cracks prop-
agated deeper into the insulation, resulting in failure of
the lead insulation.
Polyurethane may also undergo oxidative stress in
contact with conductors containing cobalt and silver
chloride, resulting in degradation of the lead from the
inside and subsequent lead failure. Some current leads
use silicone with a polyurethane coating, incorporat-
ing the strength and durability of silicone with the
ease of handling of polyurethane while maintaining
a satisfactory external lead diameter. Silicone rub-
ber is well known to be susceptible to abrasion wear,
cold fl ow due to cyclic compression, and wear from
lead-to-lead and lead-to-can contact. Current silicone
leads have surface modifi cations that improve lubric-
ity and reduce friction in blood. Second, preliminary
studies have suggested that a hybrid coating of silicone
and polyurethane may offer improved wear.40 Despite
lead improvements, laboratory testing and premar-
keting, clinical trials have been inadequate to predict
the long-term performance of leads, so that clinicians
implanting the devices or performing follow-up in
patients with pacing systems must vigilantly monitor
lead status.
Contemporary leads and connectors are stand-
ardized to conform to international guidelines (IS-1
Standard), which mandate that leads have a 3.2-mm
diameter in-line bipolar connector pin.41 These stand-
ards were established many years ago because some
leads and connector blocks were incompatible, requir-
ing the development of multiple adaptors. Some pa-
tients who have functioning leads of the older 5- or
6-mm diameter unipolar design require lead adaptors
when the pulse generator is replaced.
Coronary venous lead connectors were initially de-
veloped to accommodate patients with heart failure
who had previously implanted pacemakers for other
reasons and were considered eligible for an upgrade to
biventricular pacing. For these patients, the ventricu-
lar output of the pacemaker generator was divided
via a “Y” connector from one bipolar output to two
separate outputs (usually a unipolar left ventricle and
a bipolar right ventricle or a bipolar left ventricle and
a bipolar right ventricle) to accommodate the left ven-
tricular lead. However, this approach can lead to atrial
oversensing, improper measurement of left ventricu-
lar thresholds, and inappropriate shocks.42,43 Currently,
most left ventricular leads are connected to the pace-
maker independently. The left ventricular leads are ei-
ther bipolar or unipolar with a steroid eluding tip.
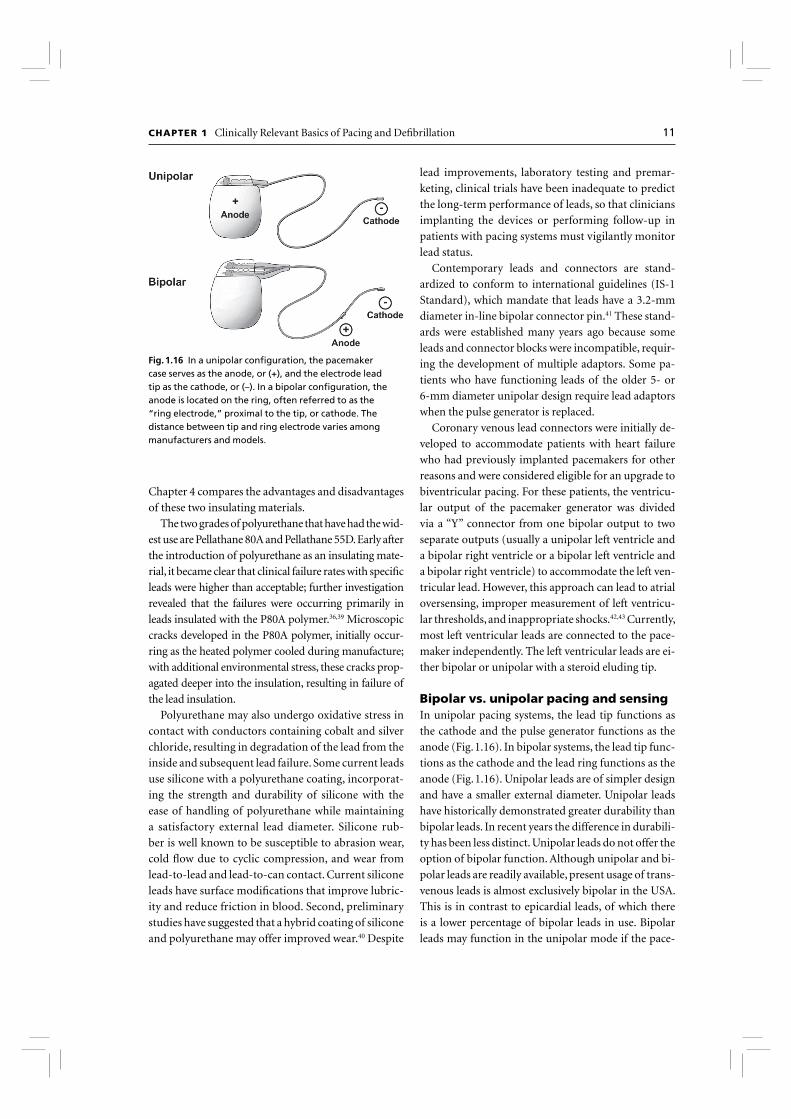
Bipolar vs. unipolar pacing and sensingIn unipolar pacing systems, the lead tip functions as
the cathode and the pulse generator functions as the
anode (Fig. 1.16). In bipolar systems, the lead tip func-
tions as the cathode and the lead ring functions as the
anode (Fig. 1.16). Unipolar leads are of simpler design
and have a smaller external diameter. Unipolar leads
have historically demonstrated greater durability than
bipolar leads. In recent years the difference in durabili-
ty has been less distinct. Unipolar leads do not offer the
option of bipolar function. Although unipolar and bi-
polar leads are readily available, present usage of trans-
venous leads is almost exclusively bipolar in the USA.
This is in contrast to epicardial leads, of which there
is a lower percentage of bipolar leads in use. Bipolar
leads may function in the unipolar mode if the pace-
Fig. 1.16 In a unipolar confi guration, the pacemaker case serves as the anode, or (+), and the electrode lead tip as the cathode, or (–). In a bipolar confi guration, the anode is located on the ring, often referred to as the “ring electrode,” proximal to the tip, or cathode. The distance between tip and ring electrode varies among manufacturers and models.
12 Cardiac Pacing, Defi brillation and Resynchronization: A Clinical Approach
maker is so programmed. They are available in several
designs, generally coaxial or multiluminal. Regard-
less of design, the external diameter of a bipolar lead
is usually greater than that of unipolar leads because
each coil must be electrically separated by insulating
material. Bipolar pacing and sensing are preferred over
unipolar because bipolar pacing cannot cause extra-
cardiac stimulation at the pulse generator, which may
occasionally occur with unipolar pacing due to cur-
rent returning to the generator. Also, bipolar sensing is
less likely to detect myopotentials, far-fi eld signals and
electromagnetic interference.44
There are long-standing controversies regarding uni-
polar vs. bipolar pacing and sensing confi guration and
which, if either, are superior.44 Advocates of unipolar
confi guration argue that improvements in sensing cir-
cuitry and pacemaker fi ltering capabilities have mini-
mized unipolar oversensing of extracardiac signals. The
design of unipolar leads is often more simple and there-
by the lead size may be less. They also argue that bipolar
leads have a historically higher failure rate than unipo-
lar leads. Although this is true, if the specifi c failures of
Pellathane 80A and 55D that occurred many years ago
are removed from the analysis, the failure rate between
unipolar and bipolar lead designs does not differ sig-
nifi cantly and varies between different manufacturers.45
Unipolar leads are often considered safer because they do
not short circuit signifi cantly when there are insulation
breaches, although they may be susceptible to signifi cant
external interference. Nevertheless, a lead that is mal-
functioning in the bipolar mode may function satisfac-
torily when programmed to the unipolar confi guration
(see Chapter 8: Programming).
Most pulse generators offer independently program-
mable pacing and sensing in each channel; however, bi-
polar programming of a device attached to a unipolar
lead results in no output. Bipolar leads can function in
the unipolar mode; the converse is not true.
Left ventricular leadsCardiac resynchronization therapy with biventricular
pacing is an established treatment for patients with se-
vere congestive heart failure, low left ventricular ejec-
tion fraction, and New York Heart Association class III
or IV heart failure.46 In order to pace the left ventricle,
a pacing lead is implanted transvenously through the
coronary sinus and coronary vein to stimulate the left
ventricular free wall. Resynchronization is obtained
by stimulating both ventricles to contract with mini-
mal intraventricular delay, thereby improving the left
ventricular performance.47 Modifi cations of the tip
geometry have improved the stability of the passive
lead over time. Tissue ingrowth can be a major impedi-
ment to the removal of defi brillation leads implanted
in the coronary sinus. Coating these leads with poly-
tetrafl uoroethylene and backfi lling the coil with medi-
cal adhesive facilitates transvenous lead removal.48
Pulse generators
All pulse generators include a power source, an output
circuit, a sensing circuit, a timing circuit, and a header
with a standardized connector (or connectors) to at-
tach a lead (or leads) to the pulse generator.49 Essen-
tially, all devices are capable of storing some degree of
diagnostic information that can be retrieved at a later
time. Most pacemakers incorporate a rate-adaptive
sensor. Despite increasing complexity, device size has
continued to decrease. This has led to a variable effect
on the potential longevity.
Many power sources have been used for pulse gener-
ators over the years. Lithium iodine cells have been the
energy source for almost all contemporary pulse gen-
erators. Newer pacemakers and implantable cardio-
verter-defi brillators (ICDs) that can support higher
current drains for capacitor charging and high-rate
antitachycardia pacing use lithium-silver-oxide-vana-
dium chemistries. Lithium is the anodal element and
provides the supply of electrons; iodine is the cathodal
element and accepts the electrons. The cathodal and
anodal elements are separated by an electrolyte, which
serves as a conductor of ionic movement but a barrier
to the transfer of electrons. The circuit is completed
by the external load, i.e. the leads and myocardium.
The battery voltage of the cell depends on the chemical
composition of the cell; at the beginning of life for the
lithium iodine battery, the cell generates approximate-
ly 2.8 V, which decreases to 2.4 V when approximately
90% of the useable battery life has been reached. The
voltage then exponentially declines to 1.8 V as the bat-
tery reaches end-of-life. However, the voltage at which
the cell reaches a certain depth of discharge is load de-
pendent. The elective replacement indicated voltages
were chosen based on the shape of the discharge curves
under expected operating conditions. When the bat-
tery is at end-of-service, most devices lose telemetry
and programming capabilities, frequently reverting
to a fi xed high-output mode to attempt to maintain

CHAPTER 1 Clinically Relevant Basics of Pacing and Defi brillation 13
patient safety. This predictable depletion character-
istic has made lithium-based power cells common in
current devices. Nickel-cadmium technology is being
used once again in at least one investigational implant-
able device.
The battery voltage can be telemetered from the pulse
generator; most devices also provide battery impedance
(which increases with battery depletion) for additional
information about battery life. The battery life can also
be estimated by the magnet rate of the device, which
changes with a decline in battery voltage. Unfortunately,
the magnet rates are not standardized, and rate change
characteristics vary tremendously among manufactur-
ers and even among devices produced by the same man-
ufacturer. Therefore, it is important to know the magnet
rate characteristics of a given device before using this
feature to determine battery status.
The longevity of any battery is determined by several
factors, including chemical composition of the battery,
size of the battery, external load (pulse duration and
amplitude, stimulation frequency, total pacing lead
impedance, and amount of current required to oper-
ate device circuitry and store diagnostic information),
amount of internal discharge, and voltage decay char-
acteristics of the cell. The basic formula for longevity
determination is 114 × [battery capacity (A-HR)/Cur-
rent Drain (µA)] = longevity in years. However, this
formula is subject to how the power cell’s ampere-hours
is specifi ed by the manufacturer, thus the longevity will
vary somewhat by company. High-performance leads,
automatic capture algorithms and programming op-
tions that minimize pacing should further enhance
device longevity.50,51
The pacing pulse is generated fi rst by charging of an
output capacitor and discharge of the capacitor to the
pacing cathode and anode. Since the voltage of a lith-
ium iodine cell is fi xed, obtaining multiple selectable
pulse amplitudes requires the use of a voltage amplifi er
between the battery and the output capacitor. Contem-
porary pulse generators are constant-voltage (rather
than constant-current) devices, implying delivery of a
constant-voltage pulse throughout the pulse duration.
In reality, some voltage drop occurs between the lead-
ing and the trailing edges of the impulse; the size of this
decrease depends on the pacing impedance and pulse
duration. The lower the impedance, the greater the
current fl ow from the fi xed quantity of charge on the
capacitor and the greater the voltage drop throughout
the pulse duration.52 The voltage drop is also depend-
ent on the capacitance value of the capacitor and the
time of longer pulse duration.
The output waveform is followed by a low-ampli-
tude wave of opposite polarity, the afterpotential. The
afterpotential is determined by the polarization of the
electrode at the electrode–tissue interface; formation
is due to electrode characteristics as well as to pulse
amplitude and duration. The sensing circuit may sense
afterpotentials of suffi cient amplitude, especially if the
sensitivity threshold is low. Newer pacemakers use the
output circuit to discharge the afterpotential quickly,
thus lowering the incidence of afterpotential sensing.
The afterpotential also helps to prevent electrode cor-
rosion.
The intracardiac electrogram is conducted from
the myocardium to the sensing circuit via the pacing
leads, where it is then amplifi ed and fi ltered. As noted
above, the input impedance must be signifi cantly larg-
er than the sensing impedance to minimize attenua-
tion of the electrogram. A bandpass fi lter attenuates
signals on either side of a center frequency, which var-
ies among manufacturers (generally ranging from 20
to 40 Hz).53,54 After fi ltering, the electrogram signal is
compared with a reference voltage, the sensitivity set-
ting; signals with an amplitude of this reference voltage
or higher are sensed as true intracardiac events and are
forwarded to the timing circuitry, whereas signals with
an amplitude below the reference amplitude are cat-
egorized as noise, extracardiac or other cardiac signal,
such as T waves.
Sensing circuitry also incorporates noise reversion
circuits that cause the pacemaker to revert to a noise
reversion mode (asynchronous pacing) whenever the
rate of signal received by the sensing circuit exceeds
the noise reversion rate. This feature is incorporated to
prevent inhibition of pacing when the device is exposed
to electromagnetic interference. Pulse generators also
use Zener diodes designed to protect the circuitry from
high external voltages, which may occur, for example,
with defi brillation. When the input voltage presented
to the pacemaker exceeds the Zener voltage, the excess
voltage is shunted back through the leads to the myo-
cardium.
The timing circuit of the pacemaker is a crystal os-
cillator that regulates the pacing cycle length, refrac-
tory periods, blanking periods and AV intervals with
extreme accuracy. The output from the oscillator (as
well as signals from the sensing circuitry) is sent to a
timing and logic control board that operates the inter-

14 Cardiac Pacing, Defi brillation and Resynchronization: A Clinical Approach
nal clocks, which in turn regulate all the various timing
cycles of the pulse generator. The timing and logic con-
trol circuitry also contains an absolute maximal upper
rate cut-off to prevent “runaway pacing” in the event
of random component failure.55,56
Each new generation of pacemakers contains more
microprocessor capability. The circuitry contains a
combination of read-only memory (ROM) and ran-
dom-access memory (RAM). ROM is used to operate
the sensing and output functions of the device, and
RAM is used in diagnostic functions. Larger RAM ca-
pability has allowed devices to store increased amounts
of retrievable diagnostic information, with the poten-
tial to allow downloading of new features externally
into an implanted device.
External telemetry is included in all implantable
devices. The pulse generator can receive informa-
tion from the programmer and send information
back by radiofrequency signals. Each manufacturer’s
programmer and pulse generator operate on an ex-
clusive radiofrequency, preventing the use of one
manufacturer’s programmer with a pacemaker from
another manufacturer. Through telemetry, the pro-
grammer can retrieve both diagnostic information
and real-time information on battery status, lead
impedance, current, pulse amplitude and pulse dur-
ation. Real-time electrograms and marker channels
can also be obtained with most devices. The device
can also be directed to operate within certain limits
and to store specifi c types of diagnostic information
via the programmer.
The most recent change in telemetry is that of “re-
mote” capability. Information exchange has tradition-
ally occurred by placing and leaving the programming
‘head’ of the programmer over the pulse generator for
the duration of the interrogation and programming
changes. New telemetry designs allow the program-
ming ‘head’ or ‘wand’ to be placed briefl y over the
pulse generator to establish identity of the specifi c
model and pulse generator and then complete the bi-
directional informational exchange at a distance, i.e.
the ‘wand’ does not need to be kept in a position di-
rectly over the pulse generator. Finally, even the use of
a wand for certain pulse generators is not required for
remote programming.
Pacemaker nomenclature
A lettered code to describe the basic function of pac-
ing devices, initially developed by the American Heart
Association and the American College of Cardiology,
has since been modifi ed and updated by the members
of the North American Society of Pacing and Electro-
physiology and the British Pacing and Electrophysiol-
ogy Group (currently the Heart Rhythm Society).57
This code has fi ve positions to describe basic pacemak-
er function, although it obviously cannot incorporate
all of the various special features available on modern
devices (Table 1.1).
The fi rst position describes the chamber or cham-
bers in which electrical stimulation occurs. A refl ects
pacing in the atrium, V implies pacing in the ventricle,
D signifi es pacing in both the atrium and the ventri-
cle, and O is used when the device has antitachycardia
pacing (ATP) or cardioversion-defi brillation capabil-
ity but no bradycardia pacing capability.
The second position describes the chamber or
chambers in which sensing occurs. The letter code is
Table 1.1 NBG* code
I II III IV V
Chamber(s) paced Chamber(s) sensed Response to sensing
Programmability, rate
modulation Multisite pacing
O = None O = None O = None O = None O = None
A = Atrium A = Atrium T = Triggered P = Simple programmable A = Atrium
V = Ventricle V = Ventricle I = Inhibited M = Multiprogrammable V=Ventricle
D = Dual (A + V) D = Dual (A + V) D = dual (T + I) C = Communicating D= Dual (A + V)
*The North American Society of Pacing and Electrophysiology and the British Pacing and Electrophysiology Group.
Modifi ed from Bernstein et al.57 By permission of Futura Publishing Company.

CHAPTER 1 Clinically Relevant Basics of Pacing and Defi brillation 15
the same as that in the fi rst position, except that an O
in this position represents lack of sensing in any cham-
ber, i.e. fi xed-rate pacing. (Manufacturers may use an
S in both the fi rst and the second positions to indicate
single-chamber capability that can be used in either
the atrium or the ventricle.)
The third position designates the mode of sensing,
i.e. how the device responds to a sensed event. I indi-
cates that the device inhibits output when an intrin-
sic event is sensed and starts a new timing interval. T
implies that an output pulse is triggered in response
to a sensed event. D indicates that the device is ca-
pable of dual modes of response (applicable only in
dual-chamber systems).
The fourth position refl ects both programmabil-
ity and rate modulation. O indicates that none of the
pacemaker settings can be changed by noninvasive
programming, P suggests “simple” programmability
(i.e. one or two variables can be modifi ed), M indi-
cates multiprogrammability (three or more variables
can be modifi ed) and C indicates that the device has
telemetry capability and can communicate nonin-
vasively with the programmer (which also implies
multiprogrammability). Finally, an R in the fourth
position designates rate-responsive capability. This
means that the pacemaker has some type of sensor to
modulate the heart rate independent of the intrinsic
heart rate. All modern devices are multiprogramma-
ble and have telemetry capability; therefore, the R to
designate rate-responsive capability is the most com-
monly used currently.
The fi fth position was originally used to identify
antitachycardia treatment functions. However, this
has been changed, and antitachycardia options are
no longer included in the nomenclature. The fi fth
position now indicates whether multisite pacing is
not present (O), or present in the atrium (A), ven-
tricle (V) or both (D). Multisite pacing is defi ned for
this purpose as stimulation sites in both atria, both
ventricles, more than one stimulation site in any sin-
gle chamber, or any combination of these.
All pacemaker functions (whether single- or dual-
chamber) are based on timing cycles. Even the function
of the most complex devices can be readily understood
by applying the principles of pacemaker timing inter-
vals. This understanding is critical to accurate inter-
pretation of pacemaker electrocardiograms, especially
during troubleshooting. Pacemaker timing cycles are
described in detail in Chapter 7: Timing Cycles.
Defi brillation basics
In 1899, Prevost and Battelli58 noted that the “fi brilla-
tory tremulations produced in the dog” could be ar-
rested with the reestablishment of the normal heartbeat
if one submitted the animal “to passages of current of
high voltage.” Despite these early observations, decades
elapsed before broad clinical applicability fueled inter-
est in more widespread investigation of the mechanism
underlying defi brillation. With the development of in-
ternal defi brillators in the late 1970s came a greater need
to quantify defi brillation effectiveness, to understand
the factors governing waveform and lead design, and to
determine the effect of pharmacological agents on de-
fi brillation. Remarkably, much of this work was done
without a complete understanding of the fundamental
mechanism of defi brillation.
This section reviews the emerging insights to the
electrophysiological effects of shocks and how they are
related to defi brillation. It also reviews the means of
assessing the effi cacy of defi brillation (the “defi bril-
lation threshold”) and the important effects of wave-
form, lead design and placement, and pharmacologi-
cal agents on defi brillation, with an emphasis on those
principles pertaining to clinical practice.
Electrophysiological effects of defi brillation shocks; antitachycardia pacingDespite great strides made in understanding the tech-
nology required for defi brillation (e.g. lead design and
position, waveform selection), the basic underlying
mechanisms have not been defi nitively determined.
A few contemporary theories accounting for how an
electric shock terminates fi brillation coexist with some
overlapping: critical mass, upper limit of vulnerability,
progressive depolarization, and virtual electrode depo-
larization. These are discussed below in brief.
First, a brief review of the cardiac action potential
will be useful to facilitate discussion of the effects of de-
fi brillation. The surface electrocardiogram and intra-
cardiac electrogram, common in clinical practice, are
the result of extracellular potentials generated by myo-
cardial action potential propagation. An action poten-
tial is the transmembrane voltage in a single myocyte
over time (Fig. 1.17). The action potential upstroke
(phase 0, or depolarization) is mediated by sodium ion
fl ow through voltage-sensitive selective channels, and
during ventricular activation it is registered on the sur-
16 Cardiac Pacing, Defi brillation and Resynchronization: A Clinical Approach
face electrocardiogram as the QRS complex (Fig. 1.18).
Repolarization (phase 3) of ventricular myocardium
generates the surface electrocardiographic T wave. In
its resting state, the myocardium is excitable, and a pac-
ing stimulus, or current injected by the depolarization
of a neighboring myocyte, can bring the membrane po-
tential to a threshold value, above which a new action
potential ensues. The ability of the action potential of
a myocyte to depolarize adjacent myocardium results
in propagation of electrical activity through cardiac
tissue. Importantly, immediately after depolarization,
the myocardium is refractory and cannot be stimulated
to produce another action potential until it has recov-
ered excitability (Fig. 1.19). The interval immediately
after an action potential, during which another action
potential cannot be elicited by a pacing stimulus, is re-
ferred to as the “refractory period.”
Ventricular fi brillation (VF) is the most common
cause of sudden death. VF results when an electrical
wavebreak induces re-entry and results in a cascade of
new wavebreaks. In patients with a structurally abnor-
mal or diseased heart, the underlying tissue hetero-
geneity results in a predisposition to wavebreak, then
re-entry, and fi nally fi brillation.59 These wandering
wavelets are self-sustaining once initiated. In the 1940s,
Gurvich and Yuniev60 predicted that electric shocks led
to premature tissue stimulation in advance of propa-
gating wavefronts, preventing continued progression
of the wavefront. This concept of defi brillation as a
large-scale stimulation remains a central tenet of many
of the currently held theories of defi brillation.
Critical massThe critical mass theory proposed that shocks need
only eliminate fi brillatory wavelets in a critical amount
of myocardium to extinguish the arrhythmia. Experi-
ments in canine models found that injection of potassi-
um chloride (which depolarizes myocardium, render-
ing it unavailable for fi brillation) into the right coronary
artery or the left circumfl ex artery failed to terminate
VF as often as injection into both the left circumfl ex
and the left anterior descending arteries together. Simi-
larly, electrical shocks of equal magnitude terminated
fi brillation most frequently when the electrodes were
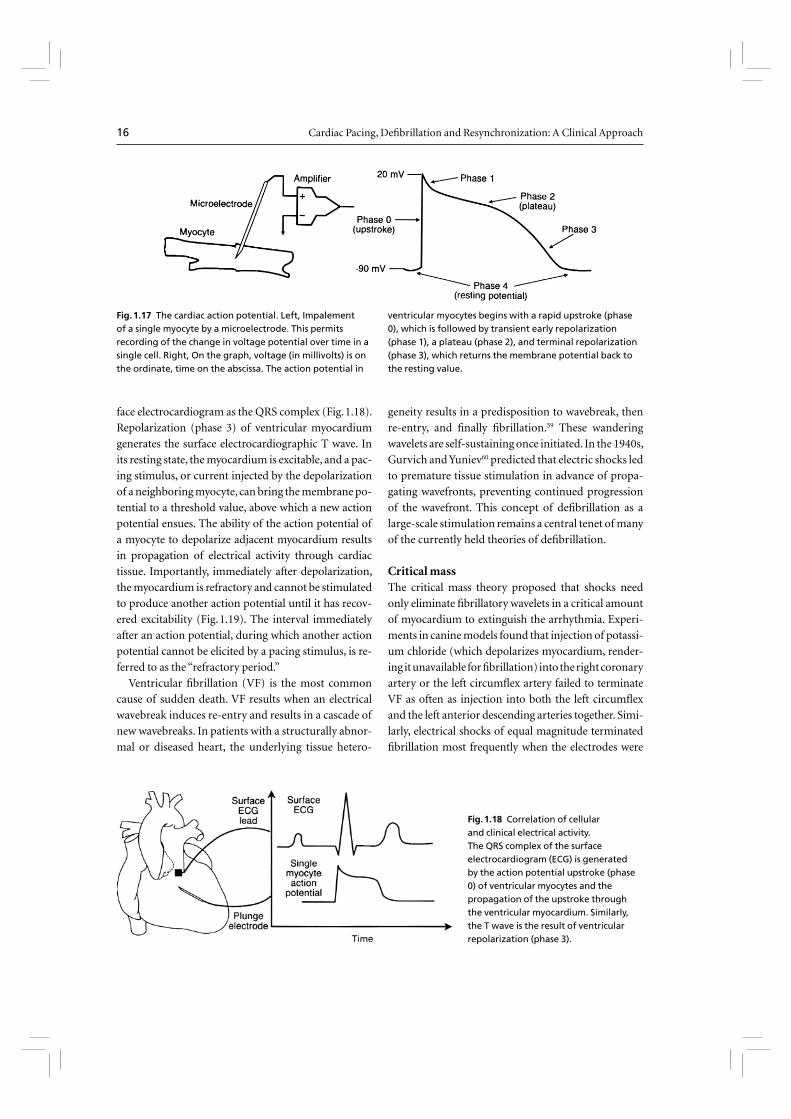
Fig. 1.17 The cardiac action potential. Left, Impalement of a single myocyte by a microelectrode. This permits recording of the change in voltage potential over time in a single cell. Right, On the graph, voltage (in millivolts) is on the ordinate, time on the abscissa. The action potential in
ventricular myocytes begins with a rapid upstroke (phase 0), which is followed by transient early repolarization (phase 1), a plateau (phase 2), and terminal repolarization (phase 3), which returns the membrane potential back to the resting value.
Fig. 1.18 Correlation of cellular and clinical electrical activity. The QRS complex of the surface electrocardiogram (ECG) is generated by the action potential upstroke (phase 0) of ventricular myocytes and the propagation of the upstroke through the ventricular myocardium. Similarly, the T wave is the result of ventricular repolarization (phase 3).
CHAPTER 1 Clinically Relevant Basics of Pacing and Defi brillation 17
positioned at the right ventricular apex and the pos-
terior left ventricle, as opposed to two right ventricu-
lar electrodes. Thus, it was concluded that if a “critical
mass” of myocardium was rendered unavailable for
VF either by potassium injection or by defi brillatory
shock, the remaining excitable tissue was insuffi cient
to support the wandering wavelets, and the arrhythmia
terminated.61 However, it was not critical to depolarize
every ventricular cell to terminate fi brillation.
Upper limit of vulnerabilityStudies mapping electrical activation after failed shocks
led to several observations not accounted for by the
critical mass hypothesis, giving rise to the upper limit
of vulnerability theory. First, an isoelectric interval (an
electrical pause) was seen after failed shocks before re-
sumption of fi brillation. The relatively long pause sug-
gested that VF was terminated by the shock and then
secondarily regenerated by it (Fig. 1.20).62 The concept
that failed shocks are unsuccessful because they give rise
to a new focus of fi brillation rather than because they
fail to halt continuing wavelets was further buttressed
by a second observation—that postshock conduction
patterns were not the continuation of preshock wave-
fronts.63 If a failed shock resulted from the inability to
halt continuing fi brillation, the assumption was that the
postshock wavefronts should be a continuation of the
propagating wavefronts present before shock delivery
and that new wavefronts at sites remote from the pre-
shock wavefronts would not be expected. Furthermore,
VF was frequently reinitiated in the regions of lowest
shock intensity, suggesting that these low-intensity re-
gions were responsible for reinitiating fi brillation.
Elegant mapping studies demonstrated that shocks
with potential gradients less than a minimum critical
value—termed the upper limit of vulnerability (ULV)
(6 V/cm for monophasic shocks, 4 V/cm for biphasic
shocks)—could induce fi brillation when applied to
myocardium during its vulnerable period. Low-energy
shocks did so by creating regions of functional block in
vulnerable myocardium at “critical points” that initi-
ated re-entry and subsequent fi brillation.64 Figure 1.21
depicts the vulnerable zone during normal sinus
rhythm. In sinus rhythm, low-energy shocks delivered
during the T wave induce VF; higher energy shocks—
with energy above the ULV—do not. Since at any
given time during fi brillation a number of myocardial
regions are repolarizing and thus vulnerable, a shock
with a potential gradient below the ULV may create a
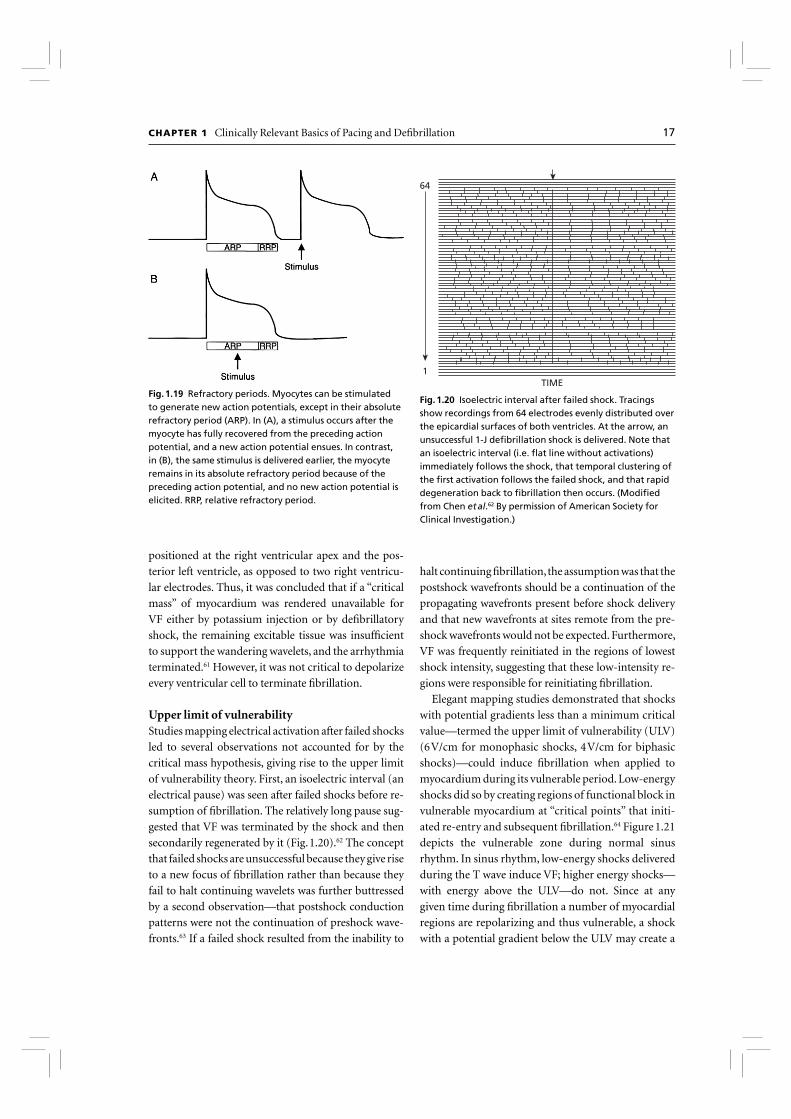
Fig. 1.19 Refractory periods. Myocytes can be stimulated to generate new action potentials, except in their absolute refractory period (ARP). In (A), a stimulus occurs after the myocyte has fully recovered from the preceding action potential, and a new action potential ensues. In contrast, in (B), the same stimulus is delivered earlier, the myocyte remains in its absolute refractory period because of the preceding action potential, and no new action potential is elicited. RRP, relative refractory period.
64
TIME1
Fig. 1.20 Isoelectric interval after failed shock. Tracings show recordings from 64 electrodes evenly distributed over the epicardial surfaces of both ventricles. At the arrow, an unsuccessful 1-J defi brillation shock is delivered. Note that an isoelectric interval (i.e. fl at line without activations) immediately follows the shock, that temporal clustering of the fi rst activation follows the failed shock, and that rapid degeneration back to fi brillation then occurs. (Modifi ed from Chen et al.62 By permission of American Society for Clinical Investigation.)

18 Cardiac Pacing, Defi brillation and Resynchronization: A Clinical Approach
critical point and reinitiate fi brillation. Conversely, a
shock with a gradient above the ULV across the en-
tire myocardium does not reinduce VF and should
therefore succeed. During defi brillator testing, shocks
are intentionally delivered in the vulnerable zone to
induce fi brillation (Fig. 1.22), and the zone of vulner-
ability has been defi ned in humans.65 The fact that the
vulnerable zone exists and that the ULV has been cor-
related with the defi brillation threshold supports the
ULV hypothesis as a mechanism of defi brillation.66
Progressive depolarizationA third theory of defi brillation, the progressive depo-
larization theory (also referred to as the “refractory
period extension theory”) incorporates some ele-
ments of both critical mass and ULV theories. Using
voltage-sensitive optical dyes, Dillon and Kwaku67 have
demonstrated that shocks of suffi cient strength were
able to elicit active responses, even from supposedly
refractory myocardium. Thus, as seen in Fig. 1.23A,
the duration of an action potential can be prolonged
(and the refractory period extended) despite refrac-
tory myocardium when a suffi ciently strong shock is
applied.68 This phenomenon may result from sodium
channel reactivation by the shock. The degree of ad-
ditional depolarization time is a function of both
shock intensity and shock timing.69 Since the shock
stimulates new action potentials in myocardium that
is late in repolarization and produces additional de-
polarization time when the myocardium is already
depolarized, myocardial resynchronization occurs.
This is manifested by myocardial repolarization at
a constant time after the shock (second dashed line
in Fig. 1.23, labeled “constant repolarization time”).
Thus, the shock that defi brillates extends overall
ventricular refractoriness, limiting the excitable tis-
sue available for fi brillation. It thus extinguishes
continuing wavelets and resynchronizes repolariza-
tion, so that distant regions of myocardium become
excitable simultaneously, preventing dispersion of
refractoriness and renewed re-entry. Experimental
evidence has demonstrated that shocks with a poten-
tial gradient above the ULV result in time-depend-
ent extension of the refractory period. In contrast,
lower- energy shocks may result in a graded response
that could create transient block and a critical point,
thereby reinducing fi brillation.69
Virtual electrode depolarizationMore recently, optical signal measurements of trans-
Fig. 1.21 Window of vulnerability during sinus rhythm. During sinus rhythm, the ventricles are vulnerable to ventricular fi brillation (VF) when a shock is delivered on the T wave, in the vulnerable window. To induce fi brillation, the shock energy must be greater than the fi brillation threshold and below the upper limit of vulnerability (ULV). Shocks with energy above the upper limit of vulnerability do not induce fi brillation. Since during VF there is
dyssynchrony of activation, at any given instant a number of regions are repolarizing (equivalent to the T wave in sinus rhythm), so that a shock with a gradient that is less than the ULV can reinduce fi brillation in these regions. In contrast, shocks with energy above the ULV throughout the myocardium cannot reinitiate VF and are successful. The ULV is correlated with the defi brillation threshold. Further details appear in the text.

CHAPTER 1 Clinically Relevant Basics of Pacing and Defi brillation 19
membrane potentials have demonstrated the concept
of the “virtual electrode.” 70 The virtual electrode effect
makes the defi brillation electrode effectively much larger
than the physical electrode. In the virtual electrode, the
anode cells are brought close to their resting potential,
increasing their responsiveness to stimulation. More im-
portantly, the region of depolarization or hyperpolari-
zation near the physical electrode is surrounded by re-
gions with opposite polarity. Anodal shocking produces
a wavefront which begins at the boundary of positively
charged regions and then spreads in the direction of
the negatively charged region of physical anode.71 This
produces “collapsing” wavefronts that frequently collide
and neutralize one another and thereby are less likely to
result in a sustained arrhythmia (Fig. 1.24).72 This theo-
ry incorporates many aspects of the above-mentioned
mechanisms.
To summarize and to put defi brillation theory into
clinical perspective, the effects of the application of
a voltage gradient across myocardium are a function
of fi eld strength and timing. Although the biological
effects of shocks may overlap, this concept is summa-
rized in Fig. 1.25. Extremely low energy pulses may
have no effect on the myocardium. Stronger pulses
(in the microjoule range), such as those used for car-
diac pacing, result in action potential generation in
non-refractory myocardium, which leads to a propa-
gating impulse. With increasing electric fi eld strength
(to the 1-J area), VF can be induced with shocks de-
livered during the vulnerable period. Increasing the
shock strength above the ULV (and above the defi -
brillation threshold) puts the shock in the defi bril-
lation zone. Very high-energy shocks can lead to
toxic effects, including disruption of cell membranes,
postshock block, mechanical dysfunction and new
tachyarrythmias.69
Antitachycardia pacingThe concepts of basic myocardial function also explain
the mechanism of arrhythmia termination with ATP.
A
B
Fig. 1.22 Induction of ventricular fi brillation by a T-wave shock during testing of an implantable defi brillator. In (A), a 1-J shock is delivered 380 ms after the last paced beat. Fibrillation is not induced, because this shock is delivered outside the window of vulnerability. In (B), the timing of the shock is adjusted to 300 ms after the last paced complex, so that it is delivered more squarely on the T wave, in the window of vulnerability, and fi brillation is induced. The window of vulnerability is defi ned by both shock energy and timing. CD, charge delivered; FS, fi brillation sense; VP, ventricular pacing; VS, ventricular sensing.

20 Cardiac Pacing, Defi brillation and Resynchronization: A Clinical Approach
As an example, in monomorphic ventricular tachycar-
dia (VT) late after myocardial infarction, a re-entrant
circuit utilizing abnormal tissue adjacent to an infarct
is responsible for the arrhythmia (Fig. 1.26). For the
re-entrant circuit to perpetuate itself, the tissue im-
mediately in front of the leading edge of the wave-
front must have recovered excitability so that it can
be depolarized (Fig. 1.26). Thus, an excitable gap of
tissue must be present in advance of the leading tachy-
cardia wavefront or the arrhythmia will terminate.
ATP—delivered as a short burst of pacing impulses at
a rate slightly greater than the tachycardia rate—can
terminate VT by depolarizing the tissue in the excit-
able gap, so that the tissue in front of the advancing
VT wavefront becomes refractory, preventing further
arrhythmia propagation (Fig. 1.26B). The ability of a
train of impulses to travel to the site of the re-entrant
circuit and interrupt VT depends on several factors,
Fig. 1.23 Progressive depolarization. A fi brillatory wavefront is depicted by the arrow, and the action potential response to a defi brillatory shock is demonstrated at several points surrounding the wavefront. The fi brillatory wavefront has just passed through a myocyte at point A when the shock is delivered. The myocyte is in its plateau (phase 2), when it would ordinarily be refractory to additional stimulation. However, when a suffi ciently strong shock is delivered, the myocyte can generate an active response with prolongation of the action potential and of the refractory period. The response is referred to as “additional depolarization time.” The
tissue at point B is at the leading edge of the fi brillatory wavefront. The shock strikes this myocardium at the time of the upstroke (phase 0) and has little effect on the action potential. The tissue at point C is excitable (it is the excitable gap that the fi brillatory wave front was about to enter) when the shock is delivered. The shock elicits a new action potential in this excitable tissue. Despite the different temporal and anatomical locations of the three action potentials depicted, after the shock there is resynchronization by the “constant repolarization time.” This resynchronization helps prevent continuation of fi brillation.
Virtual cathode Virtual anode
Cathode Anode
(-) (+)
Fig. 1.24 The cathodal shocks (left) produce wavefronts that expand and propagate away from the right ventricular coil. In comparison, anodal shocks (right) produced wavefronts that collapse and propagate towards the right ventricular coil (Adapted with permission from Figure 4, Kroll et al.70 Present understanding of shock polarity for internal defi brillation: the obvious and non-obvious clinical implications).

CHAPTER 1 Clinically Relevant Basics of Pacing and Defi brillation 21
including the site of pacing (the closer to the circuit en-
trance, the greater the likelihood of circuit penetration
and termination), the length of the tachycardia cycle,
and the size of the excitable gap. With delivery of ATP,
faster and more remote circuits with smaller excitable
gaps are generally more diffi cult to terminate and have
a greater risk of degeneration to less organized tachy-
arrhythmias, including fi brillation.
To treat VT, ATP is delivered through a right ven-
tricular lead in ICDs. ATP has been applied success-
fully to treat slow VT (< 188–200 bpm, success rate
78–91%)73, and recently fast VT (200–250 bpm, suc-
cess rate 72–81%)74. These therapy success rates are
reinforced by the observation that ATP did not result
in an increased risk of acceleration of the arrhythmia,
syncope, or mortality in comparison with patients who
receive defi brillation shocks only.74 Patients with ATP,
rather than those programmed to defi brillation shocks
only, also report statistically higher quality of life of
scores. If ATP fails, or if the frequency of the VT is too
high to apply ATP, the device diverts immediately to
deliver a defi brillation shock. The use of ATP in the
ventricle is important in limiting shocks, and is further
discussed in Chapter 8. This chapter will also address
the empiric use of ATP that may directly impact future
appropriate shock therapies.
Fig. 1.25 Effects of increasing shock (electrical fi eld) strength on myocardial tissue.
Fig. 1.26 Re-entrant ventricular tachycardia circuit. In (A), a circuit around a fi xed scar is depicted by the arrow. The head of the arrow depicts the leading edge of the wavefront, and the body of the arrow back to the tail (colored gray) consists of tissue that is still refractory (since the wavefront has just propagated through it). The tissue between the tip and the tail of the arrow is excitable and is called the “excitable gap.” For the arrow head to continue its course around the
scar, an excitable gap must be present; if the wavefront encounters refractory tissue, it cannot proceed. In (B), a wavefront generated by an antitachycardia pacing impulse enters the excitable gap and terminates tachycardia. Tachycardias with a small excitable gap (i.e. the head of the arrow follows the tail very closely, so that only a small “moving rim” of excitable tissue is in the circuit) are more diffi cult to terminate with antitachycardia pacing.

22 Cardiac Pacing, Defi brillation and Resynchronization: A Clinical Approach
In addition to VT, atrial fi brillation and tachycardia
occur frequently in patients with cardiac dysfunction,
ventricular arrhythmias, and in patients with sinus
node dysfunction.75-77 ATP for atrial arrhythmias is
also successful, with atrial tachycardia termination
rates from 40 to 50%.78,79 In addition to termination
of the arrhythmia episode, ATP is also associated with
an overall reduction in atrial tachycardia/atrial fi bril-
lation burden.80 Due to the absence of studies demon-
strating clinically signifi cant improvements with atrial
ATP, its adoption in clinical practice has been modest.
This may evolve with further studies.
The mechanisms underlying the success and failure
of ATP are not fully understood. One theory is that ATP
failure may occur when the pacing electrode is located
too far from the re-entry core, and therefore unable
to terminate the arrhythmia orthodromic wavefront.81
However, this failure mechanism remains controver-
sial. For example, a comparison of left vs. right ven-
tricular ATP in induced VT showed both sites were
equally effective, which raises questions regarding a lo-
cation-dependent limitation.82 Nevertheless, a recent a
study examined the potential therapy modifi cation of
biventricular antitachycardia pacing rather than right
ventricular antitachycardia pacing to see if spatially
distributed leads would advance the orthodromic
wavefront and increase the likelihood of arrhythmia
termination.83 Although biventricular antitachycardia
pacing was found to be superior in a rabbit model in
terminating VT, there was also a theoretical increased
risk of VT acceleration. This risk was not observed
clinically in a study of patients who underwent cardiac
resynchronization and ICD implantation, in which a
signifi cantly higher number of successful VT termina-
tion episodes were observed when biventricular ATP
was used.84 Next, the MIRACLE ICD trial showed that
biventricular ATP improved VT termination, includ-
ing those VTs that were classifi ed as fast.85 Finally, the
ADVANCE CRT-D trial is an ongoing prospective trial
that will examine the effi cacy of right ventricular vs.
biventricular ATP to terminate all types of VT.86
A promising new approach that is founded on the
concepts of ATP is to deliver a low-voltage shock to
“unpin” re-entry from its stationary core.81,87 The meth-
od relies on the effect of virtual electrode polarization,
which predicts hyperpolarization and depolarization
on opposite sides of functional or anatomical hetero-
geneity that can result in secondary sources of exci-
tation.81 When a low voltage shock is properly timed,
all possible re-entry cores are simultaneously excited,
which effectively destabilizes and unpins a re-entrant
arrhythmia. In an experimental model using rabbits,
the unpinning method terminated VT in all prepara-
tions, in comparison with 63% of preparations treated
with standard ATP only. Although 35% of the prepara-
tions treated with unpinning fi rst also required ATP,
the study data suggested that this potential therapy was
as effective as or potentially more effective than ATP
for terminating stable, pinned re-entrant arrhythmias.
Although promising, the role of unpinning in clinical
practice is not yet established.
Measuring the effi cacy of defi brillation
Threshold and dose–response curveAt the time of defi brillator insertion, it is important to
determine whether the system implanted can success-
fully terminate fi brillation. A measure frequently used
to assess the ability of a system to terminate VF is the
defi brillation threshold (DFT). The term “threshold”
suggests that there is a threshold energy above which
defi brillation is uniformly successful and below which
shocks fail (Fig. 1.27A). The multitude of factors that
affect whether a shock will succeed—patient charac-
teristics, fi brillation duration, degree of ischemia and
potassium accumulation, distribution of electrical ac-
tivation at the time of the shock, circulating pharma-
cological agents, and others—result in defi brillation
behavior that is best modeled as a random variable,
with a calculable probability of success for any given
shock strength. Thus, defi brillation is more accurately
described by a dose–response curve, with an increas-
ing probability of success as the defi brillation energy
increases (Fig. 1.27B). The curve can be characterized
by its slope and intercept, and specifi c points on the
curve can be identifi ed, such as ED50
, the energy dose
with a 50% likelihood of success. Factors adversely af-
fecting defi brillation shift the curve to the right, so that
a higher dose of energy is required to achieve a 50%
likelihood of success, and improvements in defi bril-
lation (such as superior lead position and improved
waveforms or lead design) shift the curve to the left
(Fig. 1.28). Because of the large number of fi brillation
episodes required to defi ne a curve (30–40 induc-
tions), the dose–response curve is not determined in
clinical practice, but it remains a useful research tool
and conceptual framework.

CHAPTER 1 Clinically Relevant Basics of Pacing and Defi brillation 23
Relationship between defi brillation threshold and dose–response curveIf defi brillation is best described as a dose–response
curve, where on the curve does the DFT exist (i.e. what
is the probability of successful defi brillation at the clin-
ically used DFT energy)? The probability of successful
defi brillation at the DFT energy depends on the steps
taken to defi ne the threshold. Consider a step-down to
failure DFT, in which shocks are delivered beginning at
a relatively high energy (e.g. energy with a 99% success
rate) and decremented by several joules with each VF
induction until a shock fails (at which point a rescue
shock is delivered). The DFT in this protocol is defi ned
as the lowest energy shock that succeeds (Fig. 1.29).
Since the initial energies tested are at the upper end of
the dose–response curve, successive shocks may have a
98%, 95%, 88%, 85% (and so on) likelihood of success,
depending on the starting energy and size of the steps
taken. Despite the fairly high likelihood of success for
each shock individually, the sheer number of shocks
delivered in this range on average result in a shock fail-
ing (thus defi ning the DFT) at a relatively high point
on the curve. If this process is repeated many times, a
population of DFTs is created, with a mean and expect-
ed range. In humans, step-down to failure algorithms
Fig. 1.27 Defi brillation “threshold.” (A) The expected response to shock if a true threshold value existed. In reality, the likelihood of success is a sigmoidal dose–response curve, as shown in (B). The ED50 is the energy dose with a 50% likelihood of success, and so on.
100
80
60
40
20Pro
bab
ility
of
succ
ess
(%)
00 10 20
Defibrillation energy (J)
ED50
Immediate
Delayed
30 40 50
Fig. 1.28 Use of dose–response curve to measure effects of an intervention on defi brillation effi cacy. The graph shows the effect of thoracotomy on defi brillation in a canine model. The “immediate” group had defi brillation threshold testing done immediately after thoracotomy. Note that the curve is shifted to the right and that the energy with a 50% probability of success is 27 J, compared with 15 J for the “delayed” group, which was allowed 48–72 h of recovery before defi brillation testing.
Defi brillation is more effective in the “delayed” group because the probability of success at a given energy is higher in this group. Thus, the curves graphically display diminished defi brillation effi cacy immediately after thoracotomy. (From Friedman PA, Stanton MS. Thoracotomy elevates the defi brillation threshold and modifi es the defi brillation dose–response curve. J Cardiovasc Electrophysiol 1997; 8:68–73. By permission of Futura Publishing Company.)
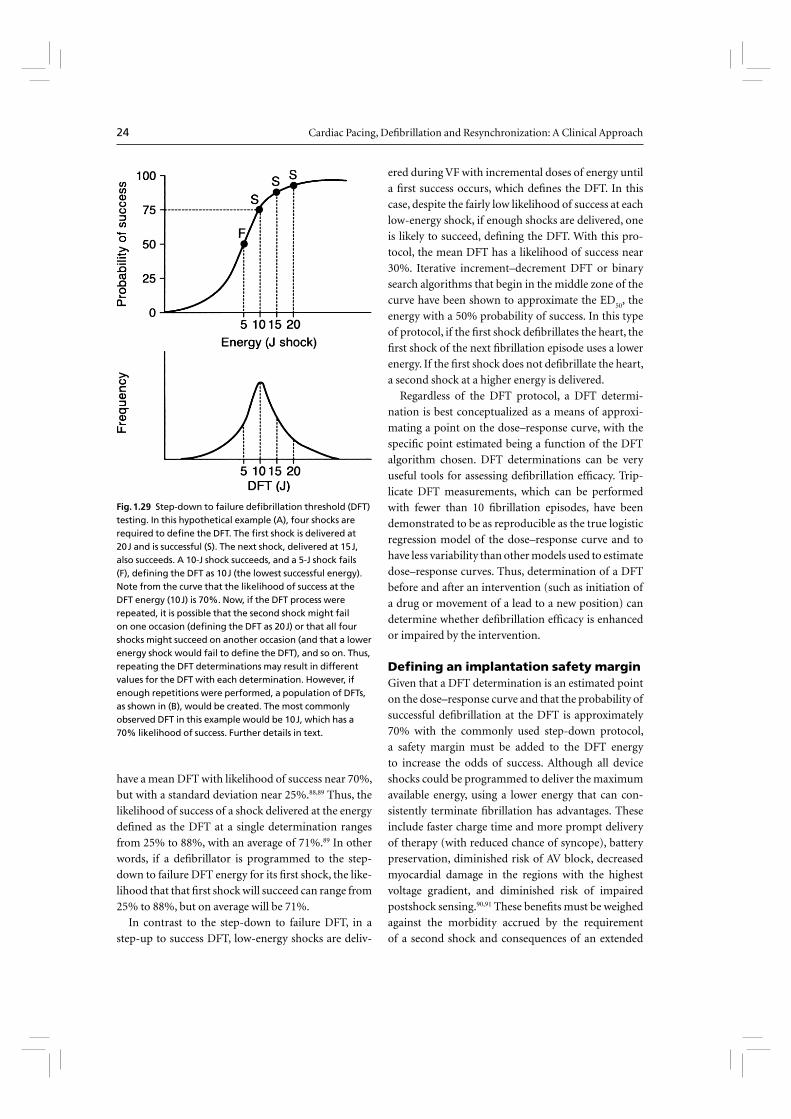
24 Cardiac Pacing, Defi brillation and Resynchronization: A Clinical Approach
have a mean DFT with likelihood of success near 70%,
but with a standard deviation near 25%.88,89 Thus, the
likelihood of success of a shock delivered at the energy
defi ned as the DFT at a single determination ranges
from 25% to 88%, with an average of 71%.89 In other
words, if a defi brillator is programmed to the step-
down to failure DFT energy for its fi rst shock, the like-
lihood that that fi rst shock will succeed can range from
25% to 88%, but on average will be 71%.
In contrast to the step-down to failure DFT, in a
step-up to success DFT, low-energy shocks are deliv-
ered during VF with incremental doses of energy until
a fi rst success occurs, which defi nes the DFT. In this
case, despite the fairly low likelihood of success at each
low-energy shock, if enough shocks are delivered, one
is likely to succeed, defi ning the DFT. With this pro-
tocol, the mean DFT has a likelihood of success near
30%. Iterative increment–decrement DFT or binary
search algorithms that begin in the middle zone of the
curve have been shown to approximate the ED50
, the
energy with a 50% probability of success. In this type
of protocol, if the fi rst shock defi brillates the heart, the
fi rst shock of the next fi brillation episode uses a lower
energy. If the fi rst shock does not defi brillate the heart,
a second shock at a higher energy is delivered.
Regardless of the DFT protocol, a DFT determi-
nation is best conceptualized as a means of approxi-
mating a point on the dose–response curve, with the
specifi c point estimated being a function of the DFT
algorithm chosen. DFT determinations can be very
useful tools for assessing defi brillation effi cacy. Trip-
licate DFT measurements, which can be performed
with fewer than 10 fi brillation episodes, have been
demonstrated to be as reproducible as the true logistic
regression model of the dose–response curve and to
have less variability than other models used to estimate
dose–response curves. Thus, determination of a DFT
before and after an intervention (such as initiation of
a drug or movement of a lead to a new position) can
determine whether defi brillation effi cacy is enhanced
or impaired by the intervention.
Defi ning an implantation safety marginGiven that a DFT determination is an estimated point
on the dose–response curve and that the probability of
successful defi brillation at the DFT is approximately
70% with the commonly used step-down protocol,
a safety margin must be added to the DFT energy
to increase the odds of success. Although all device
shocks could be programmed to deliver the maximum
available energy, using a lower energy that can con-
sistently terminate fi brillation has advantages. These
include faster charge time and more prompt delivery
of therapy (with reduced chance of syncope), battery
preservation, diminished risk of AV block, decreased
myocardial damage in the regions with the highest
voltage gradient, and diminished risk of impaired
postshock sensing.90,91 These benefi ts must be weighed
against the morbidity accrued by the requirement
of a second shock and consequences of an extended
Fig. 1.29 Step-down to failure defi brillation threshold (DFT) testing. In this hypothetical example (A), four shocks are required to defi ne the DFT. The fi rst shock is delivered at 20 J and is successful (S). The next shock, delivered at 15 J, also succeeds. A 10-J shock succeeds, and a 5-J shock fails (F), defi ning the DFT as 10 J (the lowest successful energy). Note from the curve that the likelihood of success at the DFT energy (10 J) is 70%. Now, if the DFT process were repeated, it is possible that the second shock might fail on one occasion (defi ning the DFT as 20 J) or that all four shocks might succeed on another occasion (and that a lower energy shock would fail to defi ne the DFT), and so on. Thus, repeating the DFT determinations may result in different values for the DFT with each determination. However, if enough repetitions were performed, a population of DFTs, as shown in (B), would be created. The most commonly observed DFT in this example would be 10 J, which has a 70% likelihood of success. Further details in text.
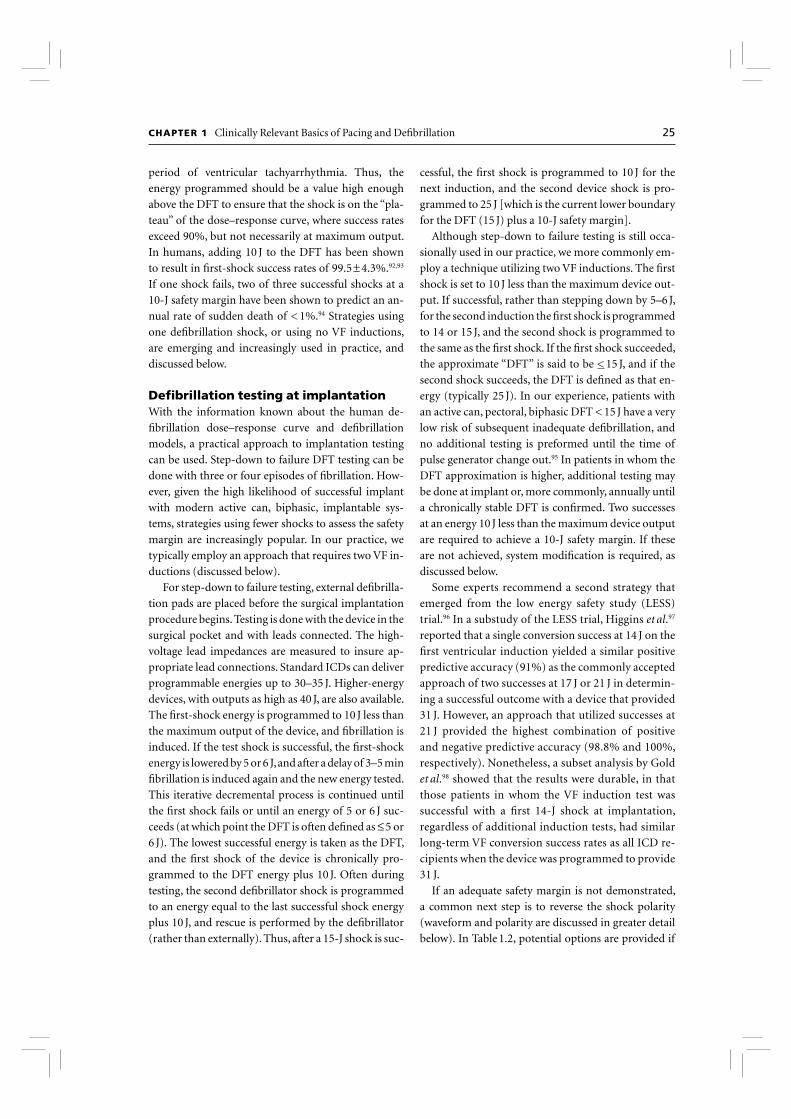
CHAPTER 1 Clinically Relevant Basics of Pacing and Defi brillation 25
period of ventricular tachyarrhythmia. Thus, the
energy programmed should be a value high enough
above the DFT to ensure that the shock is on the “pla-
teau” of the dose–response curve, where success rates
exceed 90%, but not necessarily at maximum output.
In humans, adding 10 J to the DFT has been shown
to result in fi rst-shock success rates of 99.5 ± 4.3%.92,93
If one shock fails, two of three successful shocks at a
10-J safety margin have been shown to predict an an-
nual rate of sudden death of < 1%.94 Strategies using
one defi brillation shock, or using no VF inductions,
are emerging and increasingly used in practice, and
discussed below.
Defi brillation testing at implantation With the information known about the human de-
fi brillation dose–response curve and defi brillation
models, a practical approach to implantation testing
can be used. Step-down to failure DFT testing can be
done with three or four episodes of fi brillation. How-
ever, given the high likelihood of successful implant
with modern active can, biphasic, implantable sys-
tems, strategies using fewer shocks to assess the safety
margin are increasingly popular. In our practice, we
typically employ an approach that requires two VF in-
ductions (discussed below).
For step-down to failure testing, external defi brilla-
tion pads are placed before the surgical implantation
procedure begins. Testing is done with the device in the
surgical pocket and with leads connected. The high-
voltage lead impedances are measured to insure ap-
propriate lead connections. Standard ICDs can deliver
programmable energies up to 30–35 J. Higher-energy
devices, with outputs as high as 40 J, are also available.
The fi rst-shock energy is programmed to 10 J less than
the maximum output of the device, and fi brillation is
induced. If the test shock is successful, the fi rst-shock
energy is lowered by 5 or 6 J, and after a delay of 3–5 min
fi brillation is induced again and the new energy tested.
This iterative decremental process is continued until
the fi rst shock fails or until an energy of 5 or 6 J suc-
ceeds (at which point the DFT is often defi ned as ≤ 5 or
6 J). The lowest successful energy is taken as the DFT,
and the fi rst shock of the device is chronically pro-
grammed to the DFT energy plus 10 J. Often during
testing, the second defi brillator shock is programmed
to an energy equal to the last successful shock energy
plus 10 J, and rescue is performed by the defi brillator
(rather than externally). Thus, after a 15-J shock is suc-
cessful, the fi rst shock is programmed to 10 J for the
next induction, and the second device shock is pro-
grammed to 25 J [which is the current lower boundary
for the DFT (15 J) plus a 10-J safety margin].
Although step-down to failure testing is still occa-
sionally used in our practice, we more commonly em-
ploy a technique utilizing two VF inductions. The fi rst
shock is set to 10 J less than the maximum device out-
put. If successful, rather than stepping down by 5–6 J,
for the second induction the fi rst shock is programmed
to 14 or 15 J, and the second shock is programmed to
the same as the fi rst shock. If the fi rst shock succeeded,
the approximate “DFT” is said to be < 15 J, and if the
second shock succeeds, the DFT is defi ned as that en-
ergy (typically 25 J). In our experience, patients with
an active can, pectoral, biphasic DFT < 15 J have a very
low risk of subsequent inadequate defi brillation, and
no additional testing is preformed until the time of
pulse generator change out.95 In patients in whom the
DFT approximation is higher, additional testing may
be done at implant or, more commonly, annually until
a chronically stable DFT is confi rmed. Two successes
at an energy 10 J less than the maximum device output
are required to achieve a 10-J safety margin. If these
are not achieved, system modifi cation is required, as
discussed below.
Some experts recommend a second strategy that
emerged from the low energy safety study (LESS)
trial.96 In a substudy of the LESS trial, Higgins et al.97
reported that a single conversion success at 14 J on the
fi rst ventricular induction yielded a similar positive
predictive accuracy (91%) as the commonly accepted
approach of two successes at 17 J or 21 J in determin-
ing a successful outcome with a device that provided
31 J. However, an approach that utilized successes at
21 J provided the highest combination of positive
and negative predictive accuracy (98.8% and 100%,
respectively). Nonetheless, a subset analysis by Gold
et al.98 showed that the results were durable, in that
those patients in whom the VF induction test was
successful with a fi rst 14-J shock at implantation,
regardless of additional induction tests, had similar
long-term VF conversion success rates as all ICD re-
cipients when the device was programmed to provide
31 J.
If an adequate safety margin is not demonstrated,
a common next step is to reverse the shock polarity
(waveform and polarity are discussed in greater detail
below). In Table 1.2, potential options are provided if

26 Cardiac Pacing, Defi brillation and Resynchronization: A Clinical Approach
an adequate safety margin is not demonstrated. Cur-
rently available devices also allow the programming
of multiple potential confi gurations to alter the shock
vector [e.g. exclusion of the superior vena cava coil,
or of the can (particularly if it is placed in the right
chest), etc.]. If implantation criteria are still not met,
some devices permit waveform pulse width adjust-
ment (discussed below). Alternatively, a high-output
device is used, leads are repositioned if it is thought
that lead position can be improved, or an additional
endovascular lead is added in systems that permit it. If
these approaches fail, a subcutaneous lead is added (see
Chapter 5 for implantation technique). Using biphasic
waveforms, we have found that subcutaneous leads are
required in only 3.7% of devices implanted.99
In a single-center observational study of three types
of subcutaneous leads (single-element subcutaneous
array electrode, three-fi nger electrodes, subcutaneous
patch electrodes), all types performed well without
a signifi cant change in defi brillation threshold ob-
served.100 Although there was no signifi cant difference
in complications, 7.3–9.5% of patients developed a
major complication (predominantly lead fracture).
Therefore, with use of a subcutaneous ICD lead,
patients require close follow-up with routine chest
radiographs.
There are many factors that may result in elevated
defi brillation threshold. These include drug therapy,
underlying cardiac disease, the size, confi guration and
number of defi brillating leads, the time that VF per-
sists before shock delivery, ischemia, hypoxia, ampli-
tude of the VF waveform, temperature, heart weight,
body weight, direction of the delivered shock and
waveform, and chronicity of lead implantation.101 In
patients with inherited channelopathies, such as Bru-
gada syndrome, high defi brillation thresholds may be
prevalent and problematic.102 In one series of patients
who received a high-output generator for an elevated
defi brillation threshold, the majority had underlying
coronary artery disease, with reduced left ventricular
function, and were on amiodarone.101 An important
fi nding in this study was that in patients with high de-
fi brillation thresholds who receive an ICD, arrhythmia
death remained a signifi cant long-term risk (42% of
the deaths were arrhythmia related).
An interesting observation is that there is a circadian
variation in the defi brillation threshold. The defi bril-
lation threshold has a morning peak that is 16% higher
than that measured after noon.103 In addition, the fi rst
failed shock rate is more often in the morning com-
pared with other times during the day. This variability
in defi brillation threshold is clinically important in
patients with high thresholds, in whom a 10-J safety
margin becomes more diffi cult to achieve.
Finally, with the advent of newer ICD technolo-
gies that utilize different waveforms and allow vari-
ous shock confi gurations, some investigators have
begun to ask whether DFT testing is required. In
general the likelihood of a high DFT is low. However,
in one contemporary observation study > 6% of pa-
tients required modifi cation of their ICD system due
to an inadequate safety margin.104 In some patients
DFT testing is postponed due to other comorbid ill-
ness, such as an individual with atrial fi brillation and
not on anticoagulation. These patients may account
for up to 5% of patients who undergo ICD implan-
tation. In considering the decision to perform DFT
testing, other potential benefi ts of the study must be
considered. For example, DFT testing may identify
lead dysfunction, demonstrates appropriate sensing
and charging of the device, and in general test the
complete system integrity.105 These benefi ts must be
Reverse the shock polarity
Change shock confi guration (example tip-to-generator, ring-to-generator,
tip-to-coil)
Waveform modifi cation if available with the generator
Exchange the generator to a “high-output” device
Exclude if possible drugs that increase the defi brillation threshold
Add a superior vena cava coil
Add a subcutaneous array or patch
Move the generator to a left pectoral position if located on the right
Table 1.2 Options in a patient with high energy requirements or an inadequate safety margin at defi brillation threshold testing.

CHAPTER 1 Clinically Relevant Basics of Pacing and Defi brillation 27
weighed against the risks of the procedure. Contrain-
dications to ICD implant testing have been published,
and are listed in Table 1.3.106
Upper limit of vulnerability to assess safety marginAs previously discussed, the ULV is the lowest energy
above which shocks delivered during the vulnerable
period do not induce fi brillation. Numerous studies
have demonstrated that the DFT and ULV are strongly
linked.107-110 Since the DFT and ULV are correlated,
some investigators have suggested that ULV determi-
nations could be performed to assess defi brillation
effi cacy with one or no fi brillation episode.107 During
sinus rhythm, test shocks are delivered at the peak of the
T wave at initially high energies, with the energy level
subsequently decreased in steps until fi brillation is in-
duced, defi ning a shock that is below the ULV. Since the
ULV may be dependent on the coupling interval, ener-
gies are also delivered at various intervals before the
T-wave peak to “scan” repolarization. For conventional
biphasic waveforms, the ULV corresponds to a 90%
successful energy level, and it has been used to provide
adequate safety margins at cardioverter defi brillator
implantations and for long-term follow-up in clinical
protocols.111,112 However, since ULV assessment is an
indirect measure of defi brillation effi cacy, the relation-
ship between the ULV and the DFT may be affected by
numerous factors, including electrode confi guration,
pharmacological agents, and the protocol used to de-
termine the ULV. Important in the patient population
that receive an ICD, acute ischemia may reduce the
ULV. This phenomenon is felt to be due in part to con-
duction failure during acute ischemia.113 In some situ-
ations, the changes in ULV may not accurately refl ect
defi brillation effi cacy. Since ULV may result in device
testing with no VF induction, the R wave should be
> 7 mV to insure adequate sensing of VF. In the small
subset of patients with ULV > 20 J, some experts advo-
cate performing DFT testing at implant.114 Because of
the indirect nature of the ULV–DFT relationship and
the large body of clinical and experimental data based
on DFTs, ULV testing has only been adopted as routine
clinical practice in a few centers. If future ICDs adopt
automatic ULV testing (in which the device would
scan the T wave and determine appropriate shock tim-
ing), this technique may become more widespread due
to its ability to assess defi brillation effi cacy without VF
inductions in many patients and the possibility of au-
tomated testing by the ICD.
The importance of waveform
The shape of a defi brillating waveform can dramatically
affect its defi brillation effi cacy. In the canine model, for
example, Schuder et al.115 demonstrated that for trans-
Absolute contraindication
Risk of thromboembolism
Left atrial thrombus
Left-ventricular thrombus, not organized
Atrial fi brillation in the absence of anticoagulation
Inadequate anesthesia or anesthesia support
Known inadequate external defi brillation
Severe aortic stenosis
Critical, non-revascularized coronary artery disease with jeopardized
myocardium
Hemodynamic instability requiring inotropic support
Relative contraindication
Left ventricular mural thrombus with adequate systemic anticoagulation
Questionable external defi brillation (e.g. massive obesity)
Severe unrevascularized coronary artery disease
Recent coronary stent
Hemodynamic instability
Recent stroke or transient ischemic attack
Questionable stability of coronary venous lead
Table 1.3 Contraindications to ICD
implant testing106 (Reproduced with
permission from Blackwell Publishing.)
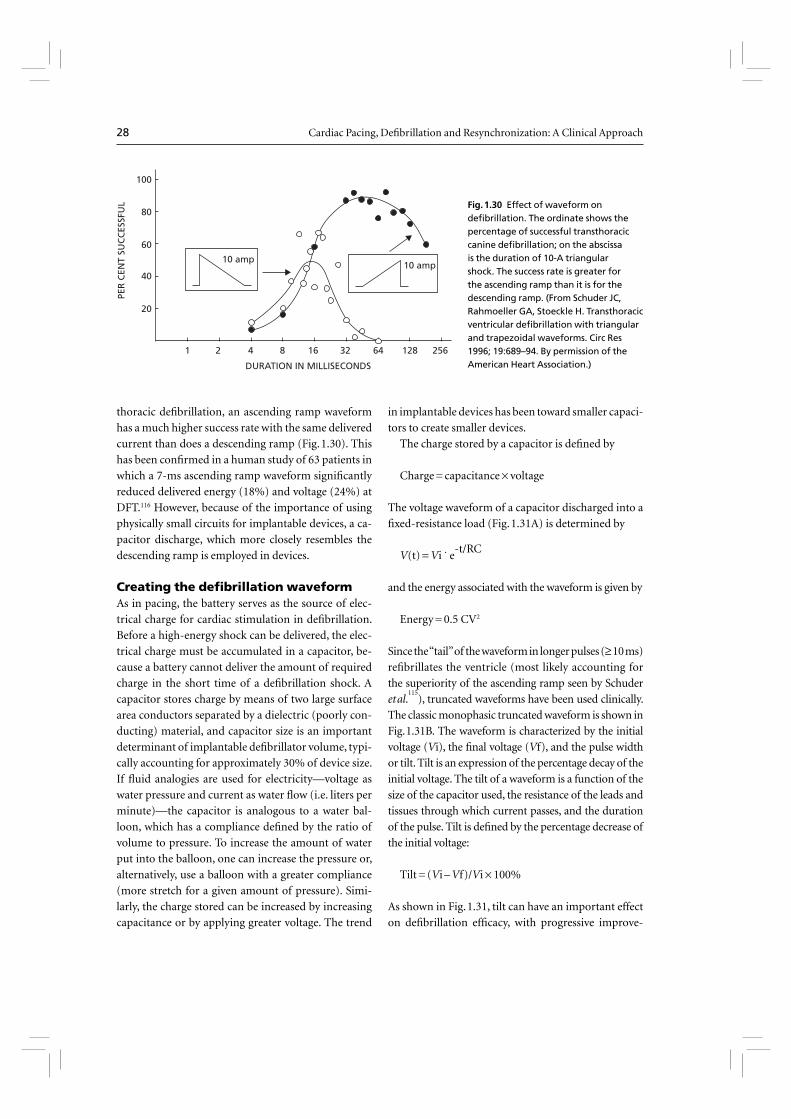
28 Cardiac Pacing, Defi brillation and Resynchronization: A Clinical Approach
thoracic defi brillation, an ascending ramp waveform
has a much higher success rate with the same delivered
current than does a descending ramp (Fig. 1.30). This
has been confi rmed in a human study of 63 patients in
which a 7-ms ascending ramp waveform signifi cantly
reduced delivered energy (18%) and voltage (24%) at
DFT.116 However, because of the importance of using
physically small circuits for implantable devices, a ca-
pacitor discharge, which more closely resembles the
descending ramp is employed in devices.
Creating the defi brillation waveformAs in pacing, the battery serves as the source of elec-
trical charge for cardiac stimulation in defi brillation.
Before a high-energy shock can be delivered, the elec-
trical charge must be accumulated in a capacitor, be-
cause a battery cannot deliver the amount of required
charge in the short time of a defi brillation shock. A
capacitor stores charge by means of two large surface
area conductors separated by a dielectric (poorly con-
ducting) material, and capacitor size is an important
determinant of implantable defi brillator volume, typi-
cally accounting for approximately 30% of device size.
If fl uid analogies are used for electricity—voltage as
water pressure and current as water fl ow (i.e. liters per
minute)—the capacitor is analogous to a water bal-
loon, which has a compliance defi ned by the ratio of
volume to pressure. To increase the amount of water
put into the balloon, one can increase the pressure or,
alternatively, use a balloon with a greater compliance
(more stretch for a given amount of pressure). Simi-
larly, the charge stored can be increased by increasing
capacitance or by applying greater voltage. The trend
in implantable devices has been toward smaller capaci-
tors to create smaller devices.
The charge stored by a capacitor is defi ned by
Charge = capacitance × voltage
The voltage waveform of a capacitor discharged into a
fi xed-resistance load (Fig. 1.31A) is determined by
V(t) = Vi ˙ e-t/RC
and the energy associated with the waveform is given by
Energy = 0.5 CV2
Since the “tail” of the waveform in longer pulses (≥ 10 ms)
refi brillates the ventricle (most likely accounting for
the superiority of the ascending ramp seen by Schuder
et al.115
), truncated waveforms have been used clinically.
The classic monophasic truncated waveform is shown in
Fig. 1.31B. The waveform is characterized by the initial
voltage (Vi), the fi nal voltage (Vf), and the pulse width
or tilt. Tilt is an expression of the percentage decay of the
initial voltage. The tilt of a waveform is a function of the
size of the capacitor used, the resistance of the leads and
tissues through which current passes, and the duration
of the pulse. Tilt is defi ned by the percentage decrease of
the initial voltage:
Tilt = (Vi – Vf)/Vi × 100%
As shown in Fig. 1.31, tilt can have an important effect
on defi brillation effi cacy, with progressive improve-
100
80
60
40
20
1 2 4 8 16
DURATION IN MILLISECONDS
PER
CEN
T SU
CC
ESSF
UL
32 64 128 256
10 amp10 amp
Fig. 1.30 Effect of waveform on defi brillation. The ordinate shows the percentage of successful transthoracic canine defi brillation; on the abscissa is the duration of 10-A triangular shock. The success rate is greater for the ascending ramp than it is for the descending ramp. (From Schuder JC, Rahmoeller GA, Stoeckle H. Transthoracic ventricular defi brillation with triangular and trapezoidal waveforms. Circ Res 1996; 19:689–94. By permission of the American Heart Association.)
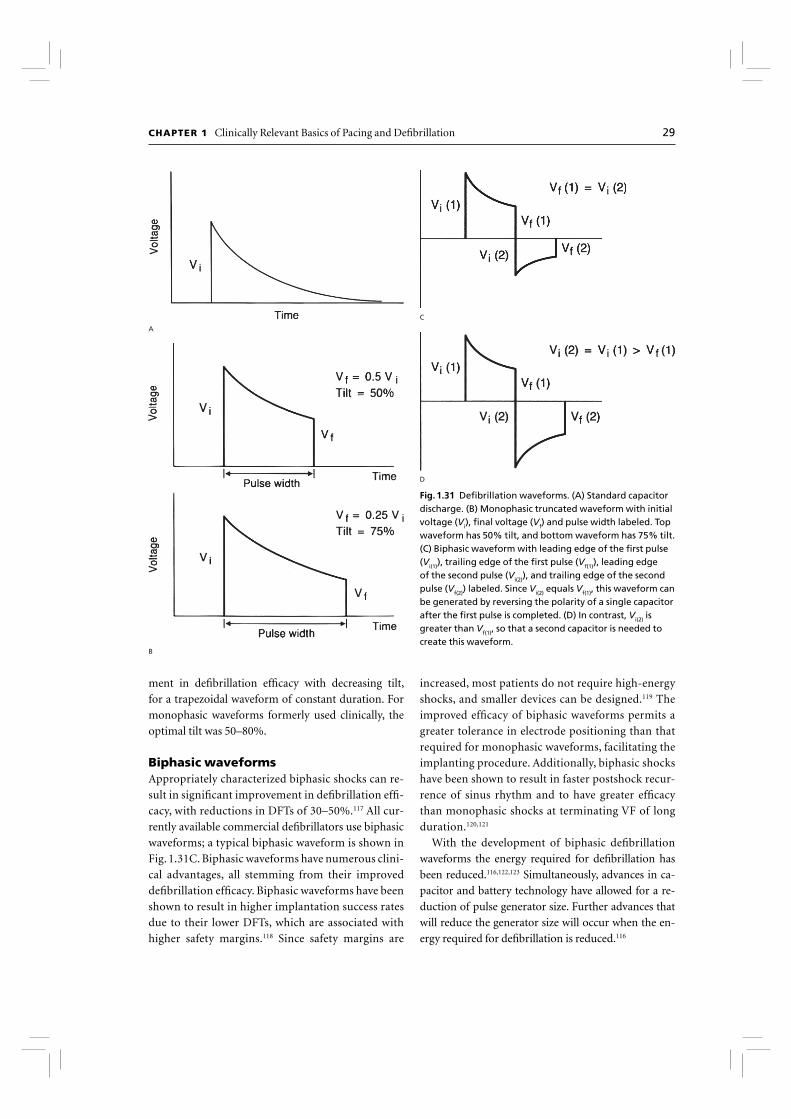
CHAPTER 1 Clinically Relevant Basics of Pacing and Defi brillation 29
ment in defi brillation effi cacy with decreasing tilt,
for a trapezoidal waveform of constant duration. For
monophasic waveforms formerly used clinically, the
optimal tilt was 50–80%.
Biphasic waveformsAppropriately characterized biphasic shocks can re-
sult in signifi cant improvement in defi brillation effi -
cacy, with reductions in DFTs of 30–50%.117 All cur-
rently available commercial defi brillators use biphasic
waveforms; a typical biphasic waveform is shown in
Fig. 1.31C. Biphasic waveforms have numerous clini-
cal advantages, all stemming from their improved
defi brillation effi cacy. Biphasic waveforms have been
shown to result in higher implantation success rates
due to their lower DFTs, which are associated with
higher safety margins.118 Since safety margins are
increased, most patients do not require high-energy
shocks, and smaller devices can be designed.119 The
improved effi cacy of biphasic waveforms permits a
greater tolerance in electrode positioning than that
required for monophasic waveforms, facilitating the
implanting procedure. Additionally, biphasic shocks
have been shown to result in faster postshock recur-
rence of sinus rhythm and to have greater effi cacy
than monophasic shocks at terminating VF of long
duration.120,121
With the development of biphasic defi brillation
waveforms the energy required for defi brillation has
been reduced.116,122,123 Simultaneously, advances in ca-
pacitor and battery technology have allowed for a re-
duction of pulse generator size. Further advances that
will reduce the generator size will occur when the en-
ergy required for defi brillation is reduced.116
A
B
C
D
Fig. 1.31 Defi brillation waveforms. (A) Standard capacitor discharge. (B) Monophasic truncated waveform with initial voltage (Vi), fi nal voltage (Vf) and pulse width labeled. Top waveform has 50% tilt, and bottom waveform has 75% tilt. (C) Biphasic waveform with leading edge of the fi rst pulse (Vi(1)), trailing edge of the fi rst pulse (Vf(1)), leading edge of the second pulse (Vi(2)), and trailing edge of the second pulse (Vf(2)) labeled. Since Vi(2) equals Vf(1), this waveform can be generated by reversing the polarity of a single capacitor after the fi rst pulse is completed. (D) In contrast, Vi(2) is greater than Vf(1), so that a second capacitor is needed to create this waveform.
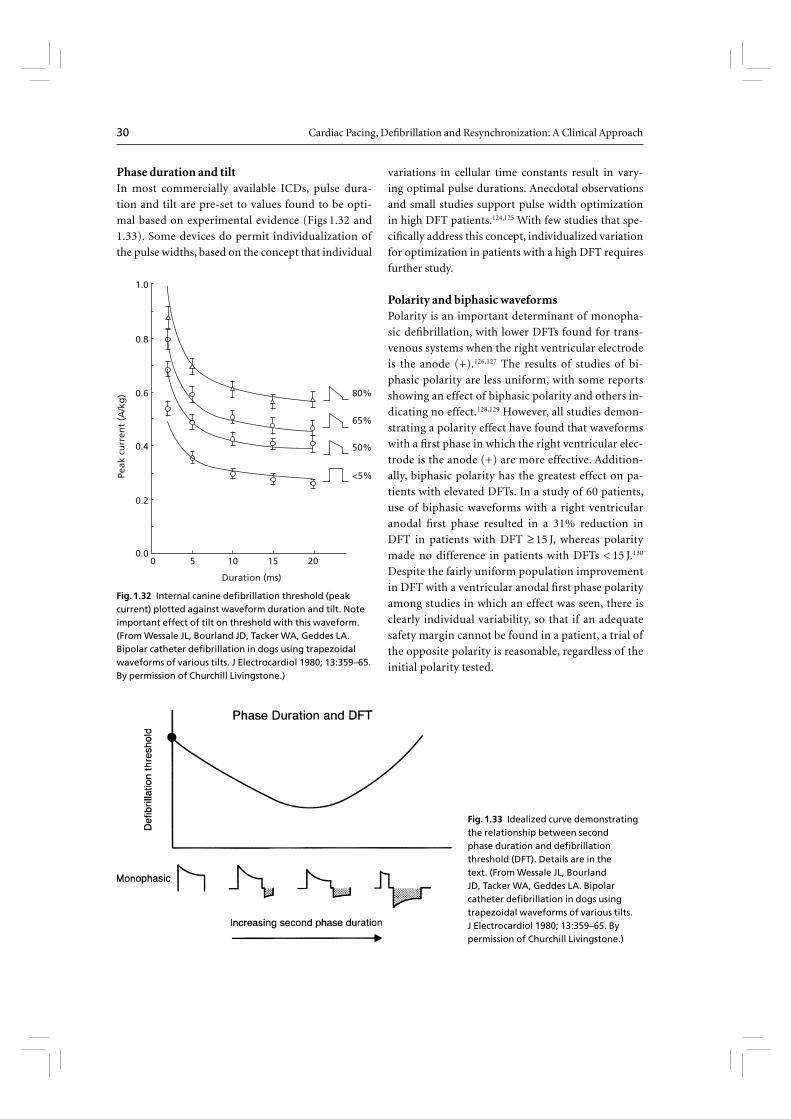
30 Cardiac Pacing, Defi brillation and Resynchronization: A Clinical Approach
Phase duration and tiltIn most commercially available ICDs, pulse dura-
tion and tilt are pre-set to values found to be opti-
mal based on experimental evidence (Figs 1.32 and
1.33). Some devices do permit individualization of
the pulse widths, based on the concept that individual
variations in cellular time constants result in vary-
ing optimal pulse durations. Anecdotal observations
and small studies support pulse width optimization
in high DFT patients.124,125 With few studies that spe-
cifi cally address this concept, individualized variation
for optimization in patients with a high DFT requires
further study.
Polarity and biphasic waveformsPolarity is an important determinant of monopha-
sic defi brillation, with lower DFTs found for trans-
venous systems when the right ventricular electrode
is the anode (+).126,127 The results of studies of bi-
phasic polarity are less uniform, with some reports
showing an effect of biphasic polarity and others in-
dicating no effect.128,129 However, all studies demon-
strating a polarity effect have found that waveforms
with a fi rst phase in which the right ventricular elec-
trode is the anode (+) are more effective. Addition-
ally, biphasic polarity has the greatest effect on pa-
tients with elevated DFTs. In a study of 60 patients,
use of biphasic waveforms with a right ventricular
anodal fi rst phase resulted in a 31% reduction in
DFT in patients with DFT ≥ 15 J, whereas polarity
made no difference in patients with DFTs < 15 J.130
Despite the fairly uniform population improvement
in DFT with a ventricular anodal fi rst phase polarity
among studies in which an effect was seen, there is
clearly individual variability, so that if an adequate
safety margin cannot be found in a patient, a trial of
the opposite polarity is reasonable, regardless of the
initial polarity tested.
0
80%
65%
50%
<5%
5 10 15 20
Duration (ms)
0.8
1.0
0.6
0.4
0.2
0.0
Peak
cu
rren
t (A
/kg
)
Fig. 1.32 Internal canine defi brillation threshold (peak current) plotted against waveform duration and tilt. Note important effect of tilt on threshold with this waveform. (From Wessale JL, Bourland JD, Tacker WA, Geddes LA. Bipolar catheter defi brillation in dogs using trapezoidal waveforms of various tilts. J Electrocardiol 1980; 13:359–65. By permission of Churchill Livingstone.)
Fig. 1.33 Idealized curve demonstrating the relationship between second phase duration and defi brillation threshold (DFT). Details are in the text. (From Wessale JL, Bourland JD, Tacker WA, Geddes LA. Bipolar catheter defi brillation in dogs using trapezoidal waveforms of various tilts. J Electrocardiol 1980; 13:359–65. By permission of Churchill Livingstone.)
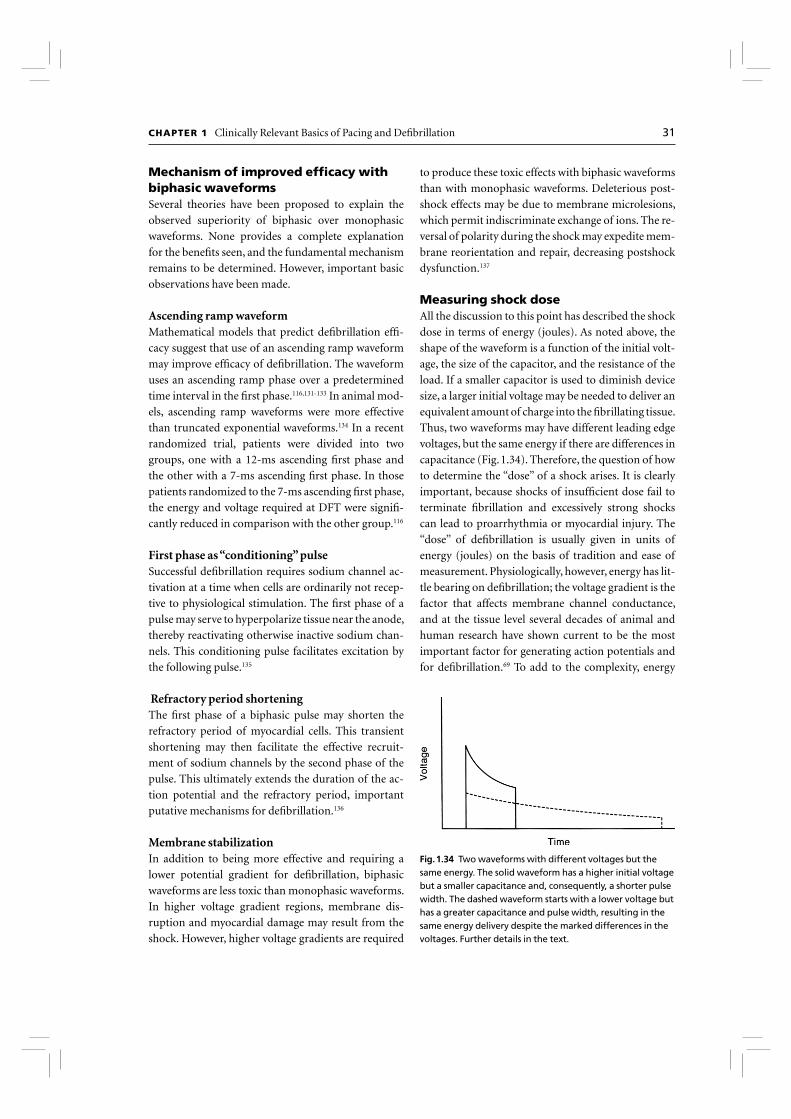
CHAPTER 1 Clinically Relevant Basics of Pacing and Defi brillation 31
Mechanism of improved effi cacy with biphasic waveformsSeveral theories have been proposed to explain the
observed superiority of biphasic over monophasic
waveforms. None provides a complete explanation
for the benefi ts seen, and the fundamental mechanism
remains to be determined. However, important basic
observations have been made.
Ascending ramp waveformMathematical models that predict defi brillation effi -
cacy suggest that use of an ascending ramp waveform
may improve effi cacy of defi brillation. The waveform
uses an ascending ramp phase over a predetermined
time interval in the fi rst phase.116,131-133 In animal mod-
els, ascending ramp waveforms were more effective
than truncated exponential waveforms.134 In a recent
randomized trial, patients were divided into two
groups, one with a 12-ms ascending fi rst phase and
the other with a 7-ms ascending fi rst phase. In those
patients randomized to the 7-ms ascending fi rst phase,
the energy and voltage required at DFT were signifi -
cantly reduced in comparison with the other group.116
First phase as “conditioning” pulseSuccessful defi brillation requires sodium channel ac-
tivation at a time when cells are ordinarily not recep-
tive to physiological stimulation. The fi rst phase of a
pulse may serve to hyperpolarize tissue near the anode,
thereby reactivating otherwise inactive sodium chan-
nels. This conditioning pulse facilitates excitation by
the following pulse.135
Refractory period shorteningThe fi rst phase of a biphasic pulse may shorten the
refractory period of myocardial cells. This transient
shortening may then facilitate the effective recruit-
ment of sodium channels by the second phase of the
pulse. This ultimately extends the duration of the ac-
tion potential and the refractory period, important
putative mechanisms for defi brillation.136
Membrane stabilizationIn addition to being more effective and requiring a
lower potential gradient for defi brillation, biphasic
waveforms are less toxic than monophasic waveforms.
In higher voltage gradient regions, membrane dis-
ruption and myocardial damage may result from the
shock. However, higher voltage gradients are required
to produce these toxic effects with biphasic waveforms
than with monophasic waveforms. Deleterious post-
shock effects may be due to membrane microlesions,
which permit indiscriminate exchange of ions. The re-
versal of polarity during the shock may expedite mem-
brane reorientation and repair, decreasing postshock
dysfunction.137
Measuring shock doseAll the discussion to this point has described the shock
dose in terms of energy (joules). As noted above, the
shape of the waveform is a function of the initial volt-
age, the size of the capacitor, and the resistance of the
load. If a smaller capacitor is used to diminish device
size, a larger initial voltage may be needed to deliver an
equivalent amount of charge into the fi brillating tissue.
Thus, two waveforms may have different leading edge
voltages, but the same energy if there are differences in
capacitance (Fig. 1.34). Therefore, the question of how
to determine the “dose” of a shock arises. It is clearly
important, because shocks of insuffi cient dose fail to
terminate fi brillation and excessively strong shocks
can lead to proarrhythmia or myocardial injury. The
“dose” of defi brillation is usually given in units of
energy (joules) on the basis of tradition and ease of
measurement. Physiologically, however, energy has lit-
tle bearing on defi brillation; the voltage gradient is the
factor that affects membrane channel conductance,
and at the tissue level several decades of animal and
human research have shown current to be the most
important factor for generating action potentials and
for defi brillation.69 To add to the complexity, energy
Fig. 1.34 Two waveforms with different voltages but the same energy. The solid waveform has a higher initial voltage but a smaller capacitance and, consequently, a shorter pulse width. The dashed waveform starts with a lower voltage but has a greater capacitance and pulse width, resulting in the same energy delivery despite the marked differences in the voltages. Further details in the text.

32 Cardiac Pacing, Defi brillation and Resynchronization: A Clinical Approach
can be described as the stored energy—the amount of
energy stored in the capacitor before shock delivery—
or the energy delivered. Since the waveforms are trun-
cated, usually around 10% of the stored energy is not
delivered. Additionally, although the term is used clini-
cally, “delivered energy” is highly variable, depending
on where the delivery is recorded; energy delivered at
the lead surface is not the same as energy delivered only
a few millimeters into the tissue. Some device manu-
facturers, in fact, simply report an arbitrary percent-
age of the stored energy as the delivered energy. Stored
energy, although not a direct indicator of the factors
responsible for biological defi brillation, indicates the
size of the device necessary to generate a given energy
shock. Over the range of clinically utilized capacitor
size and biological tissue resistance in a given system,
a change in energy up or down is refl ected by a similar
change in voltage and current. In practice, “energy” is
the most commonly used term to indicate shock dose.
Use of waveform theory in clinical practice
The optimal biphasic waveform is specifi c to the de-
vice, lead, and patient. In many commercially available
devices, the only programmable option is the polarity.
Therefore, if a patient undergoing implantable defi -
brillator insertion does not have an adequate defi bril-
lation safety margin, a logical next step is reversal of
polarity. If an adequate safety margin is still not met,
a lead is often added (discussed below). Tilt or dura-
tion can also be modifi ed as an alternative next step in
systems that offer this feature.
Lead system and defi brillationThe most effi cient lead system is one that evenly dis-
tributes the shock over the myocardium and minimizes
the difference in potential between high-gradient and
low-gradient zones. This is best accomplished with
large contoured epicardial patches positioned so that
an imaginary line connecting the centers of the elec-
trodes passes through the ventricular center of mass.138
However, since epicardial leads require thoracotomy
for placement, they are typically used after other ap-
proaches have been exhausted.
Although intrinsically less effi cient, transvenous
lead systems can now be used almost universally be-
cause of the adoption of biphasic waveforms (dis-
cussed above) and the introduction of defi brillators in
which the pulse generator shell is an active electrode.
Because the surface area of the pulse generator is large,
the addition of the generator shell as an active elec-
trode reduces the biphasic endocardial DFT by 30%
compared with that of a dual-coil defi brillation lead
alone.139 When an active can system with a single distal
defi brillation coil is used, addition of a proximal coil
has further lowered the DFT in some, but not all, stud-
ies.139,140 Nevertheless, if implantation safety margins
cannot be achieved despite waveform modifi cation
(reversal of polarity and, if available, adjustment of
pulse width), adding a second lead with the electrode
positioned near the junction of the right atrium and
superior vena cava is a logical next step. Alternatively,
since most leads in use today have two coils, in a subset
of patients defi brillation is improved when the proxi-
mal coil is removed from the defi brillation circuit. This
observation probably results from individual anatom-
ical variations such that the proximal coil may lessen
the fi eld strength over the left ventricle. Anecdotally,
use of three right ventricular coils (placement of a dual
coil lead in the apex, and use of adapter to place a single
coil lead in the outfl ow tract, with passage of shock
from the two distal coils to the proximal coil and can)
may help in high DFT situations, although this has not
been validated. If adequate safety margins cannot be
achieved despite optimal deployment of endovascular
leads, subcutaneous patches or arrays, which further
signifi cantly increase defi brillation electrode surface
area and can favorably direct greater current through
the ventricles, can lead to successful implantation. With
biphasic active-electrode pulse generators, the addi-
tion of subcutaneous leads is required in only 3.7% of
patients (Fig. 1.35).99 When they are required, arrays
may be more effective than patches, though we found
that this benefi t was blunted in biphasic systems.99
As noted above, defi brillation effi cacy is improved
with optimal lead positions, although the effectiveness
of biphasic waveforms, the large surface area of the
pulse generator, and programmability that has allowed
multiple potential vectors to be used that take advan-
tage of the geometry of the leads and can, have permit-
ted tolerance of less than perfect positions. Generally,
defi brillation effectiveness diminishes as the right ven-
tricular electrode is placed in a progressively proximal
position, toward the tricuspid valve. Therefore, this
lead should be placed as apically as possible. Addition-
ally, a septal location, to direct as much of the electrical
fi eld over the left ventricular mass as possible, is desir-

CHAPTER 1 Clinically Relevant Basics of Pacing and Defi brillation 33
able.141 Active pulse generator shell permits independ-
ent positioning of a proximal defi brillation coil, and
the proximal lead position can be near the superior
vena cava, near its junction with the right atrium, or in
the left subclavian vein (Fig. 1.36).142
Since in nearly all commercially available defi bril-
lators the pulse generator shell serves as an electrode,
its position can also affect defi brillation effi cacy. Im-
plantable defi brillators are most commonly placed
in the left pectoral region, typically in the prepec-
toral (subcutaneous) plane. However, the site of
pulse generator placement and vascular access is in-
fl uenced by multiple factors, including patient and
physician preference, anatomical anomalies, previ-
ous operations, integrity of the vascular system, and
whether a preexisting permanent pacing system is
present. In addition to factors specifi c to the patient,
choice of the implantation site can affect ease of
technical insertion, defi brillation effectiveness, and
long-term rates of lead failure.
Fig. 1.35 Effect of waveform on frequency of subcutaneous (SQ) lead use. On the ordinate is the frequency of subcutaneous lead usage, and on the abscissa are the subgroups analyzed. In 45 of 94 (48%) patients with monophasic systems, subcutaneous leads were required to meet implantation criteria. In contrast, only 17 of 460 (3.7%) biphasic systems required subcutaneous leads to meet implantation criteria. (From Trusty et al.99 By permission of Futura Publishing Company.)
Fig. 1.36 Chest radiographs depict active pulse generator shell system with an added proximal defi brillation coil to optimize defi brillation threshold.

34 Cardiac Pacing, Defi brillation and Resynchronization: A Clinical Approach
Right pectoral implantation may be considered in
left-handed persons, hunters who place the rifl e butt
on the left shoulder, and patients with previous mastec-
tomy, other surgical procedures, or anatomy that pre-
cludes left-sided insertion. In systems with both distal
and proximal defi brillation coils, the proximal coil is
either shifted toward the right hemithorax (if both coils
are on the same lead) or, often, advanced to a lower su-
perior vena cava position for greater cardiac proximity
(in two-lead systems) with right-sided placement. With
active can pulse generators, the largest defi brillation
lead surface, the device shell, is shifted away from the
ventricular myocardium (Fig. 1.37). These unfavorable
restrictions on lead position decrease defi brillation ef-
fectiveness.143,144 With biphasic waveforms, we found
that right-sided implantation results in a 6-J increase in
DFT compared with left-sided placement (11.3 ± 5.3 J,
left-sided; 17.0 ± 4.9 J, right-sided; P < 0.0001).143 Even
with the increase, right-sided devices were successfully
placed in 19 of 20 patients; in one patient, an acceptable
right-sided threshold could not be achieved and that
approach was abandoned. Despite the concern that a
right-sided active can might be detrimental by divert-
ing a signifi cant portion of the electrical fi eld away from
the ventricles, the large surface area of the shell compen-
sates for this, so that when right-sided implantation is
required, active can devices are preferable (Fig. 1.38).143
In general, however, left-sided insertion is superior to
right-sided placement and is used if there are no com-
pelling factors against it.
An alternative site for device placement is the abdo-
men, but this site is only rarely used. Although not as
effective for defi brillation as the left pectoral position,
the abdomen appears superior to the right pectoral lo-
Fig. 1.37 (A) Posteroanterior and lateral chest radiographs from a patient with a left-sided defi brillator. Note that the proximal defi brillation lead is in the left subclavian vein.
(B) Posteroanterior and lateral chest radiographs from a patient with right-sided defi brillator placement. Note that the proximal defi brillation lead is in the superior vena cava.

CHAPTER 1 Clinically Relevant Basics of Pacing and Defi brillation 35
cation for active can placement.145 However, abdominal
insertion is technically more challenging, requiring two
incisions, lead tunneling, abdominal dissection (often
necessitating surgical assistance), and general anesthe-
sia. Additionally, because of the greater risk of infec-
tion, threat of peritoneal erosion and increased risk of
lead fracture, even with totally transvenous systems this
position is used only in rare circumstances.146
Drugs and defi brillators
Antiarrhythmic agents are frequently used in patients
with implantable defi brillators to treat supraventricu-
lar arrhythmias (particularly atrial fi brillation), sup-
press ventricular tachyarrhythmias, and slow VT to
increase the responsiveness of antitachycardia pacing.
In the implantable defi brillator trials, concomitant use
of membrane-active agents (Vaughn-Williams class I
or class III drugs) has ranged from 11% to 31%.147-150
Several important device–drug interactions must be
considered.151
1. Detection. Most drugs slow VT. If slowed below the
detection cut-off rate, VT is not detected by the device
and remains untreated. Initiation of antiarrhythmic
drugs in patients with VT is usually followed by device
testing to assess detection of VT.
2. Pacing thresholds. Bradycardia and antitachycardia
pacing thresholds may be affected by pharmacological
agents, as discussed in Chapter 13.
3. Pacing requirements. Drugs may exacerbate con-
duction defects or slow the sinus rate, necessitating
pacing for bradycardia.
4. Drug-induced proarrhythmia.
5. Changes in DFT. Although it is well known that
pharmacological agents can modulate defi brillation
effectiveness, drug–defi brillation interactions are
complex. Moreover, assessment of the infl uence of
drugs on defi brillation is confounded by the effects
of anesthetic agents, variability in lead systems and
waveforms across studies, and heterogeneity in study
subjects (i.e. human, canine and porcine). In general,
however, agents that impede the fast inward sodium
current (such as lidocaine) or calcium channel func-
tion (such as verapamil) increase the DFT, whereas
agents that block repolarizing potassium currents
(such as sotalol) lower the DFT. The effects of amio-
darone are legion; clinically, long-term administra-
tion of amiodarone increases DFTs, whereas intrave-
nous administration has little immediate effect. In
addition to antiarrhythmic agents, other drugs have
been shown to increase the defi brillation threshold,
such as sildenafi l152, venlafaxine153 and alcohol154.
Importantly, with current generation biphasic ICDs,
the clinical effect of most drugs, including amiodarone,
is modest.155 In general, then, ICD evaluation should
be performed when administration of membrane ac-
tive drugs that can increase the threshold (especially
amiodarone) is initiated, particularly in patients with
borderline DFTs. Drug effects on defi brillation are sum-
marized in Table 1.4. In patients with a low DFT, testing
for slow VTs or, less commonly, empirically lengthening
the detection interval (to allow for VT slowing) is most
important. As a general rule, ICD evaluation should
be considered whenever administration of Vaughn-
Williams class I or class III drugs is initiated or their
dosage signifi cantly increased. These drugs are listed
Fig. 1.38 Defi brillation thresholds with right-sided and left-sided cardioverter-defi brillator implantation of active can and cold can devices. Defi brillation threshold (DFT) is on ordinate, and side of placement and can type are on abscissa. (From Friedman et al.
143 By permission of Futura Publishing Company.)
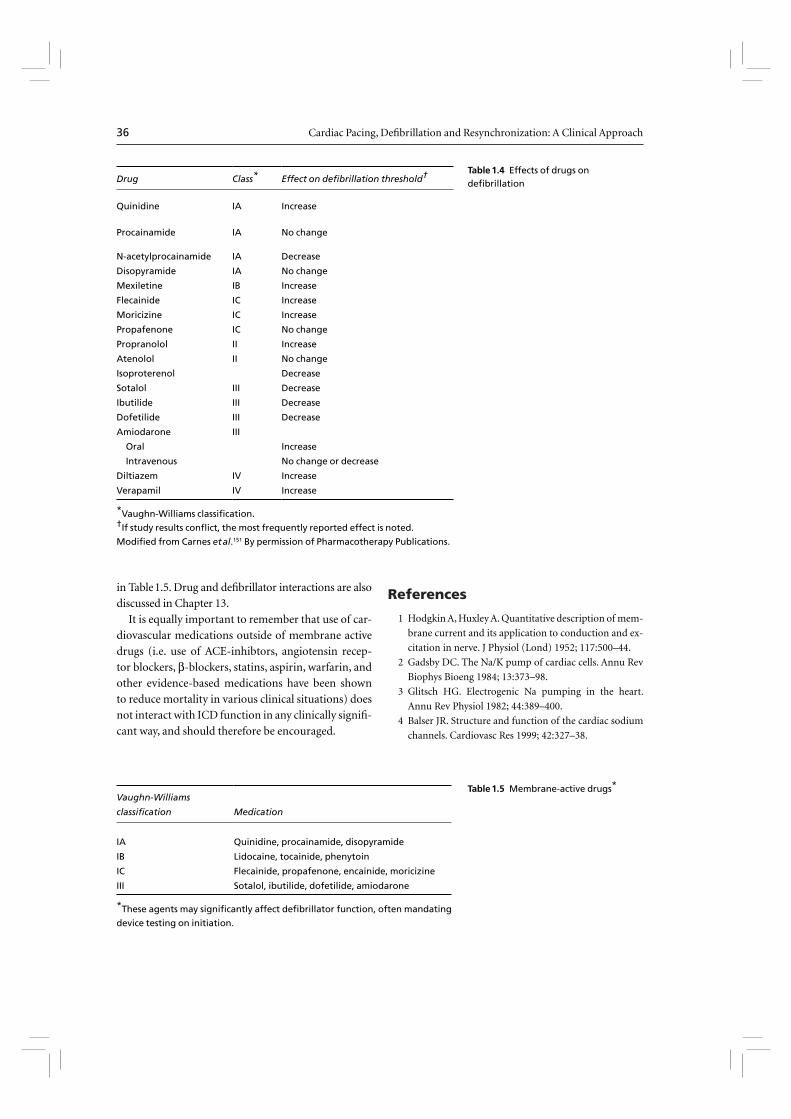
36 Cardiac Pacing, Defi brillation and Resynchronization: A Clinical Approach
in Table 1.5. Drug and defi brillator interactions are also
discussed in Chapter 13.
It is equally important to remember that use of car-
diovascular medications outside of membrane active
drugs (i.e. use of ACE-inhibtors, angiotensin recep-
tor blockers, β-blockers, statins, aspirin, warfarin, and
other evidence-based medications have been shown
to reduce mortality in various clinical situations) does
not interact with ICD function in any clinically signifi -
cant way, and should therefore be encouraged.
References
1 Hodgkin A, Huxley A. Quantitative description of mem-
brane current and its application to conduction and ex-
citation in nerve. J Physiol (Lond) 1952; 117:500–44.
2 Gadsby DC. The Na/K pump of cardiac cells. Annu Rev
Biophys Bioeng 1984; 13:373–98.
3 Glitsch HG. Electrogenic Na pumping in the heart.
Annu Rev Physiol 1982; 44:389–400.
4 Balser JR. Structure and function of the cardiac sodium
channels. Cardiovasc Res 1999; 42:327–38.
Drug Class* Effect on defi brillation threshold†
Quinidine IA Increase
Procainamide IA No change
N-acetylprocainamide IA Decrease
Disopyramide IA No change
Mexiletine IB Increase
Flecainide IC Increase
Moricizine IC Increase
Propafenone IC No change
Propranolol II Increase
Atenolol II No change
Isoproterenol Decrease
Sotalol III Decrease
Ibutilide III Decrease
Dofetilide III Decrease
Amiodarone III
Oral Increase
Intravenous No change or decrease
Diltiazem IV Increase
Verapamil IV Increase
*Vaughn-Williams classifi cation.†If study results confl ict, the most frequently reported effect is noted.
Modifi ed from Carnes et al.151 By permission of Pharmacotherapy Publications.
Vaughn-Williams
classifi cation Medication
IA Quinidine, procainamide, disopyramide
IB Lidocaine, tocainide, phenytoin
IC Flecainide, propafenone, encainide, moricizine
III Sotalol, ibutilide, dofetilide, amiodarone
*These agents may signifi cantly affect defi brillator function, often mandating
device testing on initiation.
Table 1.4 Effects of drugs on defi brillation
Table 1.5 Membrane-active drugs*

CHAPTER 1 Clinically Relevant Basics of Pacing and Defi brillation 37
5 Makielski JC, Sheets MF, Hanck DA, January CT, Foz-
zard HA. Sodium current in voltage clamped internally
perfused canine cardiac Purkinje cells. Biophys J 1987;
52:1–11.
6 Kunze DL, Lacerda AE, Wilson DL, Brown AM. Car-
diac Na currents and the inactivating, reopening, and
waiting properties of single cardiac Na channels. J Gen
Physiol 1985; 86:691–719.
7 Cohen CJ, Bean BP, Tsien RW. Maximal upstroke veloc-
ity as an index of available sodium conductance. Com-
parison of maximal upstroke velocity and voltage clamp
measurements of sodium current in rabbit Purkinje fi b-
ers. Circ Res 1984; 54:636–51.
8 Hume JR, Giles W. Ionic currents in single isolated bull-
frog atrial cells. J Gen Physiol 1983; 81:153–94.
9 Reuter H. Divalent cations as charge carriers in excitable
membranes. Prog Biophys Mol Biol 1973; 26:1–43.
10 Hume JR, Giles W, Robinson K et al. A time- and volt-
age-dependent K+ current in single cardiac cells from
bullfrog atrium. J Gen Physiol 1986; 88:777–98.
11 Barr L, Dewey MM, Berger W. Propagation of action
potentials and the structure of the nexus in cardiac
muscle. J Gen Physiol 1965; 48:797–823.
12 De Mello WC. Intercellular communication in cardiac
muscle. Circ Res 1982; 51:1–9.
13 Barold SS, Ong LS, Heinle RA. Stimulation and sensing
thresholds for cardiac pacing: electrophysiologic and
technical aspects. Prog Cardiovasc Dis 1981; 24:1–24.
14 Lindemans FW, Denier Van der Gon JJ. Current thresh-
olds and liminal size in excitation of heart muscle. Car-
diovasc Res 1978; 12:477–85.
15 de Voogt WG. Pacemaker leads: performance and
progress. Am J Cardiol 1999; 83:187D–191D.
16 Timmis G, Helland J, Westveer D. The evolution of low
threshold leads. Clin Prog Pacing Electrophysiol 1983;
1:313–34.
17 Kay GN, Anderson K, Epstein AE, Plumb VJ. Active fi xa-
tion atrial leads: randomized comparison of two lead
designs. Pacing Clin Electrophysiol 1989; 12:1355–61.
18 de Buitleir M, Kou WH, Schmaltz S, Morady F. Acute
changes in pacing threshold and R- or P-wave ampli-
tude during permanent pacemaker implantation. Am J
Cardiol 1990; 65:999–1003.
19 Kruse IM, Terpstra B. Acute and long-term atrial and
ventricular stimulation thresholds with a steroid- eluting
electrode. Pacing Clin Electrophysiol 1985; 8:45–9.
20 Mond H, Stokes K, Helland J et al. The porous titanium
steroid eluting electrode: a double blind study assessing
the stimulation threshold effects of steroid. Pacing Clin
Electrophysiol 1988; 11:214–9.
21 Guarda F, Galloni M, Assone F, Pasteris V, Luboz MP. His-
tological reactions of porous tip endocardial electrodes
implanted in sheep. Int J Artif Organs 1982; 5:267–73.
22 Beyersdorf F, Schneider M, Kreuzer J, Falk S, Zegelman
M, Satter P. Studies of the tissue reaction induced by
transvenous pacemaker electrodes. I. Microscopic ex-
amination of the extent of connective tissue around the
electrode tip in the human right ventricle. Pacing Clin
Electrophysiol 1988; 11:1753–9.
23 Schwaab B, Frohlig G, Berg M, Schwerdt H, Schieffer
H. Five-year follow-up of a bipolar steroid-eluting ven-
tricular pacing lead. Pacing Clin Electrophysiol 1999;
22:1226–8.
24 Wiegand UK, Potratz J, Bonnemeier H et al. Long-
term superiority of steroid elution in atrial active fi xa-
tion platinum leads. Pacing Clin Electrophysiol 2000;
23:1003–9.
25 Klein HH, Steinberger J, Knake W. Stimulation charac-
teristics of a steroid-eluting electrode compared with
three conventional electrodes. Pacing Clin Electrophysiol
1990; 13:134–7.
26 King DH, Gillette PC, Shannon C, Cuddy TE. Steroid-
eluting endocardial pacing lead for treatment of exit
block. Am Heart J 1983; 106:1438–40.
27 Furman S, Hurzeler P, DeCaprio V. The ventricular en-
docardial electrogram and pacemaker sensing. J Thorac
Cardiovasc Surg 1977; 73:258–66.
28 Kleinert M, Elmqvist H, Strandberg H. Spectral proper-
ties of atrial and ventricular endocardial signals. Pacing
Clin Electrophysiol 1979; 2:11–9.
29 Watson W. Myopotential sensing in cardiac pacemakers.
In: Barold SS, ed. Modern cardiac pacing. Mount Kisco,
NY: Futura Publishing Co., 1985:813–37.
30 Parsonnet V, Myers GH, Kresh YM. Characteristics of
intracardiac electrograms II: Atrial endocardial electro-
grams. Pacing Clin Electrophysiol 1980; 3:406–17.
31 Hurzeler P, De Caprio V, Furman S. Endocardial elec-
trograms and pacemaker sensing. Med Instrum 1976;
10:178–82.
32 Sweesy MW, Batey RL, Forney RC. Crosstalk dur-
ing bipolar pacing. Pacing Clin Electrophysiol 1988;
11:1512–6.
33 Janosik DL, Redd RM, Kennedy HL. Crosstalk inhibition
of a dual-chamber pacemaker diagnosed by ambulatory
electrocardiography. Am Heart J 1990; 120:435–8.
34 Clarke M, Liu B, Schuller H et al. Automatic adjustment
of pacemaker stimulation output correlated with con-
tinuously monitored capture thresholds: a multicenter
study. European Microny Study Group. Pacing Clin
Electrophysiol 1998; 21:1567–75.
35 Kay GN. Basic aspects of cardiac pacing. In: Ellenbogen
K, ed. Cardiac pacing. Boston: Blackwell Scientifi c Pub-
lications, 1992:32–119.
36 Raymond RD, Nanian KB. Insulation failure with bipo-
lar polyurethane pacing leads. Pacing Clin Electrophysi-
ol 1984; 7:378–80.

38 Cardiac Pacing, Defi brillation and Resynchronization: A Clinical Approach
37 Bornzin G. A low threshold, low polarization platinized
endocardial electrode (abstract). Pacing Clin Electro-
physiol 1983; 6:A-70.
38 Kertes P, Mond H, Sloman G, Vohra J, Hunt D. Com-
parison of lead complications with polyurethane tined,
silicone rubber tined, and wedge tip leads: clinical ex-
perience with 822 ventricular endocardial leads. Pacing
Clin Electrophysiol 1983; 6:957–62.
39 Hanson JS. Sixteen failures in a single model of bipo-
lar polyurethane-insulated ventricular pacing lead: a
44-month experience. Pacing Clin Electrophysiol 1984;
7:389–94.
40 Mond HG, Grenz D. Implantable transvenous pacing
leads: the shape of things to come. Pacing Clin Electro-
physiol 2004; 27:887–93.
41 Calfee RV, Saulson SH. A voluntary standard for 3.2 mm
unipolar and bipolar pacemaker leads and connectors.
Pacing Clin Electrophysiol 1986; 9:1181–5.
42 Rho RW, Patel VV, Gerstenfeld EP et al. Elevations in
ventricular pacing threshold with the use of the Y adap-
tor: implications for biventricular pacing. Pacing Clin
Electrophysiol 2003; 26:747–51.
43 Taieb JM, Barnay C, Linde C, Mortensen P, Menardis
M. Left atrial far-fi eld sensing by left ventricular leads:
a potential hazard in cardiac resynchronisation therapy.
Europace 2005; 7:611–6.
44 Mond HG. Unipolar versus bipolar pacing—poles apart.
Pacing Clin Electrophysiol 1991; 14:1411–24.
45 Gregoratos G, Abrams J, Epstein AE et al. ACC/AHA/
NASPE 2002 guideline update for implantation of car-
diac pacemakers and antiarrhythmia devices: summary
article. A report of the American College of Cardiol-
ogy/American Heart Association Task Force on Practice
Guidelines (ACC/AHA/NASPE Committee to Update
the 1998 Pacemaker Guidelines). J Cardiovasc Electro-
physiol 2002; 13:1183–99.
46 Abraham WT, Hayes DL. Cardiac resynchronization ther-
apy for heart failure. Circulation 2003; 108:2596–603.
47 Sogaard P, Egeblad H, Kim WY et al. Tissue Doppler
imaging predicts improved systolic performance and
reversed left ventricular remodeling during long-term
cardiac resynchronization therapy. J Am Coll Cardiol
2002; 40:723–30.
48 Wilkoff BL, Belott PH, Love CJ et al. Improved extrac-
tion of ePTFE and medical adhesive modifi ed defi bril-
lation leads from the coronary sinus and great cardiac
vein. Pacing Clin Electrophysiol 2005; 28:205–11.
49 Furman S. Basic concepts. In: Furman S, Hayes DL, Hol-
mes DR, eds. A practice of cardiac pacing. Mount Kisco,
NY: Futura Publishing Co., 1993:29–88.
50 Schoenfeld MH. Contemporary pacemaker and defi bril-
lator device therapy: challenges confronting the general
cardiologist. Circulation 2007; 115:638–53.
51 Ribeiro AL, Rincon LG, Oliveira BG et al. Automatic
adjustment of pacing output in the clinical setting. Am
Heart J 2004; 147:127–31.
52 Tyers GF, Brownlee RR. Power pulse generators, elec-
trodes, and longevity. Prog Cardiovasc Dis 1981;
23:421–34.
53 Irnich W. Muscle noise and interference behavior in
pacemakers: a comparative study. Pacing Clin Electro-
physiol 1987; 10:125–32.
54 Bicik V, Kristan L. Sine2/triangle/square wave generator
for pacemaker testing. Pacing Clin Electrophysiol 1985;
8:484–93.
55 Hauser RG, Kallinen L. Deaths associated with implant-
able cardioverter defi brillator failure and deactivation
reported in the United States Food and Drug Adminis-
tration Manufacturer and User Facility Device Experi-
ence Database. Heart Rhythm 2004; 1:399–405.
56 Zaim S, Sunthorn H, Adatte JJ, Kursteiner K, Burgener
D, Huehn C. Inappropriate high-rate ventricular pac-
ing in a patient with a defi brillator. Europace 2002;
4:427–30.
57 Bernstein AD, Daubert JC, Fletcher RD et al. The revised
NASPE/BPEG generic code for antibradycardia, adap-
tive-rate, and multisite pacing. North American Soci-
ety of Pacing and Electrophysiology/British Pacing and
Electrophysiology Group. Pacing Clin Electrophysiol
2002; 25:260–4.
58 Prevost J, Battelli F. Some effects of electrical discharge
on the hearts of mammals. Comptes Rendus Acad Sci
1899; 129:1267–8.
59 Weiss JN, Qu Z, Chen PS et al. The dynamics of cardiac
fi brillation. Circulation 2005; 112:1232–40.
60 Gurvich N, Yuniev G. Restoration of regular rhythm in
mammalian fi brillating heart. Am Rev Soviet Med 1946;
3:236–9.
61 Zipes DP, Fischer J, King RM, Nicoll Ad, Jolly WW. Ter-
mination of ventricular fi brillation in dogs by depolar-
izing a critical amount of myocardium. Am J Cardiol
1975; 36:37–44.
62 Chen PS, Shibata N, Dixon EG et al. Activation during
ventricular defi brillation in open-chest dogs. Evidence
of complete cessation and regeneration of ventricular
fi brillation after unsuccessful shocks. J Clin Invest 1986;
77:810–23.
63 Chen PS, Wolf PD, Melnick SD, Danieley ND, Smith
WM, Ideker RE. Comparison of activation during
ventricular fi brillation and following unsuccessful de-
fi brillation shocks in open-chest dogs. Circ Res 1990;
66:1544–60.
64 Frazier DW, Wolf PD, Wharton JM, Tang AS, Smith
WM, Ideker RE. Stimulus-induced critical point. Mech-
anism for electrical initiation of reentry in normal ca-
nine myocardium. J Clin Invest 1989; 83:1039–52.

CHAPTER 1 Clinically Relevant Basics of Pacing and Defi brillation 39
65 Swerdlow CD, Martin DJ, Kass RM et al. The zone of
vulnerability to T wave shocks in humans. J Cardiovasc
Electrophysiol 1997; 8:145–54.
66 Chen PS, Feld GK, Kriett JM et al. Relation between up-
per limit of vulnerability and defi brillation threshold in
humans. Circulation 1993; 88:186–92.
67 Dillon SM, Kwaku KF. Progressive depolarization: a
unifi ed hypothesis for defi brillation and fi brillation
induction by shocks. J Cardiovasc Electrophysiol 1998;
9:529–52.
68 Sweeney RJ, Gill RM, Steinberg MI, Reid PR. Ventricu-
lar refractory period extension caused by defi brillation
shocks. Circulation 1990; 82:965–72.
69 Dillon SM. The electrophysiological effects of defi brilla-
tion shocks. In: Kroll M, Lehmann M, eds. Implantable
cardioverter defi brillator therapy: the engineering–clinical
interface. Norwell, MA: Kluwer Academic Publishers,
1996:31–61.
70 Kroll MW, Efi mov IR, Tchou PJ. Present understanding
of shock polarity for internal defi brillation: the obvi-
ous and non-obvious clinical implications. Pacing Clin
Electrophysiol 2006; 29:885–91.
71 Yamanouchi Y, Cheng Y, Tchou PJ, Efi mov IR. The
mechanisms of the vulnerable window: the role of vir-
tual electrodes and shock polarity. Can J Physiol Phar-
macol 2001; 79:25–33.
72 Efi mov IR, Cheng Y, Yamanouchi Y, Tchou PJ. Direct
evidence of the role of virtual electrode-induced phase
singularity in success and failure of defi brillation. J Car-
diovasc Electrophysiol 2000; 11:861–8.
73 Luceri RM, Habal SM, David IB, Puchferran RL, Mura-
tore C, Rabinovich R. Changing trends in therapy deliv-
ery with a third generation noncommitted implantable
defi brillator: results of a large single center clinical trial.
Pacing Clin Electrophysiol 1993; 16:159–64.
74 Wathen MS, DeGroot PJ, Sweeney MO et al. Prospec-
tive randomized multicenter trial of empirical an-
titachycardia pacing versus shocks for spontaneous
rapid ventricular tachycardia in patients with implant-
able cardioverter-defi brillators: Pacing Fast Ventricular
Tachycardia Reduces Shock Therapies (PainFREE Rx II)
trial results. Circulation 2004; 110:2591–6.
75 Israel CW, Hugl B, Unterberg C et al. Pace-termination
and pacing for prevention of atrial tachyarrhythmias:
results from a multicenter study with an implantable
device for atrial therapy. J Cardiovasc Electrophysiol
2001; 12:1121–8.
76 Gillis AM, Morck M. Atrial fi brillation after DDDR
pacemaker implantation. J Cardiovasc Electrophysiol
2002; 13:542–7.
77 Gillis AM, Koehler J, Morck M, Mehra R, Hettrick DA.
High atrial antitachycardia pacing therapy effi cacy is as-
sociated with a reduction in atrial tachyarrhythmia bur-
den in a subset of patients with sinus node dysfunction
and paroxysmal atrial fi brillation. Heart Rhythm 2005;
2:791–6.
78 Adler SW 2nd, Wolpert C, Warman EN, Musley SK, Koeh-
ler JL, Euler DE. Effi cacy of pacing therapies for treating
atrial tachyarrhythmias in patients with ventricular ar-
rhythmias receiving a dual-chamber implantable cardio-
verter defi brillator. Circulation 2001; 104:887–92.
79 Friedman PA, Dijkman B, Warman EN et al. Atrial ther-
apies reduce atrial arrhythmia burden in defi brillator
patients. Circulation 2001; 104:1023–8.
80 Lau CP. Pacing for atrial fi brillation. Heart 2003;
89:106–12.
81 Ripplinger CM, Krinsky VI, Nikolski VP, Efi mov IR.
Mechanisms of unpinning and termination of ventricu-
lar tachycardia. Am J Physiol Heart Circ Physiol 2006;
291:H184–92.
82 Wathen M, Yee R, Birgersdotter-Green U, Belk P, Chris-
tensen J, Jackson T. The infl uence of antitachycardia
pacing site on effi cacy of ventricular tachycardia termi-
nation. Circulation 2004; 110:III-443 (Abstract).
83 Byrd IA, Rogers JM, Smith WM, Pollard AE. Comparison
of conventional and biventricular antitachycardia pac-
ing in a geometrically realistic model of the rabbit ven-
tricle. J Cardiovasc Electrophysiol 2004; 15:1066–77.
84 Kuhlkamp V. Initial experience with an implantable car-
dioverter-defi brillator incorporating cardiac resynchro-
nization therapy. J Am Coll Cardiol 2002; 39:790–7.
85 Young JB, Abraham WT, Smith AL et al. Combined
cardiac resynchronization and implantable cardiover-
sion defi brillation in advanced chronic heart failure: the
MIRACLE ICD Trial. JAMA 2003; 289:2685–94.
86 Schwab JO, Gasparini M, Anselme F et al. Right ven-
tricular versus biventricular antitachycardia pacing in
the termination of ventricular tachyarrhythmia in pa-
tients receiving cardiac resynchronization therapy: the
ADVANCE CRT-D trial. J Cardiovasc Electrophysiol
2006; 17:504–7.
87 Takagi S, Pumir A, Pazo D, Efi mov I, Nikolski V, Krinsky
V. Unpinning and removal of a rotating wave in cardiac
muscle. Phys Rev Lett 2004; 93:058101.
88 Strickberger SA, Daoud EG, Davidson T et al. Prob-
ability of successful defi brillation at multiples of the
defi brillation energy requirement in patients with an
implantable defi brillator. Circulation 1997; 96:1217–23.
89 Davy JM, Fain ES, Dorian P, Winkle RA. The relation-
ship between successful defi brillation and delivered
energy in open-chest dogs: reappraisal of the “defi brilla-
tion threshold” concept. Am Heart J 1987; 113:77–84.
90 Brady PA, Friedman PA, Stanton MS. Effect of failed de-
fi brillation shocks on electrogram amplitude in a non-
integrated transvenous defi brillation lead system. Am J
Cardiol 1995; 76:580–4.
40 Cardiac Pacing, Defi brillation and Resynchronization: A Clinical Approach
91 Ideker RE, Hillsley RE, Wharton JM. Shock strength for
the implantable defi brillator: can you have too much of a
good thing? Pacing Clin Electrophysiol 1992; 15:841–4.
92 Marchlinski FE, Flores B, Miller JM, Gottlieb CD, Har-
grove WC 3rd. Relation of the intraoperative defi brilla-
tion threshold to successful postoperative defi brillation
with an automatic implantable cardioverter defi brilla-
tor. Am J Cardiol 1988; 62:393–8.
93 Strickberger SA, Man KC, Souza J et al. A prospective
evaluation of two defi brillation safety margin techniques
in patients with low defi brillation energy requirements.
J Cardiovasc Electrophysiol 1998; 9:41–6.
94 Degroot PJ, Church TR, Mehra R, Martinson MS,
Schaber DE. Derivation of a defi brillator implant cri-
terion based on probability of successful defi brillation.
Pacing Clin Electrophysiol 1997; 20:1924–35.
95 Luria D, Glikson M, Brady PA et al. Predictors and mode
of detection of transvenous lead malfunction in im-
plantable defi brillators. Am J Cardiol 2001; 87:901–4.
96 Gold MR, Higgins S, Klein R et al. Effi cacy and temporal
stability of reduced safety margins for ventricular defi -
brillation: primary results from the Low Energy Safety
Study (LESS). Circulation 2002; 105:2043–8.
97 Higgins S, Mann D, Calkins H et al. One conversion
of ventricular fi brillation is adequate for implantable
cardioverter-defi brillator implant: an analysis from the
Low Energy Safety Study (LESS). Heart Rhythm 2005;
2:117–22.
98 Gold MR, Breiter D, Leman R, Rashba EJ, Shorofsky
SR, Hahn SJ. Safety of a single successful conversion of
ventricular fi brillation before the implantation of car-
dioverter defi brillators. Pacing Clin Electrophysiol 2003;
26:483–6.
99 Trusty JM, Hayes DL, Stanton MS, Friedman PA. Fac-
tors affecting the frequency of subcutaneous lead usage
in implantable defi brillators. Pacing Clin Electrophysiol
2000; 23:842–6.
100 Kettering K, Mewis C, Dornberger V et al. Long-term
experience with subcutaneous ICD leads: a comparison
among three different types of subcutaneous leads. Pac-
ing Clin Electrophysiol 2004; 27:1355–61.
101 Epstein AE, Ellenbogen KA, Kirk KA, Kay GN, Dailey
SM, Plumb VJ. Clinical characteristics and outcome of
patients with high defi brillation thresholds. A multi-
center study. Circulation 1992; 86:1206–16.
102 Watanabe H, Chinushi M, Sugiura H et al. Unsuccessful
internal defi brillation in Brugada syndrome: focus on
refractoriness and ventricular fi brillation cycle length. J
Cardiovasc Electrophysiol 2005; 16:262–6.
103 Venditti FJ Jr, John RM, Hull M, Tofl er GH, Shahian
DM, Martin DT. Circadian variation in defi brillation
energy requirements. Circulation 1996; 94:1607–12.
104 Russo AM, Sauer W, Gerstenfeld EP et al. Defi brillation
threshold testing: is it really necessary at the time of
implantable cardioverter-defi brillator insertion? Heart
Rhythm 2005; 2:456–61.
105 Ideker RE, Epstein AE, Plumb VJ. Should shocks still be
administered during implantable cardioverter-defi bril-
lator insertion? Heart Rhythm 2005; 2:462–3.
106 Swerdlow CD, Russo AM, Degroot PJ. The dilemma of
ICD implant testing. Pacing Clin Electrophysiol 2007;
30:675–700.
107 Glikson M, Gurevitz OT, Trusty JM et al. Upper limit of
vulnerability determination during implantable cardi-
overter-defi brillator placement to minimize ventricular
fi brillation inductions. Am J Cardiol 2004; 94:1445–9.
108 Hwang C, Swerdlow CD, Kass RM et al. Upper limit of
vulnerability reliably predicts the defi brillation thresh-
old in humans. Circulation 1994; 90:2308–14.
109 Chen PS, Shibata N, Dixon EG, Martin RO, Ideker RE.
Comparison of the defi brillation threshold and the up-
per limit of ventricular vulnerability. Circulation 1986;
73:1022–8.
110 Behrens S, Li C, Franz MR. Effects of myocardial
ischemia on ventricular fi brillation inducibility and de-
fi brillation effi cacy. J Am Coll Cardiol 1997; 29:817–24.
111 Swerdlow CD, Peter CT, Kass RM et al. Programming
of implantable cardioverter-defi brillators on the basis
of the upper limit of vulnerability. Circulation 1997;
95:1497–504.
112 Swerdlow CD, Ahern T, Kass RM, Davie S, Mandel WJ,
Chen PS. Upper limit of vulnerability is a good estima-
tor of shock strength associated with 90% probability
of successful defi brillation in humans with transvenous
implantable cardioverter-defi brillators. J Am Coll Car-
diol 1996; 27:1112–8.
113 Rodriguez B, Tice BM, Eason JC, Aguel F, Ferrero JM
Jr, Trayanova N. Effect of acute global ischemia on the
upper limit of vulnerability: a simulation study. Am J
Physiol Heart Circ Physiol 2004; 286:H2078–88.
114 Gurevitz OT, Friedman PA, Glikson M et al. Discrepan-
cies between the upper limit of vulnerability and defi -
brillation threshold: prevalence and clinical predictors.
J Cardiovasc Electrophysiol 2003; 14:728–32.
115 Schuder JC, Gold JH, Stoeckle H, Granberg TA, Dett-
mer JC, Larwill MH. Transthoracic ventricular defi bril-
lation in the 100 kg calf with untruncated and truncat-
ed exponential stimuli. IEEE Trans Biomed Eng 1980;
27:37–43.
116 Shorofsky SR, Rashba E, Havel W et al. Improved defi -
brillation effi cacy with an ascending ramp waveform in
humans. Heart Rhythm 2005; 2:388–94.
117 Olsovsky MR, Hodgson DM, Shorofsky SR, Kavesh NG,
Gold MR. Effect of biphasic waveforms on transvenous
defi brillation thresholds in patients with coronary ar-
tery disease. Am J Cardiol 1997; 80:1098–100.

CHAPTER 1 Clinically Relevant Basics of Pacing and Defi brillation 41
118 Wyse DG, Kavanagh KM, Gillis AM et al. Comparison
of biphasic and monophasic shocks for defi brillation
using a nonthoracotomy system. Am J Cardiol 1993;
71:197–202.
119 Bardy GH, Ivey TD, Allen MD, Johnson G, Mehra R,
Greene HL. A prospective randomized evaluation of
biphasic versus monophasic waveform pulses on defi -
brillation effi cacy in humans. J Am Coll Cardiol 1989;
14:728–33.
120 Jones JL, Swartz JF, Jones RE, Fletcher R. Increasing
fi brillation duration enhances relative asymmetrical
biphasic versus monophasic defi brillator waveform ef-
fi cacy. Circ Res 1990; 67:376–84.
121 Schuder JC, McDaniel WC, Stoeckle H. Defi brillation of
100 kg calves with asymmetrical, bidirectional, rectan-
gular pulses. Cardiovasc Res 1984; 18:419–26.
122 Kavanagh KM, Tang AS, Rollins DL, Smith WM, Ideker
RE. Comparison of the internal defi brillation thresholds
for monophasic and double and single capacitor bipha-
sic waveforms. J Am Coll Cardiol 1989; 14:1343–9.
123 Fain ES, Sweeney MB, Franz MR. Improved internal de-
fi brillation effi cacy with a biphasic waveform. Am Heart
J 1989; 117:358–64.
124 Denman RA, Umesan C, Martin PT et al. Benefi t of mil-
lisecond waveform durations for patients with high de-
fi brillation thresholds. Heart Rhythm 2006; 3:536–41.
125 Natarajan S, Henthorn R, Burroughs J et al. “Tuned”
defi brillation waveforms outperform 50/50% tilt defi -
brillation waveforms: a randomized multi-center study.
Pacing Clin Electrophysiol 2007; 30 (Suppl. 1):S139–42.
126 Strickberger SA, Hummel JD, Horwood LE et al. Effect
of shock polarity on ventricular defi brillation thresh-
old using a transvenous lead system. J Am Coll Cardiol
1994; 24:1069–72.
127 Bardy GH, Ivey TD, Allen MD, Johnson G, Greene HL.
Evaluation of electrode polarity on defi brillation effi -
cacy. Am J Cardiol 1989; 63:433–7.
128 Natale A, Sra J, Dhala A et al. Effects of initial polarity
on defi brillation threshold with biphasic pulses. Pacing
Clin Electrophysiol 1995; 18:1889–93.
129 Strickberger SA, Man KC, Daoud E et al. Effect of fi rst-
phase polarity of biphasic shocks on defi brillation
threshold with a single transvenous lead system. J Am
Coll Cardiol 1995; 25:1605–8.
130 Olsovsky MR, Shorofsky SR, Gold MR. Effect of shock
polarity on biphasic defi brillation thresholds using an
active pectoral lead system. J Cardiovasc Electrophysiol
1998; 9:350–4.
131 Sweeney RJ, Gill RM, Jones JL, Reid PR. Defi brillation
using a high-frequency series of monophasic rectangu-
lar pulses: observations and model predictions. J Car-
diovasc Electrophysiol 1996; 7:134–43.
132 Fishler MG. Theoretical predictions of the optimal
monophasic and biphasic defi brillation waveshapes.
IEEE Trans Biomed Eng 2000; 47:59–67.
133 Klafter RD. An optimally energized cardiac pacemaker.
IEEE Trans Biomed Eng 1973; 20:350–6.
134 Hillsley RE, Walker RG, Swanson DK et al. Is the sec-
ond phase of a biphasic defi brillation waveform the
defi brillating phase? Pacing Clin Electrophysiol 1993;
16:1401–11.
135 Zhou X, Smith WM, Justice RK, Wayland JL, Ideker
RE. Transmembrane potential changes caused by
monophasic and biphasic shocks. Am J Physiol 1998;
275:H1798–807.
136 Tang AS, Yabe S, Wharton JM, Dolker M, Smith WM,
Ideker RE. Ventricular defi brillation using biphasic
waveforms: the importance of phasic duration. J Am
Coll Cardiol 1989; 13:207–14.
137 Jones JL, Jones RE. Decreased defi brillator-induced
dysfunction with biphasic rectangular waveforms. Am
J Physiol 1984; 247:H792–6.
138 Ideker RE, Wolf PD, Alferness C, Krassowska W, Smith
WM. Current concepts for selecting the location, size
and shape of defi brillation electrodes. Pacing Clin Elec-
trophysiol 1991; 14:227–40.
139 Gold MR, Foster AH, Shorofsky SR. Lead system opti-
mization for transvenous defi brillation. Am J Cardiol
1997; 80:1163–7.
140 Bardy GH, Dolack GL, Kudenchuk PJ, Poole JE, Mehra
R, Johnson G. Prospective, randomized comparison in
humans of a unipolar defi brillation system with that us-
ing an additional superior vena cava electrode. Circula-
tion 1994; 89:1090–3.
141 Winter J, Heil JE, Schumann C et al. Effect of implant-
able cardioverter/defi brillator lead placement in the
right ventricle on defi brillation energy requirements. A
combined experimental and clinical study. Eur J Cardi-
othorac Surg 1998; 14:419–25.
142 Gold MR, Olsovsky MR, DeGroot PJ, Cuello C, Shorof-
sky SR. Optimization of transvenous coil position for
active can defi brillation thresholds. J Cardiovasc Elec-
trophysiol 2000; 11:25–9.
143 Friedman PA, Rasmussen MJ, Grice S, Trusty J, Glikson
M, Stanton MS. Defi brillation thresholds are increased
by right-sided implantation of totally transvenous im-
plantable cardioverter defi brillators. Pacing Clin Elec-
trophysiol 1999; 22:1186–92.
144 Epstein AE, Kay GN, Plumb VJ, Voshage-Stahl L, Hull
ML. Elevated defi brillation threshold when right-sided
venous access is used for nonthoracotomy implantable
defi brillator lead implantation. The Endotak Investiga-
tors. J Cardiovasc Electrophysiol 1995; 6:979–86.
145 Heil JE, Lin Y, Derfus DL, Lang DJ. Impact of ICD elec-
trode position on transvenous defi brillation thresholds.
Pacing Clin Electrophysiol 1995; 18:873 (Abstract).

42 Cardiac Pacing, Defi brillation and Resynchronization: A Clinical Approach
146 Brady PA, Friedman PA, Trusty JM, Grice S, Hammill
SC, Stanton MS. High failure rate for an epicardial im-
plantable cardioverter-defi brillator lead: implications
for long-term follow-up of patients with an implant-
able cardioverter-defi brillator. J Am Coll Cardiol 1998;
31:616–22.
147 Buxton AE, Lee KL, DiCarlo L et al. Electrophysiologic
testing to identify patients with coronary artery disease
who are at risk for sudden death. Multicenter Unsus-
tained Tachycardia Trial Investigators. N Engl J Med
2000; 342:1937–45.
148 Bardy GH, Lee KL, Mark DB et al. Amiodarone or an
implantable cardioverter-defi brillator for congestive
heart failure. N Engl J Med 2005; 352:225–37.
149 The Antiarrhythmics versus Implantable Defi brillators
(AVID) Investigators. A comparison of antiarrhyth-
mic-drug therapy with implantable defi brillators in
patients resuscitated from near-fatal ventricular ar-
rhythmias. N Engl J Med 1997; 337:1576–83.
150 Moss AJ, Zareba W, Hall WJ et al. Prophylactic implan-
tation of a defi brillator in patients with myocardial in-
farction and reduced ejection fraction. N Engl J Med
2002; 346:877–83.
151 Carnes CA, Mehdirad AA, Nelson SD. Drug and defi bril-
lator interactions. Pharmacotherapy 1998; 18:516–25.
152 Shinlapawittayatorn K, Sungnoon R, Chattipakorn S,
Chattipakorn N. Effects of sildenafi l citrate on defi -
brillation effi cacy. J Cardiovasc Electrophysiol 2006;
17:292–5.
153 Carnes CA, Pickworth KK, Votolato NA, Raman SV. El-
evated defi brillation threshold with venlafaxine therapy.
Pharmacotherapy 2004; 24:1095–8.
154 Papaioannou GI, Kluger J. Ineffective ICD therapy due
to excessive alcohol and exercise. Pacing Clin Electro-
physiol 2002; 25:1144–5.
155 Hohnloser SH, Dorian P, Roberts R et al. Effect of amio-
darone and sotalol on ventricular defi brillation thresh-
old: the optimal pharmacological therapy in cardiovert-
er defi brillator patients (OPTIC) trial. Circulation 2006;
114:104–9.