1 Challenges in Scaling E-Business Sites Menascé and Almeida. All Rights Reserved. Daniel A....
37
1 Challenges in Scaling E-Business Sites Menascé and Almeida. All Rights Reserved. Daniel A. Menascé Department of Computer Science George Mason University
-
Upload
nora-booth -
Category
Documents
-
view
215 -
download
1
Transcript of 1 Challenges in Scaling E-Business Sites Menascé and Almeida. All Rights Reserved. Daniel A....

1
Challenges in Scaling E-Business Sites
Menascé and Almeida. All Rights Reserved.
Daniel A. MenascéDepartment of Computer Science
George Mason University
2
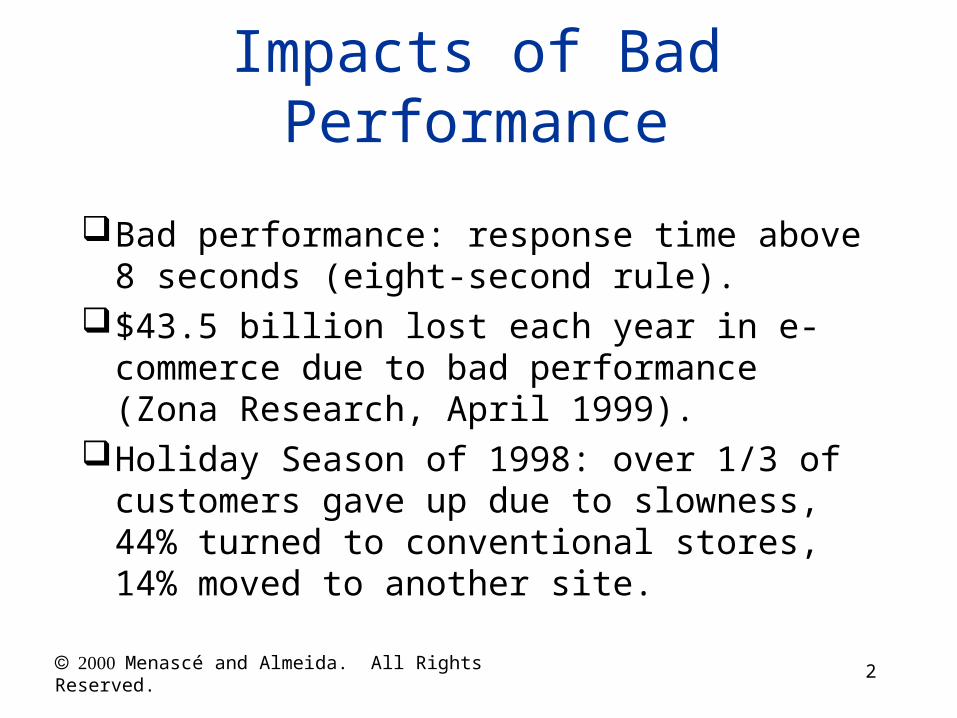
Impacts of Bad Performance
Bad performance: response time above 8 seconds (eight-second rule).
$43.5 billion lost each year in e-commerce due to bad performance (Zona Research, April 1999).
Holiday Season of 1998: over 1/3 of customers gave up due to slowness, 44% turned to conventional stores, 14% moved to another site.
Menascé and Almeida. All Rights Reserved.

3
Performance Problems for E-commerce tend to get worse!
Proliferation of mobile devicesEasier to use interfaces (VUI, wireless
and Web services on cars and airplanes, novel browsing paradigms)
Increasing load placed by agentsImpacts of authentication protocols
(e.g., TLS) on e-commerce site performance.
Menascé and Almeida. All Rights Reserved.

4
Typical QuestionsIs the online trading site prepared to
accommodate a 75% increase of trades/day?
Do I have enough servers to handle a peak demand 10x the average?
How fast can the site architecture be scaled up? What components should be upgraded? Database servers? Web servers? Application servers? Bandwidth?
How can I design a site that will meet its business goals?
Menascé and Almeida. All Rights Reserved.

5
Outline
ScalabilityA Reference Model for E-BusinessWorkload Characterization
Customer behavior model graphsClient/Server Interaction Diagrams
Concluding Remarks
Menascé and Almeida. All Rights Reserved.

6
A Reference Model for Electronic Business
BusinessModel
FunctionalModel
CustomerModel
ResourceModel
Characteristicsof the Business
NavigationalStructure of the
Site
Patterns ofCustomerBehavior
Site Architectureand ServiceDemands
External Metrics
Internal Metrics
Business View
TechnologicalView
Descriptors
Menascé and Almeida. All Rights Reserved.

7
External Metrics and Descriptors
Cover the Nature of BusinessMetrics:
Revenue throughput (dollars/sec)Potential lost revenue/secClick-to-look ratioLook-to-basket ratioBasket-to-buy ratioClick-to-buy ratioAvailabilityDownload timesPage views/dayUnique visitors/day
Menascé and Almeida. All Rights Reserved.

8
External Metrics and Descriptors
Descriptors:Number of registered customersNumber of potential customersMaximum number of simultaneous
customers in the storeNumber of items in the catalogEstimated operational cost
Menascé and Almeida. All Rights Reserved.

9
Workload Characterization
1. Determine the e-business functions made available by the site. Associate URLs or URL patterns to each e-business function.
2. Analyze the site’s HTTP logs to determine customer sessions.
3. Cluster customer sessions into groups of “similar” customer sessions, i.e., sessions that exhibit similar behavior.
Menascé and Almeida. All Rights Reserved.

10
home
browse
search
add select
pay
0.5
0.50.3
0.3
0.35
0.35 0.15
0.15 0.2
0.2
0.3
0.3
0.3
0.1
0.2
0.10.4
0.10.1
0.1 1.0
entry
1.0
Customer Behavior Model Graph
Menascé and Almeida. All Rights Reserved.

11
Metrics Derived from the CBMG
Average Number of Visits Per StateE.g., average number of searches per visit
to the site,
Average Buy (or open account) to Visit Ratio – also called conversion ratio.
Average Session Length Per Visit
Menascé and Almeida. All Rights Reserved.

12
Metrics Derived from the CBMG
1
1,
1n
kjkkj
entry
pVV
V
Menascé and Almeida. All Rights Reserved.
13
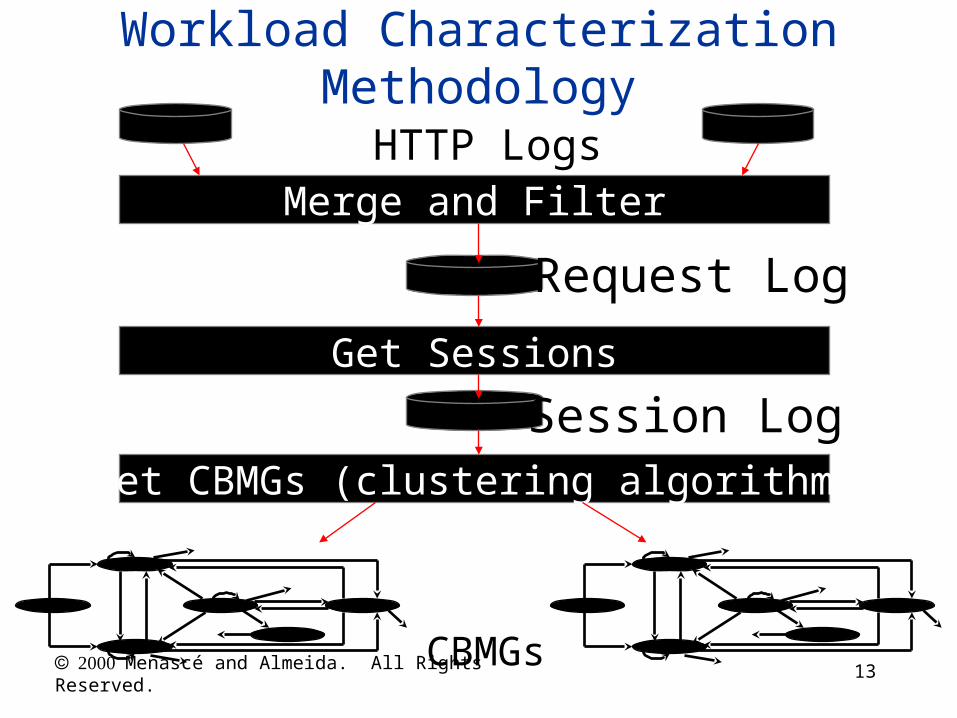
Workload Characterization Methodology
Merge and Filter
Get Sessions
Get CBMGs (clustering algorithm)
HTTP Logs
Session Log
CBMGs
Request Log
Menascé and Almeida. All Rights Reserved.

14
Result of Clustering Analysis
Cluster 1 2 3 4 5 6% of Sessions 44.28 28.00 10.60 9.29 6.20 1.50BV Ratio (%) 5.70 4.50 3.70 4.00 3.50 2.00Session Length 5.6 15 27 28 50 81AV Ratio (%) 11 15 21 20 32 50Vb+Vs 3.6 11.4 20 23 39 70
• Cluster 1: majority of sessions, short sessions, and highest BV ratio.
• Cluster 6: small fraction of sessions, large sessions, smallest BV ratio.
Menascé and Almeida. All Rights Reserved.

15
Buy to Visit Ratio vs. Session Length
y = 0.0003x2 - 0.07x + 5.7919
R2 = 0.931
0
1
2
3
4
5
6
7
0 10 20 30 40 50 60 70 80 90
Session Length
Menascé and Almeida. All Rights Reserved.

16
Architecture of E-Commerce Sites
Internet
E-business site
web andauthentication
servers
transactionservers
client
Mainframe:•legacy applications•enterprise data
LAN
LAN
Internet
E-business site
web andauthentication
servers
transactionservers
client
Mainframe:•legacy applications•enterprise data
LAN
LAN
Menascé and Almeida. All Rights Reserved.

17
RemarksFor e-commerce, need to characterize
the workload at higher levels of abstraction: sessions vs. requests.
Workload characterization has to be customer behavior-oriented as opposed to request-oriented.
Customer Behavior Model Graphs capture customer behavior and can be mapped to resource demands.
Menascé and Almeida. All Rights Reserved.
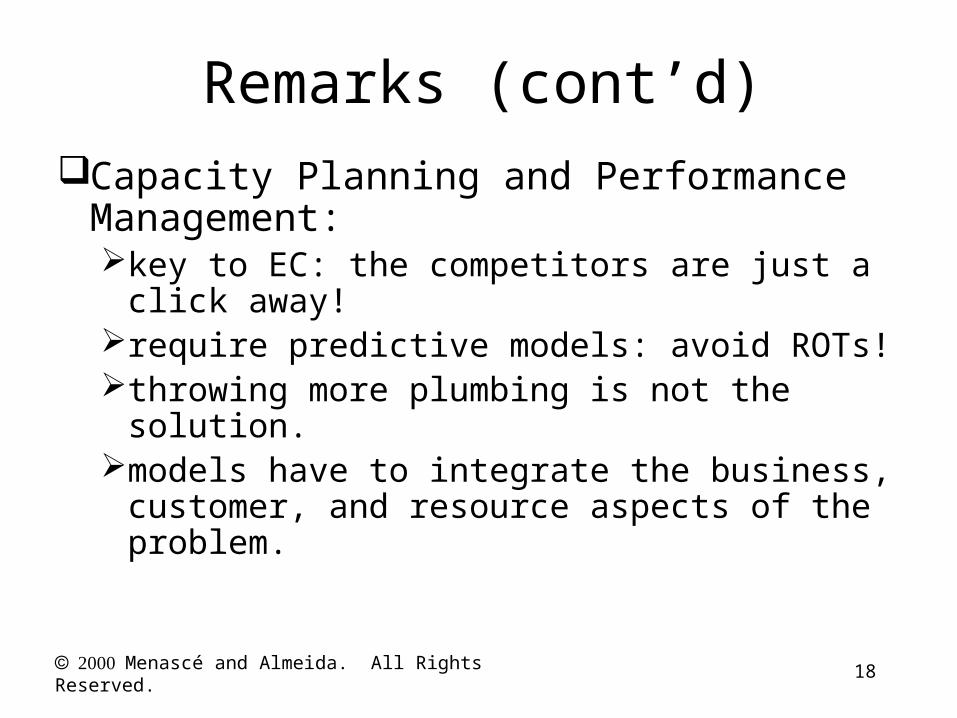
18
Capacity Planning and Performance Management:key to EC: the competitors are just a click
away!require predictive models: avoid ROTs!throwing more plumbing is not the
solution.models have to integrate the business,
customer, and resource aspects of the problem.
Remarks (cont’d)
Menascé and Almeida. All Rights Reserved.

19
Performance Models ofE-Commerce Sites
Daniel A. MenascéDept. of Computer ScienceGeorge Mason University

20
Component-level modelsserver
incominglink
outgoinglink
server

21
Component-level modelsserver
cpu
disk 1
disk 2
incominglink
outgoinglink
server

22
Component-level modelsserver
cpu
disk 1
disk 2
incominglink
outgoinglink
server

23
Component-level Models
Each component is represented by a resource (e.g. CPU, disk, communication link) and a queue of requests waiting for the resource.
resource
queue
24
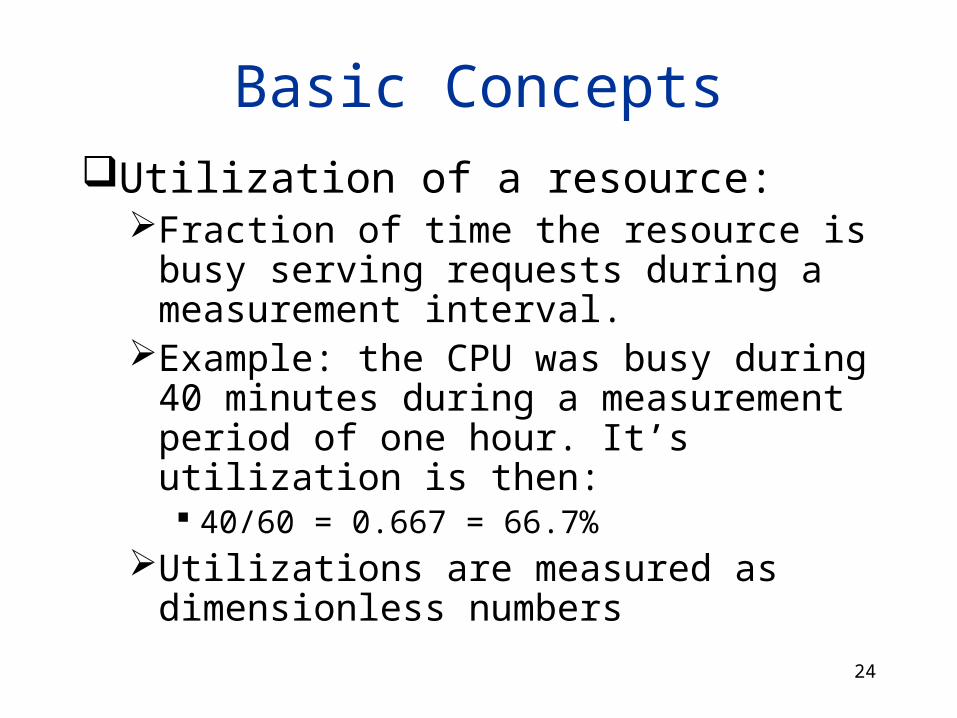
Basic ConceptsUtilization of a resource:
Fraction of time the resource is busy serving requests during a measurement interval.
Example: the CPU was busy during 40 minutes during a measurement period of one hour. It’s utilization is then: 40/60 = 0.667 = 66.7%
Utilizations are measured as dimensionless numbers

25
Basic Concepts (cont’d)
A request may be using a resource (e.g., CPU, disk, etc) or waiting to use it.
The time spent using the resource does not depend on the number of resources waiting to use the resource.
The time spent waiting to use the resource depends on the load, i.e., on the number of requests in the queue waiting to use the resource.

26
Performance Model Parameters
Workload IntensityHTPP Requests/secTransactions/secE-business functions/sec
Service demands for each resource and each type of request.

27
Service Demandscpu
disk 1
disk 2
incominglink
outgoinglink
server
0.109 sec0.00107 sec
0.003 sec
0.08 sec
0.12 sec
Service demands do not include any queuing time! It is justservice time.

28
Computing Waiting Timescpu
disk 1
disk 2
incominglink
outgoinglink
server
0.109 sec0.00107 sec
0.003 sec
0.08 sec
0.12 sec
Waiting times depend on the load (arrival rate of requests) and on the service demands.

29
Di
Ri
i
ii D
DR
1'
Service demandat resource i
Utilization of resource i (Ui)
Computing Residence Times
Residence time at resource i

30
Residence Time at Incoming Linkcpu
disk 1
disk 2
incominglink
outgoinglink
Webserver
0.109 sec0.00107 sec0.003 sec
0.08 sec
0.12 sec req/sec
sec 00108.0
00107.051
00107.0
1'
IncLink
IncLinkIncLink D
DR

31
Residence Time at Outgoing Linkcpu
disk 1
disk 2
incominglink
outgoinglink
Webserver
0.109 sec0.00107 sec0.003 sec
0.08 sec
0.12 sec req/sec
sec 239.0
109.051
109.0
1'
OutLink
OutLinkOutlink D
DR
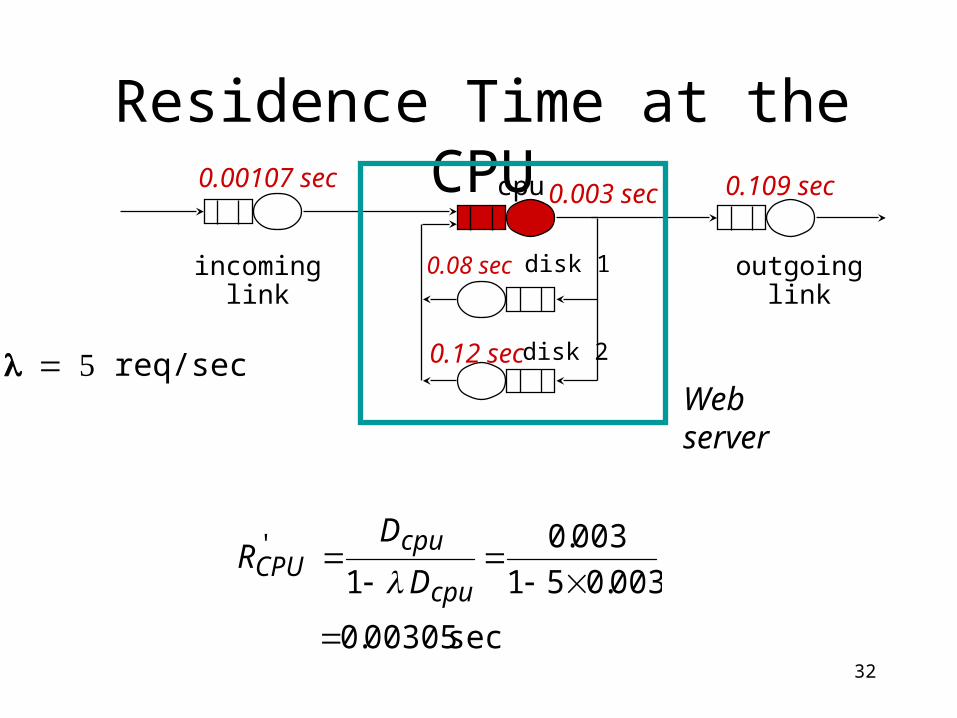
32
Residence Time at the CPUcpu
disk 1
disk 2
incominglink
outgoinglink
Webserver
0.109 sec0.00107 sec0.003 sec
0.08 sec
0.12 sec req/sec
sec 00305.0
003.051
003.0
1'
cpu
cpuCPU D
DR

33
Residence Time at Disk 1cpu
disk 1
disk 2
incominglink
outgoinglink
Webserver
0.109 sec0.00107 sec0.003 sec
0.08 sec
0.12 sec req/sec
sec 133.0
08.051
08.0
1 1
1'1
disk
diskdisk D
DR

34
Residence Time at Disk 2cpu
disk 1
disk 2
incominglink
outgoinglink
Webserver
0.109 sec0.00107 sec0.003 sec
0.08 sec
0.12 sec req/sec
sec 3.0
12.051
12.0
1 2
2'2
disk
diskdisk D
DR

35
Summary of Results
Average Response TimeSum of service demands

36
Response vs. Arrival Rate
0
0.5
1
1.5
2
2.5
3
3.5
4
4.5
1 2 3 4 5 6 7 8
Arrival Rate (requests/sec)
Res
po
nse
Tim
e (s
ec)

37
Example: online trading site
Open QN for the online trading site:
i
ii
lioShowPortfo
U
DR
RRRRRRR
1'
'6
'5
'4
'3
'2
'1