
1 CEDBR Fiscal Benefit – Cost Model Pattie Bradley, Senior Research Economist Center for Economic...
15
1 CEDBR Fiscal Benefit – Cost Model Pattie Bradley, Senior Research Economist Center for Economic Development and Business Research July 2013
-
Upload
brittany-phoebe-gibson -
Category
Documents
-
view
217 -
download
0
Transcript of 1 CEDBR Fiscal Benefit – Cost Model Pattie Bradley, Senior Research Economist Center for Economic...

1
CEDBR Fiscal Benefit – Cost Model
Pattie Bradley, Senior Research Economist
Center for Economic Development and Business Research
July 2013

2
History of Model Development
• Court of Tax Appeals (COTA) requires analysis for tax abatements and IRBs
• State model developed and funded by Kansas Inc. and Kansas League of Municipalities in 1993, but not kept up-to-date
• Greater Wichita Economic Development Coalition provided funding for the development of the CEDBR model in 2005
• The CEDBR model has been expanded to provide customized analysis across the state of Kansas
3
3
Model Components
4
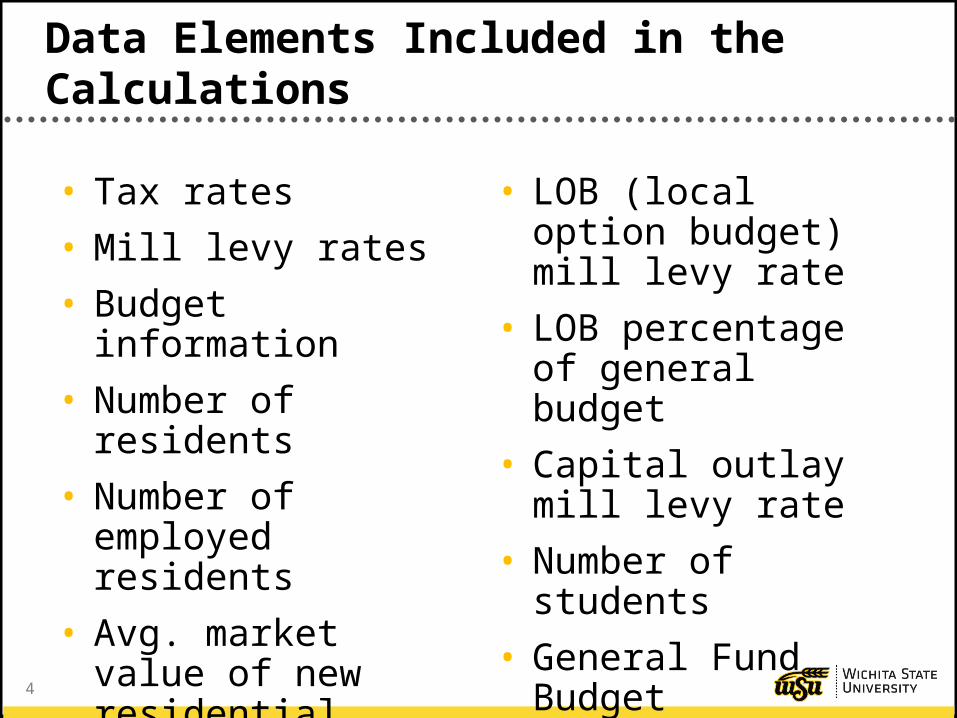
Data Elements Included in the Calculations
• Tax rates
• Mill levy rates
• Budget information
• Number of residents
• Number of employed residents
• Avg. market value of new residential property
• Avg. wage all jobs
• LOB (local option budget) mill levy rate
• LOB percentage of general budget
• Capital outlay mill levy rate
• Number of students
• General Fund Budget

5
Multipliers
• Calculated by the U.S. Department of Commerce, Bureau of Economic Analysis
• Measure the impact of business operations on other businesses in the community
• Measure the impact of payroll expenditures on other businesses in the community
• Accounts for the indirect and induced impacts of the original economic event

6
Worker Spending Patterns
• A major source of revenue for taxing jurisdictions is retail sales taxes
• These revenues are estimated from:– percentage of a company’s sales and purchases subject to sales tax– Percentage of an employee’s payroll likely to be spent on taxable
goods in a given area
• The model also includes retail sales tax generated from construction and construction worker spending patterns

7
Substitution
• Individual industries have a predetermined substitution rate
• Substitution rates are based on the nature of the industry:
• Base – brings outside dollars in• Support – reshuffles existing dollars
• Although substitution rates are predetermined for an industry, they can be customized given the unique nature of each project

8
Firm Data
• Company Information
• Site Location
• Real Property Construction and Improvements
• Firm Operations
• Firm Employment
• Visitors

9
Incentives
• Sales Tax Exemption on Construction Materials
• Sales Tax Exemption for Operations
• Property Tax Abatement
• Forgivable Loans
• State Training Dollars
• Infrastructure Improvements

10
10
Impact Report

11
Impact Report
• Project summary
• Incentive summary by taxing jurisdiction
• Tax abatement parameters
• Construction impacts
• Substitution
• Multipliers
• Economic impact of firm operations
• Fiscal impact– Present value of net benefits– Return on investment– Benefit-cost ratio

12
Impact Report

13
13
Desktop Model
14
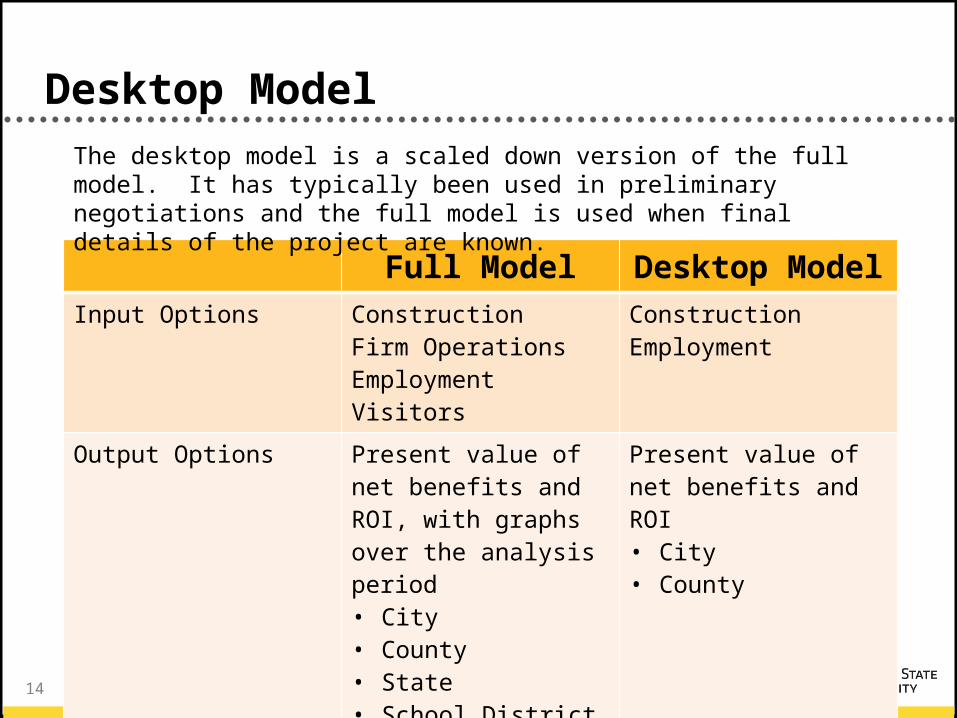
Desktop Model
Full Model Desktop ModelInput Options Construction
Firm OperationsEmploymentVisitors
ConstructionEmployment
Output Options Present value of net benefits and ROI, with graphs over the analysis period• City• County• State• School District
Present value of net benefits and ROI• City• County
The desktop model is a scaled down version of the full model. It has typically been used in preliminary negotiations and the full model is used when final details of the project are known.

15
Contact Information
Questions or Pricing Information
Please Contact
Pattie Bradley
(316) 978-5036


