1 Biogas production with horse dung in solid-phase - Sigrid Kusch
27
1 This is a personal author version of the article published by Elsevier Ltd. in its journal Bioresource Technology. This version is made available by the authors as voluntary posting on open web sites operated by author or author’s institution for scholarly purposes only, in accordance with the journal’s author permission rights. This version and the published journal version are identical in content, but contain modifications in formatting or editing. The full citation of the published journal article is as follows: Kusch, Sigrid; Oechsner, Hans; Jungbluth, Thomas: Biogas production with horse dung in solid- phase digestion systems. Bioresource Technology 99, 2008, 1280-1292 doi:10.1016/j.biortech.2007.02.008 http://www.sciencedirect.com/science/article/pii/S0960852407001484 http://www.sciencedirect.com/science/journal/09608524/99/5 http://www.journals.elsevier.com/bioresource-technology/ Biogas production with horse dung in solid-phase digestion systems Sigrid Kusch , Hans Oechsner, Thomas Jungbluth University of Hohenheim, Institute for Agricultural Engineering, State Institute for Machinery and Construction in Agriculture, Garbenstraße 9, D-70599 Stuttgart, Germany Abstract Experiments on methanogenesis from horse dung were conducted in laboratory-scale batch reactors in order to determine the substrate performance in a solid-phase digestion process, more specifically in terms of potential energy recovery and suitable process technology. Dung from a horse stable with straw bedding was used. The temperature was kept in the mesophilic range. In the percolation process (with process water sprinkled over the stacked biomass) a proportion of 10-20% of solid inoculum (pre-digested horse dung) was found to be suitable. Comparative experiments with both percolation and flooding revealed a higher biogas production per volume for the flooded process, as no addition of solid inoculum was necessary. Methane yield from fresh material was similar in both processes: around 170 L N CH 4 per kg VS added was obtained in six-week cycles with untreated material under optimized conditions. Methane production was increased after chopping the substrate. Pre-aeration resulted in decreased methane production. Corresponding author. Fax: +49 711 45922519. Tel: +49 711 45923514 E-mail address: [email protected]
Transcript of 1 Biogas production with horse dung in solid-phase - Sigrid Kusch
1
This is a personal author version of the article published by Elsevier Ltd. in its journal Bioresource Technology. This version is made available by the authors as voluntary posting on open web sites operated by author or author’s institution for scholarly purposes only, in accordance with the journal’s author permission rights.
This version and the published journal version are identical in content, but contain modifications in formatting or editing. The full citation of the published journal article is as follows:
Kusch, Sigrid; Oechsner, Hans; Jungbluth, Thomas: Biogas production with horse dung in solid-phase digestion systems. Bioresource Technology 99, 2008, 1280-1292
doi:10.1016/j.biortech.2007.02.008
http://www.sciencedirect.com/science/article/pii/S0960852407001484
http://www.sciencedirect.com/science/journal/09608524/99/5
http://www.journals.elsevier.com/bioresource-technology/
Biogas production with horse dung in solid-phase digestion systems
Sigrid Kusch, Hans Oechsner, Thomas Jungbluth
University of Hohenheim, Institute for Agricultural Engineering, State Institute for Machinery and
Construction in Agriculture, Garbenstraße 9, D-70599 Stuttgart, Germany
Abstract
Experiments on methanogenesis from horse dung were conducted in laboratory-scale batch
reactors in order to determine the substrate performance in a solid-phase digestion process,
more specifically in terms of potential energy recovery and suitable process technology. Dung
from a horse stable with straw bedding was used. The temperature was kept in the mesophilic
range. In the percolation process (with process water sprinkled over the stacked biomass) a
proportion of 10-20% of solid inoculum (pre-digested horse dung) was found to be suitable.
Comparative experiments with both percolation and flooding revealed a higher biogas
production per volume for the flooded process, as no addition of solid inoculum was necessary.
Methane yield from fresh material was similar in both processes: around 170 LN CH4 per kg VS
added was obtained in six-week cycles with untreated material under optimized conditions.
Methane production was increased after chopping the substrate. Pre-aeration resulted in
decreased methane production.
Corresponding author. Fax: +49 711 45922519. Tel: +49 711 45923514 E-mail address: [email protected]

2
Keywords: anaerobic digestion, dry digestion, high-solids digestion, percolation, flooding
1. Introduction
Digestion with an elevated content of total solids (TS) is widely used for municipal solid waste
(MSW). Since 1993, what are called dry digestion plants (>20% TS in the feed) have been
constructed more often than wet digestion plants (<10% TS in the feed) (Bolzonella et al.,
2003). Continuous single-phase processes are predominant. In Europe, only 11% of the total
digestion capacity is offered by two-phase systems (De Baere, 2000), probably because single-
phase systems are cheaper with regards to the investment and maintenance required (Mata-
Alvarez et al., 2000). Several advantages of two-phase systems have been reported (Cho et al.,
1995; Ghosh and Klass, 1978; Llabrés-Luengo and Mata-Alvarez, 1988; O’Keefe and
Chynoweth, 2000; Raynal et al., 1998; Zoetemeyer et al., 1982). While during the first phase
appropriate conditions accelerate liquefaction, the second phase converts soluble matter into
biogas. This allows for a more rapid and more stable process compared to single-phase
systems (O’Keefe and Chynoweth, 2000). However, distinct separation between hydrolysis-
acidification and methanation is difficult to maintain (Cho et al., 1995; Christ, 1999; Mata-
Alvarez et al., 2000; Raynal et al., 1998), which may eliminate the associated benefits of a two-
phase system (O’Keefe and Chynoweth, 2000). Phase separation appears to be more difficult
for slowly hydrolysable substrates (Chanakya et al., 1992). For solid materials with slow
degradability, single-phase digestion is recommended (Christ, 1999; Wechs, 1985). For easily
degradable materials, a two-phase system is considered more advisable (Mata-Alvarez et al.,
2000; Pavan et al., 2000). With systems in which leachate trickles through a biomass bed,
phase separation may be more difficult to achieve than with stirred digesters due to lack of
mixing and low ion diffusion in a non-flooded matrix (O’Keefe and Chynoweth, 2000).
In agriculture, slurry-based liquid-phase digestion is widely applied today, but digestion
with elevated TS contents promises further development. Research data has been published on
the digestion of crop residues, herbs and leafy biomass (Anand et al., 1991; Chanakya et al.,
1993; 1997; Jewell et al., 1982; Legrand and Jewell, 1987; Liu et al., 1987; Sun et al., 1987),
dairy manure (Kalia and Singh, 2001; Linke, 2000; Schäfer et al., 2005; Weizhong et al., 1999),

3
pig dung (Zelter, 1978), yard waste (O’Keefe et al., 1993; Owens and Chynoweth, 1992),
energy crops (Jewell et al., 1993) and various ensiled substrates (Linke and Schelle, 2001).
Batch digestion is a simpler method than continuous digestion (Ten Brummeler and
Koster, 1990). In general, batch-operated solid-phase installations in agriculture have a volume
of 100-150 m³ per reactor (Weiland, 2004). In what is called the percolation process, liquid is
recirculated and sprinkled over the stacked material in order to initiate biogas production and
encourage bacteriological activity in the decomposing biomass throughout the process.
Biological activities are limited by an inadequate supply of moisture and associated
organisms and nutrients (Chen and Chynoweth, 1995). A leachate flow through a biomass bed
accelerates mass transfer by adding convective transport mechanisms to molecular diffusion
(Martin, 1999). Leachate recycling has been found favourable for anaerobic decomposition of
landfill material (Barlaz et al., 1992; Chan et al., 2002; Mata-Alvarez and Martinez-Viturtia,
1986; Mehta et al., 2002). However, it has also been reported that acidogenesis in particular
may be enhanced, which may result in the inhibition of methanogenesis (Komilis et al., 1999a).
Optimal conditions for methanogens are especially important in the initial stage; therefore, low
leachate recirculation rates should be chosen when initiating the process (Vavilin et al., 2002;
2003). Recirculating leachate within an already acidified cell will not correct the problem
(O’Keefe and Chynoweth, 2000). The exchange of leachate between a batch of previously
stabilized waste and a batch of fresh waste enhances degradation (Chugh et al., 1999;
Chynoweth et al., 1992; O’Keefe et al., 1993; Suna Erses and Onay, 2003). Compaction can
hinder the proper distribution of leachate (Komilis et al., 1999a). For MSW, Chen and
Chynoweth (1995) found a logarithmic relationship between hydraulic conductivity and packing
density.
During start-up phases, the microbial community should contain sufficient levels of
methanogens to prevent digester failure (Griffin et al., 1998). The conversion of hydrolyzed
organics to volatile fatty acids (VFA) will result in VFA accumulation along with a drop in pH if
acids are not metabolized by methanogens. Methane bacteria are sensitive to pH (Clark and
Speece, 1970), values >6.5 (Christ, 1999) or >6.8 (Chen and Hashimoto, 1996) and in general
<7.5 are recommended. The addition of an appropriate inoculum ratio is favourable during start-
up (Chen and Hashimoto, 1996; Ten Brummeler and Koster, 1989), and inoculum quality is also
important (Dirar and El Amin, 1988). The hypothesis has been proposed that in a bed of organic

4
substrate, anaerobic digestion is initiated by seed bodies around which reaction zones gradually
develop (Martin et al., 2003). When densely seeded with inoculum, the expansion of
methanogenic areas into the total volume of the digester occurs quite rapidly (Martin et al.,
2003; Vavilin et al., 2002). Unnecessarily high levels of inoculum lead to increased digester
sizes and would therefore be undesirable (Chanakya et al., 1997).
Greater particle-substrate surface areas increase contact between micro-organisms and
organic mass (Barlaz et al., 1990). The positive effects on the biodegradability after size
reduction of substrate particles have been discussed by Mata-Alvarez et al. (2000); biofibre
degradation may be enhanced by shearing rather than by an actual change in size distribution.
However, accelerated hydrolysis and acid generation might also inhibit methanogens.
Contradictory results regarding the shredding of MSW have been discussed by Komilis et al.
(1999b); increased compaction was also qualified as negative.
Pre-aeration is carried out in solid-phase digestion systems to reduce the anaerobic heat
requirement by using the temperature increase resulting from the composting step. Pre-aeration
may also reduce acidification during start-up phases (Ten Brummeler and Koster, 1990). It has
also been hypothesized that pre-composted solid substrate is more easily degradable in an
anaerobic system because the aerobic treatment allows a depolymerization of complex organic
fractions (Komilis et al., 1999b; Mata-Alvarez et al., 1993). However, the pool of organic
material for biogasification is lower due to the fact that easily degradable components are
already metabolized (O’Keefe and Chynoweth, 2000; Ten Brummeler and Koster, 1990).
The anaerobic digestibility of horse dung is documented in literature (Mandal and Mandal,
1998). Kalia and Singh (1998) observed phase separation, with fibrous horse dung floating at
the top of the liquid phase, which was found unsuitable for running a continuous slurry-based
digester with higher ratios of horse dung. Gas production with mixtures of horse and cattle dung
was slightly poorer than with cattle dung alone.
In this study, horse dung was digested in laboratory-scale solid-phase reactors both with
percolation and in flooded mode. In an initial experiment the necessary proportion of solid
inoculum (pre-fermented horse dung) was determined. In a second experiment percolation and
flooding were directly compared, using process water containing methanogenic bacteria.
Furthermore, the dung was flooded with potable water in order to investigate the possibility of
biogas production without the addition of any inoculation material. One test cell was pre-aerated

5
before flooding in order to find out if an intensified aerobic phase leads to an improvement in the
microbiological breakdown of the substrate structure and therefore to higher biogas production.
Whether or not gasification is positively influenced by chopping the substrate was also
investigated.
2. Materials and methods
2.1. Reactor design and operation
All nine reactors (Figure 1) were water-jacketed and thermostatted stainless steel cylinders
(solid material content: around 50 L; inner diameter 30 cm). Leachate was collected in a liquid-
phase reservoir at the base. Liquid pumps (average liquid flow: 4.7 L/min) were set with timers
to sprinkle leachate over the biomass bed automatically. Substrate temperature in the middle of
the digester and at a height of 13 cm above the substrate ground was measured (Pt1000) and
recorded twice per hour with a data logger. Biogas was collected in aluminium coated
PE/PTFE-gas bags. The digesters offered the possibility to aerate the substrate. Gas from the
aerated phase was sent directly to a bellows-type gas flow meter.
2.2. Experimental configuration
Two experimental runs with 9 test cells each were performed; Table 1 summarizes the
experimental set-up.
In experiment 1 fresh material (FM) was digested with percolation in mixtures with
different proportions of solid inoculum (SI): 10, 20, 30, 40, 44 and 50% (w/w) on a TS-basis
(further referred to as SI_10, SI_20, SI_30, SI_40, SI_44, SI_50). Pure solid inoculum was also
digested with percolation (SI_100). Pure fresh material was digested both with percolation
(FM_percol) and flooded with liquid inoculum (FM_flood).
In experiment 2, in response to the results of experiment 1, horse dung with 20% solid
inoculum was digested with percolation in two replicates (Percol1, Percol2). In two reactors
horse dung was flooded with liquid inoculum (FloodLI1, FloodLI2); in two others with potable
water (FloodPW1, FloodPW2). Chopped dung (sent twice through a compost chopper; final
straw particle size around 4 cm) was flooded with liquid inoculum in two replicates (ChoppLI1,
ChoppLI2). In the 9th reactor (Aeration) digestion was started after pre-aeration (48 h, 160
L air/h).
6
For mixtures of fresh substrate and solid inoculum, fractions were first homogenized after
a simplified quartering method (opposite quarters were not remixed): material was poured onto
a flat surface and after intensive mixing, it was divided into quarters; then, paying special
attention so as not to lose the fine material, each quarter was remixed and divided again into
quarters until the desired volume was reached. The final mixture of fresh material with solid
inoculum was thoroughly carried out by hand. The weights of the materials added were
determined when preparing substrate mixtures and the volumes of the mixtures when filling the
reactors under very low compaction by hand. At the beginning, the same amount of liquid
inoculum (LI) was added to all percolated test cells until percolation (recirculation of liquid) for
15 minutes was possible in the first cell. Different amounts of potable water were added to the
others until percolation was possible in all of them.
Experiment 1 was run over a period of 74 days and experiment 2 over a period of 46
days. The target temperature was 35°C. Leachate was recirculated twice daily for 15 minutes in
all reactors (percolated and flooded cells). Additionally, leachate was recirculated (15 to 20 min)
prior to sampling. It is assumed that this ensured an equalisation between free leachate and
liquid retained in the substrate body. It is also assumed that analysing the liquid phase enabled
the evaluation of the conditions in the substrate body, e.g. accumulation of inhibitory
substances. Leachate was sampled periodically and analysed for pH, VFA, NH4-N, Total
Kjeldahl Nitrogen (TKN), chemical oxygen demand (COD), TS and volatile solids (VS), as was
liquid at the beginning and the end of an experimental run. Solid material was sampled before
and after digestion and analysed for TS and VS.
2.3. Differentiation between methane yield and methane production (release)
A certain amount of biogas is not released from the reactor but remains inside, filling pores of
the substrate stack and empty spaces (e.g. as occurs after substrate compaction). The volume
of void space above the solid residue was determined (by measuring the corresponding height),
but biogas filling the substrate pores was neglected. Gas quality was assumed to be identical to
the quality in the gas bag that was measured previously; thus, methane volumes remaining
inside the reactors were calculated. These volumes are taken into account whenever methane
yields and exploitation degrees are discussed. They are not taken into consideration when
methane production is presented in cumulative form over the digestion time (methane release

7
from the reactor). At full-scale, only the methane released from the reactor would be usable and
not the actual yield.
2.4. Calculation of CH4-yield from fresh material (GFM) in mixtures
In mixtures with solid inoculum and/or liquid inoculum the methane yield from the component
fresh material GFM can be derived from the total yield of the mixture if the individual yields from
solid and liquid inoculum are known (assuming that the specific yields of inocula do not change
in the mixture). For these calculations the total methane yield (methane released from digester
plus methane remaining inside void digester spaces) was taken into account.
In experiment 1 the CH4-yield from solid inoculum was determined using reactor SI_100.
In experiment 2, trials to digest solid inoculum in 5 L bottles failed. Therefore, this value was
calculated by assuming that the solid inoculum, which was the solid residue from experiment 1,
consisted of two parts: a) material which in experiment 1 was previously solid inoculum and b)
material which in experiment 1 was previously fresh material. The probable methane yield for
part a in experiment 2 was determined by extrapolating the data from reactor SI_100 (according
to the procedure for determining the total methane potential which will be described later, also
see Figure 2). It was assumed that the CH4-yield for part b during experiment 2 was 90% of the
difference between the total methane potential (Gpot) and the yield already obtained during the
74 days of experiment 1.
CH4-yield of the component liquid inoculum was determined using the equipment for the
HBT method (Hohenheim biogas yield test) (Helffrich and Oechsner, 2003a; 2003b) and
digesting 30 mL of liquid in three replicates.
2.5. Total methane potential (Gpot) and exploitation degree (q)
The total methane potential of horse dung (fresh material in experiment 1) was determined with
the HBT (Helffrich and Oechsner, 2003a; 2003b). In a 100 mL glass syringe (flask sampler), 0.5
g of test substrate (dried at 60°C over 48 h, ground <1 mm) and 30 mL inoculum (pre-digested
liquid manure) were digested at 37°C in three replicates. The volume and methane content of
the biogas produced were recorded periodically. Inoculum without substrate was digested as
zero variant with three replicates as well.

8
After 44 days the test was stopped. The total methane potential )G(tGpot was
calculated by extrapolation, based on a non-linear curve fit for the experimental data of the
decay phase (declining gas production rate) (Figure 2). According to the biochemical
degradation of solid materials in landfills (Kruse, 1994), it was assumed that gas production in
the decay phase could be best described by the sum of two decay functions in the form
tk2
tk1
21 ebebaG(t) (with G(t): methane yield at time t; a, bi, ki: const.).
The actual methane yield depends not only on the total methane potential but also on
digestion time and degradation kinetics, which is influenced by substrate characteristics
(including pre-treatment) and process conditions. The exploitation degree pottiFM,ti /GGq at a
specific point in time ti was determined after calculating the methane yield from the component
fresh horse dung GFM,ti as described above (part 2.4.).
2.6. Substrates
The main substrate properties are summarized in Table 2. Horse dung was collected from a
typical horse stable with straw bedding. The proportion of straw in the manure was high. The
dung for the two experiments was collected separately; in experiment 2 the proportion of faeces
appeared slightly higher upon visual inspection. Pre-digested substrate as solid inoculum for
experiment 1 was taken directly from the large-scale digester at this stable, where flooded horse
dung was digested as a mono substrate in a one-phase, batch-operated solid-phase process in
six-week cycles (with no recirculation of process water within one reactor or between different
reactors during this time, and no reactor heating), as described elsewhere (Kusch and
Oechsner, 2004). Liquid inoculum for experiment 1 was taken from the same digester.
The solid inoculum used in experiment 2 was the mixed solid residue from all nine
reactors of experiment 1. Liquid inoculum was also gained from experiment 1: at the end of
experiment 1 the liquid of all nine reactors was mixed and diluted with potable water in a 1:1-
ratio (v/v).
2.7. Analyses
CH4- and CO2-quality were determined by infrared spectroscopy (Siemens Ultramat, calibration
before every reading). Gas quantity was determined with a bellows-type gas flow meter (GMT,

9
reading accuracy 0.1 L), calibrated to the flow of the vacuum pump (45 L/min). Gas volumes
were corrected to norm litres (LN), taking into account norm pressure and norm temperature
(1.013 bar, 0°C).
Solid samples were analysed directly. Liquid samples were analysed either directly, within
24 hours after storage at 5°C or after being kept frozen at -22°C (but pH was always measured
directly from the fresh sample). TS was determined by drying the samples at 105°C (solid
samples 48 h, liquids 12 h) and VS by incineration of the samples at 550°C in a muffle kiln
(ground solid samples >12 h, liquids approx. 8 h). The analytical methods used for COD, pH,
NH4-N and TKN conformed to DIN/EN-standards (DEV, 2004). VFA represent the sum of acetic,
propionic, butyric, valeric and caproic acids and were measured by gas chromatography (GC)
as follows: 1 µL supernatant (1 g sample, acidified with formic acidconc, diluted 1:10, 15 min
centrifuged at 16110 x g) was injected into a Varian CP-3800 GC (capillary column SGE BP 21,
25 m x 0.32 mm, 0.25 µm film; helium carrier gas at 40 mL/min in split 1:10; column
temperature sequence: 40°C for 2 min, ramp of 15°C/min, 125°C for 1.5 min, ramp of 25°C/min,
180°C for 5 min; injector temperature 180°C), equipped with a flame ionization detector (280°C).
3. Results and discussion
3.1. Total methane potential
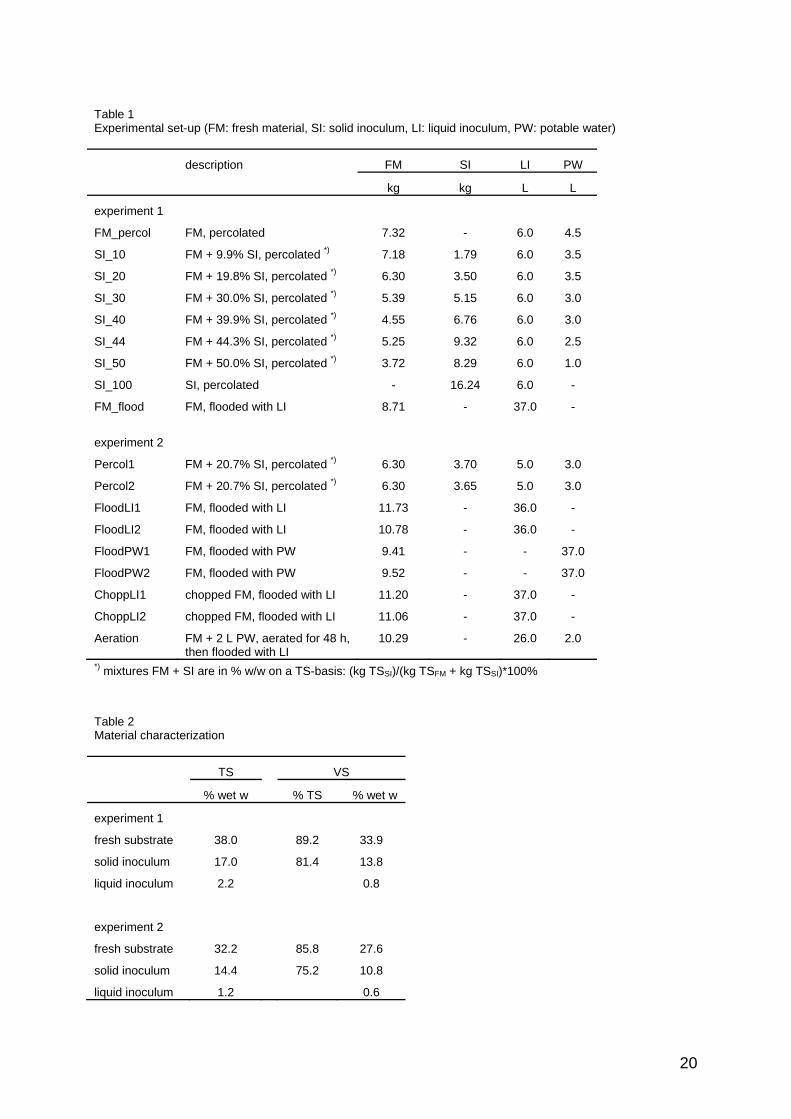
The total methane potential Gpot of the fresh horse dung used in experiment 1 was determined
as 277.0 LN CH4/kg VSadded (Figure 3). This is lower than the methane potential reported for
wheat straw by Tong et al. (1990) of 302 or 333 LN CH4/kg VSadded (two straw types, finely
milled, 60 days in optimized batch test). Møller et al. (2004) found final methane yields of 195 LN
CH4/kg VSadded for wheat straw (cut to 1 mm, 110 days), but quoted values of up to 241 L
CH4/kg VSadded from literature.
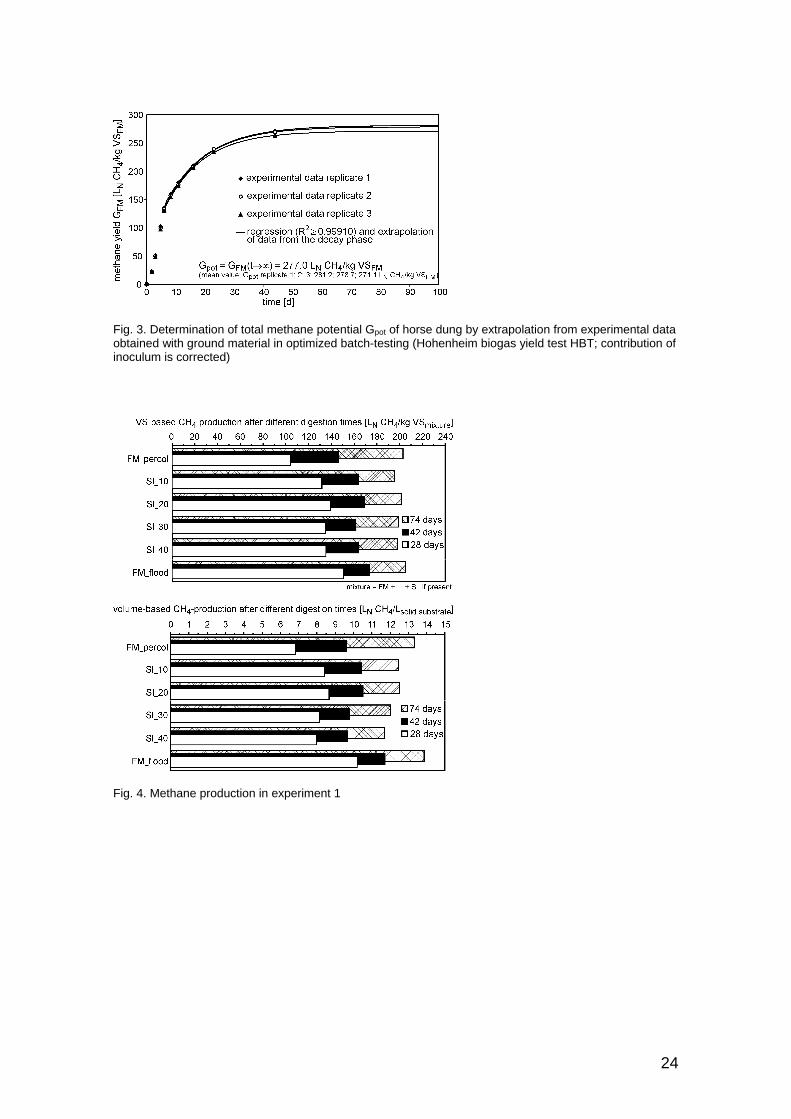
3.2. Ratio of solid inoculum
Among the percolated reactors in experiment 1, SI_20 had the highest methane production after
28 days (Figure 4), but differences were only marginal within group SI_10/20/30/40. This is due
to the very high CH4-yield of the solid inoculum. After 28, 42 and 74 days, the methane
productions from SI_100 were 122.4, 159.2 and 188.9 LN CH4/kg VSadded,SI, respectively; these
values are close to the amounts of methane produced by reactors containing fresh material and

10
indicate that digestion quality in the full-scale plant was poor. Indeed, severe problems,
especially concerning temperature maintenance, were observed during the winter months when
the materials were collected.
Figure 4 also shows the volumetric methane production. It should be kept in mind,
however, that the contribution from solid inoculum was very high, which means that energy
density in all test cells was quite similar. In 42 days, up to 10.4 and 10.5 LN CH4/L (SI_10 and
SI_20) were produced with percolation.
FM_percol (no solid inoculum) had lower biogas production during the first 42 days. This
option would be favourable only for longer digestion times. Inhibition during the start-up phase
becomes less important with longer digestion times; consequently, the methane production of
FM_percol was highest after 74 days (among percolated cells).
It was concluded that a proportion of 10-20% solid inoculum would be suitable for
digestion of horse dung with percolation in six-week cycles. In the present study, despite the
poor quality of the inoculum, 10% was sufficient. As the quality of horse dung may differ with
regard to its contents, age, and storage prior to being digested, a higher proportion of 20%
inoculum may be chosen in order to avoid process failure in full-scale applications.
Methane production in FM_flood was rapid, with no evident inhibition. It was, therefore,
concluded that in the flooded mode no addition of solid inoculum would be necessary.
3.3. Comparison of flooding and percolation
Within 42 days Percol1/2 produced (released) 147.3 LN CH4/kg VSadded,mixture (mean of both
replicates) and FloodLI1/2 160.9 LN CH4/kg VSadded,mixture (Figure 5). Although methane
production from the flooded reactors was higher, the actual CH4-yield from the component fresh
horse dung (GFM,42) was similar (Table 3): 173.8 and 171.5 LN CH4/kg VSadded,FM for Percol1/2
and FloodLI1/2, respectively. This demonstrated that the digestibility of horse dung was
comparable in the flooded and in the percolated mode.
Methane production per volume solid substrate, however, was higher with flooding, as no
solid inoculum was necessary. Flooded reactors (FloodLI1/2) produced 11.4 LN CH4/L and
percolated cells (Percol1/2) 8.4 LN CH4/L in 42 days. In experiment 1 the flooded cell (FM_flood)
produced 11.7 LN CH4/L, while percolated ones generated up to 10.5 LN CH4/L (SI_20) in 42
days. Flooding therefore increased volumetric methane production by a factor of 1.11 in

11
experiment 1, but by a factor of 1.35 in experiment 2. This was due to the lower specific CH4-
yield from the component solid inoculum in experiment 2 compared to experiment 1 (a factor of
0.41). Methane yield GFM,42 from the component fresh material itself was similar in both
experiments (Table 3: 173.8 and 174.7 LN CH4/kg VSadded,FM for Percol1/2 and SI_20,
respectively). This showed that methane production in the percolated process was significantly
influenced by the amount of solid inoculum added and also by the specific methane yield from
the inoculum (very low in experiment 2 due to the long digestion in experiment 1; this would not
be the case in a full-scale application).
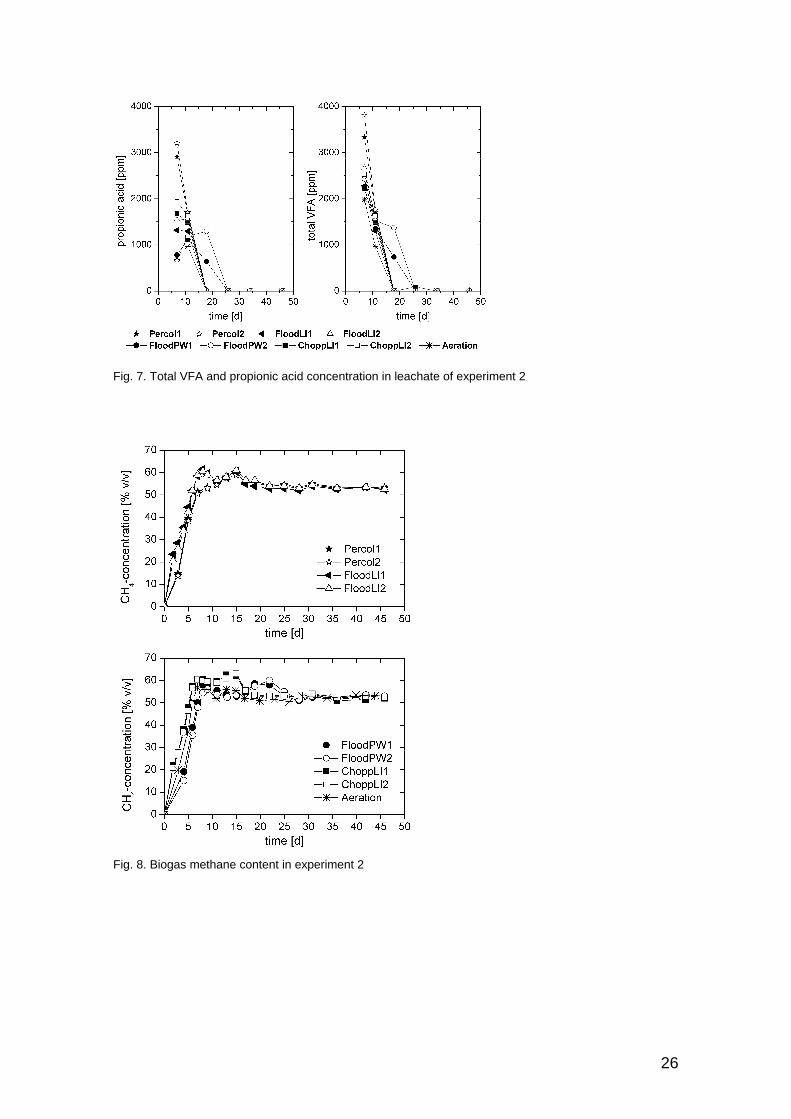
The pH remained in a favourable range both in Percol1/2 and in FloodLI1/2 (Figure 6).
Leachate COD was higher in Percol1/2 than in FloodLI1/2, with a more marked difference
during the first weeks. In Percol1/2, up to 3810 ppm of VFA appeared on day 7, with up to 3210
ppm propionate (Figure 7). In FloodLI1/2, up to 2660 ppm of VFA with a maximum of 1560 ppm
of propionate was measured. This indicated that percolated digesters may be more susceptible
to VFA accumulation. In this experiment, however, no inhibition appeared; in both cell types
VFA were completely degraded before day 18.
3.4. Flooding with potable water
Methane production from FloodPW1/2 was 151.2 LN CH4/kg VSadded,mixture=FM after 42 days
(Figure 5). This was 94% of the amount produced by FloodLI1/2, though production was
considerably lower during the first 10 days. The inhibited performance during the first few weeks
corresponded to a pH decrease to around 6.1 on day 7; afterwards, the pH gradually increased
to 7.0 on day 34 (Figure 6). Although the optimum pH range for methanogens (6.8 to 7.5) was
reached only on day 18, the overall digester stability was good. The microbiological removal of
VFA was complete by day 25. This demonstrated that the microbiological population adapted
well to this environment and that digestion of horse dung was possible without any addition of
inoculum.
3.5. Chopping and pre-aeration
Cumulative methane production of ChoppLI1/2 was 180.1 LN CH4/kg VSadded,mixture after 42 days.
Methanisation was considerably enhanced during the first weeks: compared to FloodLI1/2,
methane production increased by 22%, 18% and 12% after 15, 21 and 42 days respectively.
12
Anaerobic digestion of solid substrates is often rate-limited by the hydrolysis step (Christ, 1999),
and mechanical pre-treatment can therefore improve digester performance (Mata-Alvarez et al.
2000). In the digestion of lignocellulosic material, enzymes must break the lignin barrier in order
to gain access to the holocellulose; therefore, the reaction rate is directly related to the surface
to which hydrolyzing bacteria can attach (Tong et al., 1990). Increased particle surface area
enhances biodegradation but does not affect ultimate methane yield. Consequently, in the
present experiment differences between chopped and unchopped substrate gradually became
smaller with longer digestion times.
Pre-aeration did not enhance process kinetics. The test cell with pre-aerated horse
dung produced 131.4 LN CH4/kg VSadded,mixture in 42 days, which is 18% lower than FloodLI1/2.
3.6. Methane yield from component fresh horse dung (GFM) and exploitation degree (q)
Table 3 summarizes methane yields GFM from the component fresh horse dung in experiments
1 and 2. They were similar for all test cells in which no inhibition occurred and material without
pre-treatment was used. Mean GFM,42 (42 days) was 169.3 ± 3.4 LN CH4/kg VSadded,FM (mean ±
SD, n=5, SI_10/20/30/40/FM_flood) in experiment 1 and 172.6 ± 2.7 LN CH4/kg VSadded,FM (n=4,
Percol/FloodLI/1/2) in experiment 2, and was therefore not significantly different between the
two runs (p=0.16 in unpaired, two-tailed Student’s t-test). For both experimental runs mean
GFM,42 was 170.8 ± 3.4 LN CH4/kg VSadded,FM (n=9, abovementioned cells). The corresponding
exploitation degree q42 from the total methane potential Gpot was 0.62, which means that 62% of
Gpot was converted in 42 days.
In 74 days, 74% of the total methane potential was converted (q74=0.74; GFM,74=205.5 ±
3.1 LN CH4/kg VSadded,FM; n=6, FM_percol/flood/SM_10/20/30/40). The proportion q42/q74 was
0.83, which means that 83% of the yield in 74 days was converted during the first 42 days. This
is more than in experiments with pig dung in solid-phase digestion with percolation conducted
by Zelter (1978), in which 75% of the ten week yield was produced in the first six weeks.
Mean GFM,28 was 144.6 ± 1.8 LN CH4/kg VSadded,FM (n=4, SI_20/30/40/FM_flood). Only
52% of the total methane potential was obtained in 28 days (q28=0.52).
Chopping enhanced biodegradability to q42=0.69 and to mean GFM,42=192.4 LN
CH4/kg VSadded,FM (ChoppLI1/2). Pre-aeration resulted in an exploitation degree of q42=0.51.
13
Comparing this to q42=0.62 of the substrate without pre-treatment, it was concluded that 11% of
Gpot was lost through aeration.
3.7. VS removal
In Table 4, VS removal within 46 days is given for the solid phase (SP) and for the complete
system (solid and liquid phase, SP + LP) because the two values differed (for calculation
procedure see footnotes to Table 4). As considerable amounts of VS were found in the liquid
phase, removal in SP was higher than the degradation in the system (SP + LP). The difference
was more obvious with higher liquid volumes in the system. The liquid contained up to 19% of
the final VS in the flooded system (ChoppLI1) and around 4% of the final VS in the percolated
process.
In FloodLI1/2, the initial VS of the solid phase was reduced by 49%, and 44% of the total
initial VS (SP + LP) was actually degraded. In the pre-aerated test cell, 46% of the total VS left
the system during the experiment. This shows that the overall degradation of VS was
comparable to the flooding without pre-aeration (FloodLI1/2), although energy recovery was
lower. In Percol1/2, 40% of the VS in the solid phase was hydrolyzed and most of it (38% of the
initial VS in the system) was metabolized by the methanogenic population. VS removal was
lower with percolation than with flooding, which reflects poorer degradability of the organic
material due to the addition of solid inoculum.
Mean methane production per kg VS removed was 397.0 ± 17.6 LN CH4/kg VSremoved (n=8,
Percol/FloodLI/PW/ChoppLI1/2), but the high standard deviation hinders further interpretation.
The effect of lost VS when taking leachate samples was not considered in this study. Neither
were various yet small amounts of material lost while emptying the reactors at the end of the
experiment.
3.8. Further results
Biogas methane content of all reactors exceeded 50% after one week, although Percol1/2,
Aeration and FloodPW1/2 demonstrated slightly poorer performance during the first few days
(Figure 8). Methane contents of up to 60% were measured, with chopped substrate of up to
63%. All reactors reached a final gas quality of 52.5-53.5% CH4. Mean methane content over
the whole digestion time (46 days) ranged from 51.1-53.5% (Table 4).

14
Nitrogen accumulation did not reach inhibitory levels, final concentrations in the liquid
phase were <520 mg/L NH4-N and <1130 mg/L TKN (Table 4). Poggi-Varaldo et al. (1997)
determined a critical ammonia concentration of 2800 mg/kg NH4-N (MSW, mesophilic digestion
at high TS content) and quoted from literature higher tolerable concentrations in liquid- or slurry-
mode digestion. With better adapted bacteria, Weiland (1993) observed stable digestion of
agro-industrial residues in the presence of 5000 mg/L NH4-N.
Temperatures in the test cells of experiment 2 (Figure 9) were close to target temperature
(35°C); differences of more than 1°C (median) occurred only in the middle of Percol1/2. In this
study the replicates were positioned directly beside one another (no randomized distribution,
which was not optimal). Percol1/2 were closest to the thermostat and so their position in terms
of heat supply was optimal. The results indicate that problems with temperature maintenance
may occur in percolated digesters. It may be assumed that, compared to flooded digesters,
thermal energy transport is more difficult as pores inside the substrate stack are partly filled with
gas and not with liquid.
4. Conclusions
Horse dung with straw was shown to be digestible as a mono substrate in batch-operated solid-
phase digestion. Both in the percolation and in the flooded process, the specific methane yield
of the fresh substrate was found to be around 170 LN CH4/kg VSadded,FM in six weeks under
optimal conditions and without pre-treatment (aside from the addition of inoculum). Compared to
percolation, flooding itself did not enhance degradability of horse dung within six weeks.
However, the volumetric methane production was higher in the flooded system as no solid
inoculum had to be added. The results show that percolation and flooding can both achieve the
same methane yield per kg VS of fresh horse dung added, but this requires larger reactor
volumes in the percolated system.
In the percolation process a rapid start-up was ensured by the addition of 10-20% (w/w
on TS-basis) pre-fermented horse dung as solid inoculum. Up to 10.5 L CH4/Lsolid substrate were
produced in six weeks with percolation and up to 11.7 L CH4/L with flooding. Assuming a mean
CH4-content of 50%, 21 m³ biogas/m³ could be expected with percolation and 23 m³ biogas/m³
would be probable in the flooded process in six-week cycles with horse dung that did not

15
undergo any pre-treatment. Altered bulk density in full-scale applications may influence the
result, a factor which could not be examined in this work.
The total methane potential of the horse dung was determined as 277 LN CH4/kg
VSadded,FM. Of this, only 52% was converted in four weeks, 62% in six weeks and 74% in 74
days when using substrate without pre-treatment. Chopping the substrate with a compost
chopper accelerated biogasification significantly. Aeration as a pre-digestion treatment failed to
be successful. It resulted in a lower biogas yield with no enhancement of the process kinetics.
Acknowledgements
This study was conducted as part of a research project financed by the Ministry for Nutrition and
Agriculture of Baden-Württemberg, Germany.
References Anand, V., Chanakya, H.N., Rajan, M.G.C., 1991. Solid phase fermentation of leaf biomass to biogas. Resources, Conservation and Recycling 6, 23-33. Barlaz, M.A., Ham, R.K., Schaefer, D.M., 1990. Methane production from municipal refuse: a review of enhancement techniques and microbial dynamics. CRC Critical Reviews in Environmental Control 19, 557-584. Barlaz, M.A., Ham, R.K., Schaefer, D.M., 1992. Microbial, chemical and methane production characteristics of anaerobically decomposed refuse with and without leachate recycling. Waste Manage. Res. 10, 257-267. Bolzonella, D., Innocenti, L., Pavan, P., Traverso, P., Cecchi, F., 2003. Semi-dry thermophilic anaerobic digestion of the organic fraction of municipal solid waste: focusing on the start-up phase. Bioresource Technol. 86, 123-129. Chan, G.Y.S., Chu, L.M., Wong, M.H., 2002. Effects of leachate recirculation on biogas production from landfill co-disposal of municipal solid waste, sewage sludge and marine sediment. Environmental Pollution 118, 393-399. Chanakya, H.N., Borgaonkar, S., Rajan, M.G.C., Wahi, M., 1992. Two-phase anaerobic digestion of water hyacinth or urban garbage. Bioresource Technol. 42, 123-131. Chanakya, H.N., Borgaonkar, S., Meena, G., Jagadish, K.S., 1993. Solid-phase biogas production with garbage or water hyacinth. Bioresource Technol. 46, 227-231. Chanakya, H.N., Venkatsubramaniyam, R., Modak, J., 1997. Fermentation and methanogenic characteristics of leafy biomass feedstocks in a solid phase biogas fermentor. Bioresource Technol. 62, 71-78. Chen, T.-H., Chynoweth, D.P., 1995. Hydraulic conductivity of compacted municipal solid waste. Bioresource Technol. 51, 205-212. Chen, T.-H., Hashimoto, A.G., 1996. Effects of pH and substrate:inoculum ratio on batch methane fermentation. Bioresource Technol. 56, 179-186.

16
Cho, J.K., Park, S.C., Chang, H.N., 1995. Biochemical methane potential and solid state anaerobic digestion of Korean food wastes. Bioresource Technol. 52, 245-253. Christ, O., 1999. Leistungscharakteristik der ein- und zweistufigen thermophilen und mesophilen Vergärung von Bioabfällen, Technische Universität München, Berichte aus Wassergüte- und Abfallwirtschaft, vol. 148. Chugh, S., Chynoweth, D.P., Clarke, W., Pullammanappallil, P., Rudolph, V., 1999. Degradation of unsorted municipal solid waste by a leach-bed process. Bioresource Technol. 69, 103-115. Chynoweth, D.P., Owens, J., O’Keefe, D., Earle, J.F.K., Bosch, G., Legrand, R., 1992. Sequential batch anaerobic composting of the organic fraction of municipal solid waste. Wat. Sci. Technol. 25 (7), 327-339. Clark, R.H., Speece, R.E., 1970. The pH tolerance of anaerobic digestion. In: Jenkins, S.H. (Ed.), Advances in Water Pollution Research. Proc. 5th Int. Conf. of Water Pollution Research in San Francisco, Pergamon Press, pp. II-27, 1-14. De Baere, L., 2000. Anaerobic digestion of solid waste: state of the art. Wat. Sci. Technol. 41 (3), 283-290. DEV, 2004. Deutsche Einheitsverfahren zur Wasser-, Abwasser- und Schlamm-Untersuchung, loose-leaf edition, Wasserchemische Gesellschaft (Ed.), Wiley-VCH. Dirar, H.A., El Amin, H.B., 1988. Methane fermentation of water hyacinth: effect of solids concentration and inoculum source. Mircen Journal 4, 299-312. Ghosh, S., Klass, D.L., 1978. Two-phase anaerobic digestion. Process Biochemistry 13, 15-24. Griffin, M.E., McMahon, K.D., Mackie, R.I., Raskin, L., 1998. Methanogenic population dynamics during start-up of anaerobic digesters treating municipal solid waste and biosolids. Biotechnol. Bioengng. 57, 342-355. Helffrich, D., Oechsner, H., 2003a. Hohenheimer Biogasertragstest. Agrartechnische Forschung 9, 27-30. Helffrich, D., Oechsner, H., 2003b. The Hohenheim biogas yield test. Landtechnik 58 (English version), 148-149. Jewell, W.J., Dell’Orto, S., Fanfoni, K.J., Fast, S.J., Gotting, E.J., Jackson, D.A., Kabrick, R.M., 1982. Agricultural and high strength wastes. In: Hughes, D.E., Stafford, D.A., Wheatley, B.I., Baader, W., Lettinga, G., Nyns, E.J., Verstraete, W., Wentworth, R.L. (Eds.), Anaerobic Digestion 1981. Proc. 2nd Int. Symp. on Anaerobic Digestion in Travemünde, Elsevier Biomedical Press, Amsterdam, pp. 151-168. Jewell, W.J., Cummings, R.J., Richards, B.K., 1993. Methane fermentation of energy crops: Maximum conversion kinetics and in situ biogas purification. Biomass Bioenergy 5, 261-278. Kalia, A.K., Singh, S.P., 1998. Horse dung as a partial substitute for cattle dung for operating family-size biogas plants in a hilly region. Bioresource Technol. 64, 63-66. Kalia, A.K., Singh, S.P., 2001. Effect of mixing digested slurry on the rate of biogas production from dairy manure in batch fermenter. Energy Sources 23, 711-715. Komilis, D.P., Ham, R.K., Stegmann, R., 1999a. The effect of landfill design and operation practices on waste degradation behavior: a review. Waste Manage. Res. 17, 20-26. Komilis, D.P., Ham, R.K., Stegmann, R., 1999b. The effect of municipal solid waste pretreatment on landfill behavior: a literature review. Waste Manage. Res. 17, 10-19. Kruse, K., 1994. Langfristiges Emissionsgeschehen von Siedlungsabfalldeponien, Technische Universität Braunschweig, Institut für Siedlungswasserwirtschaft, vol. 54.
17
Kusch, S., Oechsner, H., 2004. Vergärung landwirtschaftlicher Substrate in Feststofffermentern, in: FNR (Ed.), Trockenfermentation – Evaluierung des Forschungs- und Entwicklungsbedarfs. Gülzower Fachgespräche 23, pp. 105-113. Legrand, R., Jewell, W.J., 1987. Continuous anaerobic digestion of high solids biomass: modeling and experiments, in: Klass, D.L. (Ed.), Energy from biomass and wastes X. Institute of Gas Technology, Chicago, Elsevier Applied Science Publishers, London, UK, pp. 1077-1094. Linke, B., 2000. Trockenvergärung – Ergebnisse über ein einfaches Satz-Verfahren im kleintechnischen Maßstab, in: Biogas – Mobilisierung der Energiereserve aus der Landwirtschaft. Proc. symp. in Schwäbisch Hall, pp. 71-79. Linke, B., Schelle, H., 2001. Biogaserzeugung durch Nass- und Trockenfermentation, in: Mit Biogas vom Landwirt zum Energiewirt. Proc. 13th Energie-Seminar Prignitz. Liu, K., Sun, G., Wu, X., Wu, Y., 1987. Research and application of technology for dry-wet biogas fermentation. Biological Wastes 20, 303-308. Llabrés-Luengo, P., Mata-Alvarez, J., 1988. The hydrolytic step in a dry digestion system. Biological Wastes 23, 25-37. Mandal, T., Mandal, N.K., 1998. Biomethanation of some waste materials with pure metallic magnesium catalyst: improved biogas yields. Energy Conversion and Management 39, 1177-1179. Martin, D.J., 1999. Mass transfer limitations in solid-state digestion. Biotechnol. Letters 21, 809-814. Martin, D.J., Potts, L.G.A., Heslop, V.A., 2003. Reaction mechanisms in solid-state anaerobic digestion: I. The reaction front hypothesis. Process Safety and Environmental Protection, Transactions IChemE 81 (B3), 171-179. Mata-Alvarez, J., Martinez-Viturtia, A., 1986. Laboratory simulation of municipal solid waste fermentation with leachate recycle. J. Chem. Technol. Biotechnol. 36, 547-556. Mata-Alvarez, J., Cecchi, F., Pavan, P., Bassetti, A., 1993. Semi-dry thermophilic anaerobic digestion of fresh and pre-composted organic fraction of municipal solid waste (MSW): digester performance. Wat. Sci. Technol. 27 (2), 87-96. Mata-Alvarez, J., Macé, S., Llabrés, P., 2000. Anaerobic digestion of organic solid wastes. An overview of research achievements and perspectives. Bioresource Technol. 74, 3-16. Mehta, R., Barlaz, M.A., Yazdani, R., Augenstein, D., Bryars, M., Sinderson, L., 2002. Refuse decomposition in the presence and absence of leachate recirculation. J. Envir. Engrg. 128, 228-236. Møller, H., Sommer, S., Ahring, B., 2004. Methane productivity of manure, straw and solid fractions of manure. Biomass Bioenergy 26, 485-495. O’Keefe, D.M., Chynoweth, D.P., Barkdoll, A.W., Nordstedt, R.A., Owens, J.M., Sifontes, J., 1993. Sequential batch anaerobic composting of municipal solid waste (MSW) and yard waste. Wat. Sci. Technol. 27 (2), 77-86. O’Keefe, D.M., Chynoweth, D.P., 2000. Influence of phase separation, leachate recycle and aeration on treatment of municipal solid waste in simulated landfill cells. Bioresource Technol. 72, 55-66. Owens, J.M., Chynoweth, D.P., 1992. Biochemical methane potential of municipal solid waste (MSW) components, in: Cecchi, F., Mata-Alvarez, J., Pohland, F.G. (Eds.), Anaerobic digestion of solid waste. Proc. Int. Symp. on Anaerobic Digestion of Solid Waste in Venice, Pergamon Press, pp. 1-14.
18
Pavan, P., Battistoni, P., Cecchi, F., Mata-Alvarez, J., 2000. Two-phase anaerobic digestion of source sorted OFMSW (organic fraction of municipal solid waste): performance and kinetic study. Wat. Sci. Technol. 41 (3), 111-118. Poggi-Varaldo, H.M., Rodriguez-Vazquez, R., Fernandez-Villagomez, G., Esparza-Garcia, F., 1997. Inhibition of mesophilic solid-substrate anaerobic digestion by ammonia nitrogen. Appl. Microbiol. Biotechnol. 47, 284-291. Raynal, J., Delgenès, J.P., Moletta, R., 1998. Two-phase anaerobic digestion of solid wastes by a multiple liquefaction reactors process. Bioresource Technol. 65, 97-103. Schäfer, W., Evers, L., Lehto, M., Sorvala, S., Teye, F., Granstedt, A., 2005. Nutrient balance of a two-phase solid manure biogas plant. In: Stenberg, M., Nilsson, H., Brynjolfsson, R., Kapuinen, P., Morken, J., Birkmose, T.S. (Eds.), Manure – an agronomic and environmental challenge, Proc. NJF seminar no. 372 in Skurup/Sweden, NJF Report 1 (2), pp. 45-48. Sun, G., Wu, Y., Sha, S., Liu, K., 1987. Dry digestion of crop wastes: Studies on dry anaerobic digestion with agricultural wastes. Biological Wastes 20, 291-302. Suna Erses, A., Onay, T.T., 2003. Accelerated landfill waste decomposition by external leachate recirculation from an old landfill cell. Wat. Sci. Technol. 47 (12), 215-222. Ten Brummeler, E., Koster, I.W., 1989. The effect of several pH control chemicals on the dry batch digestion of the organic fraction of municipal solid waste. Resources, Conservation and Recycling 3, 19-32. Ten Brummeler, E., Koster, I.W., 1990. Enhancement of dry anaerobic batch digestion of the organic fraction of municipal solid waste by an aerobic pretreatment step. Biological Wastes 31, 199-210. Tong, X., Smith, L.H., McCarty, P.L., 1990. Methane fermentation of selected lignocellulosic materials. Biomass 21, 239-255. Vavilin, V.A., Shchelkanov, M.Y., Rytov, S.V., 2002. Effect of mass transfer on concentration wave propagation during anaerobic digestion of solid waste. Water Research 36, 2405-2409. Vavilin, V.A., Rytov, S.V., Lokshina, L.Y., Pavlostathis, S.G., Barlaz, M.A., 2003. Distributed model of solid waste anaerobic digestion - Effects of leachate recirculation and pH adjustment. Biotechnol. Bioengng. 81, 66-73. Wechs, F., 1985. Ein Beitrag zur zweistufigen anaeroben Klärschlammstabilisierung, Technische Universität München, Berichte aus Wassergüte und Gesundheitsingenieurwesen, vol. 53. Weiland, P., 1993. One- and two-step anaerobic digestion of solid agroindustrial residues. Wat. Sci. Technol. 27 (2), 145-151. Weiland, P., 2004. Stand der Technik bei der Trockenfermentation – Zukunftsperspektiven. In: FNR (Ed.), Trockenfermentation – Evaluierung des Forschungs- und Entwicklungsbedarfs. Gülzower Fachgespräche 23, pp. 23-35. Weizhong, J., Kitamura, Y., Jia, J., Takeyama, K., 1999. Development of the dry methane fermentation system for livestock manure – experimental study on rotational drum fermentation. Proc. 99th Int. Conf. on Agricultural Engineering in Beijing, pp. III-51 to III-55. Witty, W., Märkl, H., 1985. Reaktionskinetische Aspekte der Methangärung am Beispiel der Vergärung von Penicillin-Mycel. Chem.-Ing.-Tech. 57, 802-803. Zelter, S.Z., 1978. Fermentation methanique en discontinu des dechets agricoles. Final report of a research project, Institut National de la Recherche Agronomique, Paris, France.
19
Zoetemeyer, R.J., Arnoldy, P., Cohen, A., Boelhouwer, C., 1982. Influence of temperature on the anaerobic acidification of glucose in a mixed culture forming part of a two-stage digestion process. Water Research 16, 313-321.
20
Table 1 Experimental set-up (FM: fresh material, SI: solid inoculum, LI: liquid inoculum, PW: potable water)
description FM SI LI PW
kg kg L L
experiment 1
FM_percol FM, percolated 7.32 - 6.0 4.5
SI_10 FM + 9.9% SI, percolated *) 7.18 1.79 6.0 3.5
SI_20 FM + 19.8% SI, percolated *) 6.30 3.50 6.0 3.5
SI_30 FM + 30.0% SI, percolated *) 5.39 5.15 6.0 3.0
SI_40 FM + 39.9% SI, percolated *) 4.55 6.76 6.0 3.0
SI_44 FM + 44.3% SI, percolated *) 5.25 9.32 6.0 2.5
SI_50 FM + 50.0% SI, percolated *) 3.72 8.29 6.0 1.0
SI_100 SI, percolated - 16.24 6.0 -
FM_flood FM, flooded with LI 8.71 - 37.0 -
experiment 2
Percol1 FM + 20.7% SI, percolated *) 6.30 3.70 5.0 3.0
Percol2 FM + 20.7% SI, percolated *) 6.30 3.65 5.0 3.0
FloodLI1 FM, flooded with LI 11.73 - 36.0 -
FloodLI2 FM, flooded with LI 10.78 - 36.0 -
FloodPW1 FM, flooded with PW 9.41 - - 37.0
FloodPW2 FM, flooded with PW 9.52 - - 37.0
ChoppLI1 chopped FM, flooded with LI 11.20 - 37.0 -
ChoppLI2 chopped FM, flooded with LI 11.06 - 37.0 -
Aeration FM + 2 L PW, aerated for 48 h, then flooded with LI
10.29 - 26.0 2.0
*) mixtures FM + SI are in % w/w on a TS-basis: (kg TSSI)/(kg TSFM + kg TSSI)*100% Table 2 Material characterization
TS VS
% wet w % TS % wet w
experiment 1
fresh substrate 38.0 89.2 33.9
solid inoculum 17.0 81.4 13.8
liquid inoculum 2.2 0.8
experiment 2
fresh substrate 32.2 85.8 27.6
solid inoculum 14.4 75.2 10.8
liquid inoculum 1.2 0.6

21
Table 3 Methane yield from component fresh material (GFM) after different digestion times
GFM (LN CH4/kg VSadded,FM) *)
28 days 42 days 74 days
experiment 1
FM_percol 106.3 149.5 207.0
SI_10 135.2 167.3 200.0
SI_20 145.9 174.7 208.0
SI_30 142.0 165.6 206.3
SI_40 145.9 169.7 207.7
FM_flood 144.4 169.3 204.0
experiment 2
Percol1; Percol2 176.6; 170.9
FloodLI1; FloodLI2 171.1; 171.9
FloodPW1; FloodPW2 153.7; 158.8
ChoppLI1; ChoppLI2 192.2; 192.7
Aeration 140.2 *) yield from component fresh material, determined according to section 2.4., methane remaining inside digesters was taken into account

22
Table 4 Final VS and nitrogen contents, VS removal from solid phase (SP) and from whole system (solid + liquid phase, SP + LP), methane yield per kg VS removed in experiment 2
Percol1;2 FloodLI1;2 FloodPW1;2 ChoppLI1;2 Aeration
final VS in LP (% wet w) 1.01; 1.11 0.86; 0.82 0.42; 0.44 1.16; 0.98 0.83
final VS in SP (% wet w) 11.58; 12.19 10.84; 11.03 11.07; 11.44 8.85; 10.47 10.38
ratio VS in LP to total VS (LP + SP) (%) a)
4.05; 4.25 14.56; 14.35 8.82; 8.77 18.97; 16.80 15.13
final NH4-N in LP (mg/L) 492; 512 320; 355 164; 131 415; 353 243
final TKN in LP (mg/L) 1051; 1049 798; 801 462; 463 1122; 902 790
VS removal from SP (%) b) 40.5; 39.8 50.7; 47.9 48.1; 46.3 54.7; 51.3 51.9
VS removal from SP + LP (%) c) 38.8; 37.9 45.6; 43.0 43.1; 41.1 47.5; 45.2 46.0
methane yield per kg VS removed (LN CH4/kg VSremoved,SP+LP)
412.3; 411.1 372.4; 396.2 369.8; 401.8 396.7; 416.0 (301.6)
mean biogas methane content (% v/v CH4)
51.2; 51.1 53.5; 53.5 52.4; 52.8 53.0; 52.6 52.36
a) =(kg VSLP)/(kg VSLP + kg VSSP)*100%; indicates which proportion of the final total VS was found in the liquid phase; b) =(kg VSremoved,SP)/(kg VSadded,SP)*100%; with (kg VSremoved,SP)=(kg VSadded,SP - kg VSsolid residue) and (kg VSadded,SP)=(kg VSadded,FM + kg VSadded,SI); FM: fresh material, SI: solid inoculum; c) =(kg VSremoved,SP+LP)/(kg VSadded,SP+LP)*100%; with (kg VSremoved,SP+LP)=(kg VSadded,SP+LP - kg VSsolid residue - kg VSliquid residue) and (kg VSadded,SP+LP)=(kg VSadded,FM + kg VSadded,SI + kg VSadded,SI); LI: liquid inoculum;
Note: all data refer to experimental time of 46 days; the values for “final VS in SP”, “ratio VS in LP to total VS” and “VS removal from SP” are influenced by phase-separation between solid and liquid phase when emptying the reactors (not standardized in this study), therefore deviation between replicates might be high (due to different amounts of liquid retained in the solid phase); in general, phase-separation was carried out by repeatedly pumping out all liquid from the liquid-phase reservoir before removing the solid residue, but in two flooded reactors exterior filtering (PVC-cloth, mesh size 1.9 x 1.4 mm) was performed because liquid collected very slowly in the liquid-phase reservoir

23
Fig. 1. Schematic diagram of laboratory-scale solid-phase digester
Fig. 2. Methodology for determination of total methane potential (Gpot) by extrapolation from experimental data
24
Fig. 3. Determination of total methane potential Gpot of horse dung by extrapolation from experimental data obtained with ground material in optimized batch-testing (Hohenheim biogas yield test HBT; contribution of inoculum is corrected)
Fig. 4. Methane production in experiment 1
25
Fig. 5. Methane production in experiment 2
Fig. 6. pH and COD in leachate of experiment 2
26
Fig. 7. Total VFA and propionic acid concentration in leachate of experiment 2
Fig. 8. Biogas methane content in experiment 2

27
Fig. 9. Substrate temperatures during experiment 2