


1 Bacterial Competition Reveals Differential Regulation of the pks ...
54
1 Bacterial Competition Reveals Differential Regulation of the pks Genes by 1 Bacillus subtilis 2 Carol Vargas-Bautista, Kathryn Rahlwes and Paul Straight # 3 Department of Biochemistry and Biophysics, Texas A&M University, 4 College Station, TX 77845 5 6 Running Title: Regulation of the pks Gene Cluster 7 Key Words: Secondary metabolites, regulation, bacillaene, Bacillus subtilis, 8 competition 9 10 #Corresponding Author: 11 Paul Straight 12 Department of Biochemistry and Biophysics 13 College Station, TX 77845 14 Phone Number: (979) 845 4231 15 Email Address: [email protected] 16 17 JB Accepts, published online ahead of print on 1 November 2013 J. Bacteriol. doi:10.1128/JB.01022-13 Copyright © 2013, American Society for Microbiology. All Rights Reserved. on January 30, 2018 by guest http://jb.asm.org/ Downloaded from
Transcript of 1 Bacterial Competition Reveals Differential Regulation of the pks ...

1
Bacterial Competition Reveals Differential Regulation of the pks Genes by 1
Bacillus subtilis 2
Carol Vargas-Bautista, Kathryn Rahlwes and Paul Straight# 3
Department of Biochemistry and Biophysics, Texas A&M University, 4
College Station, TX 77845 5
6
Running Title: Regulation of the pks Gene Cluster 7
Key Words: Secondary metabolites, regulation, bacillaene, Bacillus subtilis, 8
competition 9
10
#Corresponding Author: 11
Paul Straight 12
Department of Biochemistry and Biophysics 13
College Station, TX 77845 14
Phone Number: (979) 845 4231 15
Email Address: [email protected] 16
17
JB Accepts, published online ahead of print on 1 November 2013J. Bacteriol. doi:10.1128/JB.01022-13Copyright © 2013, American Society for Microbiology. All Rights Reserved.
on January 30, 2018 by guesthttp://jb.asm
.org/D
ownloaded from

2
18
Abstract 19
20
Bacillus subtilis is adaptable to many environments in part due to its ability to produce a 21
broad range of bioactive compounds. One such compound, bacillaene, is a linear 22
polyketide/non-ribosomal peptide produced by B. subtilis. The pks genes encode the 23
enzymatic megacomplex that synthesizes bacillaene. The majority of pks genes appear 24
to be organized as a giant operon (> 74kb from pksC-pksR). In previous work, a 25
deletion of the pks operon in B. subtilis was found to induce prodiginine production by 26
Streptomyces coelicolor. Here, colonies of wild type B. subtilis formed a spreading 27
population that induced prodiginine production from Streptomyces lividans, suggesting 28
differential regulation of pks genes and thus bacillaene. While the parent colony showed 29
widespread induction of pks expression among cells in the population, we found the 30
spreading cells uniformly and transiently repressed the expression of the pks genes. To 31
identify regulators that control pks genes, we first determined the pattern of pks gene 32
expression in liquid culture. Next we identified mutations in regulatory genes that 33
disrupted the wildtype pattern of pks gene expression. We found expression of the pks 34
genes requires the master regulator of development, Spo0A, through its repression of 35
AbrB, and the stationary-phase regulator, CodY. Deletions of degU, comA, and scoC 36
had moderate effects, disrupting the timing and level of pks gene expression. The 37
observed patterns of expression suggest that complex regulation of bacillaene and 38
other antibiotics optimizes competitive fitness for B. subtilis. 39
on January 30, 2018 by guesthttp://jb.asm
.org/D
ownloaded from

3
40
Introduction 41
Bacillus subtilis is a globally dispersed bacterial species that is competitive in diverse 42
environments and produces numerous bioactive compounds. B. subtilis dedicates 4-5% 43
of its genome to produce secondary metabolites (1). In particular, three massive gene 44
clusters encode enzyme complexes for dedicated synthesis of their cognate products. 45
Two of the gene clusters encode the non-ribosomal peptide synthetases (NRPS) for 46
surfactin (srfAA-srfAD; 27 kb) and plipastatin (ppsA-ppsE; 37 kb), respectively. 47
Surfactin is a multifunctional lipopeptide that provides surfactant and signaling activities 48
required for motility and biofilm development (2–4). Plipastatin is a lipopeptide with 49
antifungal properties (5, 6). A third gene cluster (pksA-pksS; 78 kb) encodes machinery 50
for the production of bacillaene, a hybrid non-ribosomal peptide/polyketide (NRP/PK) 51
produced by B. subtilis (7, 8). 52
Bacillaene is a multifunctional molecule that was first reported as a broad-spectrum anti-53
bacterial compound (9). The diverse functions of bacillaene are apparent from 54
competition studies pairing B. subtilis with species of Streptomyces (7, 10, 11). 55
Consistent with its antibiotic function, bacillaene inhibits Streptomyces avermitilis growth 56
(7). In the case of Streptomyces coelicolor, which is resistant to growth inhibition, 57
bacillaene suppresses antibiotic synthesis in competitive interactions (7, 10). Recently 58
our lab has observed that bacillaene is critical for the survival of B. subtilis when 59
challenged by Streptomyces sp. Mg1, a soil isolate with predatory-like activity (11). 60
Streptomyces sp. Mg1 causes cellular lysis and disrupts the colony extracellular matrix 61
on January 30, 2018 by guesthttp://jb.asm
.org/D
ownloaded from

4
of B. subtilis. Strains of B. subtilis are hypersensitive to the lytic activity when bacillaene 62
synthesis is disrupted by deletion of the pks operon. 63
The importance of bacillaene for competitive fitness of B. subtilis raises the question of 64
how the organism regulates pks gene expression and bacillaene biosynthesis. The pks 65
gene cluster has been annotated as sixteen genes, five of them encoding the 66
multimodular synthetase (pksJ, L, M, N, and R), and another ten genes encoding 67
individual enzymes that function in trans to the assembly line (pksC-pksI and pksS) (Fig. 68
1A). The first fifteen genes, pksA-pksR, are oriented in the forward direction (positive 69
strand) and the last gene, pksS, in the reverse direction (negative strand). In many 70
cases, modular type I PKS, NRPS and hybrid PKS-NRPS gene clusters include 71
associated regulators that coordinate the expression of the synthesis genes (12, 13). 72
The pksA gene sits adjacent to the gene cluster and encodes a putative TetR-family 73
regulatory protein (http://genolist.pasteur.fr/SubtiList/). PksA is predicted to function as a 74
pathway-specific regulator of the pks genes, but the regulatory function has not been 75
experimentally confirmed (14–16). In addition to pathway-specific regulation, secondary 76
metabolic pathways are commonly controlled by global regulatory functions that 77
respond to changes in nutrient conditions or environmental cues to activate different 78
physiological responses (17, 18). Differentially regulated functions in B. subtilis include 79
genetic competence, motility, biofilm formation, and sporulation, in addition to 80
production of antibiotics and degradative enzymes (19). Regulation of developmental 81
processes has been studied in detail for B. subtilis, and in many instances the 82
regulatory functions are known to influence secondary metabolism (1, 19, 20). Studies 83
on January 30, 2018 by guesthttp://jb.asm
.org/D
ownloaded from

5
of surfactin, bacilysin, and other metabolites highlight the integration of secondary 84
metabolism with different physiological states (2, 4, 21, 22) 85
In the present study, we identified a competitive interaction with S. lividans that 86
suggested differential regulation of bacillaene production between morphologically 87
different subpopulations of B. subtilis. We investigated the regulation of pks gene 88
transcription to determine whether bacillaene production is segregated in different B. 89
subtilis subpopulations. Initially using liquid cultures, we show that the 5’UTR of pksC is 90
active in promoting expression of the apparent pks operon, which extends nearly 75kb 91
from the pksC to pksR genes (http://subtiwiki.uni-goettingen.de/apps/expression/) (23). 92
Also, we show that the gene annotated as pksA does not encode a pathway regulator 93
for bacillaene. Using transcriptional reporters fused to the pksC promoter element, we 94
identified multiple global regulators that influence expression of the pks genes. We 95
show that Spo0A is required to activate pks gene expression through repression of the 96
transition state regulator, AbrB (1, 24). Expression of pks genes is also dependent on 97
CodY, which regulates metabolism in response to nutrient status and was recently 98
shown to bind to multiple sites in the pks operon (25, 26). DegU, ComA and ScoC are 99
also required for full induction of pks gene expression. Using transcriptional reporters, 100
we show that the expression of pks genes is homogeneously and transiently repressed 101
in cells that spread toward S. lividans in a competitive interaction. Our data indicate that 102
B. subtilis uses a multiple regulatory functions to exert dynamic control of bacillaene 103
production, which may benefit the overall competitive fitness of the colony. 104
105
on January 30, 2018 by guesthttp://jb.asm
.org/D
ownloaded from

6
Material and Methods 106
107
Bacterial strains, primers, media and growth conditions. Table 1 contains a list of 108
primers used in this study. The undomesticated strain Bacillus subtilis NCIB 3610 was 109
used for all the experiments in this work. Unless otherwise stated, all B. subtilis strains, 110
were cultured at 37°C in CH medium (1% casein hydrolysate, 0.47% L-glutamate, 111
0.16% L-asparagine, 0.12% L-alanine, 1 mM KH2PO4, 25 mM NH4Cl, 0.22 mg/ml 112
Na2SO4, 0.2 mg/ml NH4NO3, 1 µg/ml FeCl3.6H2O, 25 mg/liter CaCl2.2H2O, 50 mg/ liter 113
MgSO4, 15 mg/liter MnSO4.H2O, 20 µg/ml L-tryptophan, pH 7.0), which is commonly 114
used for consistent timing of developmental transitions and optimal for live cell 115
microscopy (27). To generate a uniform population of cells in early exponential growth 116
phase, overnight cultures of B. subtilis were diluted to an OD600 = 0.085, cultured to 117
approximately OD600 = 0.2, and re-diluted to OD600 = 0.085. This cycle was repeated 118
three times before initiation of the experiments. Genetic manipulations of B. subtilis 119
were initially made using the PY79 strain, and then transduced via bacteriophage SPP1 120
into B. subtilis NCIB 3610 as previously described (28). All manipulations were 121
confirmed by genomic extraction, amplification of genetic targets and sequencing. 122
Escherichia coli XL1 blue was used for plasmid manipulations and storage. Antibiotics 123
used in this study were chloramphenicol (5 µg/ml), spectinomycin (100 µg/ml), 124
tetracycline (10 µg/mL), kanamycin (10 µg/mL) and mls (1 µg/mL of erythromycin, 25 125
µg/mL of lincomycin). 126
127
on January 30, 2018 by guesthttp://jb.asm
.org/D
ownloaded from

7
Co-culture assays. G7 plates (1.5% Bacto agar, 1% Bacto Malt Extract, 0.4% yeast 128
extract and 0.4% D-glucose, buffered with 100 mM morpholinepropanesulfonic acid 129
[MOPS] and 5 mM potassium phosphate) were used to co-culture B. subtilis and 130
Streptomyces lividans. X-gal (300 µg/ml) was added to the plates when needed. Briefly, 131
2 µl of S. lividans spores (107 spores/ml) were spotted on solid media and incubated at 132
30°C for 12 hours. Following initial incubation of the S. lividans, 1.5 µl aliquots of a B. 133
subtilis overnight culture were spotted in a cross-wise pattern to the S. lividans, and 134
plates were returned to incubation at 30°C. Taking as time zero when B. subtilis was 135
spotted, the co-culture was observed over time and images were captured at the 136
indicated time points. 137
138
Extraction and quantification of bacillaene. Time course experiments were done in 139
triplicates with cells growing at 30°C, in 500 ml of CH medium, under constant agitation 140
(250 rpm) and complete darkness. To extract bacillaene, 15 ml of the culture 141
supernatants were mixed 1:1 with dichloromethane. Bacillaene was recovered by 142
evaporation of the organic phase followed by resuspension in methanol. The methanol 143
was then evaporated and the samples resuspended in a buffer of 65% 20 mM sodium 144
phosphate/ 35% Acetonitrile and H2O. HPLC analysis was performed with a C18 145
reverse-phase column (Phenomenex). Samples were eluted with a gradient of 35% - 146
40% acetonitrile and 65% - 60% of 20mM sodium phosphate. Bacillaene was detected 147
by UV absorption using a wavelength of 361 nm as previously reported (9). The amount 148
of bacillaene in each sample was determined by integrating the area under the relevant 149
peaks on the elution chromatograph. We confirmed the specificity of bacillaene peaks in 150
on January 30, 2018 by guesthttp://jb.asm
.org/D
ownloaded from

8
the HPLC chromatographs by comparison to a sample from a B. subtilis ∆pks strain. 151
LC-MS analysis determined that the relevant peaks were all different isoforms of 152
bacillaene (not shown). Quantitative data was normalized to the sample cell density 153
(OD600) in order to compare synthesis of the molecule over time between strains. 154
155
Quantitative RT-PCR (qRT-PCR). Cell samples were stabilized using RNAprotect 156
Bacteria Reagent (Qiagen) and RNA isolation was performed using RNeasy Mini Kit, 157
according to the manufacturer’s instructions. Subsequently, RNA samples were treated 158
with Turbo DNA-free kit (Applied Biosystems) to remove DNA traces and total RNA was 159
quantified. Thermo Scientific DyNAmo Flash SYBR green qPCR kit was used with 160
target specific primers listed in Table 1 and 200 µg of total RNA as template to 161
synthesize cDNA. After the RT step, quantitative PCR was done in a CFX96 Touch 162
Real Time PCR thermocycler (BioRad). The protocol was as follows: denaturation at 163
95.0°C for 15 min; 39 cycles of denaturation at 94.0°C for 10 s, annealing at 58.0°C for 164
25 s, extension at 72.0°C for 30 s; and final melt curve from 60.0°C to 95.0° for 6 min. 165
We determined that gyrB transcript abundance per cell did not significantly change from 166
OD600 = 0.2 to 6.8 (not shown). Consequently, we used gyrB as the reference gene. The 167
samples were run in triplicate for each target gene and negative controls where included 168
for each sample as reaction mixtures with total RNA after DNase treatment (No RT 169
performed). Primer efficiency and Cq values were calculated using the software LinReg 170
(29). Gene study analysis for comparison between independent experiments was 171
performed based on the primer efficiency calculated by the software LinReg and the 172
analysis of the CFX Manager software (Bio-Rad). 173
on January 30, 2018 by guesthttp://jb.asm
.org/D
ownloaded from

9
174
Western Blots. Cell growth conditions are the same as described for extraction and 175
quantification of bacillaene (see above). Fifteen milliliters of cell pellets from each time 176
point were lysed by incubation in 500 µl of lysis buffer (50 mM Tris 7.5, 200 mM NaCl, 177
0.5 mM EDTA, 5 mM MgCl2, 1 mg/ml lysozyme, 1 mM 4-(2-178
Aminoethyl)benzenesulfonylfluoride hydrochloride (AEBSF), 1 mM DTT) at 37ºC for 15 179
min. After treatment, protein concentration was measured by Bradford Assay (Bio-Rad 180
Protein Assay) and lysates were diluted to 1 mg/ml of total protein. Addition of 2X 181
loading buffer in a 1:1 ratio and heating at 100ºC for 5 min was done before loading 30 182
µl of the samples in 8% acrylamide gel for SDS-PAGE. Proteins were transferred onto 183
an immobilon PVDF membrane (Sigma). Rabbit anti-GFP (1:1000) and goat anti-rabbit 184
HRP (1:5000) (Invitrogen) served as primary and secondary antibody, respectively. The 185
blotting was visualized using Pierce ECL western blotting substrate (ThermoScientific) 186
according to manufacturer instructions. 187
188
Fluorescence Microscopy. Samples from shaken liquid cultures in CH medium were 189
taken for fluorescence imaging, centrifuged at 8,000 rpm and washed once with PBS. 190
Cells were resuspended in 20 µM TMA-DPH (Molecular Probes) and fluorescence 191
images were captured using a Nikon Ti-E inverted microscope equipped with a CFI Plan 192
Apo Lambda DM 100X objective, TI-DH Diascopic Illuminator, and a CoolSNAP HQ2 193
Monochrome Camera. Exposure time was 2,000 ms for YFP, 200 ms for CFP and 194
1,000 ms for TMA. The NIS-elements AR software was used to capture and process the 195
images identically for comparative analysis. Samples from solid media were scraped, 196
on January 30, 2018 by guesthttp://jb.asm
.org/D
ownloaded from

10
dissolved in PBS, passed repeated times through a 25g 1½ needle to disrupt 197
aggregated cells and centrifuged at 8,000 rpm. All the subsequent steps were the same 198
as described for samples from liquid medium. 199
200
Construction of pksA mutants. Deletion of pksA was performed by long-flanking 201
homology PCR, using the primers pksA KO_P1, pksA KO_P2, pksA KO_P3 and pksA 202
KO_P4 (Table 2) to amplify the region flanking pksA and the intervening kanamycin 203
cassette (30). To overexpress pksA, primer pair pksA-90_FHIII/pksA-90_RSalI were 204
use to amplify pksA. The amplified regions were cut with the restriction enzymes HindIII 205
and SalI (NEB) and ligated with T4 ligase (NEB) into pPST001 (amyE::Phyperspac lacI 206
cat amp). The plasmid was recovered by transformation into E. coli XL1Blue, 207
transformed into B. subtilis PY79 and transduced into PDS0184 (Table 1), as previously 208
described (28). For pksA complementation, pksA compl-F/pksA compl-R primers (Table 209
2) were used to clone the pksA gene with 203 bases of upstream sequence into 210
pDR183 (lacA:: mls amp) by enzymatic assembly, as previously described (31). 211
Transformation into E. coli XL1Blue, B. subtilis PY79 and transduction into the strain 212
PDS0184 (Table 1) were performed as above described. 213
214
Transcriptional fusions of pks promoters. Primer pairs pB-F(EcoRI)/pB-R(HindIII), 215
pC-F(EcoRI)/pC-R(HindIII) and pS-F(EcoRI)/pS-R(HindIII), (Table 2), were used to 216
amplify 300-500 bps upstream of pksA, pksB, pksC and pksS, respectively. The 217
amplified regions were cut with the restriction enzymes EcoRI and HindIII (NEB) and 218
ligated with T4 ligase (NEB) into pCW001 (amyE::yfp cat amp) and pDG1661 219
on January 30, 2018 by guesthttp://jb.asm
.org/D
ownloaded from

11
(amyE::lacZ cat amp). The transformations were performed using E. coli XL1Blue for 220
recovery of the plasmids. Subsequent transformation into PY79 and transduction into 221
NCIB 3610 B. subtilis strains were performed as previously described (28). Recovered 222
clones were grown in CH medium for subsequent analysis by fluorescence microscopy 223
and β-galactosidase assays. 224
225
β-galactosidase Assays. Samples were taken over time and cell density measured at 226
OD600. β-galactosidase assays were done as previously described by Miller (1972) 227
(32). Briefly, one ml samples were lysed with Z buffer (60 mM Na2HPO4·7H2O, 40 mM 228
NaH2PO4·H2O, 10 mM KCl, 1mM MgSO4·7H2O) that contained 0.27% BME and 229
lysozyme (200 µg/ml) at 30°C for 20 min. Then, serial dilutions of the samples were 230
done to find an optimal range for colorimetric detection with ONPG (400 µg) at OD420 231
and OD550. The values are reported in Miller Units (MU). 232
233
Results 234
235
Co-culture of B. subtilis with Streptomyces lividans suggests that bacillaene 236
synthesis is inactive within spreading populations of B. subtilis 237
In a previous study, we found that a bacillaene-deficient B. subtilis strain (∆pksB-R, from 238
this point forward ∆pks) induces the production of red-pigmented prodiginines (RED) by 239
S. coelicolor (7, 10). Based on the observed pattern of induction, we associate RED 240
on January 30, 2018 by guesthttp://jb.asm
.org/D
ownloaded from

12
with the absence of bacillaene in our co-culture assays. In the present study, we plated 241
colonies of S. lividans, which also encodes the RED genes, adjacent to wild-type B. 242
subtilis colonies (33). Over the course of 4 days, the B. subtilis colonies spread on the 243
plates toward the S. lividans colonies (Fig. 2). We observed that the RED pigment was 244
induced where the spreading B. subtilis population contacts the colonies of S. lividans. 245
The observed RED induction is similar to prior observations using bacillaene-deficient 246
∆pks strains with S. coelicolor. The presence of RED suggested the possibility that the 247
spreading cells do not produce bacillaene and raised the question whether differential 248
expression of the pks genes occurred in different subpopulations of B. subtilis. 249
250
Bacillaene production peaks at the onset of stationary phase in liquid culture 251
To understand the regulatory functions that control bacillaene production, we first used 252
classical growth in liquid culture to follow the pattern of bacillaene synthesis and to 253
identify the relevant regulatory elements. In previous work, fluorescence microscopy of 254
individual Pks proteins fused to yellow fluorescent protein (YFP) and cyan fluorescent 255
protein (CFP) revealed that the bacillaene megacomplex synthetase accumulates within 256
B. subtilis cells as cultures approach high cell density (7). This pattern of megacomplex 257
assembly suggests that regulation of bacillaene synthesis is coordinated with cellular 258
growth. To build a comprehensive view of bacillaene synthesis, we sought to determine 259
whether pks gene expression and bacillaene secretion follow a similar pattern as 260
observed for megacomplex assembly. Thus, we monitored bacillaene synthesis, 261
megacomplex formation, and pks gene expression in samples taken from a liquid 262
on January 30, 2018 by guesthttp://jb.asm
.org/D
ownloaded from

13
culture of the strain PKS0212, which expressed YFP fused to the C-terminal end of the 263
PksR protein (Fig. 3) (7). We chose to use PksR as a representative of the assembly-264
line enzymes required for bacillaene synthesis because the pksR gene resides at the 3’ 265
end of the nearly 75 kb pks operon, as described for the pks gene cluster in the 266
SubtiExpress database (http://subtiwiki.uni-goettingen.de/apps/expression/) (23). As the 267
final product transcribed from the pks operon, we postulated that the accumulation of 268
PksR protein approximates the amount of completely assembled enzymatic complexes 269
within the cell. B. subtilis PSK0212 cultures growing in CH medium at 30°C were 270
sampled at multiple times over 15 hours and monitored using three approaches. First, 271
we used HPLC to quantitate bacillaene in the culture supernatant (Fig. 3A). Second, we 272
used the PksR-YFP chimera to monitor the protein accumulation by western blot (Fig. 273
3B) and the formation of megacomplex by fluorescence microscopy (Fig. 3C) (7). Third, 274
we measured the abundance of three transcripts that span the length of the operon, 275
pksC, pksE, and pksR by quantitative RT-PCR (qRT-PCR) to determine the pattern of 276
pks gene expression (Fig. 3D). 277
The production of bacillaene by B. subtilis followed a pattern typical of many antibiotics 278
produced during the transition from exponential growth to stationary phase (1, 34, 35). 279
Bacillaene was not detected by HPLC in cultures of low cell density (< 0.5 OD600). 280
However, the amount of bacillaene per unit OD600 in the culture broth increased over 281
time until the cells reached entry into stationary phase (Fig. 3A). The transition from 282
exponential to stationary phase in CH medium occurred above OD600 ~ 1.5 under the 283
culture conditions used. Above this cell density, the increase in detectable bacillaene 284
per unit OD600 was pronounced, reaching a peak accumulation at OD600 = 4.2. Upon 285
on January 30, 2018 by guesthttp://jb.asm
.org/D
ownloaded from

14
further incubation, the culture supernatants declined in bacillaene/unit OD600, 286
suggesting that active synthesis is diminished as cells progress into stationary phase. 287
We hypothesized that the rate of bacillaene synthesis would change with cell density if 288
the megacomplex enzymes underwent assembly and subsequent turnover or 289
inactivation during the course of growth. In a prior study, PksR-YFP was found to 290
increase with cell density up to an OD600 = 1.7 (7). Here we extended the cultures to 291
OD600 = 6.8 in order to track the protein during stationary phase. We examined the 292
levels of PksR-YFP protein in cells taken from the culture at the same time points as the 293
samples taken for HPLC (Fig. 3A). Equivalent amounts of protein from whole cell 294
lysates were probed with an anti-GFP antibody to detect the presence of PksR-YFP. At 295
low culture density, PksR-YFP was below the level of detection in our western blot 296
analysis, consistent with previous results (7). However, a band corresponding to 311 297
kD, the expected molecular mass of the PksR-YFP fusion, was readily detected at 298
OD600 above 0.9, and reached peak intensity between OD600 1.8 and 2.7, corresponding 299
to the stationary phase transition. A second high molecular mass band became visible 300
from OD600 1.8. The higher molecular mass PksR band may represent a modified form 301
of PksR-YFP. Upon further incubation, PksR appears to be processed or degraded, as 302
seen by the diminished signal of higher and lower molecular mass bands on the 303
western blot (Fig. 3B). 304
The diminished PksR-YFP signal is consistent with the enzymes being turned over 305
during stationary-phase culture, which would account for reduced bacillaene production 306
in culture. We predicted that the fluorescent signal from PksR-YFP in assembled 307
megacomplexes would decline in cultures of stationary phase cells in accord with 308
on January 30, 2018 by guesthttp://jb.asm
.org/D
ownloaded from

15
degradation of PksR-YFP. Using the same culture conditions as above, we examined 309
cells expressing PksR-YFP by fluorescence microscopy to follow the assembly of 310
megacomplexes and their subsequent disruption. As seen in Figure 3C, 311
megacomplexes became visible as fluorescent foci within cells grown to intermediate 312
cell density (OD600 = 1.8). At higher cell density, fewer PksR-YFP positive cells were 313
observed and the overall intensity of the signal per cell is reduced (OD600 = 6.6). We 314
counted cells with detectable, punctate YFP signal at each sample point and found that 315
cells positive for megacomplexes first increased and then reduced to less than 50% of 316
the population at high OD600 (Table S1). However, an intense fluorescent signal persists 317
for a percentage of the cells at high cell density. Whether these cells actively produce 318
bacillaene is unknown. Comparison of bacillaene production in figure 3A with the 319
fluorescence signal in figure 3C reveals a consistent pattern of megacomplex assembly 320
and bacillaene synthesis that peaks during the transition to stationary phase and 321
decreases upon continued incubation. 322
Antibiotic biosynthesis is commonly regulated by transcriptional activation of the 323
biosynthetic gene clusters during transition from exponential to stationary growth phase. 324
We next sought to determine if the pks genes are expressed in a pattern similar to the 325
pattern of bacillaene production. A recent study of global gene expression under many 326
different growth conditions suggests that the pks genes are expressed as a single 327
operon from pksC to pksR (23). We selected three open reading frames within the 328
apparent pks operon for targeted expression analysis. Two of the genes, pksC and 329
pksE, are positioned near the 5’ end of the pks operon (Fig. 1A). The third gene we 330
analyzed, pksR, is the final ORF before the predicted transcriptional terminator and 331
on January 30, 2018 by guesthttp://jb.asm
.org/D
ownloaded from

16
encodes a multimodular PKS enzyme. To compare their patterns of expression at the 332
beginning and end of the apparent operon, equivalent amounts of total RNA were used 333
to measure relative amounts of transcripts for pksC, pksE and pksR using qRT-PCR. 334
Here we found that all of the pks genes followed the same expression pattern (Fig. 3D). 335
The transcripts were at the lowest level during exponential growth, and peaked near the 336
transition to stationary phase (1.8 OD600). Consistent with the bacillaene and PksR-YFP 337
results, pks transcripts diminished as cells progressed through stationary phase. This 338
pattern of pks gene expression and bacillaene synthesis suggests that the production of 339
bacillaene is tied to the levels of pks transcript in the cells. 340
341
The TetR-family protein PksA is not involved in bacillaene regulation 342
Many loci that encode assembly line enzyme complexes also encode transcription 343
factors that control the expression of the biosynthetic genes (12, 36, 37). The pksA 344
gene, located adjacent to the pks gene cluster, encodes a putative TetR-family 345
regulatory protein that is predicted to function as the associated regulator of the pks 346
genes (14–16). To determine whether PksA regulates pks gene expression, we 347
replaced the endogenous pksA gene (∆pksA) with a kanamycin resistance gene and 348
examined the effect on pks gene transcripts. We measured the pksC, pksE, and pksR 349
transcripts by qRT-PCR of the wild type and ∆pksA strains during the induction phase of 350
pks gene expression (OD600 0.2 to 1.8) (Fig. 4). The transcripts of all three genes 351
increased several-fold for both wild type and ∆pksA strains as cultures exited log phase 352
(Fig 4, OD600 = 1.8). We complemented the ∆pksA mutation with insertion of the pksA 353
on January 30, 2018 by guesthttp://jb.asm
.org/D
ownloaded from

17
gene at the amyE locus. The complemented strain induced pks gene expression in a 354
similar pattern as the ∆pksA and wild-type strains (Fig. 4). In addition, the ∆pksA 355
deletion had no discernable effect on bacillaene production as determined by HPLC 356
(Supplementary material, Fig. S1A). The absence of a phenotype for ∆pksA does not 357
preclude the function of PksA as a repressor of pks gene expression. To determine if 358
overexpression of pksA would repress pks gene expression, we introduced an IPTG-359
inducible copy of pksA into the ∆pksA strain and quantitated pksC and pksR transcripts. 360
No significant effect on either pks transcript was detected in the pksA overexpression 361
condition, despite a 35-fold elevation in abundance of pksA transcript (Supplementary 362
material, Fig. S1B). Thus, neither deletion nor overexpression of pksA significantly 363
perturbed the induction of the pks genes during growth of B. subtilis, leading us to 364
conclude that the target of PksA regulation is not the pks operon. 365
366
The promoter PpksC controls expression of the pks gene cluster 367
Collectively, these data indicate that the regulation of the pks operon is coupled to 368
cellular growth by an undetermined mechanism. To identify regulatory functions that 369
activate bacillaene production, we first generated reporters for transcriptional activation 370
of the pks operon. Based on a previous report of B. subtilis global gene expression, 371
three putative upstream regulatory sequences are active within the pks gene cluster, 372
PpksB, PpksC, and PpksS (Fig. 1B) (http://subtiwiki.uni-goettingen.de/apps/expression/) 373
(23). We isolated the 5’UTRs of pksB, pksC, and pksS, and fused them to the yfp and 374
lacZ genes for fluorescence and β-galactosidase assays, respectively. Low levels of 375
on January 30, 2018 by guesthttp://jb.asm
.org/D
ownloaded from

18
activity from the pksB and pksS promoters were detected by fluorescence microscopy, 376
and the intensity of signal did not change during growth (Fig. 5A). In contrast, both 377
fluorescence microscopy and β-galatosidase assays revealed that the pksC promoter is 378
highly active and induced at the same relative cell density as described above (Fig. 5A 379
and 5B). Thus the PpksC reporter fusions provide a tool to determine patterns of pks 380
gene expression in cultures of B. subtilis. 381
382
Differential activation of PpksC in colonies and motile subpopulations 383
We predicted that if bacillaene synthesis were inactivated in the spreading populations, 384
as we hypothesized based on the induction of RED synthesis by S. lividans (Fig. 2), 385
then PpksC-lacZ activity would be differentially localized between the parent colony and 386
the spreading subpopulation. B. subtilis carrying the PpksC-lacZ reporter was challenged 387
with S. lividans on plates containing X-gal. As previously described, the B. subtilis cells 388
spread toward S. lividans on the agar plate, and PpksC-lacZ was differentially activated 389
within the colonies (Fig 5C). Endogenous β-galactosidase activity of S. lividans 390
produced blue streptomycete colonies and obscured the visibility of RED pigment in 391
these assays (38). However, β-galactosidase activity from B. subtilis was co-incident 392
with the primary colony. As seen in figure 5C, at early time points (24 hours) the β-393
galactosidase activity was absent within the spreading population of cells. These results 394
supported the observation that the spreading cells are inactive for bacillaene production. 395
Upon further incubation (48 hours), PpksC-lacZ activity increased on the interior of the 396
spreading population, but remained repressed at the leading edge where contact with S. 397
on January 30, 2018 by guesthttp://jb.asm
.org/D
ownloaded from

19
lividans is initiated. We conclude from these data that the pks operon is likely to be 398
activated by regulatory pathways that at least transiently differentiate highly motile from 399
static populations. 400
401
Multiple regulatory networks control pks gene expression 402
B. subtilis uses a complex network of regulatory proteins to control antibiotic production, 403
developmental transitions, and specification of cell fates within a population (1, 19, 39). 404
To identify regulatory functions that control pks gene expression, we surveyed induction 405
of pks gene expression in several strains carrying gene deletions for regulators that 406
control antibiotic production, developmental transitions, or nutrient stress response. We 407
used liquid cultures of B. subtilis for standardized comparison of pks expression levels 408
between mutant strains. Several strains were compared to wild type for levels of pks 409
gene expression (Fig. 6). A moderate reduction was observed with ∆degU and ∆comA 410
strains, which showed pronounced disruption of induced pks gene expression as cells 411
transition from exponential to stationary phase (OD600 = 1.8) (Fig 6A). In contrast, 412
moderate elevation of pksC expression was found for the intermediate sample (OD600 = 413
0.9) in the ∆scoC mutant strain, which subsequently failed to reach wild-type levels of 414
transcript at high cell density. Reproducibly, the ∆spo0A and ∆codY strains had the 415
lowest detectable level of pksC expression compared to wild type, suggesting that pks 416
gene expression requires dual activation through CodY and Spo0A. 417
Spo0A represses transcription of AbrB, which controls multiple antibiotic biosynthesis 418
pathways and other transition state processes in B. subtilis (24, 40–42). However, a 419
on January 30, 2018 by guesthttp://jb.asm
.org/D
ownloaded from

20
∆abrB strain showed a pks gene expression pattern similar to wild type (Fig. 6A). 420
Because the ∆spo0A strain disrupted pks gene expression, we tested whether ∆spo0A-421
dependent block to pks expression requires AbrB by determining the level of pks gene 422
expression in a ∆spo0A ∆abrB double mutant strain (Fig. 6B). To do this, we used the 423
PpksC-lacZ strain in order to accommodate existing markers for strain construction. 424
Strains with deletions of the spo0A and abrB genes, individually and in combination, 425
were used to quantitate pksC promoter activity by β-galactosidase assay. The deletion 426
of abrB in a ∆spo0A background restored promoter activity of pksC at all time points. 427
We conclude that pks expression is activated by Spo0A through repression of AbrB, a 428
pattern shared by several B. subtilis gene clusters encoding antibiotics (1, 24). 429
430
Heterogeneous PpksC activity in liquid cultures of B. subtilis 431
Spo0A and CodY are stationary-phase regulators with functions that intersect with 432
DegU, ComA, and ScoC-dependent processes, including transitions between motile 433
populations, antibiotic production, extracellular matrix production, and sporulation (22, 434
26, 43–46). We generated PpksC-yfp reporter strains that also encode fusions of cfp to 435
reporters for motility, extracellular matrix, and sporulation to determine whether the pks 436
genes are coordinately controlled by these pleiotropic regulators during the switch 437
between static and spreading populations. We used a fusion of the promoter for the hag 438
gene (Phag-cfp), which encodes the principal flagellar protein, to indicate �D-dependent 439
motile cells (39, 47). A PtapA-cfp fusion was used to indicate biofilm matrix-producing 440
subpopulations. The tapA gene encodes a component of the biofilm extracellular matrix 441
on January 30, 2018 by guesthttp://jb.asm
.org/D
ownloaded from
21
and is dependent on Spo0A repression of AbrB for activation (24, 39, 48). In addition to 442
Phag-cfp and PtapA-cfp, we used PsspB-cfp to monitor sporulating cells, which are 443
indicative of highly phosphorylated Spo0A and CodY derepression under conditions of 444
nutrient depletion (20, 39, 49, 50). Fluorescence microscopy was used to examine 445
promoter activities at cell densities associated with induction of the respective pathway-446
specific reporters. As seen in figure 7, the cells within each field show heterogeneous 447
intensity of PpksC-yfp fluorescence, suggesting differential pks expression in distinct 448
subpopulations of cells in a liquid culture (20). The observed pattern of PpksC-lacZ 449
activation suggested that pks gene expression is repressed in motile cells expressing 450
Phag-cfp. Conversely, cells expressing PtapA-cfp also showed elevated levels of PpksC-yfp. 451
Thus, the bacillaene operon appears to be induced in matrix-producing populations and 452
not in motile subpopulations when B. subtilis is grown in liquid culture. The observed 453
pattern is consistent with a pattern of Spo0A-dependent activation and with the PpksC-454
lacZ expression we have observed on agar plates with S. lividans. Upon starvation at 455
high cell density, Spo0A is highly phosphorylated and induces sporulation (51). We 456
examined the level of PpksC-yfp fluorescence in strains expressing PsspB-cfp as a marker 457
of sporulation. The PpksC-yfp signal was detectable in the majority of cells at high cell 458
density (OD600 = 4.0). In a percentage of the cells, nascent spores were visible by 459
fluorescence of both TMA-DPH-stained membranes and the PsspB-cfp reporter (Fig. 7). 460
Within the visibly sporulating population, PpksC-yfp reporter expression was restricted to 461
the mother cells and not in developing spores. These observations are consistent with 462
activation of pks gene expression during the transition from exponential growth to 463
on January 30, 2018 by guesthttp://jb.asm
.org/D
ownloaded from

22
stationary phase, processes controlled by the master regulatory protein, Spo0A, and the 464
nutrient status regulator, CodY (50, 51). 465
466
PpksC is homogeneously repressed upon spreading of B. subtilis colonies 467
Based on the observed patterns of PpksC-yfp activation in liquid culture, we asked 468
whether pks gene expression on solid surfaces was heterogenous and exclusive to 469
biofilm matrix-producing cells but not motile cells. We cultured the Phag-cfp, PpksC-yfp 470
and PtapA-cfp, PpksC-yfp strains on agar media with S. lividans (Fig. 8). We observed in 471
these strains that PpksC-YFP activation was uniformly low in the spreading population 472
and high in the parent colony, as was also observed with the PpksC-lacZ reporter. The 473
patterns of Phag-cfp and PtapA-cfp expression, on the other hand, were heterogenous 474
within these populations. This expression pattern indicated that activation of pks gene 475
expression is not co-regulated with matrix production per se, which we inferred from its 476
coincidence with PtapA-cfp in liquid cultures. Nor is PpksC-yfp strictly repressed in the 477
Phag-cfp marked motile cells. Instead, the level of pks gene expression is largely 478
determined by differentiation of the spreading population from a static colony. In an 479
effort to define the type of motility observed in these assays, we determined that the 480
spreading population is dependent upon both surfactin (∆srfAA) and �D (∆sigD) for 481
motility (Fig. S2A). Thus, we think the cells are using swarming motility, which requires 482
�D for expression of flagellar genes, to propel themselves toward the S. lividans (28). 483
Colony spreading also occurs by spontaneous mutation or targeted disruption of 484
competence and DNA metabolism genes (52). We found that the spreading cells in our 485
on January 30, 2018 by guesthttp://jb.asm
.org/D
ownloaded from

23
assays are not formed of spontaneous mutants, suggesting that the presence of S. 486
lividans either results in swarming motility or directional growth by B. subtilis (Fig. S2B). 487
In either case, the expression of the pks genes is minimal upon emergence of the 488
swarming population. The pattern of transient repression during motility and activation in 489
the parent colony is consistent with complex control of pks gene expression by 490
regulators that converge on switching between motility and stationary-phase functions, 491
including the energy and extracellular responsiveness of CodY and Spo0A. 492
493
Discussion 494
Bacillaene is an important determinant of outcomes during interactions between B. 495
subtilis and competitor species. Bacillaene is essential for survival in competition with 496
the predatory-like species Streptomyces sp. Strain Mg1 (11). Also, the presence or 497
absence of bacillaene influences how a competitor responds to B. subtilis, as was 498
illustrated previously by the induction of prodiginines (RED) by S. coelicolor and as 499
found in the present study by S. lividans (7). The present study directly addressed pks 500
gene regulation and the control of bacillaene production by B. subtilis. We took a 501
multistep approach to identify regulatory functions that control bacillaene production and 502
considered several existing transcriptomic studies that suggest modes of bacillaene 503
regulation (23, 25, 42, 53, 54). We first determined that B. subtilis in liquid culture 504
induces transcription of the >74kb pks operon as the cells exit logarithmic growth and 505
transition to stationary phase. As the cultures progressed into stationary phase, the 506
production of bacillaene was diminished. Both the pks transcripts decreased during 507
on January 30, 2018 by guesthttp://jb.asm
.org/D
ownloaded from

24
stationary phase culture and the Pks megacomplexes were degraded as observed by 508
fluorescence of PksR-YFP. Thus a similar pattern in liquid culture of induction and 509
subsequent reduction is apparent for pks transcript levels, PksR abundance, and the 510
presence of secreted bacillaene. This pattern suggests transcriptional regulation is a 511
primary determinant for bacillaene production, as opposed for instance, to activation or 512
deactivation of enzymatic assembly lines. 513
The regulation of pks gene transcription was previously assigned to the PksA protein, 514
annotated as a TetR-family regulator of pks genes. Our results indicate that PksA does 515
not regulate pks gene expression, at least under the experimental conditions we tested. 516
Our preliminary data suggests that the function of PksA may be directed toward an 517
adjacent, divergently transcribed gene, ymcC (not shown). Also, related organisms, 518
such as Bacillus amyloliquefaciens FZB42 also produce bacillaene, encoding the 519
enzymatic complex in the bae gene cluster (14). In contrast to B. subtilis, the 520
orthologous pksA gene of B. amyloliquefaciens FZB42 is located in a region of the 521
chromosome separate from the bae biosynthetic gene cluster, suggesting the protein is 522
not a pathway-specific regulator (16). Thus these data support a model for pks gene 523
regulation and bacillaene production that relies on global regulatory circuits and not a 524
pathway-specific regulator such as PksA. 525
Evidence for differential activation of pks gene expression emerged from the interaction 526
of B. subtilis with S. lividans, which suggested bacillaene is repressed in spreading 527
subpopulations. To understand regulatory processes that control bacillaene production, 528
we focused our attention on regulation of the pks operon that extends from pksC to 529
pksR. We identified the 5’UTR of pksC as the control element for induction of the pks 530
on January 30, 2018 by guesthttp://jb.asm
.org/D
ownloaded from

25
operon, which is consistent with results from a genome-wide study of B. subtilis 531
transcription (23). Using PpksC-yfp and PpksC-lacZ reporters, we confirmed that pks gene 532
expression was transiently repressed in populations of cells that migrate across agar 533
toward S. lividans. We have shown that bacillaene production is principally under the 534
control of the Spo0A and CodY stationary phase regulators. However, full induction of 535
pks gene expression is also dependent on DegU, ComA, and ScoC, suggesting that B. 536
subtilis uses multiple mechanisms to integrate bacillaene synthesis with other cellular 537
functions (19, 55–57). The observed patterns of pks gene expression suggest that B. 538
subtilis activates and represses bacillaene production in response to nutrient conditions 539
and developmental transitions. Similar observations for regulation of several B. subtilis 540
antibiotics in liquid culture have been described (1, 4, 21, 22, 24, 28, 58–60) 541
Our results support a model wherein B. subtilis inactivates bacillaene production during 542
a motile phase induced by growth in the presence of S. lividans. The parent colony 543
actively expresses the pks genes. The swarming population initially repressed pks 544
expression, which over time becomes active within the motile populations. The 545
described pattern of synthesis is consistent with the observation that Spo0A, which 546
controls a switch between motile and biofilm matrix-producing cells, are required for full 547
induction of the pks genes (39). Additionally, the loss of pks gene expression in the 548
∆codY strain revealed that the pks operon is one of a few targets dependent upon CodY 549
for expression (61). CodY binds directly to GTP and branched-chain amino acids 550
(BCAAs) as a mechanism for sensing nutrient-rich conditions (50, 62). When bound to 551
these signals, CodY represses functions that include motility (e.g. hag and fla-che) and 552
antibiotic production (e.g. surfactin and bacilysin) through increased affinity for their 553
on January 30, 2018 by guesthttp://jb.asm
.org/D
ownloaded from
26
regulatory DNA elements (46, 63). The ∆codY phenotype for pks gene expression 554
suggests that the pks operon is tuned to changes in nutrient availability, and is 555
repressed when cells divert resources to motility. We speculate that maintaining low pks 556
gene expression in motile populations may be important for energy resource allocation 557
in B. subtilis, because synthesis of megacomplexes and bacillaene are likely to require 558
considerable energy input. 559
Our results suggest a hypothesis that dual regulation of pks expression may ensure 560
bacillaene production in high cell-density populations, such as biofilms (Spo0A-561
dependent), and under conditions of nutrient availability that permit pks genes 562
expression (CodY). In addition, secondary control mechanisms may fine tune 563
expression in response to external and internal conditions or signals through DegU, 564
ComA, and ScoC. For example, DegU is induced by the presence of glucose through 565
catabolite regulator function (64). Thus, a DegU-dependent timing mechanism may exist 566
for initial repression by dephospho-DegU, followed by activation through DegU 567
phosphorylation and inhibition of motility (65). ComA and ScoC also function in both 568
motility control and secondary metabolism. ComA regulates surfactin production, which 569
is required for swarming motility, and DegQ, which enhances DegU phosphorylation 570
(54, 66). ScoC, which directly controls bacilysin production, also controls the transition 571
between motile and biofilm-forming populations through its regulation of flgM and sinI, 572
respectively (22, 57, 67). Thus, ScoC may coordinate the timing of induction for pks 573
gene expression, which we found is activated early by a ∆scoC mutant strain. Other, 574
unidentified regulatory functions may contribute to pks control as well. How the relative 575
on January 30, 2018 by guesthttp://jb.asm
.org/D
ownloaded from

27
timing of interactions between regulatory pathways integrates downstream functions is 576
complex and incompletely understood. 577
Exploring the divergent functions in static and motile populations of competing bacteria 578
provides an experimental system to better understand pathway integration. Based on 579
our results, synthesis of bacillaene enters a growing list of processes that are divided 580
among subpopulations of clonal B. subtilis cells (68). Regulatory mechanisms for 581
antibiotic biosynthesis have been generally studied by culturing bacteria in liquid and 582
following patterns of synthesis correlated with cell density. As we have shown, the 583
production of bacillaene in liquid culture fits a pattern typical of many antibiotics, i.e. 584
induction upon transition out of logarithmic growth. Historically, this timing defines 585
antibiotic production within the idiophase (69). When grown on solid surfaces, patterns 586
of differentiation suggest that many bacteria have sophisticated mechanisms for 587
determining the timing of pathway activation (39). Antibiotic biosynthesis is no 588
exception. Developmental regulatory processes also control antibiotic biosynthesis (1). 589
For example, many Streptomyces species couple antibiotic biosynthesis with 590
developmental pathways of aerial growth and sporulation through complex regulatory 591
circuits (17). In some cases, antibiotic biosynthesis is activated by pathway specific 592
regulatory genes that may be directed by developmental regulators (70). When no 593
pathway specific regulatory proteins are present, identifying the specific determinants of 594
activation requires understanding the developmental control networks of the organism. 595
Studies of antibiotic regulation under competition suggest that coordinated control of 596
multiple antibiotics with developmental transitions serves to optimize the competitive 597
fitness of B. subtilis by ensuring efficient resource allocation (71). The convergence of 598
on January 30, 2018 by guesthttp://jb.asm
.org/D
ownloaded from

28
bacterial developmental regulation with control of antibiotic synthesis may highlight new 599
approaches to activate or optimize production of molecules of interest (72). For 600
example, strategic genetic manipulations of the producing species could be used to 601
restrict the organism to a high antibiotic output state, which may also be an effective 602
approach to activate cryptic secondary metabolic pathways (73). Future examination of 603
developmental controls for antibiotic biosynthesis will likely inform key principles of 604
bacterial competition as well as new strategies to induce antibiotic production from 605
microorganisms. 606
607
Acknowledgments 608
We thank Dr. Craig Kaplan for use of the real time PCR thermocycler. Dr. Jennifer 609
Herman for advice and use of the fluorescence microscope. Dr. Chris Hoefler for 610
support with HPLC. Dr. Hera Vlamakis and Dr. Roberto Kolter for providing us with 611
strains. Dr. A.L. Sonenshein for a gift of the B. subtilis ∆codY strain. Dr. Hera Vlamakis 612
and Dr. Jennifer Herman for critical review of the manuscript. We thank Hannah 613
Bereuter and Sara Peffer for technical assistance. 614
This work was supported by Texas A&M University, Agrilife Research. 615
616
References 617
618
on January 30, 2018 by guesthttp://jb.asm
.org/D
ownloaded from

29
1. Stein T. 2005. Bacillus subtilis antibiotics: structures, syntheses and specific 619
functions. Mol. Microbiol. 56:845–57. 620
2. Kearns D, Losick R. 2003. Swarming motility in undomesticated Bacillus subtilis. 621
Mol. Microbiol. 49:581–590. 622
3. Lopez D, Fischbach MA, Chu F, Losick R, Kolter R. 2009. Structurally diverse 623
natural products that cause potassium leakage trigger multicellularity in Bacillus 624
subtilis. Proc. Natl. Acad. Sci. U.S.A. 106:280–285. 625
4. López D, Vlamakis H, Losick R, Kolter R. 2009. Paracrine signaling in a 626
bacterium. Genes Dev. 23:1631–8. 627
5. Steller S, Vollenbroich D, Leenders F, Stein T, Conrad B, Hofemeister J, 628
Jacques P, Thonart P VJ. 1999. Structural and functional organization of the 629
fengycin synthetase multienzyme system from Bacillus subtilis b213 and A1/3. 630
Chem. Biol. 6:31–41. 631
6. Jacques P. 2011. Surfactin and Other Lipopeptides from Bacillus spp., p. 57–91. 632
In Soberón-Chávez, G (ed.), Microbiology Monographs Series Vol.20. Springer 633
Berlin Heidelberg. 634
7. Straight PD, Fischbach M a, Walsh CT, Rudner DZ, Kolter R. 2007. A singular 635
enzymatic megacomplex from Bacillus subtilis. Proc. Natl. Acad. Sci. U.S.A. 636
104:305–10. 637
8. Butcher R a, Schroeder FC, Fischbach M a, Straight PD, Kolter R, Walsh CT, 638
Clardy J. 2007. The identification of bacillaene, the product of the PksX 639
megacomplex in Bacillus subtilis. Proc. Natl. Acad. Sci. U.S.A. 104:1506–9. 640
on January 30, 2018 by guesthttp://jb.asm
.org/D
ownloaded from

30
9. Patel PS, Huangn S, Fisher S, Pirnik D, Aklonis C, Dean L, Meyers E, 641
Fernandes P, Mayerlm F. 1995. Bacillaene, a Novel Inhibitor of Procaryotic 642
Protein Synthesis Produced by Bacillus subtilis: Production , Taxonomy , 643
Isolation, Physico-chemical Activity. J. Antibiot. 48:997–1003. 644
10. Yang Y-L, Xu Y, Straight P, Dorrestein PC. 2009. Translating metabolic 645
exchange with imaging mass spectrometry. Nat. Chem. Biol. 5:885–7. 646
11. Barger S, Hoefler B, Cubillos-Ruiz A, Russell W, Russell D, Straight P. 2012. 647
Imaging secondary metabolism of Streptomyces sp. Mg1 during cellular lysis and 648
colony degradation of competing Bacillus subtilis. Antonie Van Leeuwenhoek 649
102:435–45. 650
12. Fischbach M a, Walsh CT. 2006. Assembly-line enzymology for polyketide and 651
nonribosomal Peptide antibiotics: logic, machinery, and mechanisms. Chem. Rev. 652
106:3468–96. 653
13. Cundliffe E, Demain AL. 2010. Avoidance of suicide in antibiotic-producing 654
microbes. J. Ind. Microbiol. Biotechnol. 37:643–72. 655
14. Chen X-H, Vater J, Piel J, Franke P, Scholz R, Schneider K, Koumoutsi A, 656
Hitzeroth G, Grammel N, Strittmatter AW, Gottschalk G, Süssmuth RD, 657
Borriss R. 2006. Structural and functional characterization of three polyketide 658
synthase gene clusters in Bacillus amyloliquefaciens FZB 42. J. Bacteriol. 659
188:4024–36. 660
15. Reddick JJ, Antolak SA, Raner GM. 2007. PksS from Bacillus subtilis is a 661
cytochrome P450 involved in bacillaene metabolism. Mol. Cell Biol. Res. 662
Commun. 358:363–7. 663
on January 30, 2018 by guesthttp://jb.asm
.org/D
ownloaded from

31
16. Chen XH, Koumoutsi a, Scholz R, Schneider K, Vater J, Süssmuth R, Piel J, 664
Borriss R. 2009. Genome analysis of Bacillus amyloliquefaciens FZB42 reveals 665
its potential for biocontrol of plant pathogens. J. Biotechnol. 140:27–37. 666
17. Van Wezel GP, McDowall KJ. 2011. The regulation of the secondary metabolism 667
of Streptomyces: new links and experimental advances. Nat Prod Rep 28:1311–668
33. 669
18. Bibb MJ. 2005. Regulation of secondary metabolism in streptomycetes. Curr. 670
Opin. Microbiol. 8:208–15. 671
19. López D, Kolter R. 2010. Extracellular signals that define distinct and coexisting 672
cell fates in Bacillus subtilis. FEMS Microbiol Rev 34:134–49. 673
20. Lopez D, Vlamakis H, Kolter R. 2009. Generation of multiple cell types in 674
Bacillus subtilis. FEMS Microbiol Rev 33:152–63. 675
21. Karatas A, Cetin S, Ozcengiz G. 2003. The effects of insertional mutations in 676
comQ, comP, srfA, spo0H, spo0A and abrB genes on bacilysin biosynthesis in 677
Bacillus subtilis. Biochim. Biophys. Acta1626:51–56. 678
22. Inaoka T, Wang G, Ochi K. 2009. ScoC Regulates Bacilysin Production at the 679
Transcription Level in Bacillus subtilis. J. Bacteriol. 191:7367–7371. 680
23. Nicolas P, Mäder U, Dervyn E, Rochat T, Leduc A, Pigeonneau N, Bidnenko 681
E, Marchadier E, Hoebeke M, Aymerich S, Becher D, Bisicchia P, Botella E, 682
Delumeau O, Doherty G, Denham EL, Fogg MJ, Fromion V, Goelzer A, 683
Hansen A, Härtig E, Harwood CR, Homuth G, Jarmer H, Jules M, Klipp E, Le 684
Chat L, Lecointe F, Lewis P, Liebermeister W, March A, Mars R a T, 685
Nannapaneni P, Noone D, Pohl S, Rinn B, Rügheimer F, Sappa PK, Samson 686
on January 30, 2018 by guesthttp://jb.asm
.org/D
ownloaded from

32
F, Schaffer M, Schwikowski B, Steil L, Stülke J, Wiegert T, Devine KM, 687
Wilkinson AJ, van Dijl JM, Hecker M, Völker U, Bessières P, Noirot P. 2012. 688
Condition-dependent transcriptome reveals high-level regulatory architecture in 689
Bacillus subtilis. Science 335:1103–6. 690
24. Strauch MA, Bobay BG, Cavanagh J, Yao F, Wilson A, Le Breton Y. 2007. 691
Abh and AbrB control of Bacillus subtilis antimicrobial gene expression. J. 692
Bacteriol. 189:7720–32. 693
25. Belitsky B, Sonenshein A. 2013. Genome-wide identification of Bacillus subtilis 694
CodY-binding sites at single-nucleotide resolution. Proc. Natl. Acad. Sci. U.S.A. 695
110:7026–7031. 696
26. Sonenshein AL. 2005. CodY, a global regulator of stationary phase and 697
virulence in Gram-positive bacteria. Curr. Opin. Microbiol. 8:203–7. 698
27. Harwood CR, Cutting SM. 1990. Molecular Biological Methods for Bacillus. 699
Wiley, New York. 700
28. Kearns DB, Chu F, Rudner R, Losick R. 2004. Genes governing swarming in 701
Bacillus subtilis and evidence for a phase variation mechanism controlling surface 702
motility. Mol. Microbiol. 52:357–69. 703
29. Ruijter JM, Ramakers C, Hoogaars WMH, Karlen Y, Bakker O, van den Hoff 704
MJB, Moorman AFM. 2009. Amplification efficiency: linking baseline and bias in 705
the analysis of quantitative PCR data. Nucleic Acids Res. 37:1–12. 706
30. Wach A. 1996. PCR-synthesis of marker cassettes with long flanking homology 707
regions for gene disruptions in S. cerevisiae. Yeast 12:259–265. 708
on January 30, 2018 by guesthttp://jb.asm
.org/D
ownloaded from

33
31. Gibson D, Young L, Chuang R, Venter J, Hutchison III C, Smith H. 2009. 709
Enzymatic assembly of DNA molecules up to several hundred kilobases. Nat. 710
Methods 6:343–345. 711
32. Miller JH. 1972. Experiments in molecular genetics. Cold Spring Harbor 712
Laboratory Press, Cold Spring Harbor, NY. 713
33. Williamson NR, Fineran PC, Leeper FJ, Salmond GPC. 2006. The biosynthesis 714
and regulation of bacterial prodiginines. Nat. Rev. Microbiol.4:887–99. 715
34. Hofemeister J, Conrad B, Adler B, Hofemeister B, Feesche J, Kucheryava N, 716
Steinborn G, Franke P, Grammel N, Zwintscher A, Leenders F, Hitzeroth G, 717
Vater J. 2004. Genetic analysis of the biosynthesis of non-ribosomal peptide- and 718
polyketide-like antibiotics, iron uptake and biofilm formation by Bacillus subtilis 719
A1/3. Mol. Genet. Genomics. 272:363–378. 720
35. Guder A, Schmitter T, Wiedemann I, Sahl H-G, Bierbaum G. 2002. Role of the 721
single regulator MrsR1 and the two-component system MrsR2/K2 in the 722
regulation of mersacidin production and immunity. Appl. Environ. Microbiol. 723
68:106–113. 724
36. Ou X, Zhang B, Zhang L, Zhao G, Ding X. 2009. Characterization of rrdA, a 725
TetR family protein gene involved in the regulation of secondary metabolism in 726
Streptomyces coelicolor. Appl. Environ. Microbiol. 75:2158–65. 727
37. Ramos JL, Martínez-bueno M, Molina-Henares A, Terán W, Watanabe K, 728
Zhang X, Gallegos MT, Brennan R, Tobes R. 2005. The TetR Family of 729
Transcriptional Repressors. Microbiol. Rev. 69:326–356. 730
on January 30, 2018 by guesthttp://jb.asm
.org/D
ownloaded from

34
38. Kieser T, Bibb MJ, Buttner MJ, Chater KF. 2000. Practical Streptomyces 731
Genetics. John Innes Foundation, Colney, Norwich NR4 7UH, England. 732
39. Vlamakis H, Aguilar C, Losick R, Kolter R. 2008. Control of cell fate by the 733
formation of an architecturally complex bacterial community. Genes Dev. 22:945–734
953. 735
40. Shafikhani SH, Leighton T. 2004. AbrB and Spo0E control the proper timing of 736
sporulation in Bacillus subtilis. Curr. Microbiol. 48:262–9. 737
41. Hamon MA, Stanley NR, Britton RA, Grossman AD, Lazazzera BA. 2004. 738
Identification of AbrB-regulated genes involved in biofilm formation by Bacillus 739
subtilis. Mol. Microbiol. 52:847–860. 740
42. Chumsakul O, Takahashi H, Oshima T, Hishimoto T, Kanaya S, Ogasawara 741
N, Ishikawa S. 2011. Genome-wide binding profiles of the Bacillus subtilis 742
transition state regulator AbrB and its homolog Abh reveals their interactive role in 743
transcriptional regulation. Nucleic Acids Res. 39:414–428. 744
43. Verhamme DT, Murray EJ, Stanley-Wall NR. 2009. DegU and Spo0A jointly 745
control transcription of two loci required for complex colony development by 746
Bacillus subtilis. J. Bacteriol. 191:100–8. 747
44. Ogura M, Yamaguchi H, Yoshida Ki, Fujita Y, Tanaka T. 2001. DNA microarray 748
analysis of Bacillus subtilis DegU, ComA and PhoP regulons: an approach to 749
comprehensive analysis of B.subtilis two-component regulatory systems. Nucleic 750
Acids Res. 29:3804–13. 751
on January 30, 2018 by guesthttp://jb.asm
.org/D
ownloaded from

35
45. Gupta M, Dixit M, Rao K. 2013. Spo0A positively regulates epr expression by 752
negating the repressive effect of co-repressors, SinR and ScoC, in Bacillus 753
subtilis. J. Biosci. 38:291–9. 754
46. Inaoka T, Takahashi K, Ohnishi-Kameyama M, Yoshida M, Ochi K. 2003. 755
Guanine nucleotides guanosine 5’-diphosphate 3'-diphosphate and GTP co-756
operatively regulate the production of an antibiotic bacilysin in Bacillus subtilis. J. 757
Biol. Chem. 278:2169–76. 758
47. Mirel DB, Chamberlin MJ. 1989. The Bacillus subtilis flagellin gene (hag) is 759
transcribed by the sigma 28 form of RNA polymerase. J. Bacteriol. 171:3095–101. 760
48. Branda SS, Chu F, Kearns DB, Losick R, Kolter R. 2006. A major protein 761
component of the Bacillus subtilis biofilm matrix. Mol. Microbiol. 59:1229–1238. 762
49. Connors MJ, Mason JM, Setlow P. 1986. Cloning and Nucleotide Sequencing of 763
Genes for Three Small, Acid- Soluble Proteins from Bacillus subtilis Spores. J. 764
Bacteriol. 166:417–425. 765
50. Ratnayake-lecamwasam M, Serror P, Wong K, Sonenshein AL. 2001. Bacillus 766
subtilis CodY represses early-stationary-phase genes by sensing GTP levels. 767
Genes Dev. 15:1093–1103. 768
51. Fujita M, González-pastor JE, Losick R. 2005. High- and Low-Threshold Genes 769
in the Spo0A Regulon of Bacillus subtilis. J. Bacteriol. 187:1357–1368. 770
52. Zafra O, Lamprecht-Grandío M, de Figueras CG, González-Pastor JE. 2012. 771
Extracellular DNA release by undomesticated Bacillus subtilis is regulated by 772
early competence. PLoS ONE 7:1–15. 773
on January 30, 2018 by guesthttp://jb.asm
.org/D
ownloaded from
36
53. Fadda A, Fierro AC, Lemmens K, Monsieurs P, Engelen K, Marchal K. 2009. 774
Inferring the transcriptional network of Bacillus subtilis. Mol Biosyst 5:1840–52. 775
54. Ogura M, Yamaguchi H, Yoshida Ki, Fujita Y, Tanaka T. 2001. DNA microarray 776
analysis of Bacillus subtilis DegU, ComA and PhoP regulons: an approach to 777
comprehensive analysis of B.subtilis two-component regulatory systems. Nucleic 778
Acids Res. 29:3804–13. 779
55. Verhamme D, Kiley T, Stanley-Wall N. 2007. DegU co‐ordinates multicellular 780
behaviour exhibited by Bacillus subtilis. Mol. Microbiol. 65:564–568. 781
56. Kunst F, Msadek T, Bignon J, Rapoport G. 1994. The DegS/DegU and 782
ComP/ComA two-component systems are part of a network controlling 783
degradative enzyme synthesis and competence in Bacillus subtilis. Res Microbiol 784
145:393–402. 785
57. Shafikhani SH, Mandic-mulec I, Strauch MA, Smith I, Leighton T. 2002. 786
Postexponential Regulation of sin Operon Expression in Bacillus subtilis. J. 787
Bacteriol. 184:564–571. 788
58. Tsuge K, Ano T, Hirai M, Nakamura Y, Shoda M. 1999. The Genes degQ, pps, 789
and lpa-8(sfp) Are Responsible for Conversion of Bacillus subtilis 168 to 790
Plipastatin Production. Antimicrob Agents Chemother. 43:2183–2192. 791
59. Tsuge K, Matsui K, Itaya M. 2007. Production of the non-ribosomal peptide 792
plipastatin in Bacillus subtilis regulated by three relevant gene blocks assembled 793
in a single movable DNA segment. J. Biotechnol. 129:592–603. 794
on January 30, 2018 by guesthttp://jb.asm
.org/D
ownloaded from

37
60. Luo Y, Helmann JD. 2009. Extracytoplasmic function sigma factors with 795
overlapping promoter specificity regulate sublancin production in Bacillus subtilis. 796
J. Bacteriol. 191:4951–8. 797
61. Molle V, Nakaura Y, Shivers RP, Yamaguchi H, Losick R, Fujita Y, 798
Sonenshein AL. 2003. Additional Targets of the Bacillus subtilis Global Regulator 799
CodY Identified by Chromatin Immunoprecipitation and Genome-Wide Transcript 800
Analysis. J. Bacteriol. 185:1911–1922. 801
62. Shivers RP, Sonenshein AL. 2004. Activation of the Bacillus subtilis global 802
regulator CodY by direct interaction with branched-chain amino acids. Mol. 803
Microbiol. 53:599–611. 804
63. Bergara F, Ibarra C, Iwamasa J, Patarroyo JC, Ma LM. 2003. CodY Is a 805
Nutritional Repressor of Flagellar Gene Expression in Bacillus subtilis. J. 806
Bacteriol. 185: 3118-3126. 807
64. Ishii H, Tanaka T, Ogura M. 2013. The Bacillus subtilis response regulator gene 808
degU is positively regulated by CcpA and by catabolite-repressed synthesis of 809
ClpC. J. Bacteriol. 195:193–201. 810
65. Kobayashi K. 2007. Gradual activation of the response regulator DegU controls 811
serial expression of genes for flagellum formation and biofilm formation in Bacillus 812
subtilis. Mol. Microbiol. 66:395–409. 813
66. Msadek T, Kunst F, Klier A, Rapoport G. 1991. DegS-DegU and ComP-ComA 814
modulator-effector pairs control expression of the Bacillus subtilis pleiotropic 815
regulatory gene degQ. J. Bacteriol. 173:2366–2377. 816
on January 30, 2018 by guesthttp://jb.asm
.org/D
ownloaded from

38
67. Kodgire P, Rao K. 2009. A dual mode of regulation of flgM by ScoC in Bacillus 817
subtilis. Can. J. Microbiol. 55:983–989. 818
68. Aguilar C, Vlamakis H, Losick R, Kolter R. 2007. Thinking About Bacillus 819
subtilis as a Multicellular Organism. Curr Opin Microbiol. 10:638–643. 820
69. Demain L, Fang A. 2000. The natural functions of secondary metabolites. Adv. 821
Biochem. Eng. Biotechnol. 69:1–39. 822
70. Rawlings BJ. 2001. Type I polyketide biosynthesis in bacteria (Part B) (1995 to 823
mid-2000). Nat Prod Rep. 18:231–281. 824
71. Goel A, Wortel MT, Molenaar D, Teusink B. 2012. Metabolic shifts: a fitness 825
perspective for microbial cell factories. Biotechnol. Lett. 34:2147–60. 826
72. Breitling R, Achcar F, Takano E. 2013. Modeling challenges in the synthetic 827
biology of secondary metabolism. ACS Synth Biol 2:373–8. 828
73. Chiang Y-M, Chang S-L, Oakley BR, Wang CCC. 2011. Recent advances in 829
awakening silent biosynthetic gene clusters and linking orphan clusters to natural 830
products in microorganisms. Curr Opin Chem Biol 15:137–43. 831
832
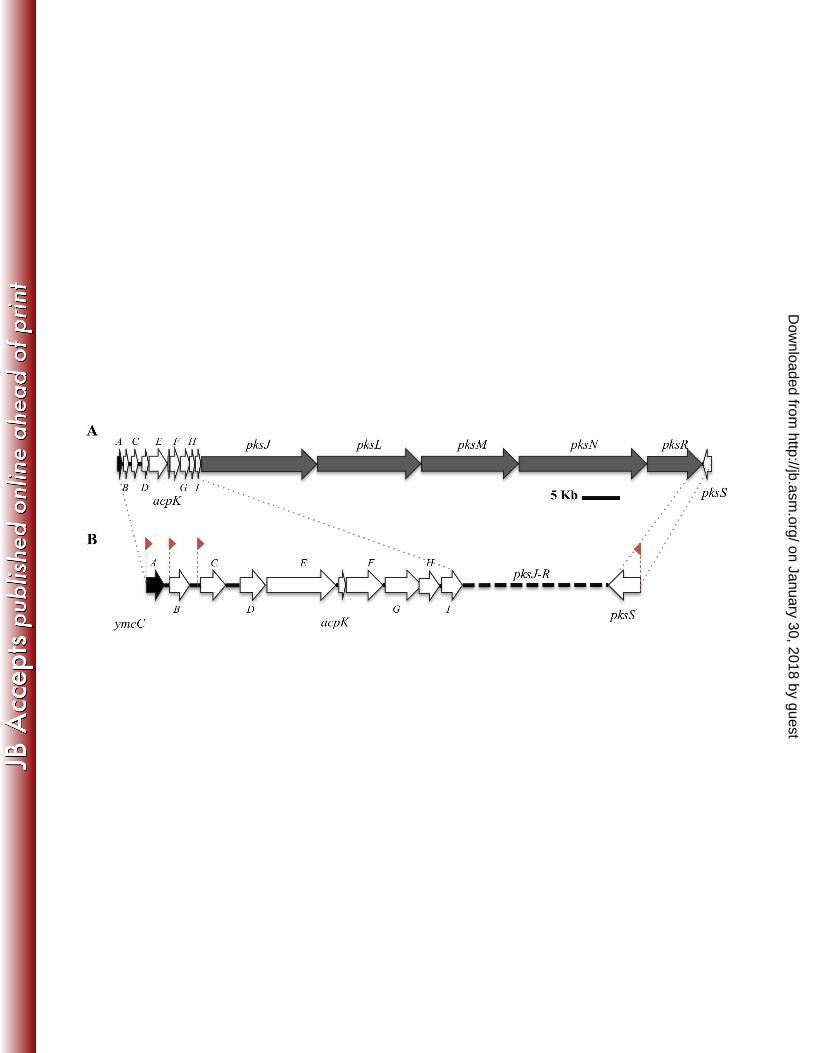
Legends 833
Figure 1. The pks gene cluster in B. subtilis (A) Sixteen genes from pksA to pksS (78.6 834
kb) comprise the pks gene cluster as annotated in the B. subtilis 168 genome. Dark 835
gray arrows represent the genes encoding the multimodular PKS enzymes that 836
synthesize bacillaene. White arrows represent genes encoding functions required in 837
trans to the multimodular enzymes. The black arrow represents pksA, which encodes a 838
predicted TetR-family transcriptional regulator. Arrows are drawn to scale. (B) 839
on January 30, 2018 by guesthttp://jb.asm
.org/D
ownloaded from
39
Expansion of the genes pksA – pksI and pksS highlight the intergenic regions (not to 840
scale). Upshifts in gene expression reveal potential transcriptional control regions, 841
indicated with red flags (23). 842
Figure 2. Induction of RED pigment by S. lividans is associated with absence of 843
bacillaene. B. subtilis spotted cross-wise with S. lividans inoculated 12 hours prior from 844
a spore suspension. Time zero corresponded to inoculation of B. subtilis. Initially, both 845
species formed round colonies. After 21 hours, the B. subtilis colonies begun to migrate 846
toward S. lividans. Upon contact with B. subtilis (36-72 hours) S. lividans induced 847
prodiginines (RED pigment), which are enhanced with extended incubation (90 hours). 848
No RED pigment is detected in the absence of colony contact in the time frame studied. 849
The images shown represent the results of multiple experiments done by duplicates. 850
Figure 3. Bacillaene production during liquid culture of B. subtilis NCIB 3610. Strain 851
PSK0212 (PksR-YFP) was cultured in CH medium (30°C), and sampled over 15 hours. 852
All quantitative data shown are average values with standard deviations from triplicate 853
experiments. (A) Growth curve of PSK0212 and HPLC quantitation of bacillaene. Equal 854
culture volumes were sampled for OD600 measurements (circles). Bacillaene extracted 855
from cell-free supernatants was quantitated by HPLC (triangles) (mAU 856
(そ=361nm)/OD600). Peak bacillaene accumulation per OD600 was detected at OD600 = 857
4.2. (B) Western blot (g-GFP) of PksR-YFP from B. subtilis cell lysates. A single PksR-858
YFP band (indicated with an arrow) was detected at low cell densities, and increased in 859
intensity to a maximal level observed between OD600 = 1.8 - 2.7. The signal intensity for 860
PksR-YFP decreased at higher cell density and lower molecular mass forms appeared, 861
suggesting degradation of PksR. (C) Upper panels- Fluorescence images of PksR-YFP 862
on January 30, 2018 by guesthttp://jb.asm
.org/D
ownloaded from

40
(green) in cells stained with TMA-DPH (red) to visualize membranes. Lower panels- 863
Phase contrast images of cells. PksR-YFP signal intensity and number changed with 864
cell density. Maximal intensity was observed at the end of log phase (OD600 = 1.8) and 865
was diminished at high cell density (OD600 = 6.4). Scale bar, 3 µM. (D) qRT-PCR of 866
representative pks genes. Cq values were determined for pksC, pksE and pksR and 867
normalized using Cq for gyrB. Fold-expression values reported are relative to the wild-868
type lowest cell density sample (OD600 = 0.2) for each data set. The maximal fold 869
expression for each transcript occurred at the OD600 = 1.8 time point. 870
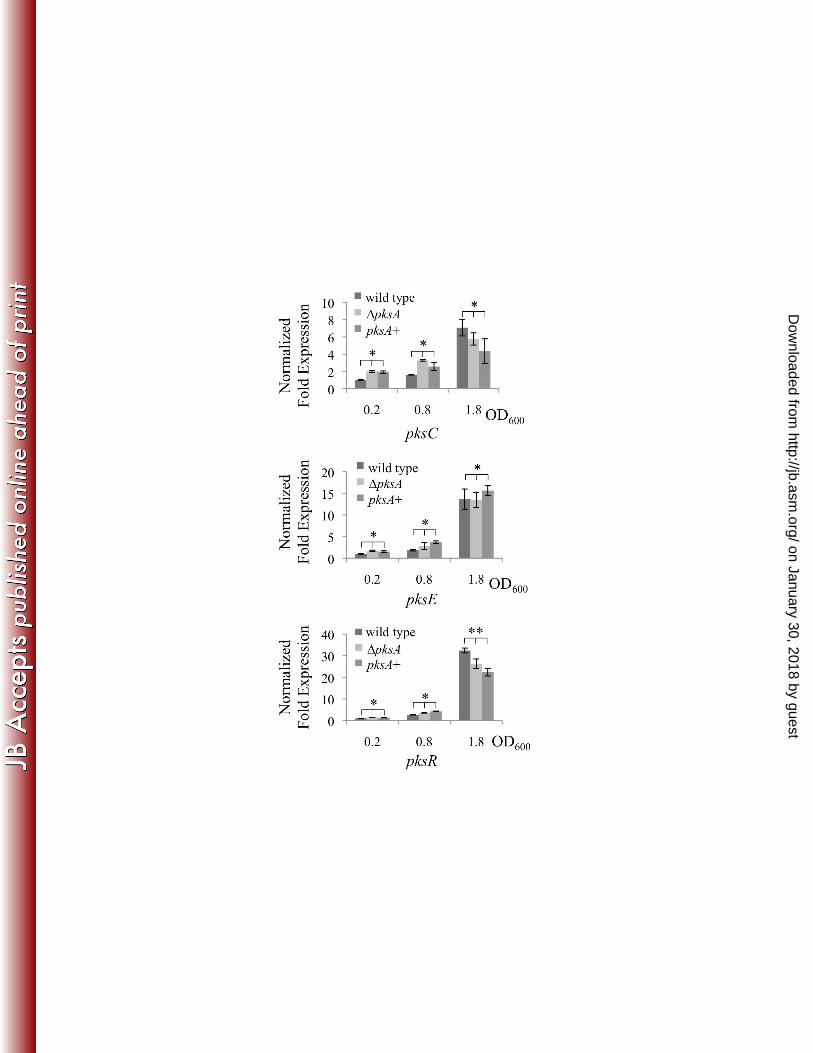
Figure 4. PksA function is unrelated to regulation of bacillaene synthesis. qRT-PCR 871
data are presented as described for Figure 3, panel D. The pksC, pksE, and pksR 872
transcripts measured by qRT-PCR were induced in wild type, ∆pksA and the ∆pksA 873
genetically complemented mutant (pksA+) strains. Comparison of low (0.2), mid (0.8) 874
and high (1.8) OD600 showed induction during growth. Two-factor analysis of variance 875
showed no significant effect of the ∆pksA and pksA+ genetic background on the pks 876
genes tested (*p-value > 0.05. **p-value >0.01). 877
Figure 5. Activity of promoters of the pks gene cluster. (A) Fluorescence of 878
transcriptional reporters for pksB, pksC and pksS promoters fused to yfp. Cells growing 879
in liquid CH medium at 37°C were taken at indicated culture densities to observe 880
activation of the promoters. Images represent several microscopic fields from samples 881
of two independent experiments. TMA-DPH-stained membranes - red. Promoter-yfp 882
fusions - green. Scale bar = 3 µm. (B) β-galactosidase assay of the PpksC-lacZ strain. 883
The pattern of β-galactosidase activity indicates the pksC promoter is activated during 884
on January 30, 2018 by guesthttp://jb.asm
.org/D
ownloaded from

41
the transition to stationary phase. Miller units are average from triplicate experiments 885
with reported standard deviation. (C) Co-culture of S. lividans and B. subtilis (PpksC-886
lacZ). G7 plates (300 µg/ml of X-gal) were inoculated with S. lividans and B. subtilis as 887
described in Fig. 2. PpksC-lacZ activity was differentially localized between spreading and 888
static cells in the colony. S. lividans endogenous β-galactosidase activity results in blue 889
colonies. Images represent three independent experiments, each time performed in 890
duplicates. 891
Figure 6. Regulatory pathways for pks gene expression. (A) Quantitative RT-PCR of 892
pksC in liquid cultures of strains: ∆spo0A, ∆abrB, ∆abh, ∆comA, ∆degU, ∆scoC and 893
∆codY. Results of qRT-PCR reported as described for Figure 3, panel D. Induction of 894
pksC expression is reduced in ∆spo0A, ∆comA, ∆degU and ∆codY strains. The ∆abrB 895
maintains pksC induction. Average values and standard deviation from triplicate 896
independent experiments are reported. (B) β-galactosidase assay of PpksC-lacZ activity 897
in the single mutants, ∆spo0A, ∆abrB, and the double mutant ∆spo0A ∆abrB. Cells were 898
cultured in liquid CH medium at 37°C and cellular equivalents compared from samples 899
taken at the indicated OD600. Deletion of abrB restored PpksC activation to the ∆spo0A 900
strain. Miller units are averaged from triplicate experiments with standard deviation 901
reported. 902
Figure 7. Activation of the pksC promoter coincides with activation of biofilm and spore 903
formation. Fluorescence imaging of pks activation (amyE::PpksC-yfp) with reporters for 904
motility (lacA::Phag-cfp), biofilm matrix production (lacA::PtapA-cfp) and sporulation 905
(lacA::PsspB-cfp). Cells were cultured in liquid CH medium at 37°C and monitored by 906
on January 30, 2018 by guesthttp://jb.asm
.org/D
ownloaded from

42
fluorescence microscopy over time. Images shown were taken at indicated culture 907
densities to observe activation of the relevant pathway reporters. Flagellum dependent 908
motile cells showed low signal intensity for PpksC-yfp. Cells active for matrix production 909
(PtapA-cfp) and spore formation (PsspB-cfp) activated PpksC-yfp. TMA-DPH-stained 910
membranes - red. Promoter-cfp fusions - blue. Promoter-yfp fusions - green. Scale bar 911
= 3 µm. 912
Figure 8. Differential pks genes expression of spreading and static cells of B. subtilis in 913
competition with Streptomyces lividans. B. subtilis and S. lividans co-cultures were 914
prepared as described in Fig.2. Following 36 hours of incubation, cells from the leading 915
edge and primary colony of B. subtilis were scraped from the agar and prepared for 916
fluorescence microscopy. (A) A reporter strain for pks activation (amyE::PpksC-yfp) and 917
flagellar expression (lacA::Phag-cfp). Low levels of PpksC-yfp activity were detected in the 918
spreading population, while PpksC-yfp activity was elevated in B. subtilis cells from the 919
primary colony. The spreading populations had a subpopulation of cells with high levels 920
of Phag-cfp activity that were negative for PpksC-yfp activity. (B) A reporter strain for 921
pks activation (amyE::PpksC-yfp) and extracellular matrix (lacA::PtapA-cfp). Lower levels of 922
PpksC-yfp activity were also detected in the spreading population, compared to the 923
primary colony. Expression of the pks genes occurred broadly into the population and 924
not exclusively into the subpopulation of producers of extracellular matrix. TMA-DPH-925
stained membranes - red. Promoter-cfp fusions - blue. Promoter-yfp fusions - green. 926
Scale bar = 3 µm. 927
928
on January 30, 2018 by guesthttp://jb.asm
.org/D
ownloaded from

43
Tables 929
Table 1. Bacillus subtilis strains used in this study 930
Strain Relevant Genotype Source
PSK0531 Streptomyces lividans wildtype strain TK24 Laboratory collection
PDS0066 NCIB3610 Wild-type Laboratory collection
PKS0212 NCIB3610 pksR:yfp spec (7)
PDS0184 NCIB3610 pksA::Kn This study
PDS0480 NCIB3610 pksA::Kn lacA::pksA (mls) This study
PDS0183 NCIB3610 ∆pksA amyE::Phyperspac:pksA:lacI
(cat)
This study
PDS0032 NCIB3610 amyE:: PpksB-yfp (cat) This study
PDS0036 NCIB3610 amyE:: PpksC-yfp (cat) This study
PDS0035 NCIB3610 amyE:: PpksS-yfp (cat) This study
PDS0189 NCIB3610 amyE:: PpksB-lacZ (cat) This study
PDS0227 NCIB3610 amyE:: PpksC-lacZ (cat) This study
PDS0201 NCIB3610 amyE:: PpksS-lacZ (cat) This study
on January 30, 2018 by guesthttp://jb.asm
.org/D
ownloaded from

44
PDS0430 NCIB3610 amyE::PpksC-yfp (cat) lacA::Phag-cfp
(mls)
This study
PDS0432 NCIB3610 amyE::PpksC-yfp (cat) lacA::PtapA-cfp
(mls)
This study
PDS0431 NCIB3610 amyE::PpksC-yfp (cat) lacA::PsspB-cfp
(mls)
This study
PDS0327 NCIB3610 ∆spo0A::mls This study
PDS0382 NCIB3610 ∆degU::tet Kolter lab
PDS0247 NCIB3610 ∆abrB::tet Kolter lab
PDS0262 NCIB3610 ∆abh::km Kolter lab
PDS0512 NCIB3610 ∆comA::cat This study
PDS0368 NCIB3610 ∆scoC::km This study
PDS0525 NCIB3610 ∆codY::mls This study
PDS0337 NCIB3610 ∆sigD::mls Kearns Lab
PDS0311 NCIB3610 ∆spo0A::mls ∆abrB::tet amyE::
PpksC:lacZ (cat)
This study
931
on January 30, 2018 by guesthttp://jb.asm
.org/D
ownloaded from

45
Table 2. Primers used in this study 932
Name Sequence (5’-3’)
pksA KO_P1 gatggccgcgataaaagtaa
pksA KO_P2 cctatcacctcaaatggttcgctgcgttgcttctgcaatttgtt
pksA KO_P3 cgagcgcctacgaggaatttgtatcggcgtggaagatacacgtgag
pksA KO_P4 aacaccttctatgtaatcattttcg
pksA compl-F atgcatgctagcatctcgagaacccaaaacgcaatttcac
pksA compl-R aacgtcccggggagctcatgaattccaagaatcgcttttcgcac
pksA-90_FHIII taaagcttaatccattcccctcttttc
pksA-90_RSalI ttaagtcgaccaacaagaatcgcttt
pA-F(EcoRI) ttagaattcataagcgatcgatatacc
pA-R(HindIII) taggaagcttagctttattgtaacaagaaa
pB-F(EcoRI) ctagaattcctgagagactttacgc
pB-R(HindIII) attcaagcttatcatgtaaagttcttaaac
pC-F(EcoRI) ttagaattcccattcgataaaggat
pC-R(HindIII) tatgaagcttgattagtagatgtgtttcac
pS-F(EcoRI) aatgaattcgcgctaatagggtaaataga
pS-R(HindIII) tataaagcttgctatacgcagtacgaatc
on January 30, 2018 by guesthttp://jb.asm
.org/D
ownloaded from
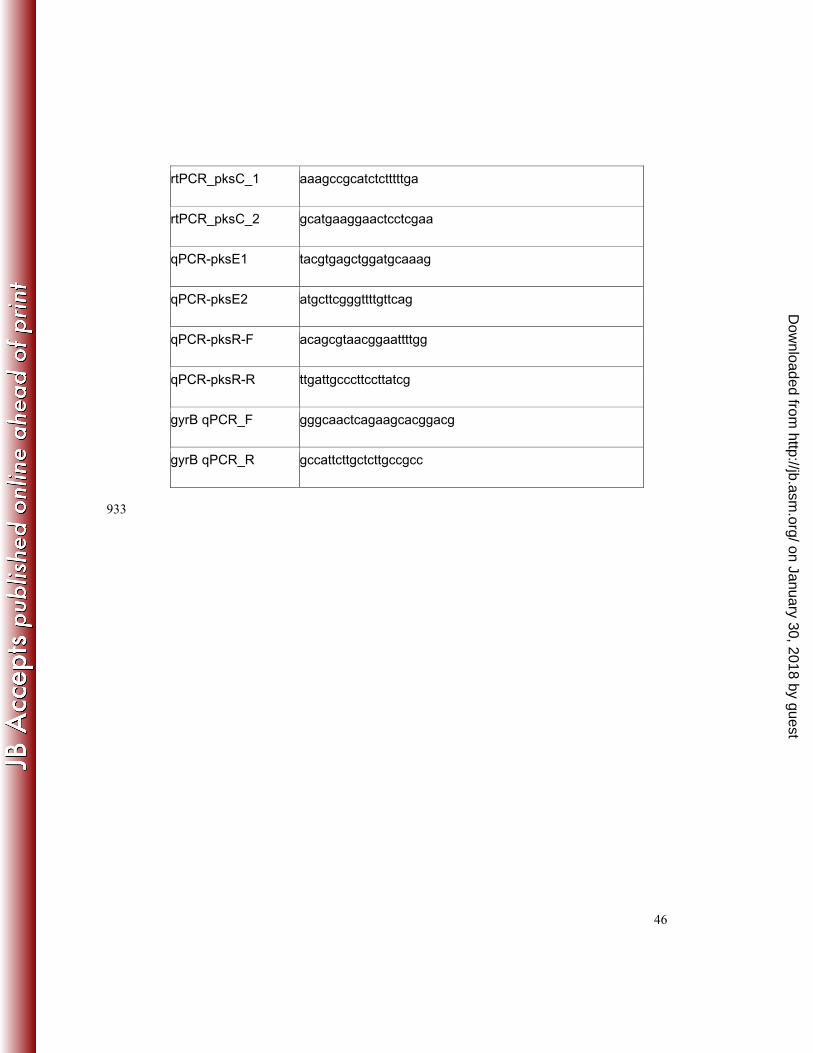
46
rtPCR_pksC_1 aaagccgcatctctttttga
rtPCR_pksC_2 gcatgaaggaactcctcgaa
qPCR-pksE1 tacgtgagctggatgcaaag
qPCR-pksE2 atgcttcgggttttgttcag
qPCR-pksR-F acagcgtaacggaattttgg
qPCR-pksR-R ttgattgcccttccttatcg
gyrB qPCR_F gggcaactcagaagcacggacg
gyrB qPCR_R gccattcttgctcttgccgcc
933
on January 30, 2018 by guesthttp://jb.asm
.org/D
ownloaded from