Communicating Benefits Outside Your Generational Comfort Zone ISCEBS Webinar August 21, 2008.

The opinions expressed in this presentation are those of the speaker. The International Society and International Foundation disclaims responsibility for views expressed and statements made by the program speakers.
Are Employee Benefits Forever?
Ron Leopold, M.D.Senior Vice President, National Practice Leader, Health and ProductivityWells Fargo Insurance Services USAAtlanta, Georgia
1-1

The Benefits Equation
Attraction, retention and productivity
1-2

Why do we have benefits in the first place?
1-3

The employee benefits value equation
•Benefits Package•Work-Life Solutions
ATTRACT TALENT
•Employee Loyalty•Benefits Satisfaction
RETAIN EMPLOYEES
•Employee Engagement•Better Health
DRIVE PRODUCTIVITY
VALUE
1-4

Drivers of Healthcare Costs
Utilization, technology and inflation
1-5

One chart tells the storyCumulative Increases in Health Insurance Premiums, Workers’ Contributions to Premiums, Inflation, and Workers’ Earnings, 1999-2012
38%
109%
172%
38%
113%
180%
11%29%
47%
8%24%
38%
0%
20%
40%
60%
80%
100%
120%
140%
160%
180%
200%
1999 2000 2001 2002 2003 2004 2005 2006 2007 2008 2009 2010 2011 2012
Health Insurance PremiumsWorkers' Contribution to PremiumsWorkers' EarningsOverall Inflation
Source: Kaiser/HRET Survey of Employer-Sponsored Health Benefits, 1999-2012. Bureau of Labor Statistics, Consumer Price Index, U.S. City Average of Annual Inflation (April to April), 1999-2012; Bureau of Labor Statistics, Seasonally Adjusted Data from the Current Employment Statistics Survey, 1999-2012 (April to April), accessed on January 28, 2013, available at http://ehbs.kff.org.
1-6

Seven factors driving U.S. health care costs
Source: What is driving U.S. Health care Spending?, Bipartisan Policy Center, September 2012.
Cost Drivers
We pay providers in ways that reward doing more, rather than being efficient.
We’re growing older, sicker and more obese.
We want new drugs, technologies, services and procedures.
We get tax breaks on buying health insurance, and the cost to patients of seeking care is often low.
We don’t have enough information on medical care cost and quality.
Hospitals/providers are increasingly gaining market share and are better able to demand higher prices.
We have medico-legal issues that complicate efforts to slow spending.
1-7
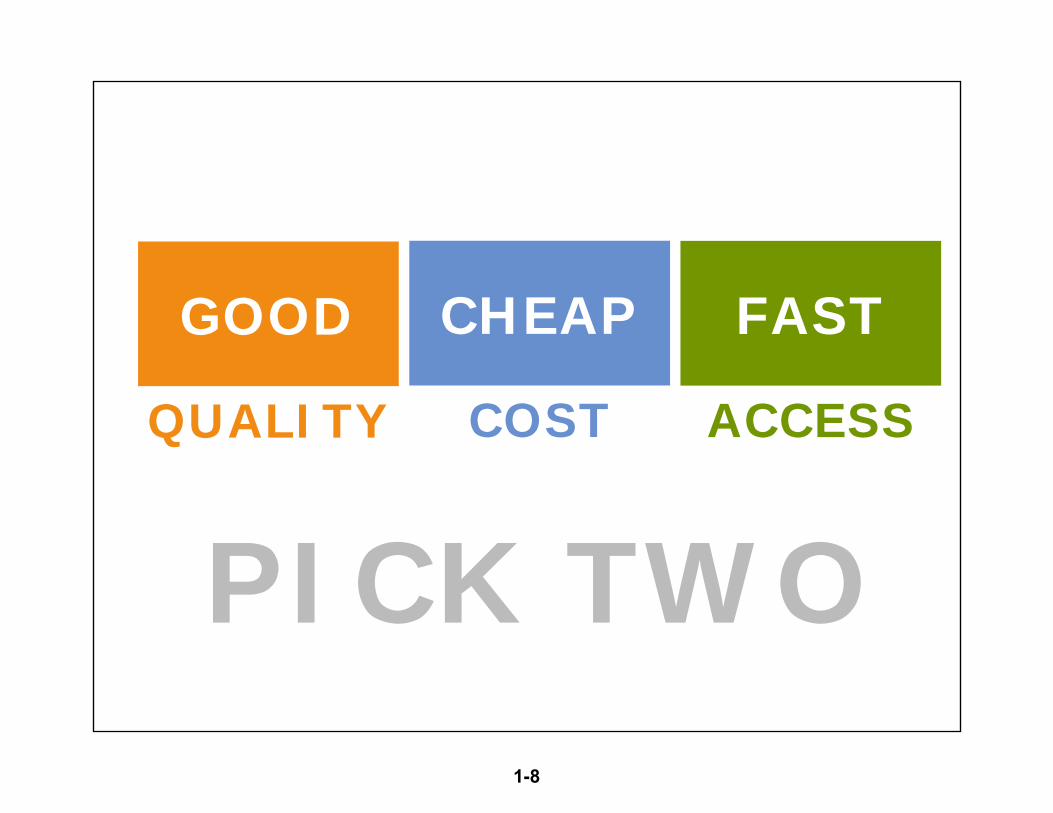
PICK TWO
HealthQUALITY
HealthCOST
HealthACCESS
GOOD CHEAP FAST
1-8

Shifting cost, risk and responsibility to employees
The Healthcare Reform Squeeze
1-9
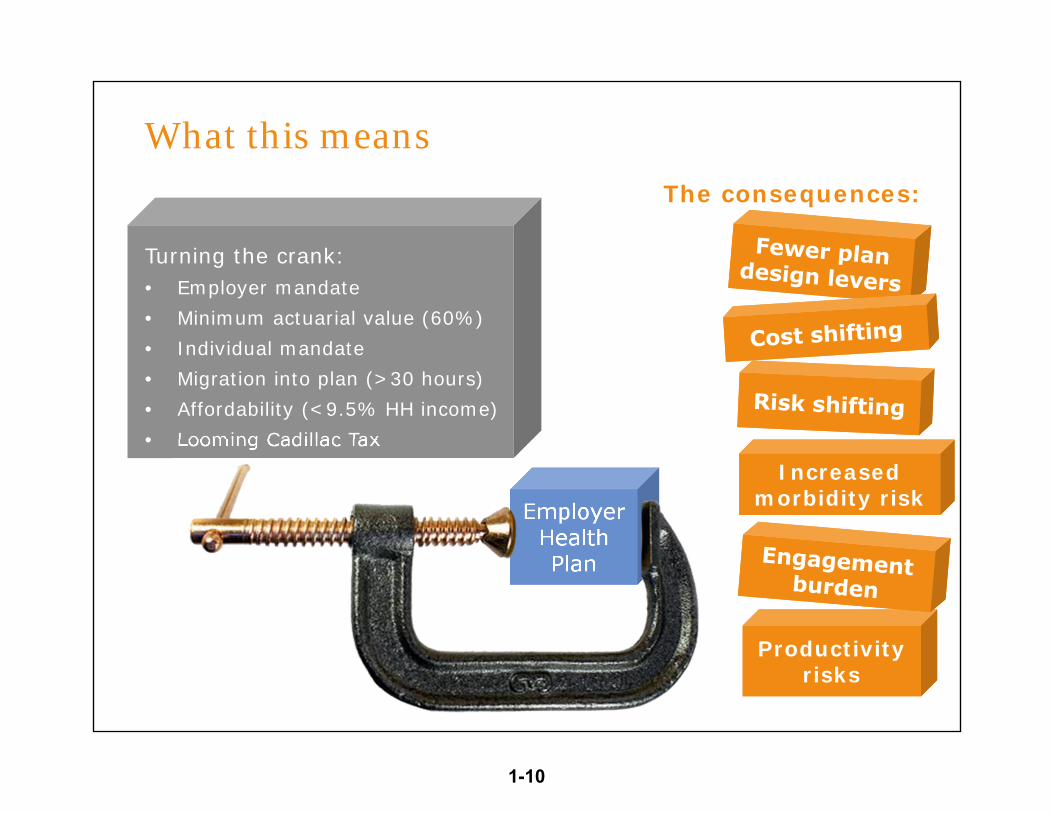
Turning the crank:• Employer mandate• Minimum actuarial value (60%)• Individual mandate• Migration into plan (>30 hours)• Affordability (<9.5% HH income)• Looming Cadillac Tax
Employer Health Plan
Employer Health Plan
Productivity risks
Productivity risks
The consequences:
Increased morbidity risk
Increased morbidity risk
What this means
1-10

Population health solutions
Health costs and risks
1-11

0% 0% 0% 1% 2% 3%5%
8%
16%
65%
0%
10%
20%
30%
40%
50%
60%
70%
1 2 3 4 5 6 7 8 9 1010% 20% 30% 40% 50% 60% 70% 80% 90% 100%
Percent of Population
Perc
ent
of T
otal
hea
lthca
re S
pend
ing
Source: 2009 Medical Expenditure Panel Survey
50% of the people account for only 3% of the costs
80% of the people account for 20% of the costs
Population health management: Costs
And 20% of the people
drive 80% of the cost
1-12

0% 0% 0% 1% 2% 3%5%
8%
16%
65%
0%
10%
20%
30%
40%
50%
60%
70%
1 2 3 4 5 6 7 8 9 1010% 20% 30% 40% 50% 60% 70% 80% 90% 100%
Percent of Population
Perc
ent
of T
otal
hea
lthca
re S
pend
ing
Low Risk
Moderate Risk
HighRisk
Acute Condition
Chronic Condition
Catastrophic Illness
Population health management: Risks
1-13

0% 0% 0% 1% 2% 3%5%
8%
16%
65%
0%
10%
20%
30%
40%
50%
60%
70%
1 2 3 4 5 6 7 8 9 1010% 20% 30% 40% 50% 60% 70% 80% 90% 100%
Percent of Population
Perc
ent
of T
otal
hea
lthca
re S
pend
ing
Population health management: Risks
Lifestyle Behavior Education Access Coordination Redirection
WELLNESS(Improve Health)WELLNESS
(Improve Health)CLINICAL(Reduce Cost)CLINICAL(Reduce Cost)
1-14

What are your benefits business
objectives?
What does your health care cost
trend looked like?
What is your company size?
How are your people
distributed geographically?
What is your culture around
providing benefits?
How comfortable are
you with carrots or
sticks?
What industry are you in?
What part(s) of the country are
you in?
What is your age/gender distribution?
What is your average tenure?
How comfortable are
your people with
technology?
How is HCR impacting your plan design?
Are you moving to HDHP with
HSR/HRA?
How focused are you on lost productivity?
What does your data show us?
What is your appetite for
change?
Considerations
1-15

Plan Design
Leverage Carriers
Building Incentives
Corporate Culture
Onsite Solutions
Offsite Solutions
Virtual Solutions
Solutions: There are many dimensions
1-16

Recognizing the relationship
Health and Productivity
1-17

What is the business value of a healthy working population?
1-18

The employee benefits value equation
•Benefits Package•Work-Life Solutions
ATTRACTTALENT
•Employee Loyalty•Benefits Satisfaction
RETAIN EMPLOYEES
•Employee Engagement•Better Health
DRIVE PRODUCTIVITY
VALUE
1-19

WFI Health and Productivity ConsultingKey Insights
Business Value
There is a business value to a healthier working population.
Direct and
Indirect Costs
Health issues drive both absenteeism
and presenteeism.
Pareto Principle
The 10% of a working population who submit an STD claim each year, drive in excess of 50% of the health care costs of that population.
Cost of Time
There is a time value involved in all health care
interactions that impact an employee’s productivity.
1-20

Health cost estimates for person with conditionAnnual costs: Top 10 health conditions
$0 $50 $100 $150 $200 $250 $300
Hypertension
Other Chronic Pain
Other Cancer
Allergy
GE Reflux
Anxiety
Back / Neck
Arthritis
Obesity
Depression
Thousands
Medical
Pharmacy
Note: Average total cost for an individual with the condition
Source: Loeppke, R., JOEM, 2009
1-21

$0 $50 $100 $150 $200 $250 $300
Hypertension
Other Chronic Pain
Other Cancer
Allergy
GE Reflux
Anxiety
Back / Neck
Arthritis
Obesity
Depression
Thousands
Medical
Pharmacy
Absenteeism
Presenteeism
Health cost estimates for person with condition Annual costs: Top 10 health conditions
Note: Average total cost for an individual with the condition
Source: Loeppke, R., JOEM, 2009
1-22

Lost health and productivityPoor health costs employers $576 billion a year
$117
$232
$227
Wage Replacement
Medical and Pharmacy
Lost Productivity
Note: Aggregate Estimates Using IBI Full Cost Estimator.
Source: Integrated Benefits Institute, 2012
1-23

Full cost of poor health to employers
Note: Average total cost estimates
Source: Loeppke, R., Taitel M, Haufle V, Parry T, Kessler RC, Jinnett K, “Health and Productivity as a Business Strategy: A Multi-Employer Study,” Journal of Occupational Environmental Medicine, 2009, 51(4):411-428, pp. 140-152.Source: Kaiser Permanente, 2009
Indirect Costs:
Presenteeism• Working slow• Lower quality• Customer
dissatisfaction
Absenteeism• Overtime• Turnover• Temporary
staffing• Replacement
training• Workload shifts
Direct costs:• Medical care• Pharmacy costs• STD• LTD
70%Indirect health and productivity costs
30%Direct health and productivity costs
1-24

Employee attraction and retention.
Competing for Talent
1-25

Employee benefits drive employee loyalty
Employees who are very satisfied with their benefits
Employees who are very dissatisfied with their benefits
I feel a very strong senseof loyalty to my employer 61% 24%
My employer has a very strong sense of loyalty to me
48% 12%
Satisfaction with employee benefits is an important driver of employee loyalty.
Source: MetLife 10th Annual Employee Benefit Trends Study, 2012
1-26

Employee benefits drive employee loyalty
0%
10%
20%
30%
40%
50%
60%
70%
80%
Employees
Employers
The following is a “very important” contributor of employee loyalty:
Employee benefits rank high as a contributor of employee loyalty.
Source: MetLife 10th Annual Employee Benefit Trends Study, 2012
Voluntary benefits
Company culture
Ancillary benefits
Advancement opportunities
Retirement benefits
Health benefits
Salary and wages
1-27

New things to watch for
Eight Trends that will Impact Employee Benefits
1-28

She’s gonna blow!Health care costs, Social Security, Medicare
Pow?
When Social Security was conceived, a 65-year-old was, on average, expected to live another 5 years.
Paging Willard Scott…
Pow?
When Social Security was conceived, a 65-year-old was, on average, expected to live another 5 years.
Paging Willard Scott…
Boom!Legions of baby boomers will enter an already bloated Medicare system every day.
Add in expensive, life-extending medical technologies.
Stir.
Boom!Legions of baby boomers will enter an already bloated Medicare system every day.
Add in expensive, life-extending medical technologies.
Stir.
Wow!
Health care costs have been running 2-3x inflation for nearly two decades.
Wow!
Health care costs have been running 2-3x inflation for nearly two decades.
8
1-29

75 is the new 65For boomers. For every generation, thereafter.
SEEINGAND HEARING THINGS BETTER
SEEINGAND HEARING THINGS BETTER
How prepared are you for retirement?How about your sister and brother-in-law?
What’s your personal plan?
How can your employer make life easier for you in the future?
How prepared are you for retirement?How about your sister and brother-in-law?
What’s your personal plan?
How can your employer make life easier for you in the future?
Delayed retirementDelayed retirement
7
1-30

It’s a mad, mad, defined contribution worldThe shift from DB to DC is accelerating
We can do this now
Better tools to select and administer benefits will become more widespread.
Employees will become more accustomed to choosing things this way. They will prefer it.
We can do this now
Better tools to select and administer benefits will become more widespread.
Employees will become more accustomed to choosing things this way. They will prefer it.
People like youAs working populations diversify, people will want and need different things.
People like youAs working populations diversify, people will want and need different things.
Containing risk exposureDefined contribution worked in retirement because it contained employer financial liability. This will be equally attractive for health benefits. ACA rules will accelerate this imperative.
Containing risk exposureDefined contribution worked in retirement because it contained employer financial liability. This will be equally attractive for health benefits. ACA rules will accelerate this imperative.
6
1-31

Think population healthMatching intervention to level of risk
The healthcare reform squeeze:
Employers will need smarter deployment of tactics to bend the healthcare cost curve. This is about getting the right intervention to the right place at the right time.
This is also about maximizing value for finite resources available.
The healthcare reform squeeze:
Employers will need smarter deployment of tactics to bend the healthcare cost curve. This is about getting the right intervention to the right place at the right time.
This is also about maximizing value for finite resources available.
This is more than plan design.
This is more than creating the right incentives.
This is so much more than wellness.
This is using what you have and what you know to accomplish what you want.
This is more than plan design.
This is more than creating the right incentives.
This is so much more than wellness.
This is using what you have and what you know to accomplish what you want.
Cost Strategy.Risk Strategy.Cost Strategy.Risk Strategy.
5
1-32
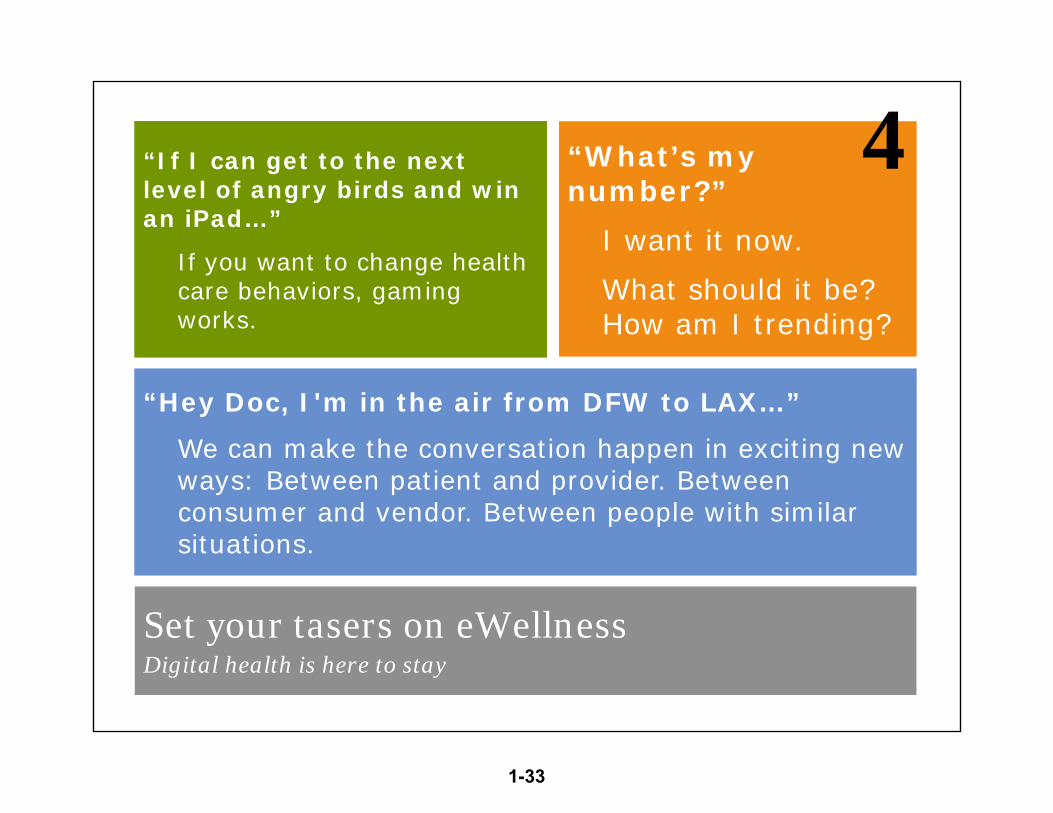
Set your tasers on eWellnessDigital health is here to stay
“If I can get to the next level of angry birds and win an iPad…”
If you want to change health care behaviors, gaming works.
“If I can get to the next level of angry birds and win an iPad…”
If you want to change health care behaviors, gaming works.
“What’s my number?”
I want it now.
What should it be? How am I trending?
“What’s my number?”
I want it now.
What should it be? How am I trending?
“Hey Doc, I'm in the air from DFW to LAX…”
We can make the conversation happen in exciting new ways: Between patient and provider. Between consumer and vendor. Between people with similar situations.
“Hey Doc, I'm in the air from DFW to LAX…”
We can make the conversation happen in exciting new ways: Between patient and provider. Between consumer and vendor. Between people with similar situations.
4
1-33

Meet George JetsonIt’s all about interactivity and mobility
Because it’s often
better and smarter.
Because it’s often
better and smarter.
Generation Y wants it; Generation Z will expect it:
Hunter and Ashley (Generation Y) changed the rules.
Prepare for Skylar and Madison (Generation Click) who couldn’t imagine having it any other way.
Generation Y wants it; Generation Z will expect it:
Hunter and Ashley (Generation Y) changed the rules.
Prepare for Skylar and Madison (Generation Click) who couldn’t imagine having it any other way.
Yesterday’s future is here todayThings are moving crazy fast. This isn’t a fad. How we select benefits, submit a claim, check a balance, change coverage and interact with benefits service is becoming increasingly device-centric.
Yesterday’s future is here todayThings are moving crazy fast. This isn’t a fad. How we select benefits, submit a claim, check a balance, change coverage and interact with benefits service is becoming increasingly device-centric.
3
1-34

Even if they got out of the health care business…
…employers will never be out of the productivity
business.
…employers will never be out of the productivity
business.
Going beyond lost productivity mitigation:
New focus on energy, resiliency, mental wellness and fulfillment.
Going beyond lost productivity mitigation:
New focus on energy, resiliency, mental wellness and fulfillment.
Absence is a window into health care cost
Who’s missing work and why? Short-term disability, FML and casual absence tell employers a powerful story.
Absence is a window into health care cost
Who’s missing work and why? Short-term disability, FML and casual absence tell employers a powerful story.
2
1-35

Not everything that matters can be measured.
Not everything that can be measured matters!
Not everything that can be measured matters!
RETURN ON INVESTMENT
It’s easy to define the INVESTMENT.
The tough part is determining how to assess the RETURN.
We are addicted to our data.
We are addicted to our data.
1
1-36

Why do we have benefits in the first place?
Are Benefits Forever?
1-37

The business value of employee benefits
As long as people depend on businesses, and businesses depend on people.
As long as businesses compete for talent.
As long as companies can move the needle on worker productivity with programs, services and coverages.
Even if we were to move to a nationalized, single payer solution.
Yes
Yes
Yes
Yes
1-38