
1,* and Mark Howells 1,2
17
climate Article Excess Mortality in England during the 2019 Summer Heatwaves Natasha Rustemeyer 1, * and Mark Howells 1,2 Citation: Rustemeyer, N.; Howells, M. Excess Mortality in England during the 2019 Summer Heatwaves. Climate 2021, 9, 14. https://doi.org/ 10.3390/cli9010014 Received: 11 December 2020 Accepted: 10 January 2021 Published: 14 January 2021 Publisher’s Note: MDPI stays neu- tral with regard to jurisdictional clai- ms in published maps and institutio- nal affiliations. Copyright: © 2021 by the authors. Li- censee MDPI, Basel, Switzerland. This article is an open access article distributed under the terms and con- ditions of the Creative Commons At- tribution (CC BY) license (https:// creativecommons.org/licenses/by/ 4.0/). 1 Department of Geography, Loughborough University, Loughborough, Leicestershire LE11 3TU, UK; [email protected] or [email protected] 2 Center for Environmental Policy, Imperial College London, London SW7 2AZ, UK * Correspondence: [email protected] or [email protected] Abstract: There is increasing evidence that rising temperatures and heatwaves in the United Kingdom are associated with an increase in heat-related mortality. However, the Public Health England (PHE) Heatwave mortality monitoring reports, which use provisional death registrations to estimate heat- related mortality in England during heatwaves, have not yet been evaluated. This study aims to retrospectively quantify the impact of heatwaves on mortality during the 2019 summer period using daily death occurrences. Second, using the same method, it quantifies the heat-related mortality for the 2018 and 2017 heatwave periods. Last, it compares the results to the estimated excess deaths for the same period in the PHE Heatwave mortality monitoring reports. The number of cumulative excess deaths during the summer 2019 heatwaves were minimal (161) and were substantially lower than during the summer 2018 heatwaves (1700 deaths) and summer 2017 heatwaves (1489 deaths). All findings were at variance with the PHE Heatwave mortality monitoring reports which estimated cumulative excess deaths to be 892, 863 and 778 during the heatwave periods of 2019, 2018 and 2017, respectively. Issues are identified in the use of provisional death registrations for mortality monitoring and the reduced reliability of the Office for National Statistics (ONS) daily death occurrences database before 2019. These findings may identify more reliable ways to monitor heat mortality during heatwaves in the future. Keywords: temperature; mortality; heatwave; epidemiology 1. Introduction Record-breaking extremes over the last century are five-times higher than expected [1] and are driven by anthropogenic, greenhouse gas emissions [2]. So far, the global climate has warmed by around 1 ◦ C since pre-industrial conditions, and the Intergovernmental Panel on Climate Change’s high-emission scenario projects an average increase in global mean surface temperature between 2.6 ◦ C and 4.8 ◦ C by 2100 relative to 1986–2005 [3,4]. The Paris Agreement aims to limit the temperature increase to 1.5 ◦ C[5], however, two- thirds of the “allowable” cumulative carbon dioxide emissions to stay below the 2 ◦ C target have already been used [6,7]. In addition, there is a high probability that the planet is already committed to average warmings over land exceeding 1.5 ◦ C[8]. Warming rates over land will be higher than warming rates over oceans [8], which will expose human populations to higher heat stress than the average global temperature rise suggests [9]. Global [10,11] and European heatwaves are projected to increase [12,13]. One-third of the world’s population is currently exposed to heat stress [14]. The impact of this on the European population will be greater than any other weather-related hazard exacerbated by climate change [15]. An increased frequency of temperatures exceeding 35 ◦ C in the southeast and 30 ◦ C in the north of England [16] are expected. Days above 40 ◦ C currently have a return time of 100–300 years, however, this could decline to a return time of 3.5 years by 2100 if greenhouse gas emissions are not reduced [17]. Anthropogenic causes are central [18,19], making the record-breaking summer temperatures of 2018 around 30-times Climate 2021, 9, 14. https://doi.org/10.3390/cli9010014 https://www.mdpi.com/journal/climate
Transcript of 1,* and Mark Howells 1,2

climate
Article
Excess Mortality in England during the 2019 Summer Heatwaves
Natasha Rustemeyer 1,* and Mark Howells 1,2
�����������������
Citation: Rustemeyer, N.; Howells,
M. Excess Mortality in England
during the 2019 Summer Heatwaves.
Climate 2021, 9, 14. https://doi.org/
10.3390/cli9010014
Received: 11 December 2020
Accepted: 10 January 2021
Published: 14 January 2021
Publisher’s Note: MDPI stays neu-
tral with regard to jurisdictional clai-
ms in published maps and institutio-
nal affiliations.
Copyright: © 2021 by the authors. Li-
censee MDPI, Basel, Switzerland.
This article is an open access article
distributed under the terms and con-
ditions of the Creative Commons At-
tribution (CC BY) license (https://
creativecommons.org/licenses/by/
4.0/).
1 Department of Geography, Loughborough University, Loughborough, Leicestershire LE11 3TU, UK;[email protected] or [email protected]
2 Center for Environmental Policy, Imperial College London, London SW7 2AZ, UK* Correspondence: [email protected] or [email protected]
Abstract: There is increasing evidence that rising temperatures and heatwaves in the United Kingdomare associated with an increase in heat-related mortality. However, the Public Health England (PHE)Heatwave mortality monitoring reports, which use provisional death registrations to estimate heat-related mortality in England during heatwaves, have not yet been evaluated. This study aims toretrospectively quantify the impact of heatwaves on mortality during the 2019 summer period usingdaily death occurrences. Second, using the same method, it quantifies the heat-related mortality forthe 2018 and 2017 heatwave periods. Last, it compares the results to the estimated excess deathsfor the same period in the PHE Heatwave mortality monitoring reports. The number of cumulativeexcess deaths during the summer 2019 heatwaves were minimal (161) and were substantially lowerthan during the summer 2018 heatwaves (1700 deaths) and summer 2017 heatwaves (1489 deaths).All findings were at variance with the PHE Heatwave mortality monitoring reports which estimatedcumulative excess deaths to be 892, 863 and 778 during the heatwave periods of 2019, 2018 and 2017,respectively. Issues are identified in the use of provisional death registrations for mortality monitoringand the reduced reliability of the Office for National Statistics (ONS) daily death occurrences databasebefore 2019. These findings may identify more reliable ways to monitor heat mortality duringheatwaves in the future.
Keywords: temperature; mortality; heatwave; epidemiology
1. Introduction
Record-breaking extremes over the last century are five-times higher than expected [1]and are driven by anthropogenic, greenhouse gas emissions [2]. So far, the global climatehas warmed by around 1 ◦C since pre-industrial conditions, and the IntergovernmentalPanel on Climate Change’s high-emission scenario projects an average increase in globalmean surface temperature between 2.6 ◦C and 4.8 ◦C by 2100 relative to 1986–2005 [3,4].The Paris Agreement aims to limit the temperature increase to 1.5 ◦C [5], however, two-thirds of the “allowable” cumulative carbon dioxide emissions to stay below the 2 ◦C targethave already been used [6,7]. In addition, there is a high probability that the planet isalready committed to average warmings over land exceeding 1.5 ◦C [8]. Warming ratesover land will be higher than warming rates over oceans [8], which will expose humanpopulations to higher heat stress than the average global temperature rise suggests [9].
Global [10,11] and European heatwaves are projected to increase [12,13]. One-third ofthe world’s population is currently exposed to heat stress [14]. The impact of this on theEuropean population will be greater than any other weather-related hazard exacerbatedby climate change [15]. An increased frequency of temperatures exceeding 35 ◦C in thesoutheast and 30 ◦C in the north of England [16] are expected. Days above 40 ◦C currentlyhave a return time of 100–300 years, however, this could decline to a return time of 3.5 yearsby 2100 if greenhouse gas emissions are not reduced [17]. Anthropogenic causes arecentral [18,19], making the record-breaking summer temperatures of 2018 around 30-times
Climate 2021, 9, 14. https://doi.org/10.3390/cli9010014 https://www.mdpi.com/journal/climate

Climate 2021, 9, 14 2 of 17
more likely [20]. Whilst the UK’s maritime climate is self-regulating, hot extremes are morefrequent and intense in the UK [21].
The summer of 2019 was the Northern Hemisphere’s warmest meteorological summersince records began in 1880, tied with 2016 [22]. Heatwaves peaked over northern andcentral Europe [9]. In the UK, a new all-time record, measured at Cambridge UniversityBotanic Garden on 25 July (38.7 ◦C), occurred during one of the three heatwaves thatyear from 28 to 30 June, 21 to 28 July and 23 to 29 August 2019 [23]. Again, these arelinked to climate change [24]. Atmospheric ‘blocking events’ [8] are potentially due to theslowing down of midlatitude summer circulation [8]. In 2019, these events induced intenseadvections of hot air from Northern Africa to Europe [24]. These resulted in high daytimeheat loads and heatwave conditions in the UK [24], though other mechanisms have beenproposed [25].
Health impacts are predicted to increase with heatwaves [26,27]. Thousands of peoplehave died in the recent UK heatwaves [28,29]. Unlike cold weather, the rise in mortalitycaused by warm weather occurs rapidly [30]. As a result, there are relatively more impactsoccurring during the first 1 to 2 days [31,32]. Heatwaves affect the health of those who arevulnerable [33]. Outcomes range from dehydration to death [26]. The highest vulnerabilityis in the elderly with pre-existing medical conditions, such as cardiovascular diseases andrespiratory illnesses [34], although children [35] and other age groups can be affected,particularly in hot countries [36].
Heat-related mortality occurs under environmental conditions where the human bodyis unable to maintain a stable core body temperature near 37 ◦C [37]. This core bodytemperature varies minimally between individuals and does not adapt to local climate [37].Critically, the human skin temperature must be regulated at 35 ◦C or below as the skinmust be cooler than body core for the effective conduction of metabolic heat to the skin [38].Sustained skin temperatures above 35 ◦C cause hyperthermia, which can be lethal if skintemperatures reach 37–38 ◦C [39]. This vulnerability is a function of humans’ upperphysiological limit to heat, which sets an upper limit to the adaptation levels of humans tofuture climate-change impacts [40].
In response to the 2003 European heatwaves which exceeded 70,000 deaths [41], theDepartment of Health in England set up the Heatwave Plan for England (HPE), which isupdated yearly to integrate learning from the previous summer [30]. It provides guidanceto the National Health Service (NHS) and local authorities [30]. HPE’s Heat-Health Watchalert system operates between 1 June and 15 September. The Met Office issues alerts whichcorrespond to the level of risk of a heatwave and trigger a range of short-term protectivemeasures [30,42]. Level 1 is the default setting, indicating that the preparedness programmeis in operation. Level 2 indicates that a heatwave has been forecasted, and an alert andreadiness status is set. Level 3 signifies that heatwave action has been activated. Finally,level 4 declares that an emergency response has been implemented [30].
The PHE Heatwave mortality monitoring report is based on the cumulative excessdeaths during a heatwave [23]. It uses data from the provisional figures on deaths registeredin England and Wales and is calculated using the upper 2 z-score threshold after correctingthe ONS data for reporting delays using the standardised EuroMOMO algorithm [43].The ONS data used in the PHE reports are broken down into age groups and regionalareas, which are only available from the weekly registered deaths database [44] and notthe daily death occurrence database [45]. The PHE report calculates heat-related mortalityby subtracting the expected deaths (based on a 5-year average) from the registered deathsusing temperature as a heat stress measure. Other studies have used a variety of heatstress measures, such as humidity, wind speed, atmospheric pressure and solar radiation.However, a single temperature measure continues to be the usual proxy for thermaldiscomfort [46–48].
As the impact of heat on mortality varies each year, an annual retrospective look atthe heat-mortality relationship is useful. Previous studies on excess mortality in the UKhave used death registration data from the ONS Quarterly Mortality database [28,29,32,49].

Climate 2021, 9, 14 3 of 17
However, between 2001–2018, the median time between death occurrence and registrationin England and Wales has increased from 2 to 5 days [50]. There has also been a sharprise from 8.7% to 14.5% in deaths registered 1 to 2 weeks late and a rise of 1.8% in deathregistered 2 to 3 weeks late [50]. These increasing delays in death registrations suggest thatthe use of death registrations as a source of death data is problematic. Despite this, thereare scant studies using daily death occurrences, even though they are recognised as beingmore reliable and can be related to other factors such as climate [51].
Historically, data on daily death occurrences from the ONS Quarterly Mortalitydatabase have been problematic because extraction has been fixed to ensure datasetshave a similar extraction date [51]. However, this meant that the data were frozen in timeand were too unreliable for use in studies. However, from April 2019, this statistical limita-tion was removed to ensure the data would be more up to date [51]. With this came thediscovery of the impact of fixing the extraction date on the mortality data, as the wholesaleupdate of daily death occurrences on the ONS Quarterly Mortality database (post-April–June 2019) revealed significant discrepancies. For instance, the death occurrence on 30 June2018 was changed from 1149 in the Quarterly Mortality database of Q3 2018 to 1230 in theQuarterly Mortality database of Q3 2019, a discrepancy of 81 deaths [48]. This has revealeda gap in the existing knowledge as an analysis of the heat-temperature relationship usingreliable daily death occurrence data has yet to be undertaken. In order to contribute tofilling this gap, this paper sought to evaluate the impact of the 2019 heatwaves on mortalityand compare this impact to the impact of the heatwaves of 2017 and 2018 on mortalityusing these hitherto unavailable data.
The need for this study is particularly pertinent, as a report evaluating the HeatwavePlan for England concluded:
“There is no evidence that general summertime relationships between temperatureand mortality . . . have changed substantially in the years since the introduction of the firstHWP in 2004.” [52] (p. 1).
This is problematic as the report did not evaluate the PHE Heatwave mortality moni-toring reports.
Equally, this study is timely for two other reasons. First, the last study into the impactof heatwaves on mortality focused on the 2013 heatwaves [28], even though 2017 and 2018were 2 of the hottest 10 years in the UK and collectively had 6 heatwave periods [17]. Thereason for that is likely to be that the PHE Mortality Monitoring report was commissionedto undertake this task. However, these reports have not yet been independently evaluated.Second, the significance of this paper is heightened due to the impact of COVID-19 onmortality rates. Both COVID-19 and heat-related mortality impact similar groups, suchas the elderly and those with cardiovascular and respiratory disease [53]. Thus, the dis-tinction between deaths attributable to heat and COVID-19 is likely to be problematic. Thecomplexity of the figure published for the 2020 PHE Heatwave mortality monitoring reportbears witness to this (Figure 1) [23]. In addition, the report uses a different methodology,making a retrospective analysis based on these data difficult (PHE 2020a).
An analysis of the heat-temperature relationship using the recently corrected dailydeath occurrence data from the ONS Quarterly Mortality has not yet been undertaken.To fill this gap, the objectives of this study are threefold. First, we aim to determine theexcess death attributable to the three heatwaves in 2019 relative to the 5-year average.Second, we aim to compare heat-mortality deaths during the 2019 summer period to thoseduring the heatwaves in 2017 and 2018. Third, we aim to compare the excess daily deathoccurrences found in this study to the excess registered deaths in the PHE Heatwavemortality monitoring reports of 2017, 2018 and 2019.

Climate 2021, 9, 14 4 of 17Climate 2021, 9, x FOR PEER REVIEW 18 of 18
Figure 1. All-cause excess mortality in 65+ years group during the 2020 summer period. The shaded areas highlight periods which meet the Heatwave Plan for England (PHE) heatwave criteria for estimating heatwave excess mortality [23].
An analysis of the heat-temperature relationship using the recently corrected daily death occurrence data from the ONS Quarterly Mortality has not yet been undertaken. To fill this gap, the objectives of this study are threefold. First, we aim to determine the excess death attributable to the three heatwaves in 2019 relative to the 5-year average. Second, we aim to compare heat-mortality deaths during the 2019 summer period to those during the heatwaves in 2017 and 2018. Third, we aim to compare the excess daily death occur-rences found in this study to the excess registered deaths in the PHE Heatwave mortality monitoring reports of 2017, 2018 and 2019.
2. Materials and Methods 2.1. Study Period
The definition of a study period corresponds with the definition used by the Heat-wave Plan of England [30]. Accordingly, the study period coincides with the period of summer preparedness and long-term planning, 1 June to 15 September, which coincides with the 4 hottest months. The study periods for the years 2017, 2018 and 2019 are ana-lysed.
2.2. Heatwave Definition The definition of a heatwave corresponds with the definition used by the Heatwave
Plan for England, which defines it as a period of days when: (a) The Met Office issue a Level 3 heatwave alert in any part of the country, or (b) the mean Central England Temperature (CET) is greater than 20 °C
Plus 1 day before and after the days identified through (a) and (b) above. The day before helps to include the impact linked to the initial increase in tempera-
ture, and the day after helps to capture the delay from temperature to impact on mortality [28].
2.3. Temperature Outdoor mean temperatures were used as an indicator of exposure as air condition-
ing in private homes is uncommon in the UK. Mean temperatures were used rather than maximum or minimum temperatures as they are a better predictor of mortality [48].
Figure 1. All-cause excess mortality in 65+ years group during the 2020 summer period. The shaded areas highlight periodswhich meet the Heatwave Plan for England (PHE) heatwave criteria for estimating heatwave excess mortality [23].
2. Materials and Methods2.1. Study Period
The definition of a study period corresponds with the definition used by the HeatwavePlan of England [30]. Accordingly, the study period coincides with the period of summerpreparedness and long-term planning, 1 June to 15 September, which coincides with the 4hottest months. The study periods for the years 2017, 2018 and 2019 are analysed.
2.2. Heatwave Definition
The definition of a heatwave corresponds with the definition used by the HeatwavePlan for England, which defines it as a period of days when:
(a) The Met Office issue a Level 3 heatwave alert in any part of the country, or(b) The mean Central England Temperature (CET) is greater than 20 ◦C
Plus 1 day before and after the days identified through (a) and (b) above.The day before helps to include the impact linked to the initial increase in temperature,
and the day after helps to capture the delay from temperature to impact on mortality [28].
2.3. Temperature
Outdoor mean temperatures were used as an indicator of exposure as air conditioningin private homes is uncommon in the UK. Mean temperatures were used rather thanmaximum or minimum temperatures as they are a better predictor of mortality [48].
The daily CET from 1 June to 15 September, for the years 2014 to 2019, were extractedfrom the CET daily series database [54]. The latter is the weighted mean temperaturederived from the mean of 3 observing stations (Lancashire, London and Bristol), whichcovers a roughly triangular area and is corrected for a small effect of urban warming [55].It is kept up to date by the Climate Data Monitoring section of the Hadley Centre, MetOffice.
2.4. Data Sources
The mortality data were extracted from the Quarter Mortality database of the ONSfor the daily occurrence deaths in England occurring from 1 June to 15 September for theperiod 2012 to 2019. These data were found in the Q2 and Q3 Quarterly Mortality 2012to 2019 database [48]. As found in the literature review, death occurrences were moredate-specific than death registrations for the purpose of relating the mortality data to other

Climate 2021, 9, 14 5 of 17
factors such as weather patterns [51]. All datasets exclude non-residents and deaths withan unknown day of death [51].
2.5. Generalised Additive Model
A generalised additive modelling approach was used to describe the relations in thetime-series data. We assumed that there was a Poisson distribution and used temperatureas the main independent variable. The same method was used to identify excess deaths foreach heatwave in 2017, 2018 and 2019.
To implement the additive hazard method, excess mortality was assessed as thenumber of death occurrences (‘observed mortality’) minus the expected mortality [28].Expected mortality represents the all-cause mortality of the general population based on theassumption that the heat-related mortality is negligible compared to the overall mortalityin the general population [56]. Thus, the expected mortality was found by calculating theaverage number of deaths on the same date over the previous 5 years [57].
The expected mortality was then used to find the excess mortality for each heatwavein 2017, 2018 and 2019. To do this, the number of death occurrences for each heatwave ineach year was treated as a Poisson variable. Next, the 95% confidence limits for the Poissonvariable were subtracted from the expected mortality to obtain confidence limits for theexcess mortality. Tables were then drawn up to display the findings and compare them tothe findings in the 2017, 2018 and 2019 PHE Heatwave mortality monitoring reports.
The generalised additive model is considered to be the most effective and applicablemodel to investigate the overall impact of environmental exposures, such as temperature,which vary over time [58,59]. It has also been used in other studies to calculate heat-relatedmortality in UK even though it points to correlation rather than causation [28,29,32,49]. It isrecognised that higher temperatures may not be the sole or direct cause of death, and otherstudies have traced the impact of covariates and confounders, such as humidity and windspeed, which contribute to heat stress. That said, this study focused on a single variable,replicating the model used by the PHE Heatwave mortality monitoring reports. Thus, themodel, whilst somewhat utilitarian, interprets excess mortality as the extra deaths beyondthe expected number for each day of a heatwave [60].
Tables were produced to compare the findings to the excess mortality given in the2017, 2018 and 2019 PHE Heatwave Mortality Monitoring reports.
2.6. Time-Series Graph
A time-series graph was plotted for 2019 showing the data for death occurrences fromall causes, expected deaths, the daily mean and the maximum CET over the study period.The 7-day moving average for the 2019 death occurrence data was also shown to smooththe data.
2.7. Excess Mortality Graphs for the Whole Summer Period
Graphs showing excess deaths across the summer periods for 2017 to 2019 were usedto identify the variability in temperatures across the study period. Excess deaths for theentire summer period for 2017, 2018 and 2019 were found using the same generalisedadditive model.
3. Results
The summer period of 2019 saw three heatwaves, with two defined by virtue of Level3 heatwave alerts issued by the Met Office and one heatwave defined from the mean CETwhen the CET was greater than 20 ◦C [17,28].
During the brief heatwave from 28 to 30 June, a peak mean CET of 30.6 ◦C wasobserved on 29 June 2019 (Figure 2). Following the additive hazard model, excess mortalitywas estimated by subtracting expected mortality from observed mortality. The total numberof deaths for the 3-day period was below the 5-year average for 2014 to 2018. Thus,there were no excess deaths during this period (95% confidence interval (CI) −508 to
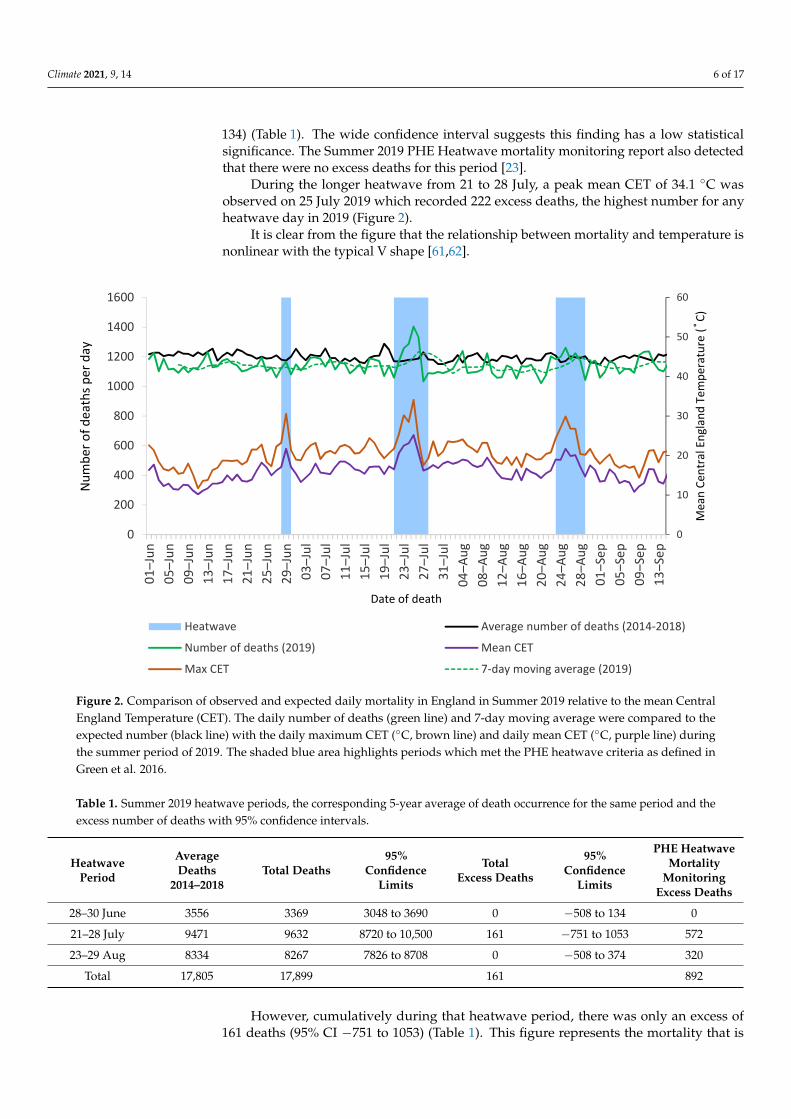
Climate 2021, 9, 14 6 of 17
134) (Table 1). The wide confidence interval suggests this finding has a low statisticalsignificance. The Summer 2019 PHE Heatwave mortality monitoring report also detectedthat there were no excess deaths for this period [23].
During the longer heatwave from 21 to 28 July, a peak mean CET of 34.1 ◦C wasobserved on 25 July 2019 which recorded 222 excess deaths, the highest number for anyheatwave day in 2019 (Figure 2).
It is clear from the figure that the relationship between mortality and temperature isnonlinear with the typical V shape [61,62].
Climate 2021, 9, x FOR PEER REVIEW 18 of 18
2.7. Excess Mortality Graphs for the Whole Summer Period Graphs showing excess deaths across the summer periods for 2017 to 2019 were used
to identify the variability in temperatures across the study period. Excess deaths for the entire summer period for 2017, 2018 and 2019 were found using the same generalised ad-ditive model.
3. Results The summer period of 2019 saw three heatwaves, with two defined by virtue of Level
3 heatwave alerts issued by the Met Office and one heatwave defined from the mean CET when the CET was greater than 20 °C [17,28].
During the brief heatwave from 28 to 30 June, a peak mean CET of 30.6 °C was ob-served on 29 June 2019 (Figure 2). Following the additive hazard model, excess mortality was estimated by subtracting expected mortality from observed mortality. The total num-ber of deaths for the 3-day period was below the 5-year average for 2014 to 2018. Thus, there were no excess deaths during this period (95% confidence interval (CI) −508 to 134) (Table 1). The wide confidence interval suggests this finding has a low statistical signifi-cance. The Summer 2019 PHE Heatwave mortality monitoring report also detected that there were no excess deaths for this period [23].
Figure 2. Comparison of observed and expected daily mortality in England in Summer 2019 relative to the mean Central England Temperature (CET). The daily number of deaths (green line) and 7-day moving average were compared to the expected number (black line) with the daily maximum CET (°C, brown line) and daily mean CET (°C, purple line) during the summer period of 2019. The shaded blue area highlights periods which met the PHE heatwave criteria as defined in Green et al. 2016.
Table 1. Summer 2019 heatwave periods, the corresponding 5-year average of death occurrence for the same period and the excess number of deaths with 95% confidence intervals.
0
10
20
30
40
50
60
0
200
400
600
800
1000
1200
1400
1600
01–J
un05
–Jun
09–J
un13
–Jun
17–J
un21
–Jun
25–J
un29
–Jun
03–J
ul07
–Jul
11–J
ul15
–Jul
19–J
ul23
–Jul
27–J
ul31
–Jul
04–A
ug08
–Aug
12–A
ug16
–Aug
20–A
ug24
–Aug
28–A
ug01
–Sep
05–S
ep09
–Sep
13–S
ep
Mea
n Ce
ntra
l Eng
land
Tem
pera
ture
(˚C)
Num
ber o
f dea
ths p
er d
ay
Date of death
Heatwave Average number of deaths (2014-2018)
Number of deaths (2019) Mean CET
Max CET 7-day moving average (2019)
Figure 2. Comparison of observed and expected daily mortality in England in Summer 2019 relative to the mean CentralEngland Temperature (CET). The daily number of deaths (green line) and 7-day moving average were compared to theexpected number (black line) with the daily maximum CET (◦C, brown line) and daily mean CET (◦C, purple line) duringthe summer period of 2019. The shaded blue area highlights periods which met the PHE heatwave criteria as defined inGreen et al. 2016.
Table 1. Summer 2019 heatwave periods, the corresponding 5-year average of death occurrence for the same period and theexcess number of deaths with 95% confidence intervals.
HeatwavePeriod
AverageDeaths
2014–2018Total Deaths
95%Confidence
Limits
TotalExcess Deaths
95%Confidence
Limits
PHE HeatwaveMortality
MonitoringExcess Deaths
28–30 June 3556 3369 3048 to 3690 0 −508 to 134 0
21–28 July 9471 9632 8720 to 10,500 161 −751 to 1053 572
23–29 Aug 8334 8267 7826 to 8708 0 −508 to 374 320
Total 17,805 17,899 161 892
However, cumulatively during that heatwave period, there was only an excess of161 deaths (95% CI −751 to 1053) (Table 1). This figure represents the mortality that is

Climate 2021, 9, 14 7 of 17
directly or indirectly related to the heatwave. Thus, based on background mortality for thesame period during 2013–2018, we would have expected 161 fewer deaths for this periodhad the heatwave not happened. However, the large interval width again suggests that thefinding is not statistically significant. Nonetheless, the finding of 161 excess deaths wasthree-times lower than the excess deaths (572) detected in the 2019 Heatwave mortalitymonitoring report [23].
During the final heatwave from 23 to 29 August, a peak mean CET of 29.9 ◦C wasobserved on 25 August which recorded 90 excess deaths, the highest for that heatwave.However, the cumulative number of deaths for the entire 7-day period was below the5-year average for 2014 to 2018, resulting in no overall excess death figure during thisheatwave. In contrast, the PHE Heatwave mortality monitoring report estimated 320 excessdeaths during this heatwave.
Accordingly, the total impact on the mortality of the Summer 2019 heatwaves wasestimated to be 161 excess deaths, which was 731 deaths less than the total 892 excessdeaths estimated in the 2019 PHE Heatwave mortality monitoring report. Acknowledgingthe statistical limitations to these findings, there is a clear disparity.
The excess deaths measured for the 2018 heatwaves were equally revealing (Table 2).In contrast to the finding of 161 excess deaths during the 2019 heatwaves, the analysisof the 2018 heatwaves, using the same methods, resulted in a higher cumulative excessdeath total of 1700 (Table 2). This was broken down over 4 heatwave periods, spanning31 days in total, with the highest number of excess deaths during the third heatwaveperiod, 21–29 July, when there were 645 excess deaths (95% CI −508 to 374). The other3 heatwaves recorded 362, 458 and 235 excess deaths for the heatwave periods of 25–27June, 30 June–10 July and 2–9 August, respectively. The finding of 1700 excess deaths forthe entire summer period is 837 deaths higher than the estimated 863 excess deaths in thesummer 2018 Heatwave mortality monitoring report. Thus, the PHE Heatwave mortalitymonitoring reports overestimated excess deaths by 731 in 2019 but underestimated excessdeaths by 837 in 2018 (although statistical significance was again problematic) (Table 2).
Repeating the same process for the heatwaves in 2017, the total number of excessdeaths over the 2 heatwaves was 1489 (Table 3). This was broken down over 2 heatwaveperiods, spanning only 10 days in total. The first heatwave period, 17–23 June, had1113 excess deaths (95% CI −508 to 374), which was the highest number for a singleheatwave across the 2017–2019 summer periods (Tables 1–3). The second heatwave period,5–7 July, recorded 376 deaths (95% CI 196–556). Across the entire summer period, thefinding of 1489 excess deaths is 711 deaths excess deaths higher than the estimated 778deaths in the summer 2017 PHE Heatwave mortality monitoring report.
The overall pattern of excess deaths across the 2019 summer period is distinctive tothe patterns of excess deaths for the 2018 and 2017 summer periods (Table 4; Figure 3).The total number of death occurrences in 2019 (122,257) was substantially lower than theexpected deaths (128,087), which is indicated by the large number of excess deaths shownin Figure 3a. Likewise, the total number of death occurrences over the 2018 summer period(126,115) was also lower than the number of expected deaths (126,155). However, as shownin Figure 3b, the summer 2018 period was the closest to the expected values out of the3 years. Last, the total number of death occurrences over the 2017 summer period (129,998)was significantly higher than the expected deaths (126,059), resulting in an excess deathtotal of 3939 for the entire summer period.
The temperatures for the summer periods in 2017, 2018 and 2019 demonstrate thatthe temperatures for 2019 were generally lower than 2017 and 2018, with short spikes forthe heatwave periods and a significant spike for 25 July 2019 when the all-time highestrecorded temperature of 38.7 ◦C was recorded (Figure 4) [17]. This correlates with thelower-than-usual excess deaths for the summer 2019 period.

Climate 2021, 9, 14 8 of 17
Table 2. Summer 2018 heatwave periods, the corresponding 5-year average of death occurrence for the same period and theexcess number of deaths with 95% confidence intervals.
HeatwavePeriod
AverageDeaths
2013–2017Total Deaths
95%Confidence
Limits
TotalExcess Deaths
95%Confidence
Limits
PHE HeatwaveMortality
MonitoringExcess Deaths
25–27 June 3755 4117 3844 to 4389 362 89 to 634 188
30 June–10 July 14,080 14,538 14,056 to 15,015 458 −24 to 935 266
21–29 July 11,206 11,851 11,127 to 12,575 645 −79 to 1369 409
2–9 August 10,053 10,298 9808 to 10,788 235 −255 to 725 0
Total 39,094 40,804 1700 863
Table 3. Summer 2017 heatwave periods, the corresponding 5-year average of death occurrence for the same period and theexcess number of deaths with 95% confidence intervals.
HeatwavePeriod
AverageDeaths
2012–2016Total Deaths
95%Confidence
Limits
TotalExcess Deaths
95%Confidence
Limits
PHE HeatwaveMortality
MonitoringExcess Deaths
17–23 June 8216 9237 8730 to 9928 1113 514 to 1712 598
5–7 July 3528 3904 3724 to 4084 376 196 to 556 180
Total 11,744 13,141 1489 778
Table 4. Total excess deaths during the summer period (1 June to 15 September) for 2017, 2018 and2019 based on daily death occurrences. The negative excess death total indicates that the deaths forthat year were lower than the average number of deaths for the previous 5-year period.
Year Total Deaths Expected Deaths Excess Deaths
2019 122,257 128,087 0 (−5830)
2018 126,627 126,115 0 (−1506)
2017 129,998 126,059 3939

Climate 2021, 9, 14 9 of 17
Climate 2021, 9, x FOR PEER REVIEW 18 of 18
(a)
(b)
(c)
-250
-200
-150
-100
-50
0
50
100
150
200
250
01–J
un06
–Jun
11–J
un16
–Jun
21–J
un26
–Jun
01–J
ul06
–Jul
11–J
ul16
–Jul
21–J
ul26
–Jul
31–J
ul05
–Aug
10–A
ug15
–Aug
20–A
ug25
–Aug
30–A
ug04
–Sep
09–S
ep14
–Sep
Exce
ss d
eath
s per
day
1 June - 15 September 2019
-250
-200
-150
-100
-50
0
50
100
150
200
250
01–J
un06
–Jun
11–J
un16
–Jun
21–J
un26
–Jun
01–J
ul06
–Jul
11–J
ul16
–Jul
21–J
ul26
–Jul
31–J
ul05
–Aug
10–A
ug15
–Aug
20–A
ug25
–Aug
30–A
ug04
–Sep
09–S
ep14
–Sep
Exce
ss d
eath
s per
day
1 May - 15 September 2018
-250
-150
-50
50
150
250
01–J
un06
–Jun
11–J
un16
–Jun
21–J
un26
–Jun
01–J
ul06
–Jul
11–J
ul16
–Jul
21–J
ul26
–Jul
31–J
ul05
–Aug
10–A
ug15
–Aug
20–A
ug25
–Aug
30–A
ug04
–Sep
09–S
ep14
–Sep
Exce
ss d
eath
s per
day
1 May - 15 September 2017
Figure 3. Daily excess deaths during the summer period (1 June to 15 September) for (a) 2017, (b) 2018and (c) 2019 based on daily death occurrences. The negative excess deaths refer to days when deathwas lower than expected relative to the average of the previous 5-year period.

Climate 2021, 9, 14 10 of 17
Climate 2021, 9, x FOR PEER REVIEW 18 of 18
Figure 3. Daily excess deaths during the summer period (1 June to 15 September) for (a) 2017, (b) 2018 and (c) 2019 based on daily death occurrences. The negative excess deaths refer to days when death was lower than expected relative to the average of the previous 5-year period.
The temperatures for the summer periods in 2017, 2018 and 2019 demonstrate that the temperatures for 2019 were generally lower than 2017 and 2018, with short spikes for the heatwave periods and a significant spike for 25 July 2019 when the all-time highest recorded temperature of 38.7 °C was recorded (Figure 4) [17]. This correlates with the lower-than-usual excess deaths for the summer 2019 period.
Figure 4. Maximum temperatures during the summer period (1 June to 15 September) for 2017, 2018 and 2019.
4. Discussion A retrospective analysis of the 2019 summer period was carried out to quantify excess
mortality during the three heatwaves. The same method was also used to quantify excess mortality during the heatwaves in 2017 and 2018. The cumulative excess deaths for the three heatwave periods in 2019 were low (161) and were not statistically significant. The longer heatwave periods in 2018 and the more intense heatwaves in 2017 had significantly more excess deaths (1700 and 1489, respectively). All findings were significantly at vari-ance to the excess deaths recorded in the PHE Heatwave mortality monitoring reports, which only include persons over 65 years old and should therefore be an underestimate of the figure for the whole population [23]. The reasons for these findings are not clear. However, several explanations are offered.
Both this study and the PHE reports used a simple generalized additive model. The main difference between the studies is that our study used death occurrences rather than
5
10
15
20
25
30
35
4001
–Jun
05–J
un09
–Jun
13–J
un17
–Jun
21–J
un25
–Jun
29–J
un03
–Jul
07–J
ul11
–Jul
15–J
ul19
–Jul
23–J
ul27
–Jul
31–J
ul04
–Aug
08–A
ug12
–Aug
16–A
ug20
–Aug
24–A
ug28
–Aug
01–S
ep05
–Sep
09–S
ep13
–Sep
Tem
pera
ture
(˚C)
Date
2017 2018 2019 21-day moving average (2019)
Figure 4. Maximum temperatures during the summer period (1 June to 15 September) for 2017, 2018 and 2019.
4. Discussion
A retrospective analysis of the 2019 summer period was carried out to quantify excessmortality during the three heatwaves. The same method was also used to quantify excessmortality during the heatwaves in 2017 and 2018. The cumulative excess deaths for thethree heatwave periods in 2019 were low (161) and were not statistically significant. Thelonger heatwave periods in 2018 and the more intense heatwaves in 2017 had significantlymore excess deaths (1700 and 1489, respectively). All findings were significantly at varianceto the excess deaths recorded in the PHE Heatwave mortality monitoring reports, whichonly include persons over 65 years old and should therefore be an underestimate of thefigure for the whole population [23]. The reasons for these findings are not clear. However,several explanations are offered.
Both this study and the PHE reports used a simple generalized additive model. Themain difference between the studies is that our study used death occurrences rather thandeath registrations, which contain unexplained disparities (Figure 5). The impact of thisis significant as the total death registrations for the entire study period (146,564) is over10,000 more than total death occurrences (136,144) (Table 5). This overestimation of deathregistrations corresponds with the overestimation of excess mortality in the 2019 PHEHeatwave Mortality Monitoring report, which may explain the difference in the findings.
Further investigation is advised to confirm whether the disparity displayed is accurateas the pattern suggests that any data analysis based on provisional death registrationswould be unreliable. It is acknowledged that the excess deaths in the PHE reports areestimates, however, they are not updated at any later stage [23]. In contrast, this studyused data which were updated regularly and provided the most reliable evidence to testfor a heat-mortality relationship.

Climate 2021, 9, 14 11 of 17
Climate 2021, 9, x FOR PEER REVIEW 18 of 18
death registrations, which contain unexplained disparities (Figure 5). The impact of this is significant as the total death registrations for the entire study period (146,564) is over 10,000 more than total death occurrences (136,144) (Table 5). This overestimation of death registrations corresponds with the overestimation of excess mortality in the 2019 PHE Heatwave Mortality Monitoring report, which may explain the difference in the findings.
Figure 5. Daily death occurrences (red line) compared to death registrations (blue line) for the period 1 June to 15 September 2019.
Table 5. Death registrations compared to death occurrences for the summer 2019 period.
Week Number Week Ended Death Registrations Death Occurrences 22 1 June 2019 7722 8121 23 7 June 2019 9489 8018 24 14 June 2019 8826 8003 25 21 June 2019 8895 8002 26 28 June 2019 8918 7874 27 5 July 2019 8499 8036 28 12 July 2019 8557 8024 29 19 July 2019 8509 7960 30 26 July 2019 8537 8647 31 2 August 2019 8666 7617 32 9 August 2019 8555 8036 33 16 August 2019 8467 7667 34 23 August 2019 8421 7848 35 30 August 2019 7655 8239 36 6 September 2019 9087 7856 37 13 September 2019 8924 8163 38 20 September 2019 8837 8033
7000
7500
8000
8500
9000
9500
01–J
un–1
9
07–J
un–1
9
14–J
un–1
9
21–J
un–1
9
28–J
un–1
9
05–J
ul–1
9
12–J
ul–1
9
19–J
ul–1
9
26–J
ul–1
9
02–A
ug–1
9
09–A
ug–1
9
16–A
ug–1
9
23–A
ug–1
9
30–A
ug–1
9
06–S
ep–1
9
13–S
ep–1
9
20–S
ep–1
9
Num
bero
f dea
ths
DateDeath registrations Death occurrences
Figure 5. Daily death occurrences (red line) compared to death registrations (blue line) for the period 1 June to 15September 2019.
Table 5. Death registrations compared to death occurrences for the summer 2019 period.
Week Number Week Ended Death Registrations Death Occurrences
22 1 June 2019 7722 812123 7 June 2019 9489 801824 14 June 2019 8826 800325 21 June 2019 8895 800226 28 June 2019 8918 787427 5 July 2019 8499 803628 12 July 2019 8557 802429 19 July 2019 8509 796030 26 July 2019 8537 864731 2 August 2019 8666 761732 9 August 2019 8555 803633 16 August 2019 8467 766734 23 August 2019 8421 784835 30 August 2019 7655 823936 6 September 2019 9087 785637 13 September 2019 8924 816338 20 September 2019 8837 8033
Data before 2020 will be of inestimable value when considering the heat-mortalityrelationship in the future as data post-2020 will be contaminated by excess deaths fromCOVID-19 for at least 2 to 3 years. Indeed, the impact of COVID-19 on excess death figuresmay last longer as ‘long COVID’ may increase excess deaths during heatwaves beyond2020. The recently released 2020 PHE Heatwave mortality monitoring report [23] statedthat “Cumulative excess all-cause mortality related to heatwaves in summer 2020 was thehighest observed since the introduction of the Heatwave Plan for England” [23]. It is not theremit of this study to analyse the 2020 heatwaves, however, this statement is problematicfor several reasons. First, to rely on death certificates to identify deaths attributed toCOVID-19 would be unreliable due to widespread lack of testing of COVID-19 in largeparts of the population during the 2020 summer period. Second, the 2020 report changed
Climate 2021, 9, 14 12 of 17
the methodology used to calculate heat-related excess deaths by comparing deaths onheatwave days to deaths on non-heatwave days before and after the heatwaves days to takeaccount of COVID-19 [23]. However, this does not take into account the fact that deathsincrease as temperature increases prior to actual heatwave days, and people vulnerable toCOVID-19 are also vulnerable to heat-related mortality. This makes it problematic to usethe pre-heatwave period as a baseline, and we suggest that it is not possible to separate thecontribution of COVID-19 and heat to a particular death as the conditions would interact tosome degree. Indeed, an estimate of heat-mortality during the 2020 summer period wouldbe unreliable regardless of the methodology used. Whereas the 2020 PHE report recognisesthis, it still suggests that the 2556 excess deaths (95% CI 2139 to 2926) over and above theCOVID-19 deaths were heat-related.
In light of these observations, an evaluation of the operation of the PHE Heatwavemortality monitoring reports would be valuable to determine their reliability. This wouldprovide stronger evidence as to whether there has been a substantial change in the generalsummer relationship between temperature and mortality since the introduction of theHeatwave Plan for England in 2004, as suggested in its recent evaluation [52]. Thisis made more pertinent by the fact that the last study on excess mortality in England,which analysed mortality during the 2013 heatwaves, also recorded a lower-than-expectedmortality rate [28].
One explanation for the lower-than-expected excess deaths during the 2019 heatwavesis that the heatwaves were relatively short-lived and most periods of high temperaturesthroughout the summer were relatively short (Figure 4). In fact, the entire 2019 summer pe-riod was relatively showery, unsettled and cold as low pressure often dominated [17]. As aresult of these conditions, there was only a modest July temperature anomaly of +1.2 ◦C [17].Further studies could consider whether unsettled, changeable weather (regardless of thetemperature) affects the heat-mortality relationship.
In response to the study’s objectives, the findings demonstrate that the impact ofheatwaves on mortality in 2019 was low (both relative to the 5-year average and relative tothe excess mortality during the 2018 and 2017 heatwaves). Furthermore, the excess deathfindings in this study were substantially different from the majority of findings in the 2017,2018 and 2019 PHE Heatwave mortality monitoring reports. Issues have been identifiedin the use of death registrations for mortality monitoring and the potential for increasedreliability through the use of daily death occurrences.
On a broader scale, the significance of heat-related mortality studies in relation tofuture projections is often constrained as they are often based on the assumption thatthe exposure–response relationship between temperature and mortality will remain thesame [42]. Studies that have examined the exposure-response relationship have consideredthis unlikely [62]. In particular, studies in France and New York have reported improvedresilience of the population to heat-related events [63,64]. Thus, simple extrapolation ofdata to identify relationships with higher temperatures without considering adaptationcould be unreliable [65]. This has also been demonstrated by longer retrospective studies,which have observed that there has been a decrease in the vulnerability of populationsto heat across a number of decades [66]. This decrease exceeds anything expected from aphysiological acclimatisation to a changing climate [67], which suggests that non-climatefactors, such as public health strategies to mitigate heat-related mortality, may be a factor.
There are limitations to this study which could be addressed in future studies. Forinstance, there is evidence that most heat-related deaths take place outside the heatwavealert periods [52], particularly in the case of deaths from respiratory and cardiovascularfailure as these deaths often take place in the days after a heatwave and are difficult toattribute to heat [9]. These difficulties may lead to an underreporting of heat-relatedmortality. Likewise, there is a short-term mortality displacement effect, which acceleratesdeath by a short period of time, which may lead to an overreporting of heat-relatedmortality [68]. This raises the question as to whether the thresholds for the heatwavealerts should be decreased to increase the timespan of the examined heatwave period. This

Climate 2021, 9, 14 13 of 17
corresponds with studies that have suggested that lower or higher temperatures leadingup to a heatwave have a significant impact on excess mortality [69]. Alternatively, anevaluation of heat-related mortality over the entire summer period would bring a morecontextual understanding of the relationship between heat and mortality and may lead toa more nuanced understanding of the implications of higher temperatures in the future.Another difficulty of analysing a specific heatwave period is that there is no universaldefinition for a heatwave, which makes reliable comparisons between heatwave mortalitystudies problematic [69].
There are statistical factors which could have affected our findings such as the baselineused, the relative population size and the size of vulnerable groups present in the popu-lation, such as those with sociodemographic markers or pre-existing conditions [70,71].Gross domestic product, income inequalities and time-varying confounders, such as daysof the week and public holidays, may also have impacted our findings [72–74].
Higher temperatures are not the only meteorologic factor increasing mortality dur-ing heatwaves as heatwaves are known to increase air pollutant levels, such as ozone,fine particulate matter and nitrogen dioxides, which present a major threat to humanhealth [28]. These pollutants are the result of chemical reactions and various meteorologicaleffects [63,75,76]. Studies have indicated that a proportion of excess mortality duringheatwaves is associated with the increased concentrations of air pollution rather than adirect result of high temperatures [49,77]. Thus, heat-related mortality is greater duringhigh ozone or high particulate matter days, which could potentially lead to overestimationsof the number of excess deaths caused directly by higher temperature [77]. Further studiesinvestigating the combined and independent impact of temperature and air pollution onmortality using death occurrences would be beneficial.
There are also other heat-stress metrics, such as humidity, which impact mortality.Sweating is the main physiological coping method for heat stress as sweating helps toreduce body temperature by evaporative cooling. Therefore, humidity inhibits sweating.As a result, days with higher humidity have been observed to have higher heat-related mor-tality [38]. Future studies investigating the relative impact of humidity on heat-attributablemortality in England during heatwaves would be advised to use daily death occurrencesrather than death registrations.
The Urban Heat Island (UHI) phenomenon was also excluded from consideration.This effect causes urban areas to experience higher temperatures than suburban and ruralsurroundings due to anthropogenic heating, a lack of moisture and urban morphology andmaterials [78]. These higher temperatures (relative to nearby rural temperatures) meanthat urban residents are exposed to higher temperatures [78] and may be more vulnerableto heat stress. However, the impact of the UHI is difficult to assess as the ONS deathoccurrence data is not region-specific.
Another important variable is indoor thermal conditions as people in developedcountries spend most of their time indoors. These conditions are not solely dependent onexternal temperature thresholds as they also relate to building characteristics, which sug-gests that local, dwelling-based thresholds need to be developed as a matter of priority [79].Studies have shown healthy people indoors are at higher risk of adverse conditions of ex-treme heat compared to people outdoors [80,81]. The impact of indoor thermal conditionsis likewise outside this study but a further study on the impact of heatwaves on indoorconditions would be highly beneficial.
At a statistical level, the timely recording of the date of death is essential to attribute adeath to raised temperatures. However, the practice of General Practitioners who certifydeaths can play a role in undermining this reliability. For instance, GPs frequently do notaccurately record the date of death, especially if it takes place over a weekend [72]. Oneretrospective study of over 100,000 deaths between 2011–2015 suggested there is a lackof concordance between national mortality records and date of deaths in primary care in23.2% cases [72]. Clearly, these practices would adversely affect the reliability of a database.

Climate 2021, 9, 14 14 of 17
5. Conclusions
As climate change continues, accurate and reliable data on cumulative excess deathsduring heatwaves are essential to draw up effective adaptation policies. The finding thatdeaths are significantly lower during relatively showery and unsettled summers may beuseful in future evaluations of the Heatwave Plan for England and for other countries thathave adopted heatwave plans [82,83]. This is the second heat mortality study that hasrecorded excess deaths which were lower than expected [28]. However, this is the first studyto use the newly available death occurrence data. There is important space for data sourcesto be critically reviewed and continuously updated, particularly as heatwaves are expectedto increase. This analysis did not unpack the causality, adaptation measures or their costs.However, we argue the need to do so. This will allow for a more targeted and measuredsets of actions, particularly for our most vulnerable citizens. Such analysis will need toinclude a more detailed demographic cross section and the causal attributes associatedwith heatwaves. In so doing. low-cost high impact policies, such as the introduction of airconditioning in care homes, might be justifiably—and easily—actioned. However, withoutsuch information, appropriately nuanced cost-benefit analysis is simply not available.
We need to move on from our state of global inaction toward a transformation in publichealth policies based on accurate and reliable data to reduce heat-related mortality [84].This study therefore calls for further research into reasons for lower excess mortality duringheatwaves, which will help to refine adaption policies and better predict the public healthimpact of increasing global mean temperatures as a result of climate change.
Author Contributions: Conceptualization, N.R.; methodology, N.R.; software, N.R.; validation, N.R.;formal analysis, N.R.; investigation, N.R.; resources, N.R.; data curation, N.R.; writing—original draftpreparation, N.R.; writing—review and editing, M.H. and N.R.; visualization, N.R.; supervision,M.H.; project administration, M.H.; funding acquisition, None. All authors have read and agreed tothe published version of the manuscript.
Funding: This research received no external funding.
Informed Consent Statement: Not applicable.
Data Availability Statement: Data from National Office of Statistics and Public Health England.
Conflicts of Interest: The authors declare no conflict of interest.
References1. Coumou, D.; Robinson, A.; Rahmstorf, S. Global increase in record-breaking monthly-mean temperatures. Clim. Chang. 2013, 118,
771–782. [CrossRef]2. Hegerl, G.C.; Bronnimann, S.; Cowan, T.; Friedman, A.R.; Hawkins, E.; Iles, C.; Müller, W.; Schurer, A.; Undorf, S. Causes of
climate change over the historical record. Environ. Res. Lett. 2019, 14, 123006. [CrossRef]3. Stocker, T.F.; Qin, D.; Plattner, G.K.; Alexander, L.V.; Allen, S.K.; Bindoff, N.L.; Bréon, F.M.; Church, J.A.; Cubasch, U.; Emori, S.;
et al. Technical summary. In Climate Change 2013: The Physical Science Basis. Contribution of Working Group I to the Fifth AssessmentReport of the Intergovernmental Panel on Climate Change; Stocker, T.F., Qin, D., Plattner, G.K., Tignor, M., Allen, S.K., Boschung, J.,Nauels, A., Xia, Y., Bex, V., Midgley, P.M., Eds.; Cambridge University Press: Cambridge, UK, 2013; pp. 33–115.
4. Pachauri, R.K.; Allen, M.R.; Barros, V.R.; Broome, J.; Cramer, W.; Christ, R.; Church, J.A.; Clarke, L.; Dahe, Q.; Dasgupta,P.; et al. Climate Change 2014: Synthesis Report; Contribution of Working Groups I, II and III to the Fifth Assessment Report of theIntergovernmental Panel on Climate Change; Cambridge University Press: Cambridge, UK, 2014.
5. UNFCCC. Adoption of the Paris Agreement. Proposal by the President (Draft Decision); United Nations Office: Geneva, Switzerland,2015.
6. Allen, M.R.; Frame, D.J.; Huntingford, C.; Jones, C.D.; Lowe, J.A.; Meinshausen, M.; Meinshausen, N. Warming caused bycumulative carbon emissions towards the trillionth tonne. Nature 2009, 458, 1163–1166. [CrossRef] [PubMed]
7. Friedlingstein, P.; Andrew, R.M.; Rogelj, J.; Peters, G.P.; Canadell, J.G.; Knutti, R.; Luderer, G.; Raupach, M.R.; Schaeffer, M.; vanVuuren, D.P.; et al. Persistent growth of CO2 emissions and implications for reaching climate targets. Nat. Geosci. 2014, 7, 709–715.[CrossRef]
8. Huntingford, C.; Mercado, L.M. High chance that current atmospheric greenhouse concentrations commit to warmings greaterthan 1.5 degrees C over land. Sci. Rep. 2016, 6, 30294. [CrossRef] [PubMed]
9. Mitchell, D.; Kornhuber, K.; Huntingford, C.; Uhe, P. The day the 2003 European heatwave record was broken Comment. LancetPlanet. Health 2019, 3, E290–E292. [CrossRef]
Climate 2021, 9, 14 15 of 17
10. Orlowsky, B.; Seneviratne, S.I. Global changes in extreme events: Regional and seasonal dimension. Clim. Chang. 2012, 110,669–696. [CrossRef]
11. Argueso, D.; Di Luca, A.; Perkins-Kirkpatrick, S.E.; Evans, J.P. Seasonal mean temperature changes control future heat waves.Geophys. Res. Lett. 2016, 43, 7653–7660. [CrossRef]
12. Perkins, S.E.; Alexander, L.V.; Nairn, J.R. Increasing frequency, intensity and duration of observed global heatwaves and warmspells. Geophys. Res. Lett. 2012, 39, 39. [CrossRef]
13. Guerreiro, S.B.; Dawson, R.J.; Kilsby, C.; Lewis, E.; Ford, A. Future heat-waves, droughts and floods in 571 European cities.Environ. Res. Lett. 2018, 13, 034009. [CrossRef]
14. Mora, C.; Dousset, B.; Caldwell, I.R.; Powell, F.E.; Geronimo, R.C.; Bielecki, C.R.; Counsell, C.W.W.; Dietrich, B.S.; Johnston, E.T.;Louis, L.V.; et al. Global risk of deadly heat. Nat. Clim. Chang. 2017, 7, 501–506. [CrossRef]
15. Forzieri, G.; Cescatti, A.; Batista e Silva, F.; Feyen, L. Increasing risk over time of weather-related hazards to the Europeanpopulation: A data-driven prognostic study. Lancet Planet. Health 2017, 1, e200–e208. [CrossRef]
16. Christidis, N.; McCarthy, M.; Stott, P.A. The increasing likelihood of temperatures above 30 to 40 degrees C in the United Kingdom.Nat. Commun. 2020, 11, 3093. [CrossRef] [PubMed]
17. Kendon, M.; McCarthy, M.; Jevrejeva, S.; Matthews, A.; Sparks, T.; Garforth, J. State of the UK Climate 2019. Int. J. Climatol. 2020,40. [CrossRef]
18. Stott, P. Attribution Weather risks in a warming world. Nat. Clim. Chang. 2015, 5, 516–517. [CrossRef]19. Fischer, E.M.; Knutti, R. Anthropogenic contribution to global occurrence of heavy-precipitation and high-temperature extremes.
Nat. Clim. Chang. 2015, 5, 560–564. [CrossRef]20. McCarthy, M.; Armstrong, L.; Armstrong, N. A new heatwave definition for the UK. Weather 2019, 74, 382–387. [CrossRef]21. Herring, S.C.; Christidis, N.; Hoell, A.; Hoerling, M.; Stott, P.A. Introduction to explaining extreme events of 2017 from a climate
perspective. Bull. Am. Meteorol. Soc. 2019, 100, S1–S4. [CrossRef]22. NOAA National Centers for Environmental Information. State of the Climate: Global Climate Report for July 2019. Miami, Florida:
Office of National Oceanic and Atmospheric Administration. Available online: https://www.ncdc.noaa.gov/sotc/global/201907(accessed on 22 November 2020).
23. Public Health England PHE. Heatwave Mortality Monitoring. London: Public Health England. Available online: https://www.gov.uk/government/publications/phe-heatwave-mortality-monitoring (accessed on 22 November 2020).
24. Vautard, R.; Van Aalst, M.; Boucher, O.; Drouin, A.; Haustein, K.; Kreienkamp, F.; Van Oldenborgh, G.J.; Otto, F.E.L.; Ribes, A.;Robin, Y.; et al. Human contribution to the record-breaking June and July 2019 heatwaves in Western Europe. Environ. Res. Lett.2020, 15, 94077. [CrossRef]
25. De Villiers, M.P. Europe extreme heat 22–26 July 2019: Was it caused by subsidence or advection? Weather 2020, 13. [CrossRef]26. Kovats, R.S.; Hajat, S. Heat stress and public heaFlth: A critical review. Annu. Rev. Public Health 2008, 29, 41–55. [CrossRef]
[PubMed]27. Bennett, J.E.; Blangiardo, M.; Fecht, D.; Elliott, P.; FEzzati, M. Vulnerability to the mortality effects of warm temperature in the
districts of England and Wales. Nat. Clim. Chang. 2014, 4, 269–273. [CrossRef]28. Green, H.K.; Andrews, N.; Armstrong, B.; Bickler, G.; Pebody, R. Mortality during the 2013 heatwave in England-How did it
compare to previous heatwaves? A retrospective observational study. Environ. Res. 2016, 147, 343–349. [CrossRef] [PubMed]29. Johnson, H.; Kovats, S.; McGregor, G.; Stedman, J.; Gibbs, M.; Walton, H.A.; Cook, L.; Blace, E.C.L. The impact of the 2003 heat
wave on mortality and hospital admissions in England. Epidemiology 2004, 15, S126. [CrossRef]30. Public Health England Heatwave Plan for England. London: Public Health England. Available online: https://www.gov.uk/
government/publications/heatwave-plan-for-england (accessed on 22 November 2020).31. Elliot, A.J.; Bone, A.; Morbey, R.; Hughes, H.E.; Harcourt, S.; Smith, S.; Loveridge, P.; Green, H.K.; Pebody, R.; Andrews, N.; et al.
Using real-time syndromic surveillance to assess the health impact of the 2013 heatwave in England. Environ. Res. 2014, 135,31–36. [CrossRef]
32. Green, H.K.; Andrews, N.J.; Bickler, G.; Pebody, R.G. Rapid estimation of excess mortality: Nowcasting during the heatwave alertin England and Wales in June 2011. J. Epidemiol. Community Health 2012, 66, 866–868. [CrossRef]
33. Martiello, M.A.; Giacchi, M.V. High temperatures and health outcomes: A review of the literature. Scand. J. Public Health 2010, 38,826–837. [CrossRef]
34. Vandentorren, S.; Bretin, P.; Zeghnoun, A.; Mandereau-Bruno, L.; Croisier, A.; Cochet, C.; Ribéron, J.; Siberan, I.; Declercq, B.;Ledrans, M. August 2003 heat wave in France: Risk factors for death of elderly people living at home. Eur. J. Public Health 2006,16, 583–591. [CrossRef]
35. Li, M.M.; Gu, S.H.; Bi, P.; Yang, J.; Liu, Q.Y. Heat Waves and Morbidity: Current Knowledge and Further Direction-A Comprehen-sive Literature Review. Int. J. Environ. Res. Public Health 2015, 12, 5256–5283. [CrossRef]
36. Nelson, N.G.; Collins, C.L.; Comstock, D.; McKenzie, L.B. Exertional Heat-Related Injuries Treated in Emergency Departments inthe U.S.; 1997–2006. Am. J. Prev. Med. 2011, 40, 54–60. [CrossRef]
37. Sherwood, S.C.; Huber, M. An adaptability limit to climate change due to heat stress. Proc. Natl. Acad. Sci. USA 2010, 107,9552–9555. [CrossRef] [PubMed]
38. McNab, B.K. The Physiological Ecology of Vertebrates: A View from Energetics; Cornell Univ Press: Ithaca, NY, USA, 2002; p. 525.
Climate 2021, 9, 14 16 of 17
39. Mehnert, P.; Malchaire, J.; Kampmann, B.; Piette, A.; Griefahn, B.; Gebhardt, H. Prediction of the average skin temperature inwarm and hot environments. Eur. J. Appl. Physiol. 2000, 82, 52–60. [CrossRef] [PubMed]
40. Raymond, C.; Matthews, T.; Horton, R.M. The emergence of heat and humidity too severe for human tolerance. Sci. Adv. 2020, 6,eaaw1838. [CrossRef]
41. Robine, J.M.; Cheung, S.L.K.; Le Roy, S.; Van Oyen, H.; Griffiths, C.; Michel, J.P.; Herrmannd, F.R. Death toll exceeded 70,000 inEurope during the summer of 2003. Comptes Rendus Biol. 2008, 331, 171–178. [CrossRef] [PubMed]
42. Met Office Heat-Health Watch Service. Available online: https://www.metoffice.gov.uk/weather/warnings-and-advice/seasonal-advice/heat-health-watch-service (accessed on 22 November 2020).
43. Public Health England. All-Cause Mortality Surveillance. London: Public Helath England. Available online: https://www.gov.uk/government/collections/all-cause-mortality-surveillance (accessed on 22 November 2020).
44. Office for National Statistics. Deaths Registered Weekly in England and Wales. Newport, South Wales: Office for NationalStatistics. Available online: https://www.ons.gov.uk/peoplepopulationandcommunity/birthsdeathsandmarriages/deaths/datasets/weeklyprovisionalfiguresondeathsregisteredinenglandandwales (accessed on 22 November 2020).
45. Office for National Statistics. Quarterly Mortality, England. Newport, South Wales: Office for National Statistics. Avail-able online: https://www.ons.gov.uk/peoplepopulationandcommunity/birthsdeathsandmarriages/deaths/datasets/quarterlymortalityreportsanalysis (accessed on 23 November 2020).
46. Watts, J.D.; Kalkstein, L.S. The development of a warm-weather relative stress index for environmental applications. J. Appl.Meteorol. 2004, 43, 503–513. [CrossRef]
47. Sheridan, S.C.; Kalkstein, L.S. Progress in heat watch–warning system technology. Bull. Am. Meteorol. Soc. 2004, 85, 1931–1942.[CrossRef]
48. Vaneckova, P.; Neville, G.; Tippett, V.; Aitken, P.; FitzGerald, G.; Tong, S. Do biometeorological indices improve modelingoutcomes of heat-related mortality? J. Appl. Meteorol. Climatol. 2011, 50, 1165–1176. [CrossRef]
49. Rooney, C.; McMichael, A.J.; Kovats, R.S.; Coleman, M.P. Excess mortality in England and Wales, and in Greater London, duringthe 1995 heatwave. J. Epidemiol. Community Health 1998, 52, 482–486. [CrossRef]
50. Office for National Statistics. Impact of registration delays on mortality statistics in England and Wales: 2018. Wales: Office forNational Statistics. Available online: https://www.ons.gov.uk/peoplepopulationandcommunity/birthsdeathsandmarriages/deaths/articles/impactofregistrationdelaysonmortalitystatisticsinenglandandwales/2018 (accessed on 22 November 2020).
51. Office for National Statistics. Quarterly Mortality Report, England: April to June 2019, Deaths data sources. Newport,South Wales: Office for National Statistics. Available online: https://www.ons.gov.uk/peoplepopulationandcommunity/birthsdeathsandmarriages/deaths/articles/quarterlymortalityreports/apriltojune2019#measuring-these-data (accessed on 22November 2020).
52. Williams, L.; Erens, B.; Ettelt, S.; Hajat, S.; Manacorda, T.; Mays, N. Evaluation of the Heatwave Plan for England; Policy Innovationand Evaluation Research Unit: London, UK, 2019.
53. Mai, F.; Del Pinto, R.; Ferri, C. COVID-19 and cardiovascular diseases. J. Cardiol. 2020, 76, 453–458. [CrossRef]54. Met Office. Hadley Centre Central England Temperature Data. Available online: https://www.metoffice.gov.uk/hadobs/hadcet/
data/download.html (accessed on 22 November 2020).55. Parker, D.E.; Legg, T.P.; Folland, C.K. A new daily Central England Temperature series, 1772–1991. Int. J. Climatol. 1992, 12,
317–342. [CrossRef]56. Ederer, F. The relative survival rate: A statistical methodology. NCI Monogr. 1961, 6, 101–121.57. Petkova, E.P.; Vink, J.K.; Horton, R.M.; Gasparrini, A.; Bader, D.A.; Francis, J.D.; Kinney, P.L. Towards more comprehensive
projections of urban heat-related mortality: Estimates for New York City under multiple population, adaptation, and climatescenarios. Environ. Health Perspect. 2017, 125, 47–55. [CrossRef]
58. Tong, S.; Wang, X.Y.; Guo, Y. Assessing the short-term effects of heatwaves on mortality and morbidity in Brisbane, Australia:Comparison of case-crossover and time series analyses. PLoS ONE 2012, 7, e37500. [CrossRef]
59. Guo, Y.; Barnett, A.G.; Tong, S. Spatiotemporal model or time series model for assessing city-wide temperature effects onmortality? Environ. Res. 2013, 120, 55–62. [CrossRef]
60. Elie, C.; De Rycke, Y.; Jais, J.P.; Landais, P. Appraising relative and excess mortality in population-based studies of chronic diseasessuch as end-stage renal disease. Clin. Epidemiol. 2011, 3, 157. [CrossRef]
61. Anderson, G.B.; Bell, M.L. Heat waves in the United States: Mortality risk during heat waves and effect modification by heatwave characteristics in 43 US communities. Environ. Health Perspect. 2011, 119, 210–218. [CrossRef] [PubMed]
62. Hajat, S.; Kosatky, T. Heat-related mortality: A review and exploration of heterogeneity. J. Epidemiol. Community Health 2010, 64,753–760. [CrossRef] [PubMed]
63. Fouillet, A.; Rey, G.; Laurent, F.; Pavillon, G.; Bellec, S.; Guihenneuc-Jouyaux, C.; Jougla, E.; Hémon, E. Excess mortality related tothe August 2003 heat wave in France. Int. Arch. Occup. Environ. Health 2006, 80, 16–24. [CrossRef] [PubMed]
64. Sheridan, S.; Lin, S. Assessing Variability in the Impacts of Heat on Health Outcomes in New York City Over Time, Season, andHeat-Wave Duration. Ecohealth 2014, 11, 512–525. [CrossRef]
65. Urban, A.; Kysely, J.; Plavcova, E.; Hanzlikova, H.; Stepanek, P. Temporal changes in years of life lost associated with heat wavesin the Czech Republic. Sci. Total Environ. 2020, 716. [CrossRef]

Climate 2021, 9, 14 17 of 17
66. Hondula, D.M.; Balling, R.C.; Vanos, J.K.; Georgescu, M. Rising Temperatures, Human Health, and the Role of Adaptation. Curr.Clim. Chang. Rep. 2015, 1, 144–154. [CrossRef]
67. Vicedo-Cabrera, A.M.; Guo, Y.M.; Sera, F.; Huber, V.; Schleussner, C.F.; Mitchell, D.; Tong, S.; de Sousa Zanotti Stagliorio Coelho,M.; Saldiva, P.H.N.; Lavigne, E.; et al. Temperature-related mortality impacts under and beyond Paris Agreement climate changescenarios. Clim. Chang. 2018, 150, 391–402. [CrossRef]
68. Armstrong, B.; Gasparrini, A.; Hajat, S. Estimating mortality displacement during and after heat waves. Am. J. Epidemiol. 2014,179, 1405–1406. [CrossRef] [PubMed]
69. Perkins, S.E.; Alexander, L.V. On the measurement of heat waves. J. Clim. 2013, 26, 4500–4517. [CrossRef]70. Toloo, G.; FitzGerald, G.; Aitken, P.; Verrall, K.; Tong, S.L. Evaluating the effectiveness of heat warning systems: Systematic
review of epidemiological evidence. Int. J. Public Health 2013, 58, 667–681. [CrossRef] [PubMed]71. Henderson, S.B.; Wan, V.; Kosatsky, T. Differences in heat-related mortality across four ecological regions with diverse urban,
rural, and remote populations in British Columbia, Canada. Health Place 2013, 23, 48–53. [CrossRef]72. Harshfield, A.; Abel, G.A.; Barclay, S.; Payne, R.A. Do GPs accurately record date of death? A UK observational analysis. BMJ
Supportive Palliat. Care 2020, 10. [CrossRef]73. Sera, F.; Armstrong, B.; Tobias, A.; Vicedo-Cabrera, A.M.; Åström, C.; Bell, M.L.; Chen, B.-Y.; De, M.; Zanotti, S.; Coelho,
M.S.Z.S.; et al. How urban characteristics affect vulnerability to heat and cold: A multi-country analysis. Int. J. Epidemiol. 2019,48, 1101–1112. [CrossRef]
74. Arbuthnott, K.G.; Hajat, S. The health effects of hotter summers and heat waves in the population of the United Kingdom: Areview of the evidence. Environ. Health 2017, 16, 119. [CrossRef]
75. Kalisa, E.; Fadlallah, S.; Amani, M.; Nahayo, L.; Habiyaremye, G. Temperature and air pollution relationship during heatwaves inBirmingham, UK. Sustain. Cities Soc. 2018, 43, 111–120. [CrossRef]
76. Analitis, A.; Michelozzi, P.; D’Ippoliti, D.; De’Donato, F.; Menne, B.; Matthies, F.; Lefranc, A. Effects of heat waves on mortality:Effect modification and confounding by air pollutants. Epidemiology 2014, 25, 15–22. [CrossRef] [PubMed]
77. Stedman, J.R. The predicted number of air pollution related deaths in the UK during the August 2003 heatwave. Atmos. Environ.2004, 38, 1087–1090. [CrossRef]
78. Heaviside, C.; Vardoulakis, S.; Cai, X.M. Attribution of mortality to the urban heat island during heatwaves in the West Midlands,UK. Environ. Health 2016, 15, 49–59. [CrossRef] [PubMed]
79. Anderson, M.; Carmichael, C.; Murray, V.; Dengel, A.; Swainson, M. Defining indoor heat thresholds for health in the UK. Perspect.Public Health 2013, 133, 158–164. [CrossRef]
80. Cui, J.; Arbab-Zadeh, A.; Prasad, A.; Durand, S.; Levine, B.D.; Crandall, C.G. Effects of heat stress on thermoregulatory responsesin congestive heart failure patients. Circulation 2005, 112, 2286–2292. [CrossRef]
81. Huang, W.; Kan, H.; Kovats, S. The impact of the 2003 heat wave on mortality in Shanghai, China. Sci. Total Environ. 2010, 408,2418–2420. [CrossRef]
82. Lowe, D.; Ebi, K.L.; Forsberg, B. Heatwave Early Warning Systems and Adaptation Advice to Reduce Human Health Conse-quences of Heatwaves. Int. J. Environ. Res. Public Health 2011, 8, 4623–4648. [CrossRef]
83. Smith, K.; Woodward, A.; Campbell-Lendrum, D.; Chadee, D.; Honda, Y.; Liu, Q.; Olwoch, J.; Revich, B.; Sauerborn, R.; Aranda,C.; et al. Human health: Impacts, adaptation, and co-benefits. In Climate Change 2014: Impacts, Adaptation, and Vulnerability. PartA: Global and Sectoral Aspects. Contribution of Working Group II to the Fifth Assessment Report of the Intergovernmental Panel on ClimateChange, 1st ed.; Field, C.B., Barros, V., Dokken, D.J., Eds.; Cambridge University Press: Cambridge, UK, 2014; pp. 709–754.
84. Watts, N.; Amann, M.; Ayeb-Karlsson, S.; Belesova, K.; Bouley, T.; Boykoff, M.; Byass, P.; Cai, W.; Campbell-Lendrum, D.;Chambers, J.; et al. The Lancet Countdown on health and climate change: From 25 years of inaction to a global transformation forpublic health. Lancet 2018, 391, 581–630. [CrossRef]