1 Advanced Composite Material Applications in Structural Engineering Advances and Challenges...
74
1 Advanced Composite Material Applications in Structural Engineering Advances and Challenges By Amjad J. Aref Associate Professor Structural Engineering Lecture Series – September 22, 2007
-
Upload
shreya-baston -
Category
Documents
-
view
234 -
download
7
Transcript of 1 Advanced Composite Material Applications in Structural Engineering Advances and Challenges...

1
Advanced Composite Material
Applications in Structural Engineering
Advances and Challenges
Advanced Composite Material
Applications in Structural Engineering
Advances and Challenges
By
Amjad J. ArefAssociate Professor
Structural Engineering Lecture Series – September 22, 2007

2
OUTLINE
Introduction: What are Composite Materials?
Bridge Applications
Final Remarks
3
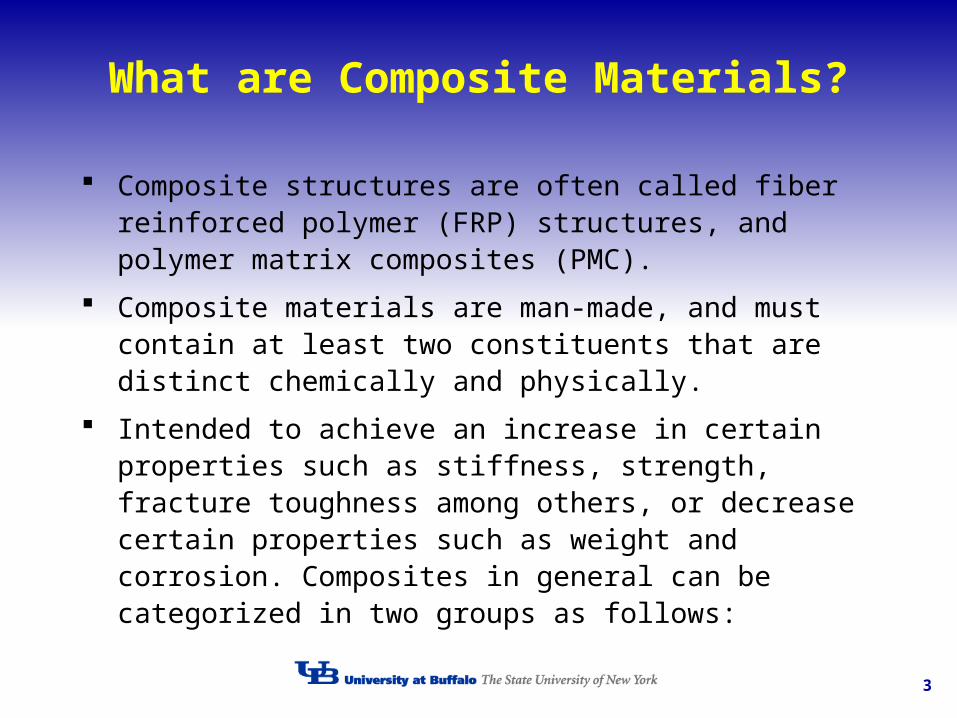
What are Composite Materials?
Composite structures are often called fiber reinforced polymer (FRP) structures, and polymer matrix composites (PMC).
Composite materials are man-made, and must contain at least two constituents that are distinct chemically and physically.
Intended to achieve an increase in certain properties such as stiffness, strength, fracture toughness among others, or decrease certain properties such as weight and corrosion. Composites in general can be categorized in two groups as follows:

4
Composites Architecture
Reinforcement
Interface
Matrix

5
Reinforcement Long continuous bundles
l/d > 10 by definition, (typical dia for a fiber ~ 6-15 µm)unidirectionalmultidirectionalwoven or braided Continuous fibers
Short chopped fibers randomly oriented
Whiskerslong thin crystals d< 1 micron length in the order of 100 microns used
in ceramic matrix composites (CMC) and metal matrix composites (MMC)
ParticulatesNear sphericalnot usually used for strengthincrease the toughness of the material
Flakesmetallic, electrical/heating applications2-D in nature, not usually used for strength

6
Reinforcement (cont’d)
Glass (E-, S-, C-glass fibers)E-glass: Young’s modulus ~ 72 GPa, σu=3450 MPa (500 ksi ), Strain to failure 1-2%
Carbon EL:250-517 GPa, ET=12-20 GPa
σu=2000-2900 MPa (290-435 ksi), strain to failure 0.5-1%
Kevlar, Spectra (organic) E: 62-131GPa σu=2500-3790 MPa (360-550 ksi), strain to failure 2-5%
Ceramic fibers: high strength, stiffness and temperature stability Alumina (Al2O3)
E: 370 GPaσu=1380 MPa (200 ksi)
SiC
Boron (toxic material), typically large diameter

7
Matrix
Metallic
Ceramic
Polymeric– Thermoplastic– Thermoset
8
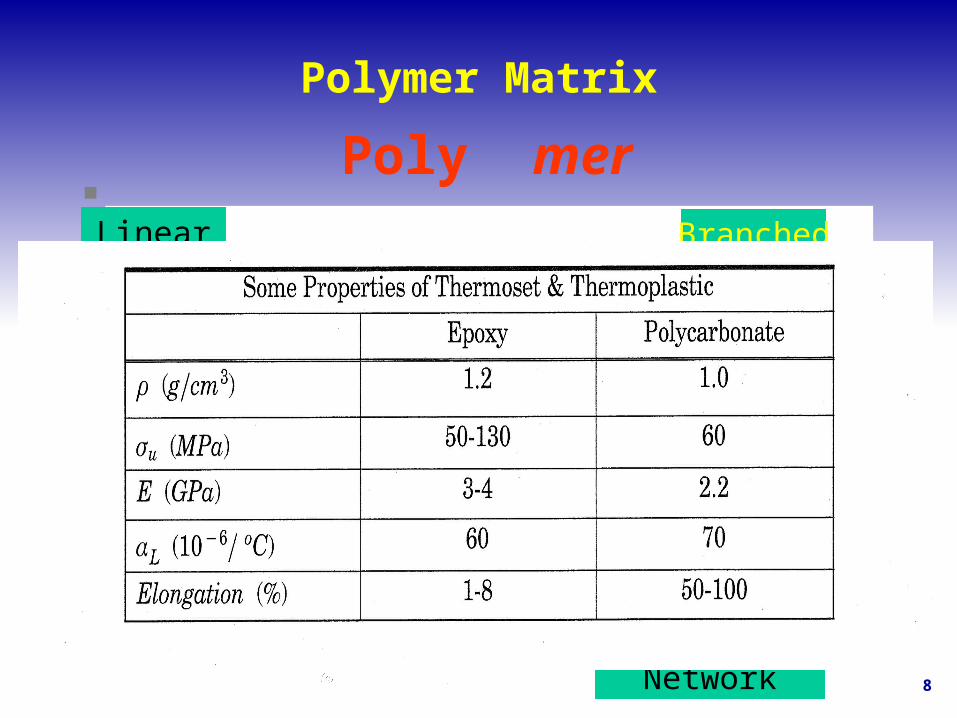
Polymer Matrix
Linear Branched
Cross-linked
Network
Poly mer

9
Composites Categories
Reinforced Plastics
Low strength and stiffness
Inexpensive
Glass fibers is primary reinforcement
Applications:o Boat Hullso Corrugated sheetso Pipingo Automotive panelso Sporting goods
Advanced Composites
High strength and stiffness
Expensive
High performance reinforcement such as: graphite, aramid, kevlar
Applications: Aerospace industry

10
Typical Applications in Structural Engineering
Retrofitting of beams and columns
Seismic Retrofitting
New applications Bridge Deck Bridge Superstructure

11
FRP COMPOSITES IN STRUCTURAL
APPLICATIONS
Advantages– High specific strength
and stiffness– Corrosion resistance– Tailored properties– Enhanced fatigue life– Lightweight– Ease of installation– Lower life-cycle costs
Factors preventing FRP from being widely accepted– High initial costs– No specifications– No widely accepted
structural components and systems
– Insufficient data on long-term environmental durability

12
CONDITIONS OF U.S. HIGHWAY
BRIDGES 28% of 590,000 public
bridges are classified as “deficient”.
The annual cost to improve bridge conditions is estimated to be $10.6 billion.
24
18
23
17
21
14
20
14
19
14
18
14
17
14
17
13
16
14
15
14
15
14
14
14
0
5
10
15
20
25
30
35
40
45
Per
cen
tag
e o
f D
efic
ien
t B
rid
ges
(%
)
1990 1991 1992 1993 1994 1995 1996 1997 1998 1999 2000 2001
Year
Functionally ObsoleteStructurally Deficient
Need for bridge systems thathave long-term durability andrequire less maintenance (Source: National Bridge Inventory)

13
Demand for FRP in Bridge Applications
Is it necessary to use expensive FRP materials for bridge renewal?
Given the massive investment to renew deficient bridges (28% of all bridges are deficient), repeating the same designs, materials, etc. may not be a prudent approach.
Consider the fact that the average life span of a bridge in the U.S. is 42 years.
FRP materials, if designed properly, could provide new bridges that last over 100 years.

14
GLASS FIBER REINFORCED
POLYMER (GFRP) BOX SECTIONS
The compressive flange is weaker than the tensile flange.
A failure of a GFRP box section usually occurs in a catastrophic manner.
The design of a GFRP box section is usually governed by stiffness instead of strength.
Hybrid designor
Special structural
system
15
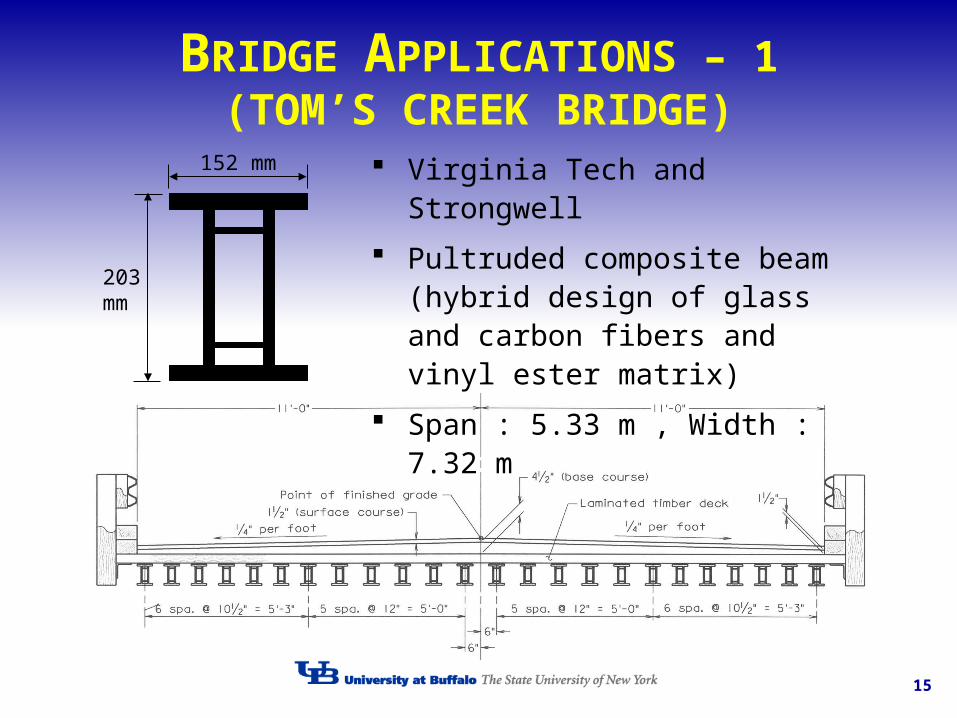
BRIDGE APPLICATIONS – 1(TOM’S CREEK BRIDGE)
Virginia Tech and Strongwell
Pultruded composite beam (hybrid design of glass and carbon fibers and vinyl ester matrix)
Span : 5.33 m , Width : 7.32 m
203mm
152 mm
16
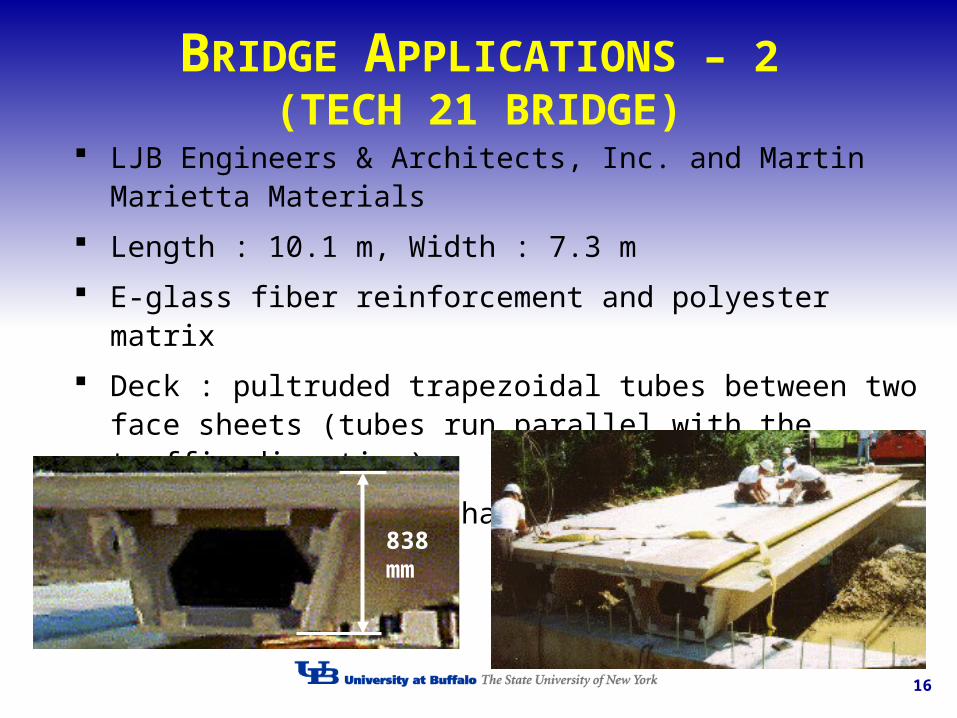
BRIDGE APPLICATIONS – 2(TECH 21 BRIDGE)
LJB Engineers & Architects, Inc. and Martin Marietta Materials
Length : 10.1 m, Width : 7.3 m
E-glass fiber reinforcement and polyester matrix
Deck : pultruded trapezoidal tubes between two face sheets (tubes run parallel with the traffic direction)
Stringer : three U-shaped structural beams
838mm
17
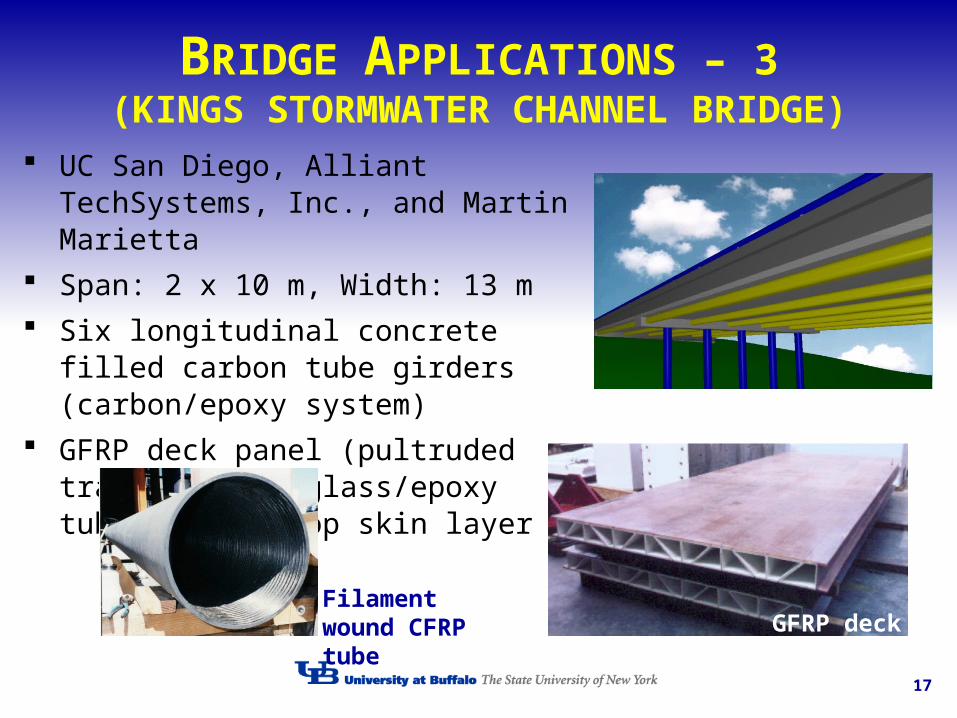
BRIDGE APPLICATIONS – 3(KINGS STORMWATER CHANNEL BRIDGE)
UC San Diego, Alliant TechSystems, Inc., and Martin Marietta
Span: 2 x 10 m, Width: 13 m
Six longitudinal concrete filled carbon tube girders (carbon/epoxy system)
GFRP deck panel (pultruded trapezoidal E-glass/epoxy tubes with a top skin layer
Filament wound CFRP tube GFRP deck
18
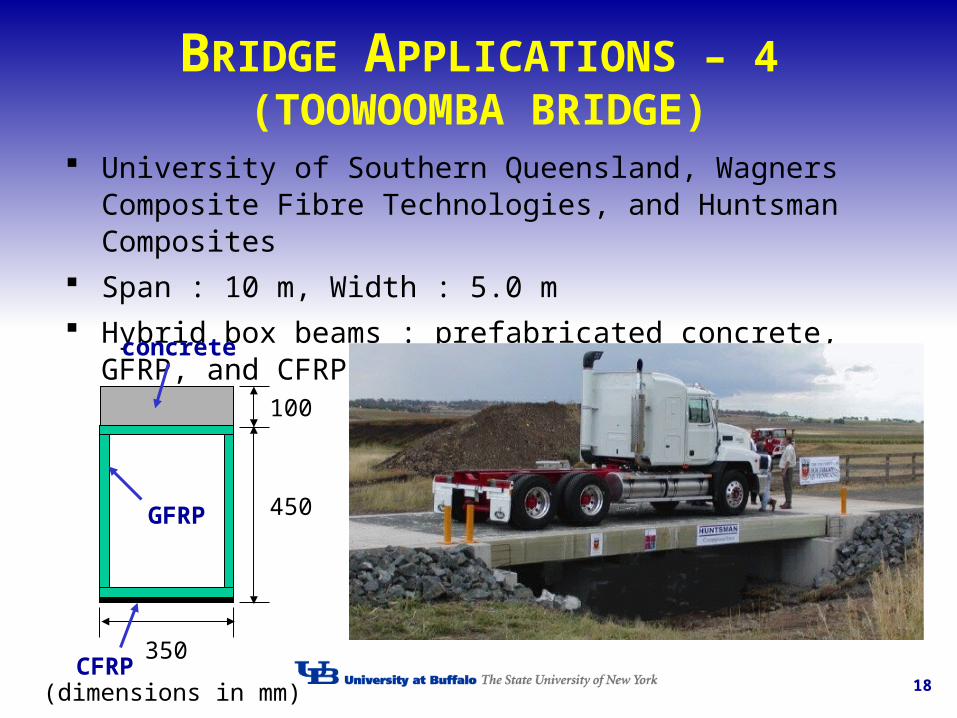
BRIDGE APPLICATIONS – 4(TOOWOOMBA BRIDGE)
University of Southern Queensland, Wagners Composite Fibre Technologies, and Huntsman Composites
Span : 10 m, Width : 5.0 m
Hybrid box beams : prefabricated concrete, GFRP, and CFRP
350
450
100
(dimensions in mm)
concrete
GFRP
CFRP

19
MARKET SHARE (FRP COMPOSITES)
Consumer7%
Corrosion12%
Marine10%
Transportation31%
Construction20%
Appliance6%
Aerospace1%
Other3%
Electrical10%
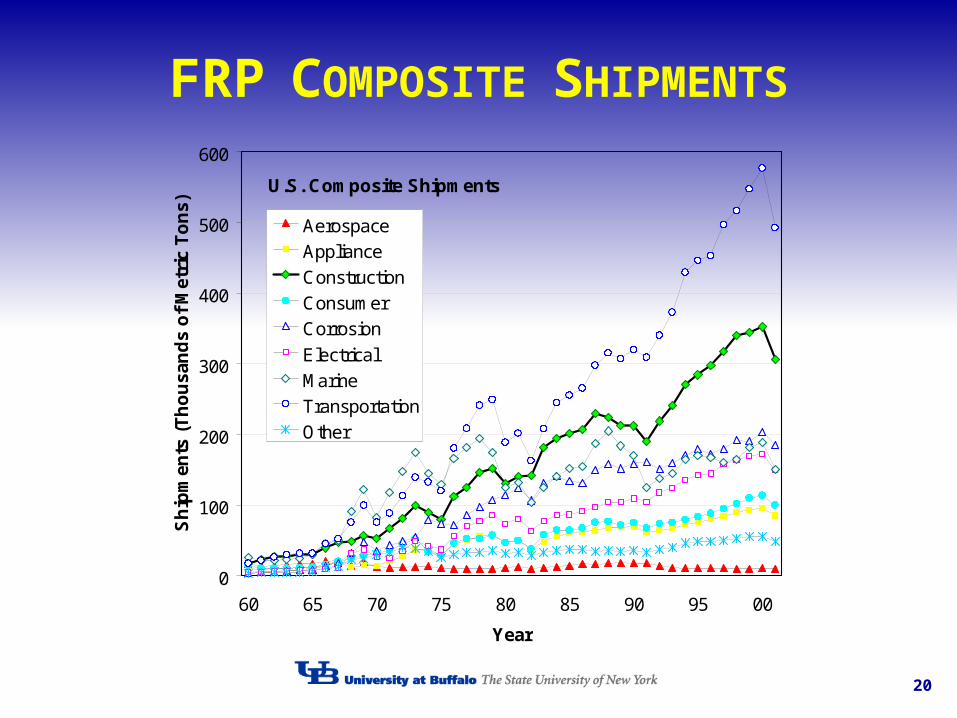
20
FRP COMPOSITE SHIPMENTS
U.S. Composite Shipments
0
100
200
300
400
500
600
60 65 70 75 80 85 90 95 00
Year
Sh
ipm
ents
(T
ho
usa
nd
s o
f M
etri
c T
on
s)
Aerospace
Appliance
Construction
Consumer
Corrosion
Electrical
Marine
Transportation
Other

21
Recent Development of FRP Bridge Deck and Superstructure Systems

22
Hybrid-FRP-Concrete Bridge Deck and Superstructure System
The system is developed at UB by an
optimum selection of concrete and FRP.
The system is validated analytically and
experimentally to assess the feasibility of the
proposed hybrid bridge superstructure and
deck.
Simple methods of analysis for the proposed
hybrid bridge superstructure were
developed.

23
BASIC CONCEPT OF PROPOSED
HYBRID FRP-CONCRETE BRIDGE Single span with a span length of 18.3 m
AASHTO LRFD Bridge Specifications– Live load deflection check
dLL<L/800 under (1+IM)Truck
– Service I limit
DC+DW+Lane+(1+IM)Truck
– Strength I limit
1.25DC+1.5DW+1.75[Lane+(1+IM)Truck]
Concrete should fail first in flexure.
A strength reduction factor for GFRP was taken as 0.4.
18288 mm
99mm
1160mm
3785 mm
Simple-span one-lane hybrid bridge
24
PROPOSED HYBRID BRIDGE
SUPERSTRUCTURE
Advantages include:– Increase in stiffness– Corrosion resistance– Cost-effectiveness– Lightweight– Local deformation reduction– High torsional rigidity– Pre-fabrication– Short construction period
25
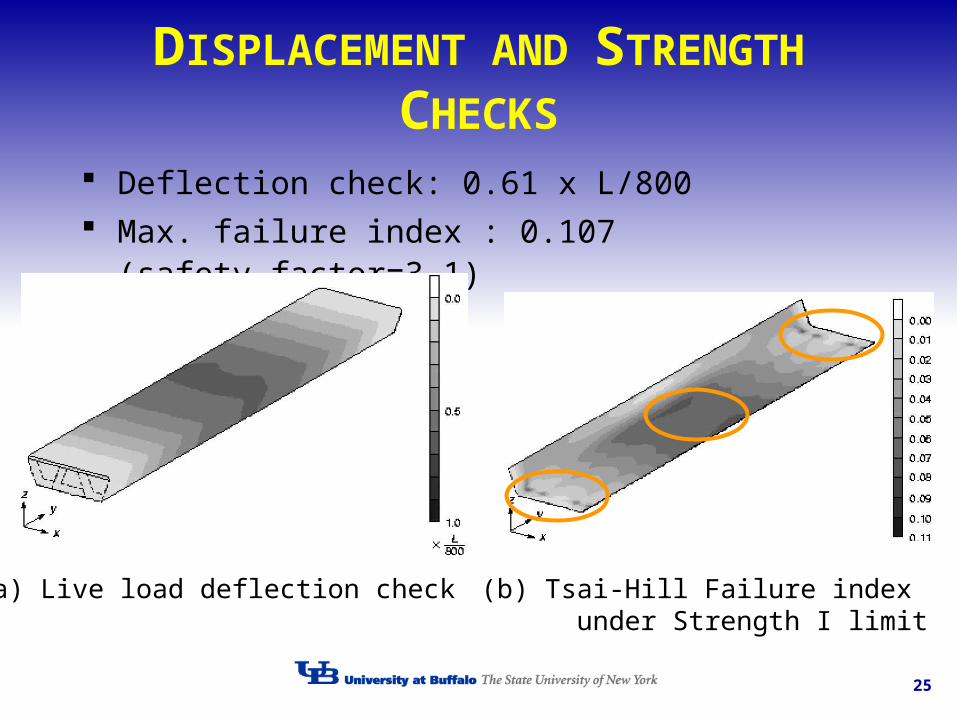
DISPLACEMENT AND STRENGTH
CHECKS
Deflection check: 0.61 x L/800 Max. failure index : 0.107 (safety factor=3.1)
(a) Live load deflection check (b) Tsai-Hill Failure index under Strength I limit
26
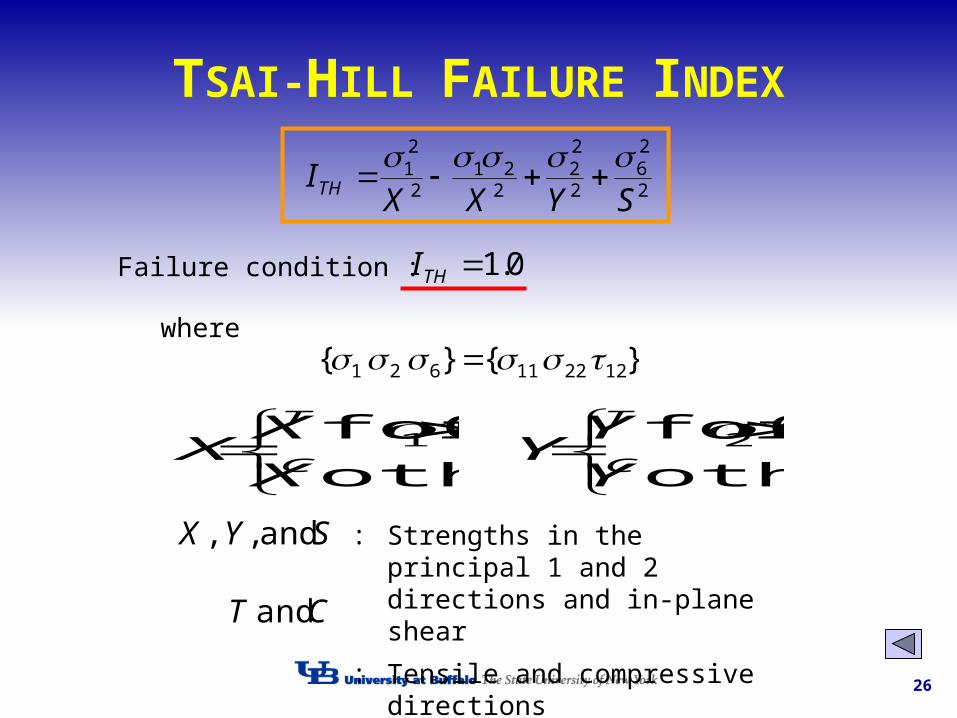
TSAI-HILL FAILURE INDEX
2
26
2
22
221
2
21
SYXXITH
Failure condition : 0.1THI
where} {} { 122211621
SYX and , , : Strengths in the principal 1 and 2 directions and in-plane shear
: Tensile and compressive directions
otherwise
0for 1C
T
X
XX
otherwise
0for 2C
T
Y
YY
CT and

27
EXPERIMENTAL PROGRAM
Materials– GFRP– Concrete
Non-destructive tests– Flexure– Off-axis flexure
Fatigue test Destructive tests
– Flexure– Shear– Bearing
28
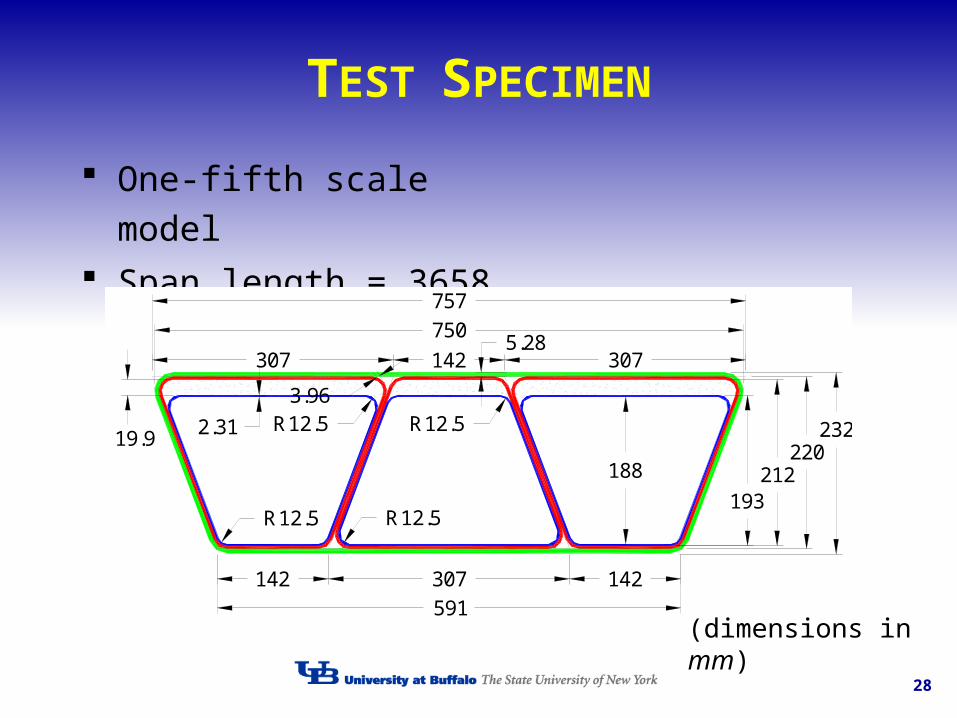
TEST SPECIMEN
One-fifth scale model Span length = 3658 mm
19.9R12.5
R12.5
R12.5
R12.5
5.28
3.96
2.31
193212
220188
232
142307142591
307142307
750
757
(dimensions in mm)
29
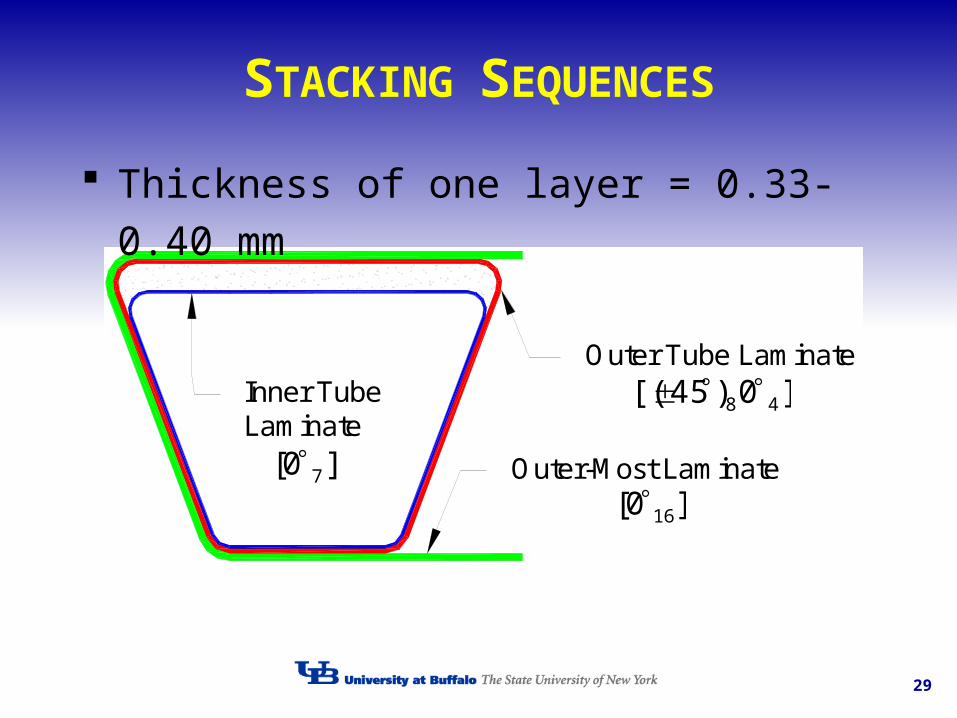
STACKING SEQUENCES
Inner TubeLaminate
Outer-Most Laminate
Outer Tube Laminate
]0[ 7
]0)45[( 48
]0[ 16
Thickness of one layer = 0.33-0.40 mm
30
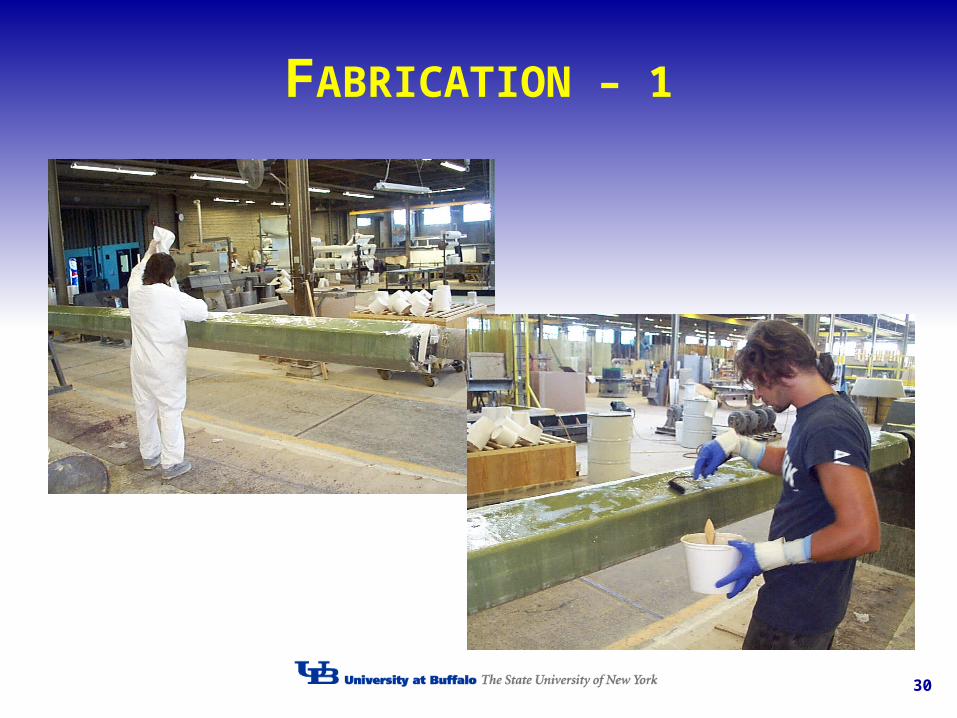
FABRICATION – 1

31
FABRICATION – 2
32
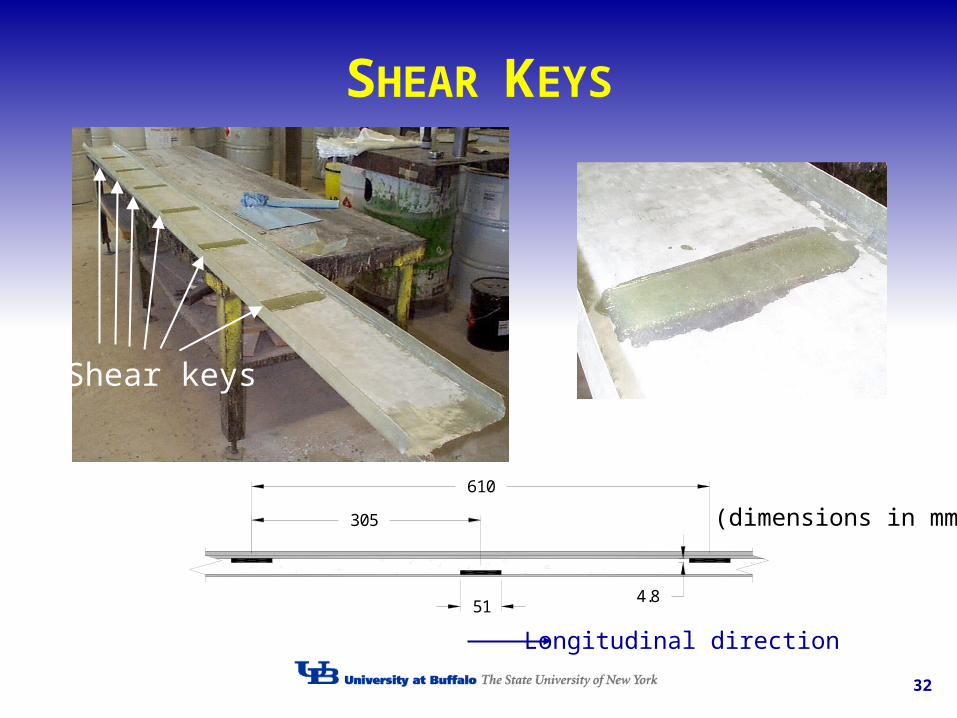
SHEAR KEYS
Shear keys
610
305
514.8
Longitudinal direction
(dimensions in mm)
33
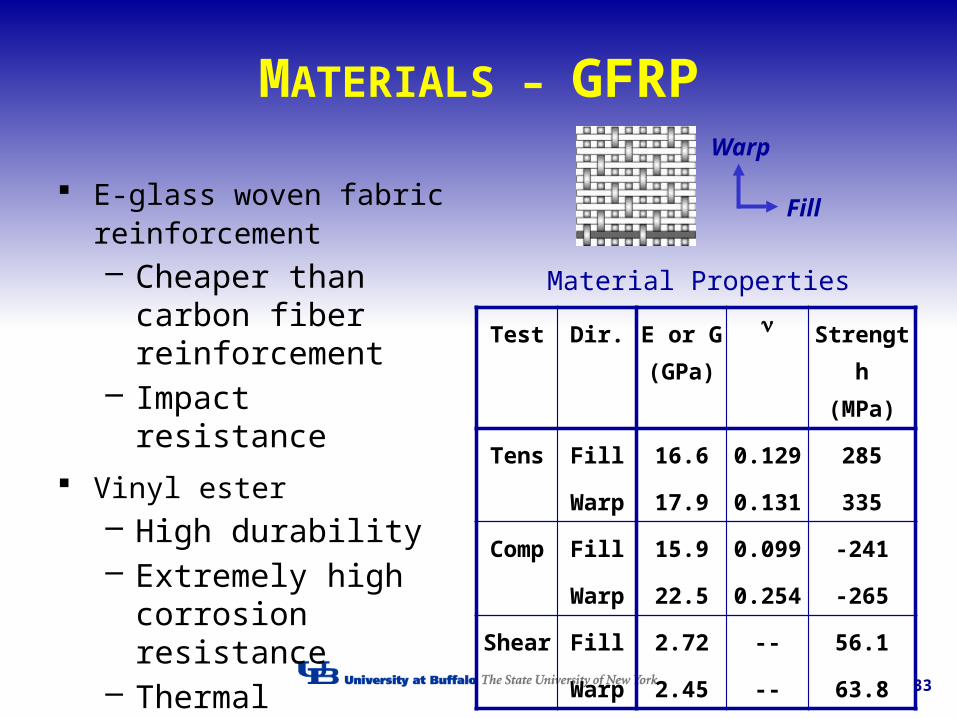
MATERIALS – GFRP
E-glass woven fabric reinforcement– Cheaper than carbon
fiber reinforcement– Impact resistance
Vinyl ester– High durability– Extremely high
corrosion resistance– Thermal stability
Test Dir. E or G (GPa)
n Strength(MPa)
Tens Fill 16.6 0.129 285
Warp 17.9 0.131 335
Comp Fill 15.9 0.099 -241
Warp 22.5 0.254 -265
Shear Fill 2.72 -- 56.1
Warp 2.45 -- 63.8
Material Properties
Fill
Warp
34
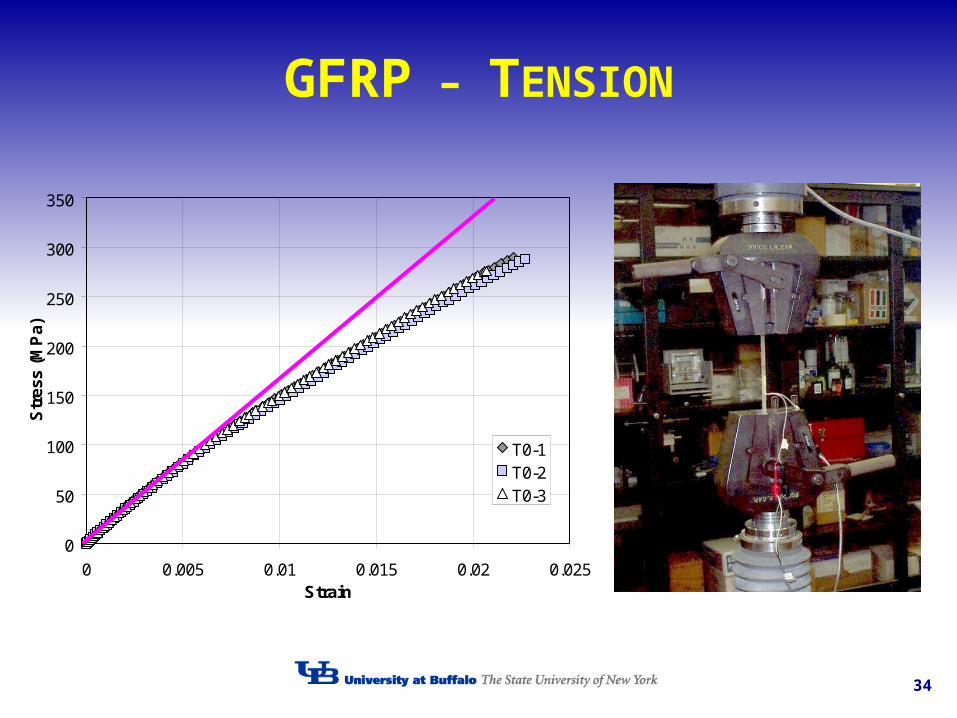
GFRP – TENSION
0
50
100
150
200
250
300
350
0 0.005 0.01 0.015 0.02 0.025Strain
Str
ess
(MP
a)
T0-1T0-2T0-3

35
GFRP – COMPRESSION
-300
-250
-200
-150
-100
-50
0
-0.02 -0.015 -0.01 -0.005 0 0.005Strain
Str
ess
(MP
a)
C0-1C0-2C0-3
36
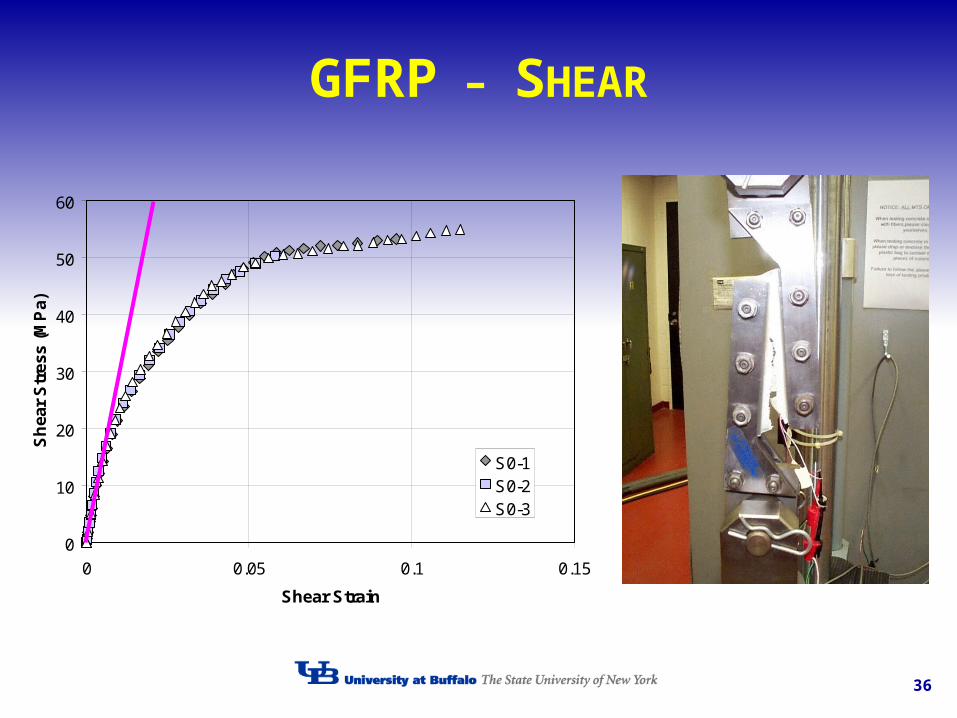
GFRP – SHEAR
0
10
20
30
40
50
60
0 0.05 0.1 0.15
Shear Strain
Sh
ear
Str
ess
(MP
a)
S0-1S0-2S0-3
37
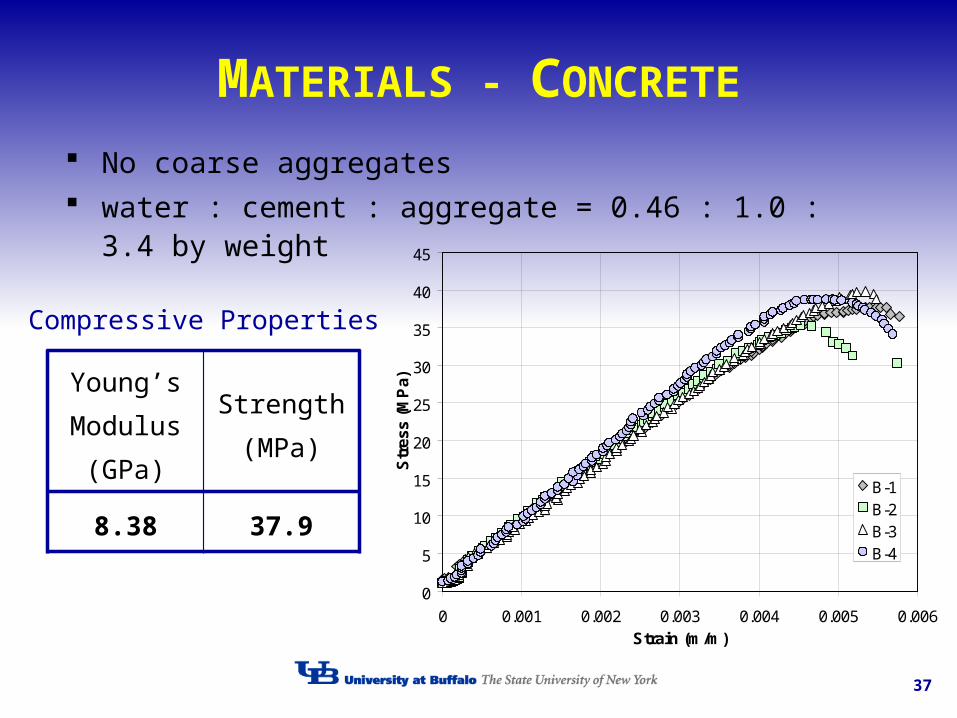
MATERIALS - CONCRETE
0
5
10
15
20
25
30
35
40
45
0 0.001 0.002 0.003 0.004 0.005 0.006Strain (m/m)
Str
ess
(MP
a)
B-1B-2B-3B-4
No coarse aggregates water : cement : aggregate = 0.46 : 1.0 : 3.4 by weight
Young’s Modulus
(GPa)
Strength (MPa)
8.38 37.9
Compressive Properties

38
TEST SETUP

39
FLEXURAL LOADING CONFIGURATION
(dimensions in mm)
(b) Cross section (flexure)
(a) Elevation
(c) Cross section (off-axis flexure)

40
NONDESTRUCTIVE FLEXURE (TEST PROTOCOL)
0.0
1.0
2.0
3.0
4.0
5.0
0 270 540 810 1080 1350
Time (sec)
Ap
pli
ed D
isp
lace
men
t(X
Sp
an/2
400)
0.0
1.5
3.0
4.5
6.0
7.5
(mm
)
To examine elastic
behavior of the bridge
under the flexural
loading
Displacement control
Max applied displ.
= L/480
(L: span length)

41
NONDESTRUCTIVE FLEXURE (FORCE-DISPLACEMENT)
0.0
0.5
1.0
1.5
2.0
2.5
3.0
3.5
0.0 0.2 0.4 0.6 0.8 1.0 1.2 1.4
Vertical Displacement (X Span/800)
Ap
pli
ed L
oad
(X
Tan
dem
Lo
ad)
0
5
10
15
20
25
30
0.0 1.0 2.0 3.0 4.0 5.0 6.0
(mm)
(kN
)
HybridFRP Only
G-BOT-C
G
19% increase
40% for the prototype

42
NONDESTRUCTIVE FLEXURE (TOP SURFACE DEFORMATION)
0.0
0.2
0.4
0.6
0.8
1.0
1.2
1.4
-0.40 -0.30 -0.20 -0.10 0.00 0.10 0.20 0.30 0.40
Location (m)
Ver
tica
l D
isp
lace
men
t (X
Sp
an/8
00)
0.0
1.0
2.0
3.0
4.0
5.0
6.0
(mm
)
0.5 x Tandem 1.0 x Tandem1.5 x Tandem 2.0 x Tandem2.5 x Tandem
HybridFRP OnlyLoading point
H

43
NONDESTRUCTIVE FLEXURE (STRAIN RESULTS)
(a) Bottom surface along the center-line
(b) Exterior web over height
0
100
200
300
400
500
600
0.000 0.125 0.250 0.375 0.500
Location / Span Length
Lo
ng
itu
din
al S
trai
n (m )
0.5 x Tandem
1.0 x Tandem
1.5 x Tandem
2.0 x Tandem
2.5 x Tandem
Section C
Section A
Section ESection F
Section G
F GECA
0.0
0.1
0.2
0.3
0.4
0.5
0.6
0.7
0.8
0.9
1.0
-300 -200 -100 0 100 200 300 400 500
Longitudinal Strain (m)
Hei
gh
t /
Bri
dg
e H
eig
ht
0.5 x Tandem
1.0 x Tandem
1.5 x Tandem
2.0 x Tandem
2.5 x Tandem
GBoundaries of the concrete layer

44
FATIGUE LOADING (TEST PROTOCOL)
To examine fatigue characteristics
Flexural loading
Force control
2 x 10⁶ cycles
Freq.= 3.0 Hz
Max. load = 2.0 x Tandem
Stiffness evaluation every 0.2 million cycles
0.0
0.4
0.8
1.2
1.6
2.0
0.00 0.25 0.50 0.75 1.00
Time (sec)
Ap
pli
ed L
oad
(X
Tan
dem
Lo
ad)
0
2
4
6
8
10
12
14
16
(kN
)

45
FATIGUE LOADING (TEST RESULTS)
0.70
0.75
0.80
0.85
0.90
0.95
1.00
0.0 0.2 0.4 0.6 0.8 1.0 1.2 1.4 1.6 1.8 2.0Millions
Applied Load Cycles
Sti
ffn
ess
Rat
io
Average (top)
Average (bottom)
Average
5.9 % degradation

46
DESTRUCTIVE FLEXURE (TEST PROTOCOL)
(a) Displacement history #1
(b) Displacement history #2
Time
Ap
pli
ed
Dis
pla
ce
me
nt
Step I
Time
Ap
pli
ed
Dis
pla
ce
me
nt Step II
To examine the strength of the
bridge and failure modes
Flexural loading
Displacement control
Two stages– Step I (displacement history #1)– Step II (displacement history #2)

47
DESTRUCTIVE FLEXURE (TEST RESULTS – 1)
Failure load = 35 x Tandem load
0
5
10
15
20
25
30
35
40
0 2 4 6 8 10 12 14 16 18 20 22
Vertical Displacement (X Span/800)
Ap
pli
ed L
oad
(X
Tan
dem
Lo
ad)
0
50
100
150
200
250
300
350
0 10 20 30 40 50 60 70 80 90 100
(mm)
(kN
)
1st Cycle (Step I)2nd Cycle (Step I)3rd Cycle (Step I)Step IIFailure
G-BOT-C
Loud noise
Loud noise
G
localglobal

48
CHANGE OF A LOADING CONDITION
From four point loads to two line loads
contact
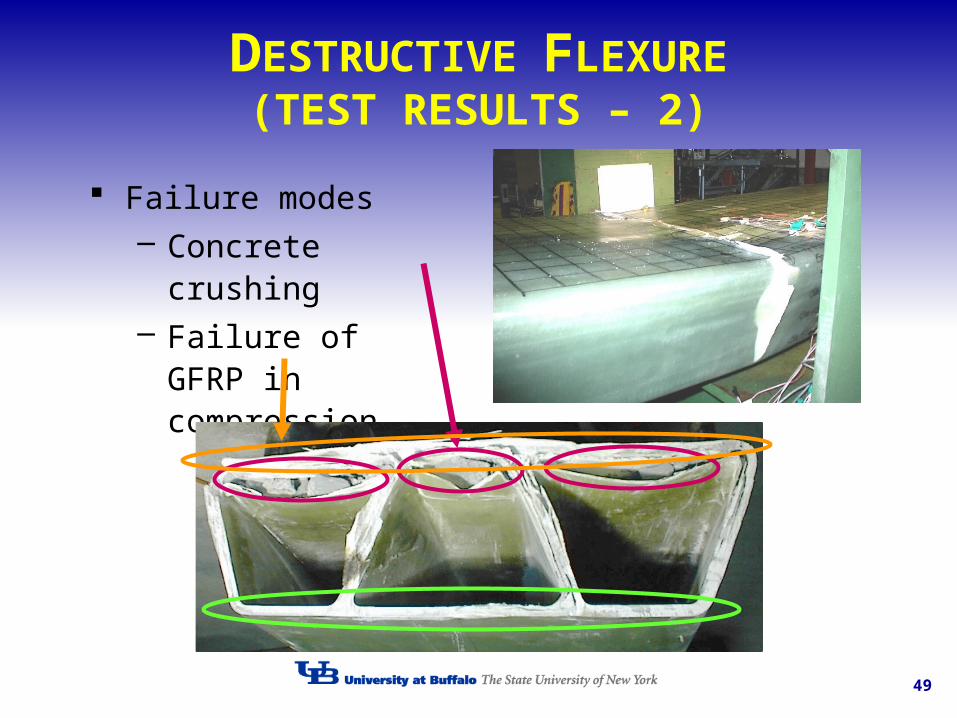
49
DESTRUCTIVE FLEXURE (TEST RESULTS – 2)
Failure modes– Concrete crushing– Failure of GFRP in
compression

50
DESTRUCTIVE FLEXURE
(FAILURE MODES)
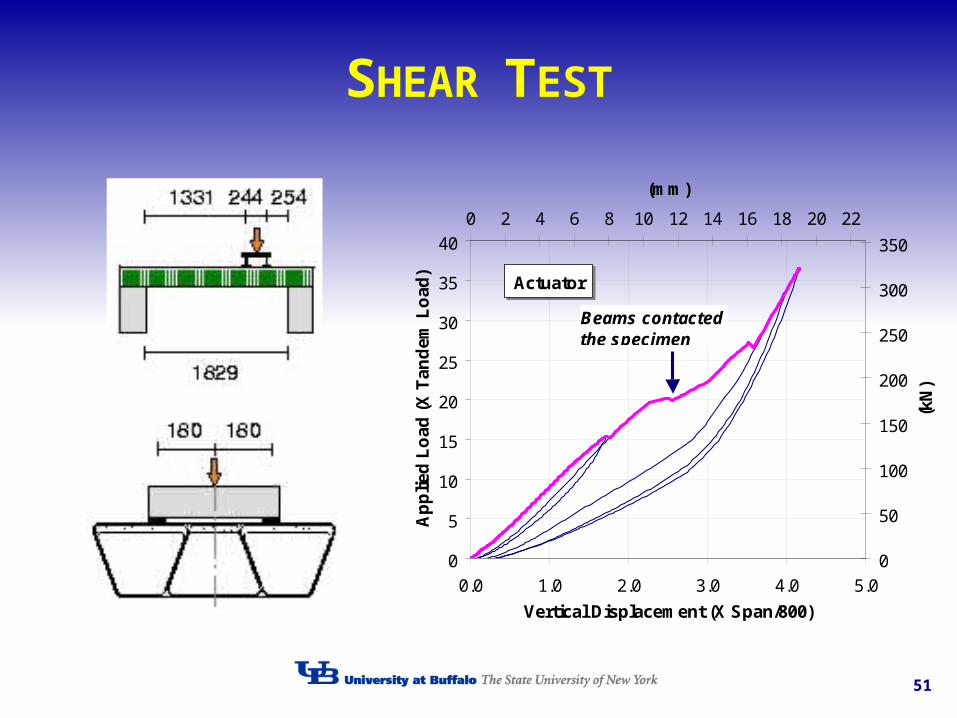
51
SHEAR TEST
0
5
10
15
20
25
30
35
40
0.0 1.0 2.0 3.0 4.0 5.0
Vertical Displacement (X Span/800)
Ap
pli
ed L
oad
(X
Tan
dem
Lo
ad)
0
50
100
150
200
250
300
350
0 2 4 6 8 10 12 14 16 18 20 22
(mm)
(kN
)
Actuator
Beams contacted the specimen

52
BEARING TEST
0
5
10
15
20
25
30
35
0.0 1.0 2.0 3.0 4.0 5.0
Vertical Displacement (x Span/800)
Ap
pli
ed L
oad
(x
Tan
dem
Lo
ad)
0
20
40
60
80
100
120
140
0 5 10 15 20
(mm)
(kN
)
Failure

53
BEARING TEST(FAILURE MODE)

54
FINITE ELEMENT ANALYSIS
ABAQUS
Four-noded general shell element, S4R,
for GFRP laminates
Eight-noded general 3D solid element,
C3D8, for concrete
Assumed a perfect bonding between
concrete and GFRP
Linear analysis
Nonlinear analysis

55
FINITE ELEMENT DISCRITIZATION (LINEAR ANALYSIS)
Number of nodes: 31,857
Number of elements: 38,892 (22,764 for S4R and 16,128 for C3D8)

56
LINEAR FEA RESULTS(FLEXURE – 1)
Stiffness was
predicted by
FEA within
5% error.
0.0
0.5
1.0
1.5
2.0
2.5
3.0
3.5
0.0 0.2 0.4 0.6 0.8 1.0 1.2 1.4
Vertical Displacement (X Span/800)
Ap
pli
ed L
oad
(X
Tan
dem
Lo
ad)
0
5
10
15
20
25
30
0.0 1.0 2.0 3.0 4.0 5.0 6.0
(mm)
(kN
)
Experiment
Linear FEA
G-BOT-C
G

57
LINEAR FEA RESULTS (FLEXURE – 2)
0.0
0.2
0.4
0.6
0.8
1.0
1.2
1.4
-0.40 -0.30 -0.20 -0.10 0.00 0.10 0.20 0.30 0.40
Location (m)
Ver
tica
l D
isp
lace
men
t (X
Sp
an/8
00)
0.0
1.0
2.0
3.0
4.0
5.0
6.0
(mm
)
ExperimentLinear FEA
2.5 x Tandem
2.0 x Tandem
1.5 x Tandem
1.0 x Tandem
0.5 x Tandem
G
0.0
0.2
0.4
0.6
0.8
1.0
1.2
1.4
-0.40 -0.30 -0.20 -0.10 0.00 0.10 0.20 0.30 0.40
Location (m)
Ver
tica
l D
isp
lace
men
t (X
Sp
an/8
00)
0.0
1.0
2.0
3.0
4.0
5.0
6.0
(mm
)
ExperimentLinear FEA
2.5 x Tandem
2.0 x Tandem
1.5 x Tandem
1.0 x Tandem
0.5 x TandemLoading point
H
(a) Top surface (b) Bottom surface

58
LINEAR FEA RESULTS(FLEXURE – 3)
0.0
0.1
0.2
0.3
0.4
0.5
0.6
0.7
0.8
0.9
1.0
-300 -200 -100 0 100 200 300 400 500
Longitudinal Strain (m)
Hei
gh
t /
Bri
dg
e H
eig
ht
0.5 x Tandem
1.0 x Tandem
1.5 x Tandem
2.0 x Tandem
2.5 x Tandem
Linear FEA
G
0.5 1.51.0 2.52.0
0
100
200
300
400
500
600
0.000 0.125 0.250 0.375 0.500
Location / Span Length
Lo
ng
itu
din
al S
trai
n (m )
0.5 x Tandem1.0 x Tandem1.5 x Tandem2.0 x Tandem
2.5 x TandemLinear FEA
Section C
Section
Section E
Section F
Section G
F GECA
0.5
1.5
1.0
2.5
2.0
(a) Bottom surface along the center-line
(b) Exterior web over height

59
FINITE ELEMENT DISCRETIZATION (NONLINEAR ANALYSIS)
A quarter model
x
y
Loadingpoint

60
NONLINEAR FEA RESULTS – 1
0
5
10
15
20
25
30
35
40
0 5 10 15 20 25
Vertical Displacement (X Span/800)
Ap
pli
ed L
oad
(X
Tan
dem
Lo
ad)
0
50
100
150
200
250
300
350
0 20 40 60 80 100
(mm)
(kN
)
Flexural TestFailureFRP only (Linear)Hybrid (Linear)FRP only (Nonlinear)Hybrid (Nonlinear)
G-BOT-C
G

61
NONLINEAR FEA RESULTS – 2 (DAMAGED AREA)
x
yy
xx
y
x
y
failure section
(a) FEA (b) Experiment
62
SIMPLE METHODS OF ANALYSIS Simple methods
– Beam analysis– Orthotropic plate analysis
Classical lamination theory
Use of effective engineering properties of laminates
Perfect bonding between concrete and GFRP was assumed.
Shear deformation was neglected
Primary objective is to obtain deflection under design loads.
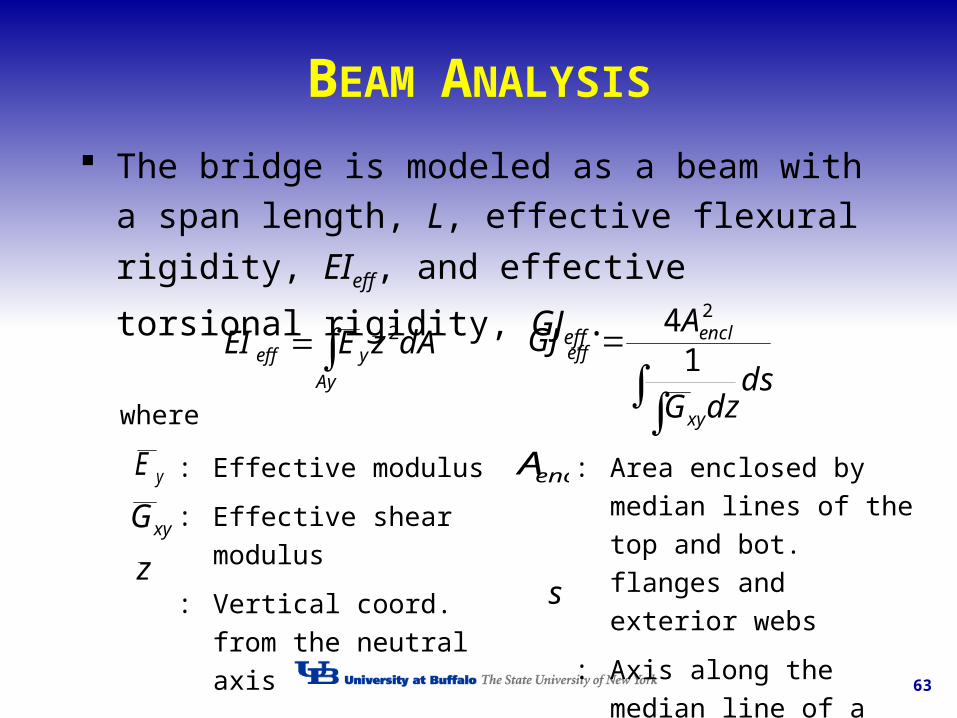
63
BEAM ANALYSIS
The bridge is modeled as a beam with a span
length, L, effective flexural rigidity, EIeff, and
effective torsional rigidity, GJeff.
Ay
yeff dAzEEI 2
ds
dzG
AGJ
xy
encleff 1
4 2
where
yE
z
xyG
: Effective modulus
: Effective shear modulus
: Vertical coord. from the
neutral axis
enclA
s
: Area enclosed by median
lines of the top and bot.
flanges and exterior webs
: Axis along the median line
of a component
64
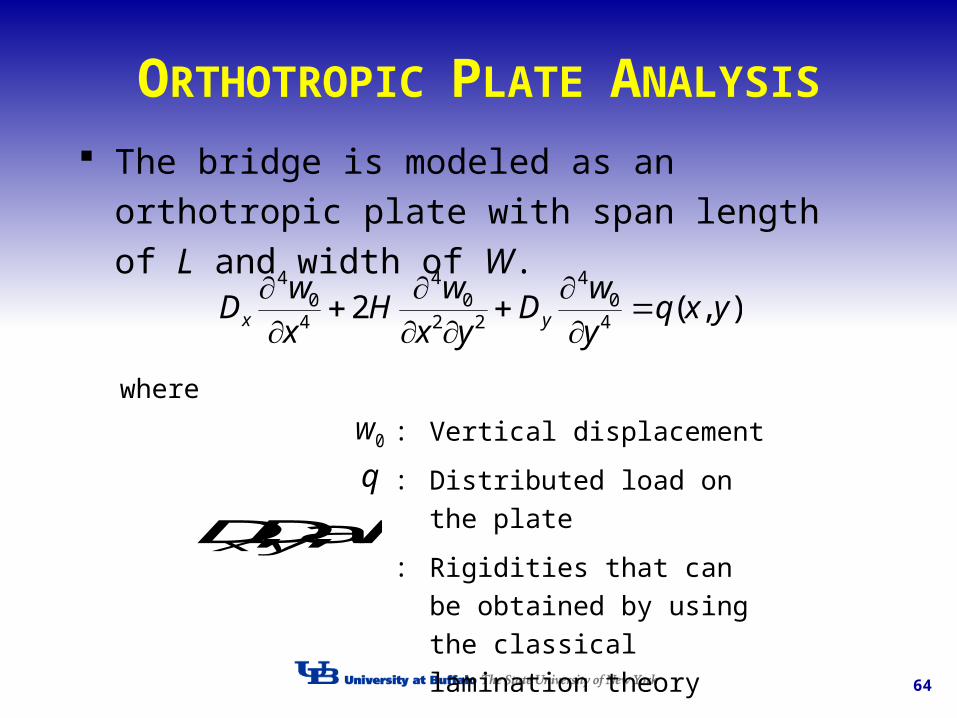
ORTHOTROPIC PLATE ANALYSIS
The bridge is modeled as an orthotropic plate
with span length of L and width of W.
),(2 40
4
220
4
40
4
yxqyw
Dyx
wH
xw
D yx
0w
q
HDD yx and , ,
: Vertical displacement
: Distributed load on the plate
: Rigidities that can be
obtained by using the
classical lamination theory
where
65
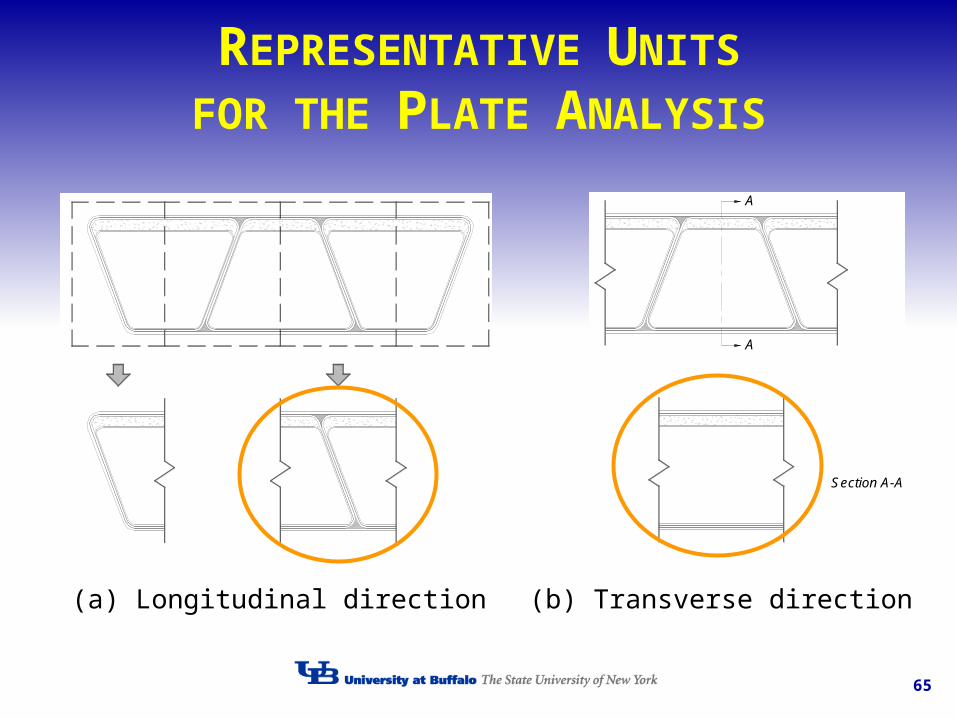
REPRESENTATIVE UNITS
FOR THE PLATE ANALYSIS
A
A
Section A-A
(a) Longitudinal direction (b) Transverse direction

66
SIMPLE METHODS OF ANALYSIS (UNDER TANDEM LOAD ONLY)
0.00
0.10
0.20
0.30
0.40
0.50
0.0 0.2 0.4 0.6 0.8 1.0
Y-coordinate (x Span)
Dis
pla
ce
me
nt
(x S
pa
n/8
00
)
FEA
Beam
Plate
0.00
0.10
0.20
0.30
0.40
0.50
-2.0 -1.0 0.0 1.0 2.0
X-coordinate (m)
Dis
pla
ce
me
nt
(x S
pa
n/8
00
)
FEA (Top) FEA (Bot)Beam Plate
(a) Transverse direction (b) Longitudinal direction

67
Summary Composite materials hold great promise for effective
renewal of deficient bridges.
The hybrid FRP-concrete bridge superstructure is highly feasible from the structural engineering point of view.
GFRP used in this study has revealed that its stress-strain relationship is not perfectly linear-elastic. However, for design purposes, the equivalent linear model can be used.

68
Summary (CONT’D)
As is often the case with all-composite bridges, the design of the hybrid bridge superstructure is also stiffness driven.
Results from a series of quasi-static tests have shown an excellent performance of the proposed hybrid bridge under live loads.
The beam and orthotropic plate simplified analyses have proven to be effective to accurately predict the deflection of the hybrid bridge under design loads.

69
Challenges
A systematic way to determine design parameters should be developed. It is also important to propose and optimize the design based on life-cycle cost as well as performance.
Long-term performance of FRP bridges is not yet established and should be investigated:
creep, fatigue, and material degradation.
Thermal effects on FRP bridges is still unknown and should be investigated.
Quality control concerns— the material properties are highly dependent on the manufacturing process.
70
Challenges (CONT’D)
Several practical aspects of FRP applications in
bridges need to be addressed by researchers.
The following are some of the outstanding
issues:– Methods to expand lanes– Methods to cast concrete– Considerations for negative moments– Concrete barrier or steel parapet– Support conditions

71
There are benefits in using light FRP deck
or superstructure in bridges located in
moderate and seismic regions.
Automated fabrication process must be
used to fabricate the FRP parts of the
superstructure or deck.
Challenges (CONT’D)
72
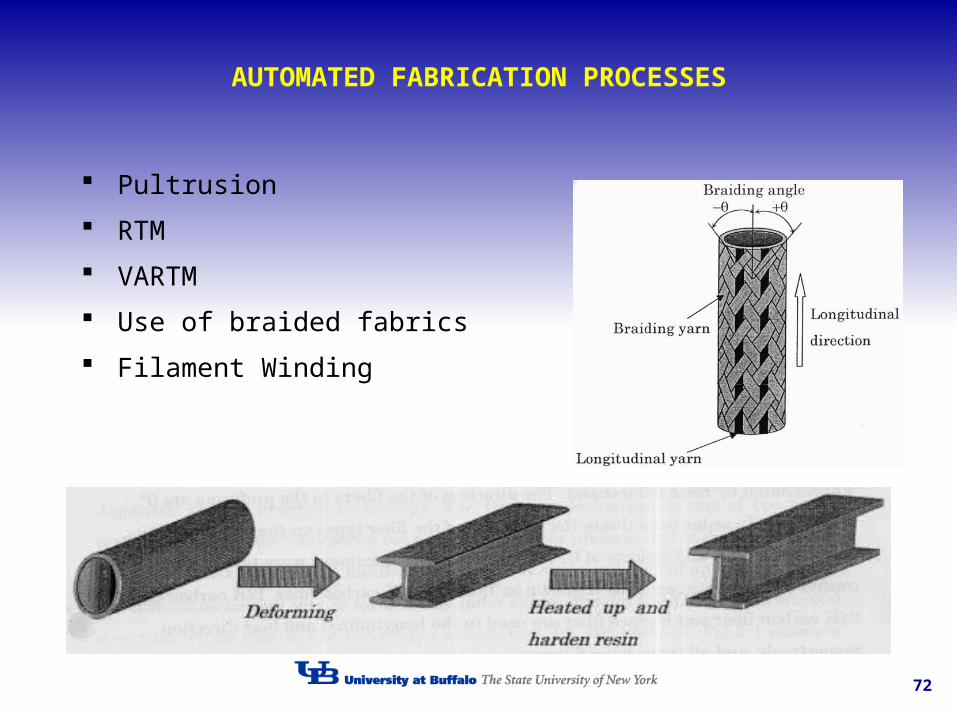
AUTOMATED FABRICATION PROCESSES
Pultrusion
RTM
VARTM
Use of braided fabrics
Filament Winding

73
Acknowledgment
Dr. Y. Kitane
Dr. W. Alnahhal
New York State Department of
Transportation
74
THANK YOUTHANK YOU