1-7 Crude Oil Infrastructure Paper - NPC · While consumption of refined petroleum products since...
60
Working Document of the NPC North American Resource Development Study Made Available September 15, 2011 Paper #1-7 CRUDE OIL INFRASTRUCTURE Prepared by the Oil Infrastructure Subgroup of the Resource & Supply Task Group On September 15, 2011, The National Petroleum Council (NPC) in approving its report, Prudent Development: Realizing the Potential of North America’s Abundant Natural Gas and Oil Resources, also approved the making available of certain materials used in the study process, including detailed, specific subject matter papers prepared or used by the study’s Task Groups and/or Subgroups. These Topic and White Papers were working documents that were part of the analyses that led to development of the summary results presented in the report’s Executive Summary and Chapters. These Topic and White Papers represent the views and conclusions of the authors. The National Petroleum Council has not endorsed or approved the statements and conclusions contained in these documents, but approved the publication of these materials as part of the study process. The NPC believes that these papers will be of interest to the readers of the report and will help them better understand the results. These materials are being made available in the interest of transparency. The attached paper is one of 57 such working documents used in the study analyses. Also included is a roster of the Subgroup that developed or submitted this paper. Appendix C of the final NPC report provides a complete list of the 57 Topic and White Papers and an abstract for each. The full papers can be viewed and downloaded from the report section of the NPC website (www.npc.org).
Transcript of 1-7 Crude Oil Infrastructure Paper - NPC · While consumption of refined petroleum products since...

Working Document of the NPC North American Resource Development Study
Made Available September 15, 2011
Paper #1-7
CRUDE OIL INFRASTRUCTURE
Prepared by the Oil Infrastructure Subgroup of the
Resource & Supply Task Group On September 15, 2011, The National Petroleum Council (NPC) in approving its report, Prudent Development: Realizing the Potential of North America’s Abundant Natural Gas and Oil Resources, also approved the making available of certain materials used in the study process, including detailed, specific subject matter papers prepared or used by the study’s Task Groups and/or Subgroups. These Topic and White Papers were working documents that were part of the analyses that led to development of the summary results presented in the report’s Executive Summary and Chapters. These Topic and White Papers represent the views and conclusions of the authors. The National Petroleum Council has not endorsed or approved the statements and conclusions contained in these documents, but approved the publication of these materials as part of the study process. The NPC believes that these papers will be of interest to the readers of the report and will help them better understand the results. These materials are being made available in the interest of transparency. The attached paper is one of 57 such working documents used in the study analyses. Also included is a roster of the Subgroup that developed or submitted this paper. Appendix C of the final NPC report provides a complete list of the 57 Topic and White Papers and an abstract for each. The full papers can be viewed and downloaded from the report section of the NPC website (www.npc.org).

Working Document of the NPC North American Resource Development Study
Made Available September 15, 2011
Page 2 of 60
Oil Infrastructure Subgroup Chair Don K. Thompson Vice President, Green Energy Enbridge Inc. Members Timothy J. Adams Vice President, Business Development and
Joint Ventures ExxonMobil Pipeline Company
Mark J. Gorman Senior Vice President, Business Development and Operations
Plains All American GP LLC
Morgan Keith Business Development Advisor Enbridge Pipelines Inc. Robert C. Lombardi Team Lead, Operations and Infrastructure Shell Gas Midstream Rafael Lopez Business Planning Advisor Enbridge Pipelines Inc. Damir Raos Business Planning Advisor Enbridge Pipelines Inc. Jeff M. Ray TAPS Coordinator ExxonMobil Pipeline
Company

Working Document of the NPC North American Resource Development Study
Made Available September 15, 2011
Page 3 of 60

Working Document of the NPC North American Resource Development Study
Made Available September 15, 2011
Page 4 of 60
Introduction Oil Infrastructure, the topic of this paper, is critical to the North American Energy supply chain that has evolved over the last century. For the purposes of this paper, Oil Infrastructure is limited to the pipeline transportation infrastructure that is available for liquid hydrocarbons in North America. While Marine, rail and trucking operations are all important components of the infrastructure, the lion share of North American oil product supply are still moved via pipeline. This subtopic paper follows and updates two previous National Petroleum Council detailed studies around Energy Infrastructure. The most recent detailed energy infrastructure study was conducted at the request of the Secretary of Energy in February 1987 and was completed in 1989. The previous study was conducted in 1984. Recognizing that fossil fuels will remain a critical component of the United States resource supply chain, this subtopic paper examines the current state of US and Canadian crude pipeline infrastructure and assess the changes that will be required in the future as additional new reserves are brought into production. This paper is divided into assessments of North America’s crude producing regions based on geography and market commonalities in each region. While traditionally reports and analyses of crude oil supply/demand use the Petroleum Administration for Defense Districts as the demarcation of each region, this report extends the PADD definitions to include more specific areas to reflect current and expected future regional dynamics. The following map provided by the Energy Information Agency of the U.S. Department of Energy shows the breakdown of the various PADD regions in the U.S.

Working Document of the NPC North American Resource Development Study
Made Available September 15, 2011
Page 5 of 60
The paper further divides the North American market into the following eight regions;
1. Midcontinent (currently part of PADD II) 2. United States Gulf Coast (abbreviated USGC and is part of PADD III) 3. Midwest (Northern part of PADD II) 4. Rocky Mountain (the same as PADD IV) 5. Western Canada including Washington State (Washington State is currently part of PADD V) 6. Eastern Canada 7. California (currently part of PADD V) 8. Alaska (currently part of PADD V)
The order of the regions is intentional, starting with the market clearing location for crude oil at Cushing, Oklahoma in the heart of the Midcontinent region. Most crude supply in PADD II, III and IV as well as Western Canada can reach Cushing, so we follow these supply routes back to their origins and review the oil infrastructure between each of the regions. The East Coast, or PADD I, has been excluded from consideration in this report. The PADD I area operates almost independently, relying on foreign crude oil imports (including imports from Eastern Canada) to meet regional crude oil demand. Mexico, while an important component of the North American crude supply has been accounted for as an import into United States Gulf Coast crude supply. Mexico’s market interaction with the rest of North America is relatively limited, while its crude production is in decline. This situation is not expected to change in the timeframe of the study. Western Canada has been included in the current review as the North American crude oil supply depends increasingly on imports from the Western Canadian Sedimentary Basin. As a result of its geographic proximity, and integrated supply and demand relationship with the United States, development of new pipeline infrastructure in the past several years has been dominated by oil infrastructure projects that reach across both sides of the Canada-U.S. border. Eastern Canada is included as a separate region due to the size of the refining market and the sourcing of crude oil supply from a combination of Western Canada, Offshore Jean D’Arc basin crude and imports of foreign crude. This region is also the supply source for some of the PADD I area refineries. For each region in this study each section will contain a background to the region, discuss its current supply and demand balances, explain the current status of its crude oil transportation corridors, and highlight current and future issues on infrastructure. The source data for the regional balances was taken from a combination of sources. For U.S. production, Energy Information Agency’s 2011 Annual Outlook was used out to 2035. For Canadian production, the Canadian Association of Petroleum Producers (CAPP) 2010 Crude Oil Forecast was used out to 2025. The Canadian production out to 2035 was linearly extrapolated from this forecast. For future refinery utilization, the rates were gradually ramped up, but capped at 95% of capacity in 2035. Total refinery capacity was assumed to grow by roughly 1.2 million barrels per day over the forecast period and is primarily attributed to refineries in the Mid-West and USGC regions.

Working Document of the NPC North American Resource Development Study
Made Available September 15, 2011
Page 6 of 60

Working Document of the NPC North American Resource Development Study
Made Available September 15, 2011
Page 7 of 60
Overview of Crude Oil Pipelines As of 2009, in the U.S. there were approximately 55,000 miles of crude oil trunk lines (typically 8 - 24 inches in diameter) that are used to connect the North American market regions. This number excludes tens of thousands of miles of gathering lines used to move crude from production fields to trunk lines, refined products lines to move products from refinery to market, and LPG lines used to move other commodities such as propane and ethane. In the time since the last NPC study, conducted in 1987-1989, the U.S. has seen significant shifts in supply and demand for crude. While consumption of refined petroleum products since the last study has only grown marginally, total imports of foreign crude into the U.S. has nearly doubled from just over six million barrels per day in 1987 to almost thirteen million barrels per day in 2009. This is a continuation of the trend of falling domestic U.S. production, a trend well underway at the time of the last study. One of the most significant changes in the dynamics of the U.S. crude transportation has occurred over the past decade as the U.S. trended away from its reliance on waterborne imports, towards imports from Western Canada. Since the most recent report in 1987, imports of Canadian crude oil have tripled to nearly 2.5 million barrels per a day, with nearly forty percent of that growth occurring in the past decade. The direct impact of this shift is highlighted by changes in the Midwest and Rocky Mountain Regions. In the Midwest, many of the pipeline networks were originally established with the expressed purpose of supplying domestically produced light crude from Texas and the United States Gulf Coast region to large refining hubs in PADD II. Northbound corridors from Cushing, Oklahoma and St. James, Louisiana once formed the backbone of the crude oil pipeline infrastructure in the Mid-Continent, USGC and Midwest regions. Now, they are becoming increasingly redundant as the demand for southbound capacity grows. The same situation is occurring in the Rocky Mountain Region where a growing surplus of light Rocky mountain crude supply, coupled with increasing availability of Canadian supply and lower refinery demand has overwhelmed takeaway pipeline capacity on the Rockies to Midwest Interregional Corridor. Similarly, growth of alternative crude supplies in the Mid-Continent, coupled with growth in Canadian production is causing an imbalance in the traditional market dynamics around the Gulf Coast Region. The expected surge in future offshore domestic production combined with Canadian imports and the capacity of current infrastructure will likely reduce the requirement for the Gulf Coast to increase foreign crude import capability. Similar to the PADD I region, the West Coast Region, consisting of PADD V excluding Alaska, remains a largely independent market from the rest of the U.S. and faces a unique set of issues. California has no intraregional or interregional pipelines. There was an interregional pipeline corridor in operation when the last NPC study was completed in the late 1980’s however the system has since been partially converted to natural gas service, a result of declining production and dwindling throughput. Regional crude production has fallen to less than half of what it was at the time of the last NPC study and now stands at just less than 1.3 million barrels per a day. With little historical need for waterborne import infrastructure, and the age of some current facilities approaching fifty years, the California Energy Commission has forecasted the need for significant expansion of waterborne import facilities and tankage by 2030 to accommodate imports. In spite of the shifts in market dynamics since the previous NPC study, the Mid-Continent region, specifically Cushing, OK remains the nexus of North American crude supply and movements. As of

Working Document of the NPC North American Resource Development Study
Made Available September 15, 2011
Page 8 of 60
2008, Cushing holds 5 to 10 percent of the total U.S. crude inventory and it remains the price settlement point for the benchmark West Texas Intermediate on the NYMEX. Several major pipeline corridors service the Cushing hub, including supply from the Western Canadian Sedimentary Basin, making the Cushing hub and surrounding region strategic importance to North American market dynamics. In addition to evolving market dynamics, a pressing issue for the network of crude oil pipelines across North America will be the age of existing infrastructure combined with encroachment from urban development and concerns around public safety. Together these issues will likely lead to increasingly stringent regulatory environment where additional capital will be required to enhance the safety and securing of oil infrastructure in North America. The overarching trend in oil infrastructure is the requirement to respond to shifting market dynamics caused by changing sources of domestic supply and evolving transfer corridor capacity requirements. The emergence of alternative crude sources in the Western Canadian Sedimentary Basin and North Dakota’s Bakken play is pushing Midwest and Mid-Continent pipelines to realign existing infrastructure to back out traditional imports from the Gulf Coast in favor of growing supply from the north.

Working Document of the NPC North American Resource Development Study
Made Available September 15, 2011
Page 9 of 60
I. MID-CONTINENT REGION
A. Regional Overview The midcontinent region includes the states of Oklahoma, Kansas, Missouri, New Mexico and onshore portions of Texas. This area is dominated by the Permian Basin which has provided a substantial portion of the supply through the middle of the last century. Historically, the Permian provided supply to most of the large refining regions in the Midwest, USGC and Midcontinent. Refineries The Midcontinent region includes 19 refineries with a total atmospheric crude distillation capacity of roughly 1.4 million bpd; Since the last NPC study was completed in the late 1980’s, total operable crude oil distillation capacity in the region has grown at approximately 0.75% per year. This is shown in Table I-1. Refining capacity is assumed to operate at 85% of installed capacity through 2035. This capacity is approximately 1.384 million bpd.
USGC
RockiesES
Mid-‐West

Working Document of the NPC North American Resource Development Study
Made Available September 15, 2011
Page 10 of 60
Table 1: Operable Crude Oil Distillation Capacity – thousand bpd By State
Year New Mexico Texas OK-KS-MS Total
1990 78 518 688 1,284
1995 95 559 680 1,334
2000 96 575 716 1,387
2005 113 580 739 1,432
2009 133 574 728 1,435
Oil Production As shown in Table I-2, oil production in this region declined by over 900 thousand bpd over the past two decades. Interestingly, production in this region has stabilized and even increased over the past five years. Oil production declined from approximately 2.5 million bpd in 1990 to approximately 1.5 million bpd in 2005, an average annual decline rate of 3.4%. The downward trend reversed from 2005 to 2009 and oil production grew at an average annual rate of 1.25%, increasing by 75 thousand bpd to approximately 1.5 million bpd. Note that the annual production figures for Texas are the total production from the state which includes production from the Texas Gulf Coast Refining District. Table I-2: Annual Oil Production - thousand bpd
Year New Mexico Texas OK-KS-MS Total 1990 184 1,859 460 2,503 1995 174 1,532 364 2,070 2000 184 1,211 285 1,680 2005 166 1,062 263 1,491 2009 168 1,106 292 1,566
Using data from the latest EIA Annual Energy Outlook, the production from this region is forecast to modestly grow over the next twenty years at a rate of just under 1% per year. The source of the growing volumes is assumed to be from shale oils associated around the Permian. Beyond 2035, the production is assumed to revert to natural decline. Table I-3: Annual Oil Production – thousand bpd Forecast
Year Total 2015 1,768 2020 2,000 2025 2,095 2030 2,095 2035 1,845
B. Regional Infrastructure
Working Document of the NPC North American Resource Development Study
Made Available September 15, 2011
Page 11 of 60
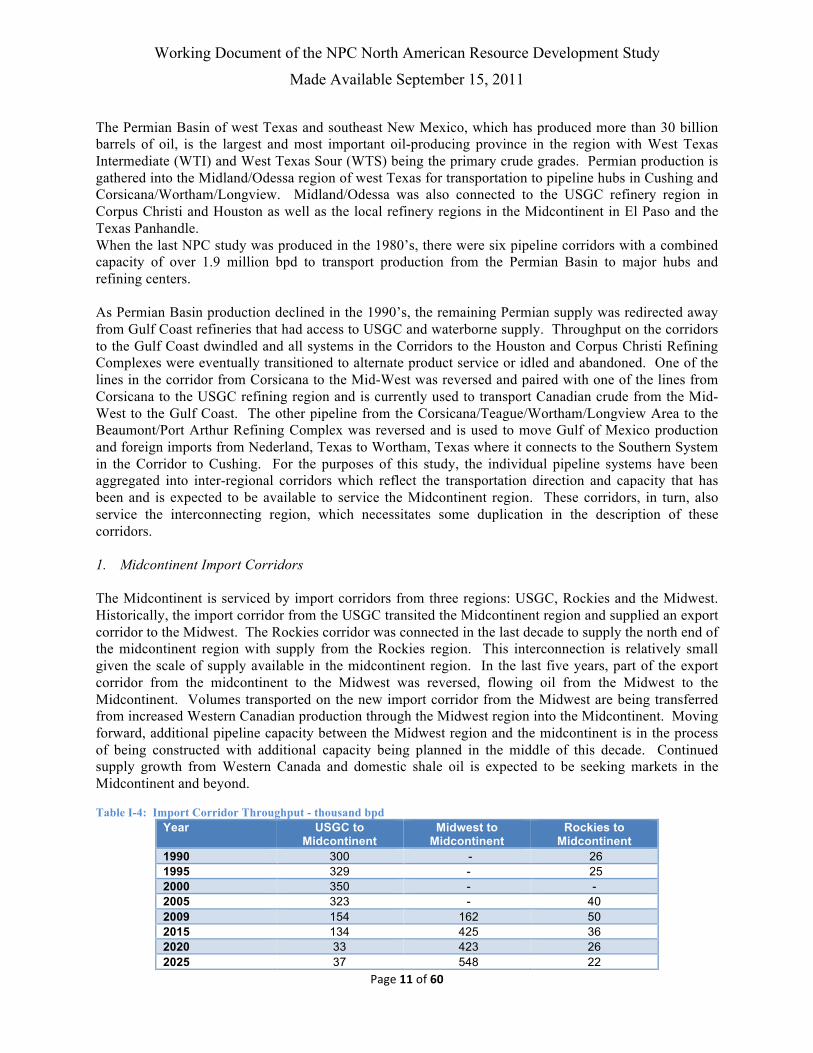
The Permian Basin of west Texas and southeast New Mexico, which has produced more than 30 billion barrels of oil, is the largest and most important oil-producing province in the region with West Texas Intermediate (WTI) and West Texas Sour (WTS) being the primary crude grades. Permian production is gathered into the Midland/Odessa region of west Texas for transportation to pipeline hubs in Cushing and Corsicana/Wortham/Longview. Midland/Odessa was also connected to the USGC refinery region in Corpus Christi and Houston as well as the local refinery regions in the Midcontinent in El Paso and the Texas Panhandle. When the last NPC study was produced in the 1980’s, there were six pipeline corridors with a combined capacity of over 1.9 million bpd to transport production from the Permian Basin to major hubs and refining centers. As Permian Basin production declined in the 1990’s, the remaining Permian supply was redirected away from Gulf Coast refineries that had access to USGC and waterborne supply. Throughput on the corridors to the Gulf Coast dwindled and all systems in the Corridors to the Houston and Corpus Christi Refining Complexes were eventually transitioned to alternate product service or idled and abandoned. One of the lines in the corridor from Corsicana to the Mid-West was reversed and paired with one of the lines from Corsicana to the USGC refining region and is currently used to transport Canadian crude from the Mid-West to the Gulf Coast. The other pipeline from the Corsicana/Teague/Wortham/Longview Area to the Beaumont/Port Arthur Refining Complex was reversed and is used to move Gulf of Mexico production and foreign imports from Nederland, Texas to Wortham, Texas where it connects to the Southern System in the Corridor to Cushing. For the purposes of this study, the individual pipeline systems have been aggregated into inter-regional corridors which reflect the transportation direction and capacity that has been and is expected to be available to service the Midcontinent region. These corridors, in turn, also service the interconnecting region, which necessitates some duplication in the description of these corridors. 1. Midcontinent Import Corridors The Midcontinent is serviced by import corridors from three regions: USGC, Rockies and the Midwest. Historically, the import corridor from the USGC transited the Midcontinent region and supplied an export corridor to the Midwest. The Rockies corridor was connected in the last decade to supply the north end of the midcontinent region with supply from the Rockies region. This interconnection is relatively small given the scale of supply available in the midcontinent region. In the last five years, part of the export corridor from the midcontinent to the Midwest was reversed, flowing oil from the Midwest to the Midcontinent. Volumes transported on the new import corridor from the Midwest are being transferred from increased Western Canadian production through the Midwest region into the Midcontinent. Moving forward, additional pipeline capacity between the Midwest region and the midcontinent is in the process of being constructed with additional capacity being planned in the middle of this decade. Continued supply growth from Western Canada and domestic shale oil is expected to be seeking markets in the Midcontinent and beyond. Table I-4: Import Corridor Throughput - thousand bpd
Year USGC to Midcontinent
Midwest to Midcontinent
Rockies to Midcontinent
1990 300 - 26 1995 329 - 25 2000 350 - - 2005 323 - 40 2009 154 162 50 2015 134 425 36 2020 33 423 26 2025 37 548 22

Working Document of the NPC North American Resource Development Study
Made Available September 15, 2011
Page 12 of 60
2030 32 700 21 2035 89 845 40
Imports from the USGC have fallen from historical levels and are assumed to continue to decline to the end of the forecast period. The rationale for this assumption is a result of domestic and Western Canadian supply growing substantially beyond their local markets which will require the supply to seek out markets outside of the traditional markets in the Midwest and Eastern Canada. Substantial capacity will be required to accommodate the increased supply through the Midwest region. 2. Midcontinent Export Corridors Traditionally, the Midcontinent Export corridors were focused on exports to the USGC region and the Midwest region. The traditional export routes are expected to continue through 2035, but at substantially different volume expectations. The export route to the USGC has diminished substantially since the early 1990’s reflecting the drop in domestic production from the Permian basin. The corridor to the Midwest has remained relatively full, reflecting the traditional supply logistics for the Midwest refineries which are connected to the midcontinent. As supply from Western Canada and new oil domestic oil shale is added to the Midwest region, the Midwest demand for Midcontinent crude oil is expected to fall and be diverted to the USGC. The change in distribution patterns is likely to facilitate reversal of existing export capacity between the Midcontinent region and the Midwest region. For the export corridor to the USGC, some of the original export capacity that was in place in the early 1990’s is no longer available for crude service, having been placed in gas service or being idled. With the substantial increase in export requirements, reconversion, reactivation or new capacity will be required between the Midcontinent and the USGC. Table I-5: Export Corridor Throughput - thousand bpd
Year Midcontinent to USGC
Midcontinent to Midwest
1990 1500 389 1995 754 327 2000 384 481 2005 27 378 2009 21 476 2015 354 351 2020 490 305 2025 826 161 2030 1,000 102 2035 1,000 44
C. Intra-Regional Infrastructure The largest physical crude hub in the Mid-Continent is at Cushing, Oklahoma. A number of major crude oil corridors from different regions in North America intersect at Cushing. This central hub location has facilitated Cushing’s role as a major crude oil trading and storage location with an approximately 50 million barrels of storage capacity and additional 10 million barrels planned or under construction. Within the Midcontinent region, substantial pipeline capacity exists connecting the Permian as well as the Kansas-Oklahoma basins with refinery centers and the pipeline hubs. With the growth in oil shale in the Permian, additional infrastructure will be required to facilitate production. D. Current Issues:

Working Document of the NPC North American Resource Development Study
Made Available September 15, 2011
Page 13 of 60
Permian Basin Takeaway Capacity- In Permian Basin, takeaway pipelines have capacity to accommodate additional volumes but the feeder systems into the Midland/Odessa Area are full. Existing feeder lines need to be expanded or new lines built.
Oklahoma and Kansas Takeaway Capacity- The same problem that exists in the Permian exists in Oklahoma and Kansas. Small diameter feeder lines that move local production to refineries and to Cushing are full. Existing lines need to be expanded and/or new feeder systems constructed. Age and maintenance- All the major systems have been in service since the 1950’s. Inspection and maintenance expenditures are expected to continue to escalate. Beyond cost, scheduling downtime for repairs is becoming difficult as volumes are ramping up. Takeaway Capacity- There is a potential imbalance between the volume of storage in Cushing, Oklahoma, the amount of take away pipeline capacity and connected markets, to handle the short term loading and unloading of the Cushing storage.

Working Document of the NPC North American Resource Development Study
Made Available September 15, 2011
Page 14 of 60
II. US GULF COAST REGION
A. Regional Overview The US Gulf Coast (USGC) region includes the coastal and offshore portions of the states of Louisiana and Texas, and the coastal processing hubs along Louisiana and Texas. The onshore portions of the state of Texas and the northern section of Louisiana are included in the Midcontinent region. This area is dominated by the offshore production gathered by the two states, which is largely consumed by the local coastal refineries. Historically, the USGC has been a major exporter into the Midwest and an importer from the Midcontinent. The USGC has also been a significant importer of overseas crude into the region. Refineries The USGC region includes 46 refineries with a total atmospheric crude distillation capacity of roughly 7.9 million bpd. Since the last NPC study was completed in the late 1980’s, total operable crude oil distillation capacity in the region has grown at approximately 1% per year. This is shown in Table II-1. Refining capacity is
Foreign Imports
Mid-‐Continent Mid-‐West
Working Document of the NPC North American Resource Development Study
Made Available September 15, 2011
Page 15 of 60
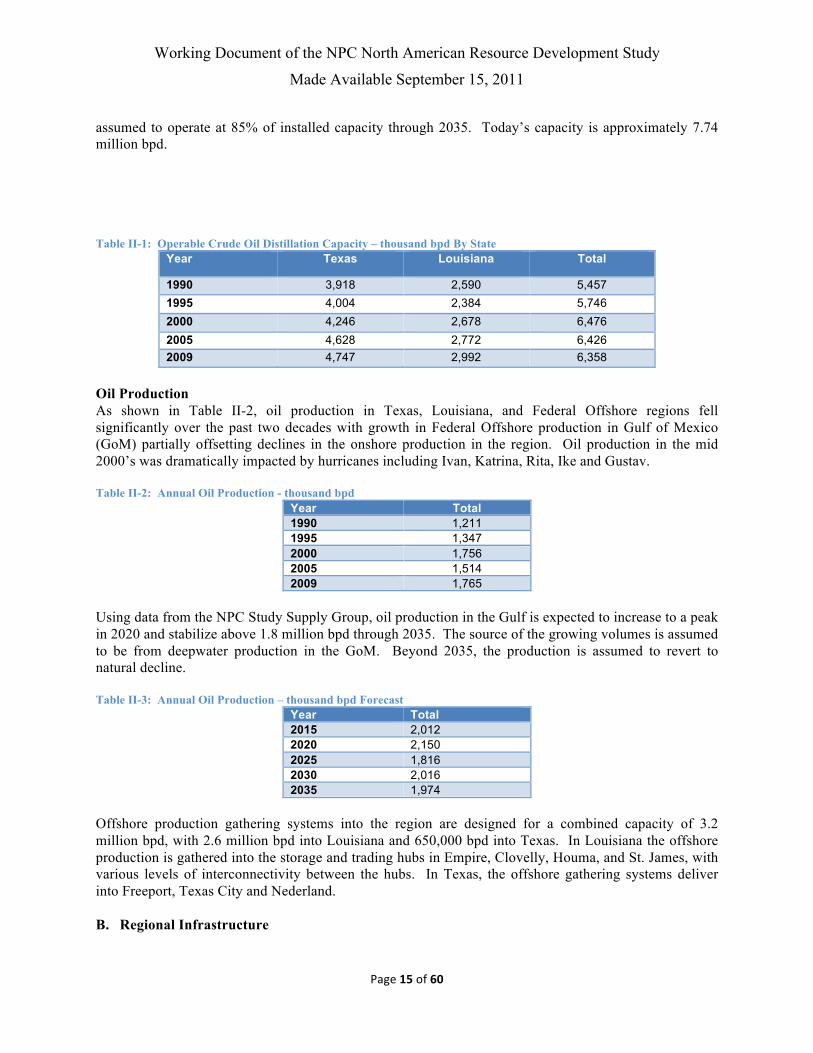
assumed to operate at 85% of installed capacity through 2035. Today’s capacity is approximately 7.74 million bpd. Table II-1: Operable Crude Oil Distillation Capacity – thousand bpd By State
Year Texas Louisiana Total
1990 3,918 2,590 5,457
1995 4,004 2,384 5,746
2000 4,246 2,678 6,476
2005 4,628 2,772 6,426
2009 4,747 2,992 6,358
Oil Production As shown in Table II-2, oil production in Texas, Louisiana, and Federal Offshore regions fell significantly over the past two decades with growth in Federal Offshore production in Gulf of Mexico (GoM) partially offsetting declines in the onshore production in the region. Oil production in the mid 2000’s was dramatically impacted by hurricanes including Ivan, Katrina, Rita, Ike and Gustav. Table II-2: Annual Oil Production - thousand bpd
Year Total 1990 1,211 1995 1,347 2000 1,756 2005 1,514 2009 1,765
Using data from the NPC Study Supply Group, oil production in the Gulf is expected to increase to a peak in 2020 and stabilize above 1.8 million bpd through 2035. The source of the growing volumes is assumed to be from deepwater production in the GoM. Beyond 2035, the production is assumed to revert to natural decline. Table II-3: Annual Oil Production – thousand bpd Forecast
Year Total 2015 2,012 2020 2,150 2025 1,816 2030 2,016 2035 1,974
Offshore production gathering systems into the region are designed for a combined capacity of 3.2 million bpd, with 2.6 million bpd into Louisiana and 650,000 bpd into Texas. In Louisiana the offshore production is gathered into the storage and trading hubs in Empire, Clovelly, Houma, and St. James, with various levels of interconnectivity between the hubs. In Texas, the offshore gathering systems deliver into Freeport, Texas City and Nederland. B. Regional Infrastructure

Working Document of the NPC North American Resource Development Study
Made Available September 15, 2011
Page 16 of 60
The USGC can be separated between the Louisiana corridor and the Texas corridor. In Louisiana, the main trading hubs are Clovelly, Houma and St James, with the majority of the export systems supporting these hubs. In Texas, the main hubs are Beaumont/Port Arthur, Houston, and Texas City/Freeport. Local production in the region supports various crude types, including sweet crudes (Light Louisiana Sweet (LLS), South Louisiana Sweet (SLS) and Heavy Louisiana Sweet (HLS)), intermediate sour crudes (Bonito Sour (BS) and Eugene Island Sour (EIS)), and heavier sour crudes (including Mars Blend, Poseidon and Southern Green Canyon (SGC)). The Louisiana corridor hubs are connected to the Midwest region and the Midcontinent region for oil export and import, while the Texas Corridor hubs are connected to the Midcontinent region. Traditionally, the Louisiana hubs were an exporter of crude to the Patoka, Il and Cushing, OK markets, while the Texas hubs were an importer from the Permian basin. With access to local offshore production and waterborne barrels, the region has shifted away from imports from other regions and has relied heavily upon local production supplemented by overseas imports. As has happened in other regions, as the crude production shifts, the pipeline corridor service and flow directions shift to accommodate supply and demand needs. Many pipelines connecting to the Midcontinent region have done just this in the recent past. The USGC is also supported by numerous waterborne import terminals throughout the region with an estimated combined capacity of 5.5 million bpd into the various refineries and hubs. 2. USGC Import Corridors The USGC is serviced by import corridors from the Midwest and Midcontinent regions. Historical import capacity into the USGC region was dominated by imports from the Midcontinent through the Permian Basin. As the flow of oil from the Permian basin has shifted from the USGC to the Midwest, the connecting pipeline corridors have adapted to shifting market demands and have been either idled, reversed, or changed service, leaving minimal connectivity today of 96,000 bpd from the Midcontinent and 60,000 bpd from the Midwest into the region. With the continued development of crude oil production in Western Canada and domestic shale production in the Midwest and Midcontinent, numerous pipeline projects have been announced to meet transportation needs and deliver additional crude into the USGC. These new projects are expected to increase the import capacity into the USGC from the Midwest by up to one thousand bpd. In addition, several new pipeline systems have been contemplated to connect the south Texas domestic shale into the USGC, further increasing the interregional import capacity into the USGC. Table II-4: Import Corridor Throughput - thousand bpd Year Midcontinent to
USGC West Coast to
USGC Midwest to USGC Offshore imports
1990 1,500 113 - 3,887 1995 754 199 - 4,629 2000 384 - - 5,693 2005 27 - - 6,125 2009 21 - 96 5,185 2015 354 - 72 5,017 2020 490 - 86 4,637 2025 826 - 82 4,688 2030 1,000 - 96 4,308 2035 1,000 - 96 4,558
2. USGC Export Corridors

Working Document of the NPC North American Resource Development Study
Made Available September 15, 2011
Page 17 of 60
Traditionally, the USGC served as a major exporter of crude, both of local production and overseas imports, into the Midcontinent and Midwest regions, with an existing pipeline capacity of 1.1 million bpd from the region into the Midwest and 930,000 bpd pipeline capacity into the Midcontinent. Since 1990, the amount of exports into the two regions has dropped by nearly 50%. This trend of decline in exports is anticipated to continue to a point where the export corridors will be at minimum operating capacities as supply from Western Canada and new domestic oil shale is added to the Midwest and Midcontinent regions, resulting in a diversion away from imports from the USGC. In spite the falling utilization of USGC Export Corridors to the Mid-West and Mid-Continent, it is critical that infrastructure remain open to ensure energy security and market optionality for refiners in these respective regions. Table II-5: Export Corridor Throughput - thousand bpd
Year USGC to Midcontinent
USGC to Midwest
1990 300 1,085 1995 329 1,130 2000 350 957 2005 323 918 2009 154 583 2015 134 490 2020 33 386 2025 37 315 2030 32 215 2035 89 250
C. Intra-Regional Infrastructure The USGC is broken into refinery and trading hubs in both Louisiana and Texas. Within these hubs, the refinery centers maintain connectivity to both pipeline infrastructure, as well as waterborne capabilities for crude supplies. Louisiana and Texas are each connected to other regions through interregional pipeline corridors which operate in batched systems serving multiple common stream crude types in order to protect crude quality. The offshore systems support area developments of consistent crude types, and deliver defined types to each hub. Sweet, intermediate, and sour crudes are all delivered to the hubs. Break-out, or operational storage is required at the hubs to manage the complex scheduling and batching process required to efficiently meet demand and to minimize quality degradation. Within the region, the main connecting pipeline system between Louisiana and Texas was originally built to deliver crude from Louisiana and Texas into the Port Arthur area. As crude diets and market demand shifted, the western leg was reversed to deliver crude from Louisiana to Texas. Today, this system remains the only interconnection between Eastern Louisiana and the Western Texas crude hubs. D. Current Issues: Deepwater connectivity- The original offshore systems were developed to support the shelf production. As the production moved further offshore, the systems were modified to meet the needs of the deepwater development. Deepwater laterals are generally built to connect into the existing shallow water infrastructure, which in turn deliver into the trading hubs. As the deepwater production delivers heavier and more viscous crudes, the capacities to deliver large volumes of new production over longer distances
Working Document of the NPC North American Resource Development Study
Made Available September 15, 2011
Page 18 of 60
are being tested. In addition, pressure ratings and available capacities to bring large volume platform production will be challenged. Deepwater growth, such as in Keathley Canyon, is also moving to newer areas of the GoM away from the existing pipeline infrastructure. The shift will require additional export infrastructure to support this development growth. Offshore developments farther away from existing infrastructure may also lead to further development of Floating Production, Storage and Offloading technology (“FPSO”) and shuttle tankers. The Cascade/Chinook development slated to begin production in 2010 will be the first use of FPSO technology in the GoM. Hurricane / Mudslides- Hurricanes Ivan, Katrina/Rita, and Gustav/Ike wreaked havoc on the offshore pipeline systems. Mudslides in the Mississippi delta region physically moved pipelines and in some cases caused releases. Wind and waves damaged production platforms as well as offshore pipeline hubs throughout the gulf and anchor drags resulted in additional pipeline damages. Pipeline shifts that cause crossing damages and create loss of natural gas supply to pump stations are additional issues faced in the offshore environment. Going forward, more stringent regulations on platforms and connections may impact the growth of pipeline systems in the GoM. Capacity to move volume from Louisiana to Texas- There is currently only one onshore crude system capable of delivering crude from the trading hubs in Louisiana into Texas. This system has been prorated at times as crude imports shift from water borne to domestic offshore production in Texas based on market conditions, refinery diet and risk trends. Macondo Impacts- The long term impacts of the BP release at Macondo, including regulatory uncertainty and cost impacts, are unknown at this time. Shale Oil Infrastructure- The potential growth of the Eagle Ford shale developments in South Texas is not currently supported by the infrastructure to bring large volumes into the USGC existing infrastructure.

Working Document of the NPC North American Resource Development Study
Made Available September 15, 2011
Page 19 of 60
III. MID-‐WEST REGION
A. Regional Overview The US Mid-West is located in the northern part of PADD II and represents a critical logistical hub for nationwide crude oil transportation and storage. The US Mid-West is the manufacturing heartland of the US, generating nearly 20% of the US’ national GDP. For a variety of reasons, roughly 2.8 million bpd of refining capacity is located in this region, making it the third largest refining market in the US after the US Gulf Coast and California. Also, by virtue of its geography, the Mid-West is strategically located between two major North American sources of crude supply: WCSB (Western Canadian Sedimentary Basin) to the northwest and the Permian Basin in Texas, to the southwest. It’s also home to the Williston basin in North Dakota, which has been a growing source of unconventional light crude supply in recent years. The region’s geographic attributes significantly favor pipeline transportation over any other form of energy transportation. Flat terrain with limited exposure to waterways makes pipeline construction cost-
USGC
Mid-‐Continent
Eastern Canada
Western Canada
Rockies

Working Document of the NPC North American Resource Development Study
Made Available September 15, 2011
Page 20 of 60
effective while precluding large tanker shipping from being a viable alternative. Additionally, proximity to the Canada/US border makes the Mid-West a natural point of entry for Canadian crude oil.

Working Document of the NPC North American Resource Development Study
Made Available September 15, 2011
Page 21 of 60
Refineries Total refining capacity in the Mid-West has been relatively stable for the past twenty years, increasing only modestly, by 233 thousand bpd (or 9%) since 1985 (Table III-1), most of which is concentrated in the northeastern states of Indiana and Illinois. Refinery utilization in the region has averaged just above 90% between 2005 and 2010. While this is higher than the national average, the long term refinery utilization trend is in the decline, and has exhibited a 10% drop since the peak in 1997. The region’s current utilized capacity is about 2.5 million bpd. Table III-1: Operable Crude Oil Distillation Capacity By Refining District – thousand bpd
Year IN-IL-KY MI-WI-ND-SD Total
1990 2,223 343 2,566
1995 2,339 388 2,727
2000 2,450 421 2,871
2005 2,362 426 2,788
2009 2,370 447 2,817
The Mid-West’s relatively high heavy crude processing capability compared to the other refining markets in the US, reflects high degree of refinery configuration complexity and makes the region a suitable candidate for receipts of Canadian crude, the bulk of which is heavy crude. At the beginning of 2010, weighted average heavy processing capability in the Mid-West was approximately 27% of total distillation capacity, implying a nominal heavy crude processing capability of around 680,000 bpd. Actual receipts of Canadian heavy crude into PADD II (Mid-West and Mid-Continent) were, as of 2009, close to regional refineries’ physical ability to process them. This growing imbalance between the supply of heavy crude from Canada and constrained local refinery demand has in recent years instigated a spate of refinery expansion projects aimed at increasing heavy crude processing capacity. WRB Refining, BP and Marathon have all committed to multi-billion dollar refinery upgrade projects which will increase heavy crude processing capacity in the region by approximately 500 thousand bpd. Most of these projects are slated for completion by 2012. Following these changes, Mid-West’s weighted average heavy processing capacity will increase from the current 28% to 44%. Oil Production Table III -2: Historical Annual Oil Production By Refining District- thousand bpd
Year IN-IL-KY MI-WI-ND-SD Total 1990 122 160 282 1995 96 115 211 2000 75 114 189 2005 63 117 180 2009 60 239 299
Just as with the Mid-Continent’s oil production profile, Mid-West’s production declined at an average rate of 3% per year between 1990 and 2005 (Table III-3). This trend has reversed since 2005 however, mostly due to improvements in exploration techniques that have led to a rapid growth of unconventional drilling in the Bakken play in North Dakota and Saskatchewan.

Working Document of the NPC North American Resource Development Study
Made Available September 15, 2011
Page 22 of 60
In only the past five years, North Dakota’s production has more than doubled, skewing the regional production distribution significantly in favor of the MI-WI-ND-SD refining district. Whereas the regional production was evenly balanced between the two districts in 1990, with the MI-WI-ND-SD district accounting for 57% of overall Mid-West’s production; by 2009 that balance has shifted to the point where MI-WI-ND-SD district accounts for 80% of the regional production. As Table III-3 shows, EIA’s long-term production outlook suggests that the production has far from peaked and that the intra-regional production re-balancing that’s been taking place since 2005 will take on a higher level of significance and lead to inter-regional rebalancing by 2035. Based on the production outlook, Mid-West will lay claim to 9% of the US national oil production by 2020; more than a two fold increase since 1990. Table III-3: Annual Oil Production Forecast – Midwest Region - thousand bpd
Year Total 2015 448 2020 547 2025 543 2030 544 2035 539
B. Regional Infrastructure While the overall growth in pipeline capacity in the US has been anemic in the past twenty years, the pace of development in the Mid-West has been an exception. In only the past couple of years the industry has expanded Mid-West’s pipeline capacity by 1.8 million bpd. This dichotomy in cross-regional construction activity reflects a broader trend of declining production of crude from conventional sources in the southern US, reduction of foreign imports through the USGC, replaced by increase in supply north of the border. Historically, Mid-West’s regional crude demand has been met through a combination of domestic crude receipts from the south, via Cushing, Canadian imports from the North via the Enbridge pipeline, overflow of supply from the Rockies region to the West and foreign crude supply from the USGC. Between 1990 and 2000, Mid-West’s reliance on foreign crude supply increased. This trend was supported by the declining conventional Canadian crude production, low pricing environment and a relatively uneventful geopolitical landscape. In the past decade, however, those underlying factors have changed. Losses of conventional production north of the border have been overshadowed by Western Canada’s unconventional production which has seen unprecedented growth with few viable and large scale outlets besides the Mid-West. This production growth has been supported not only by significantly higher petroleum prices, but also by the decline in heavy crude production from the Foreign traditional producers: Venezuela and Mexico. As a result, incremental Canadian production has been systematically displacing foreign imports from the South and filling in the shortfall caused by the declining Permian basin production. Imports of Canadian crude into the Mid-West have nearly doubled in the past fifteen years, increasing from 762 thousand bpd in 1995 to approximately 1.2 million bpd in 2009, making Canada the most significant crude exporter to the US. The transportation industry has been quick to respond to these changing crude supply patterns. Between 1990 and 2010, a number of infrastructure adaptations have been made to respond to changing market dynamics;
• 220 thousand bpd of originally northbound capacity has been reversed and put into southbound service to facilitate incremental unconventional crude supply growth from Canada;
• 1.8 million bpd of expansion capacity has been brought into service;

Working Document of the NPC North American Resource Development Study
Made Available September 15, 2011
Page 23 of 60
• Three large refineries have undergone multi-billion dollar expansions and reconfigurations to accommodate processing of heavier Canadian feed-stocks
The agility with which the industry has responded to these shifting trends has been aided, in most cases, by over 70% of capacity expansions utilizing existing pipeline rights of way. Historically, the Mid-West has been, and will continue to be the most critical entry point for Canadian imports to the US. With only marginal refined product demand growth in North America over the next two and a half decades and limited expected refining capacity additions in the Mid-West, incremental Canadian imports will have to find an outlet beyond the Mid-West. While the Mid-West has been able to absorb incremental imports from Canada by displacing foreign imports from the USGC import corridor, the ability to curtail additional foreign imports will be outpaced by the volume growth of incremental imports from the North. Throughput along the Western Canadian Import corridor is expected to double over the next 25 years; and this is contingent on a conservative assumption that Western Canadian supply penetrates further into the Eastern Canadian market via the Mid-West. Given the Mid-West’s location, Eastern Canada, Mid-Continent and the Rockies are its only viable export corridors. The Rockies and existing USGC corridors have limited capacity and are fully utilized. The capacity along the export corridor from the Mid-West to the Rockies is expected to increase in the future, largely in response to the growing crude supply from the Bakken deposit in North Dakota; however infrastructure growth opportunities along this the corridor are limited by the small size of the Rockies refining market which has traditionally been supplied from Canada. This implies that the inbound crude from the North to the Mid-West must penetrate further south to the Mid-Continent and ultimately to the large USGC refining market where the potential to displace incremental foreign crude remains high. 1. Mid-West Import Corridors Table III-4: Import Corridor Throughput – thousand bpd
Year Western Canada to Mid-West
Midcontinent to Mid-West
Rockies to Mid-West
USGC to Mid-West
1990 1,035 389 106 1,085 1995 1,183 327 55 1,130 2000 1,192 481 93 957 2005 1,263 378 114 918 2009 1,539 476 162 583 2015 2,123 351 143 490 2020 2,315 305 145 386 2025 2,712 161 141 315 2030 3,103 102 145 215 2035 3,320 44 145 250
Western Canada – Mid-West The bulk of Canadian crude imports enters the US, through North Dakota and runs south-east to Chicago, Illinois. In response to the rapid growth of Oil Sands production north of the border, the corridor was expanded between 2009 and 2010 by 850,000 bpd and again in 2010 by 435,000 bpd. Throughput along this corridor is expected to rise steadily, reaching capacity in 2035. Growth will be particularly strong in the period between 2020 and 2030 when all other export corridors from Western Canada reach saturation. Rockies – Mid-West
Working Document of the NPC North American Resource Development Study
Made Available September 15, 2011
Page 24 of 60
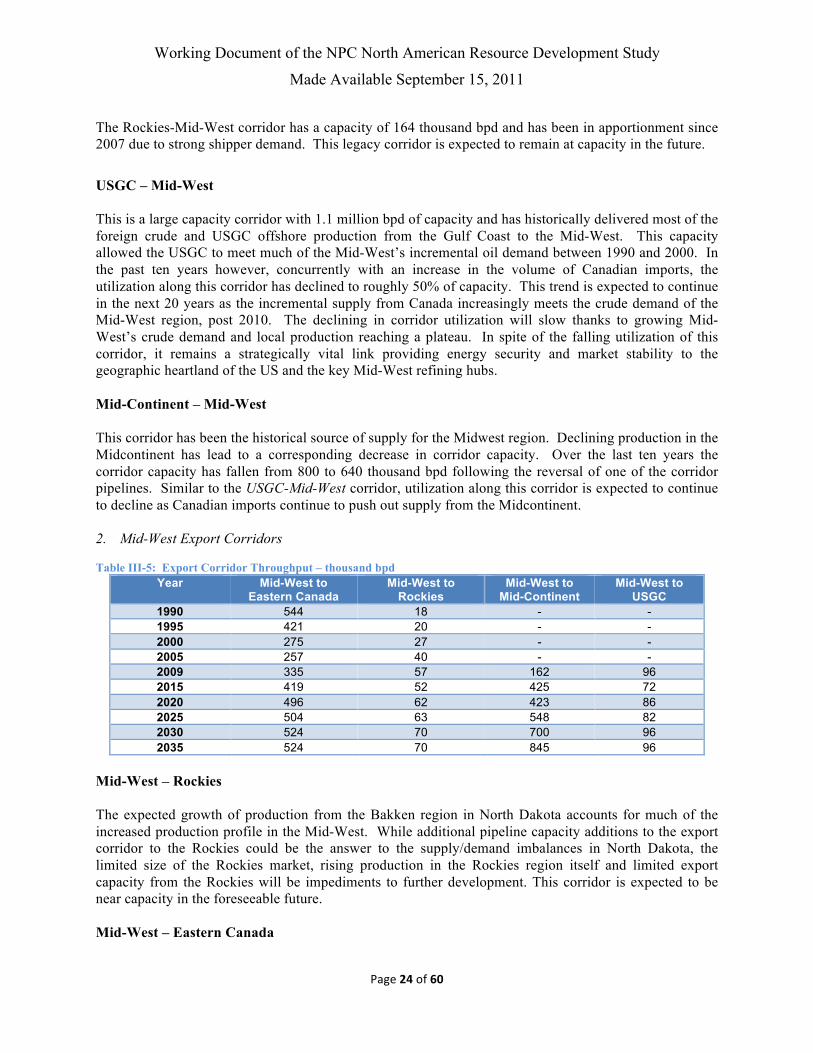
The Rockies-Mid-West corridor has a capacity of 164 thousand bpd and has been in apportionment since 2007 due to strong shipper demand. This legacy corridor is expected to remain at capacity in the future. USGC – Mid-West This is a large capacity corridor with 1.1 million bpd of capacity and has historically delivered most of the foreign crude and USGC offshore production from the Gulf Coast to the Mid-West. This capacity allowed the USGC to meet much of the Mid-West’s incremental oil demand between 1990 and 2000. In the past ten years however, concurrently with an increase in the volume of Canadian imports, the utilization along this corridor has declined to roughly 50% of capacity. This trend is expected to continue in the next 20 years as the incremental supply from Canada increasingly meets the crude demand of the Mid-West region, post 2010. The declining in corridor utilization will slow thanks to growing Mid-West’s crude demand and local production reaching a plateau. In spite of the falling utilization of this corridor, it remains a strategically vital link providing energy security and market stability to the geographic heartland of the US and the key Mid-West refining hubs. Mid-Continent – Mid-West This corridor has been the historical source of supply for the Midwest region. Declining production in the Midcontinent has lead to a corresponding decrease in corridor capacity. Over the last ten years the corridor capacity has fallen from 800 to 640 thousand bpd following the reversal of one of the corridor pipelines. Similar to the USGC-Mid-West corridor, utilization along this corridor is expected to continue to decline as Canadian imports continue to push out supply from the Midcontinent. 2. Mid-West Export Corridors Table III-5: Export Corridor Throughput – thousand bpd
Year Mid-West to Eastern Canada
Mid-West to Rockies
Mid-West to Mid-Continent
Mid-West to USGC
1990 544 18 - - 1995 421 20 - - 2000 275 27 - - 2005 257 40 - - 2009 335 57 162 96 2015 419 52 425 72 2020 496 62 423 86 2025 504 63 548 82 2030 524 70 700 96 2035 524 70 845 96
Mid-West – Rockies The expected growth of production from the Bakken region in North Dakota accounts for much of the increased production profile in the Mid-West. While additional pipeline capacity additions to the export corridor to the Rockies could be the answer to the supply/demand imbalances in North Dakota, the limited size of the Rockies market, rising production in the Rockies region itself and limited export capacity from the Rockies will be impediments to further development. This corridor is expected to be near capacity in the foreseeable future. Mid-West – Eastern Canada
Working Document of the NPC North American Resource Development Study
Made Available September 15, 2011
Page 25 of 60
With growing supply of Western Canadian and Midwest domestic crude supply, the Mid-West region is expected to increase exports into the Eastern Canadian region, returning to levels of exports achieved in the early 1990’s. Mid-West – Mid-Continent This corridor was created in 2006 through a reversal of 125 thousand bpd of originally northbound capacity, substantially improving the marketability of western Canadian crude. In 2009, the corridor was expanded to 190 thousand bpd and due to a high shipper demand has been operating at capacity ever since. This limitation was somewhat alleviated in 2010, through the addition of 155 thousand bpd of new capacity. Future utilization of this corridor is expected to closely track the utilization of the Western Canada – Mid-West corridor. With the relatively flat refining demand outlook for the Mid-West, the southbound export outlet to the Mid-Continent will be critical in handling incremental future production and Canadian imports from the Mid-West to the USGC market. Increases in capacity along this corridor are largely still in the planning stages. Of the 840 thousand bpd of anticipated capacity only 345 thousand bpd is currently in place. If required, additional capacity could be put in service relatively quickly, through reversals of legacy northbound corridors (Mid-Continent to Mid-West) where import utilization is on the decline. Mid-West – USGC This corridor was also created through an existing pipeline reversal in 2006 and is currently the only southbound route which brings crude oil from the Mid-West to the USGC. Even though the capacity was increased by 50% to 96,000 bpd, in 2009, the corridor is at capacity and is expected to remain so for the foreseeable future. C. Intra-Regional Infrastructure The Mid-West has over two million bpd of internal pipeline capacity which is critical in routing crude supply to refineries throughout the region. Refinery regions in Chicago, Minneapolis and Wood River are all interconnected by crude oil supply pipelines which allow these refineries to source a variety of feedstock from various sources and crude qualities. D. Current Issues: Lack of Sufficient export Capacity Lack of export corridor capacity from the Mid-Continent to the USGC, coupled with the unprecedented growth of import capacity has created infrastructure imbalances in the Mid-West. Legacy northbound import corridors like Mid-Continent-Mid-West and USGC-Mid-West that once formed the backbone of the Mid-West’s crude supply are now seeing utilization fall. These two corridors account for 1.7 million bpd of inbound pipeline capacity into the Mid-West market. By contrast, the aggregate outbound capacity via the Mid-West – USGC and Mid-West – Mid-Continent corridors is only 441 thousand bpd. Whereas the Mid-West’s refinery demand justified a large amount of northbound capacity in the past, in the future the change in supply flows from the North will be more critical in shaping the region’s infrastructure.

Working Document of the NPC North American Resource Development Study
Made Available September 15, 2011
Page 26 of 60
Lack of Capacity for local Production Unconventional production out of the Bakken formation in North Dakota has increased dramatically in recent years. Due to the dispersed nature of shale exploration as well as limited local demand, North Dakota’s market has created a large local surplus of light crude in the region with insufficient pipeline infrastructure. One of the more pressing challenges for the industry will be in extending the reach of North Dakota’s supply to the Mid-Continent market and other export markets. Age and maintenance All of the major systems have been in service since the 1950’s. Inspection and maintenance expenditures are expected to continue to escalate. Beyond cost, scheduling downtime for repairs is becoming challenging as supply continues to increase. IV. ROCKY MOUNTAIN REGION
A. Regional Overview
Western Canada
Mid West
Mid-‐Continent

Working Document of the NPC North American Resource Development Study
Made Available September 15, 2011
Page 27 of 60
The Rocky Mountain region includes the four states that comprise PADD IV: Colorado, Montana, Utah and Wyoming. The Big Horn, Wind River, Greater Green River, Powder River, Denver Julesburg and Williston basins are the primary production basins in the Rocky Mountain Region and account for the vast majority of all oil production in the region. The Bakken Field in the Williston Basin, which straddles Northeast Montana and Northwest North Dakota and extends north across the U.S. – Canadian border into Southern Saskatchewan, has responded to recent investment and advancements in drilling technology and represent areas of significant potential growth. Refineries The Rocky Mountain region includes 18 refineries with a total atmospheric crude distillation capacity of approximately 600 thousand bpd. Total operable crude oil distillation capacity in the region has increased approximately 12% since the last NPC study was completed in the late 1980’s. As shown in Table IV-1, capacity initially declined 8% from 1990 to 1995, but then grew at approximately 1% per year from 1995 through 2009. Table IV-1: Operable Crude Oil Distillation Capacity – thousand bpd By State
Year Colorado Montana Utah Wyoming Total
1990 91 140 155 170 556
1995 86 142 151 130 509
2000 85 162 162 132 541
2005 87 181 167 152 587
2009 102 187 167 166 622
Refinery utilization in the Rocky Mountain region fell with the recent economic downturn and was 87% in 2010. Utilization rates are assumed to gradually increase throughout the forecast period, reaching 95% in 2035. The refinery demand projections for the forecast period are detailed in Table IV-2. Table IV-2: Annual Refining Inputs – thousand bpd Forecast
Year Total 2015 554 2020 563 2025 573 2030 582 2035 592
Oil Production Oil production in Rocky Mountain region decline was 28% since the last NPC study was completed in the late 1980’s, but production volumes have been growing during the past decade. As shown in Table IV-3, production fell 40% between 1990 and 2000. The downward trend reversed from 2000 to 2009 and oil production grew 19% to nearly 360 thousand bpd. Table IV-3: Annual Oil Production - thousand bpd
Year Colorado Montana Utah Wyoming Total 1990 83 76 76 285 498 1995 77 55 55 216 393 2000 50 43 43 166 301

Working Document of the NPC North American Resource Development Study
Made Available September 15, 2011
Page 28 of 60
2005 63 46 46 141 340 2009 78 63 63 141 357
Production is projected to continue to grow during the forecast period. The EIA is projecting that production will continue to increase at 2% per year over the next twenty five years. The source of the growing volumes is assumed to be from shale oils. Beyond 2035, the production is assumed to revert to natural decline. Table IV-4: Annual Oil Production – thousand bpd Forecast
Year Total 2015 460 2020 403 2025 435 2030 423 2035 429
B. Regional Infrastructure Refineries in the Rocky Mountain region process supply from the region and imports from Western Canada and the Midwest. The largest physical crude hub in the region is at Guernsey, Wyoming. A variety of light, medium and heavy grades of crude oil are received at Guernsey from regional pipelines, and import pipelines from Western Canada and the Midwest and redistributed to refineries in the Rockies. Supply in excess of refinery demand is exported from Guernsey to the Midwest. 1. Rocky Mountain Import Corridors The Rocky Mountain region is serviced by import corridors from two regions: Western Canada and the Midwest. The corridors have a combined capacity of just less than 500 thousand bpd. When the last NPC study was produced in the 1980’s, the capacity from Western Canada to the Rockies was approximately 195 thousand bpd. Since then market dynamics have evolved and industry has responded to the changing infrastructure demands. As production in the Rockies declined nearly 200 thousand bpd during the 1990’s, additional imports from Western Canada were required to meet refinery demand and the capacity of the corridor was expanded in stages to its current 430 thousand bpd. No additional capacity expansions from Western Canada to the Rockies are being discussed and none have been incorporated into the forecast. The capacity of the import corridor from the Midwest has not changed since the last NPC study was conducted and remains 65 thousand bpd. Production from the Bakken field in North Dakota is expanding rapidly and several projects that could increase import capacity from the Midwest are being discussed, however this study assumes that import capacity from the Midwest remains at the current level throughout the forecast period. Table IV-5: Import Corridor Throughput - thousand bpd
Year Western Canada to
Rockies Midwest to Rockies 1990 76 18 1995 125 20 2000 213 27 2005 332 40 2009 338 57 2015 220 52 2020 269 62

Working Document of the NPC North American Resource Development Study
Made Available September 15, 2011
Page 29 of 60
2025 237 63 2030 255 70 2035 277 70
2. Rocky Mountain Export Corridors Traditionally, the Rocky Mountain export corridors were focused on exports to the Midwest, and to a lesser degree the Midcontinent. When the last NPC study was produced in the 1980’s, the corridor capacity from Rockies to Midwest was approximately 330 thousand bpd and utilization was less than 40%. As production in the Rockies continue to decline during the 1990’s, throughput to the Midwest continued to drop off and one system in the corridor was converted to natural gas service reducing corridor capacity to 145 thousand bpd. The increase in regional production discussed earlier, coupled with increasing availability of Canadian supply and lower refinery demand in the region during the recent economic downturn, has overwhelmed takeaway capacity to the Midwest and the corridor has operated at 100% of capacity for several years. Exports to the Midwest are projected to continue to run at the upper end of the capacity of the corridor throughout the forecast period. Historically, a limited amount of Rocky Mountain production was exported to the Midcontinent through a small interconnection between the Rocky Mountain/Midwest Corridor and the Midwest/Midcontinent corridor. A direct corridor was constructed during the past five years connecting the Rocky Mountain region to the Cushing hub in the Midcontinent. The corridor has limited capacity and throughput is not projected to exceed 50 thousand bpd during the forecast period. Table IV-: Export Corridor Throughput - thousand bpd
Year Rockies to Midwest Rockies to
Midcontinent 1990 106 26 1995 55 25 2000 93 - 2005 114 40 2009 162 50 2015 143 36 2020 143 26 2025 141 22 2030 145 21 2035 145 40
C. Intra-Regional Infrastructure The largest physical crude hub in the Rocky Mountain region is at Guernsey, Wyoming. The Western Canada and Midwest import corridors, the Midwest export corridor and several intra-regional corridors intersect at Guernsey. Within the Rocky Mountain region, substantial pipeline capacity exists connecting the producing basins with refinery centers and the pipeline hubs. D. Current Issues: Takeaway Capacity- A growing surplus of light Rocky mountain crude supply, coupled with increasing availability of Canadian supply and lower refinery demand during the recent economic downturn, has overwhelmed takeaway pipeline capacity on the Rockies to Midwest Interregional Corridor.

Working Document of the NPC North American Resource Development Study
Made Available September 15, 2011
Page 30 of 60
Age and maintenance- All the major systems have been in service since the 1950’s. Inspection and maintenance expenditures are expected to continue to escalate. Beyond cost, scheduling downtime for repairs on some systems is becoming difficult because the systems are running close to capacity.

Working Document of the NPC North American Resource Development Study
Made Available September 15, 2011
Page 31 of 60
V. WEST COAST (EXCLUDING ALASKA)
A. Regional Overview The West Coast Region, consisting of PADD V excluding Alaska, remains a largely independent market from the rest of the U.S. and faces a unique set of issues. California, which dominates the region in terms of oil production and refining capacity, has no pipeline access to neighboring regions. There was pipeline corridor in operation between California and the USGC when the last NPC study was completed in the late 1980’s however the system has since been partially converted to natural gas service, a result of declining production and dwindling throughput. In addition, local crude production has fallen to less than half of what it was at the time of the last NPC study and now stands at just less than 1.3 million barrels per a day. Combining the lack of interconnecting infrastructure with lower local production has resulted in growing demand for waterborne import infrastructure. This requirement, along with the age of the current import facilities led the California Energy Commission to forecast the need for significant expansion of waterborne import facilities and tankage by 2030. Refineries
Western Canada
Alaska
Foreign Imports

Working Document of the NPC North American Resource Development Study
Made Available September 15, 2011
Page 32 of 60
The West Coast region, comprised of Arizona, California, Hawaii, Nevada, Oregon and Washington, has 28 refineries with a total atmospheric crude distillation capacity of approximately 2.8 million bpd. Since the last NPC study was completed in the late 1980’s, total operable crude oil distillation capacity in the region initially declined approximately 200 thousand bpd between 1990 and 1995 and then slowly expanded back to just more than 2.8 million bpd. This is shown in Table V-1. The vast majority of West Coast refining capacity is located in three refining hubs centered in Los Angeles, San Francisco and the Puget Sound area in Washington. Table V-1: Operable Crude Oil Distillation Capacity – thousand bpd By State
Year Arizona California Hawaii Nevada Washington Total 1990 10 2,206 132 5 491 2,844
1995 4 1,910 148 7 565 2,634
2000 0 1,982 148 5 601 2,736
2005 0 2,026 148 2 616 2,792
2009 0 2,061 148 2 628 2,839
Refinery utilization in the West Coast region varied between 87% and 93% of capacity between 1990 and 2009 before dropping to 80.1% in 2010 as a result of the economic downturn. Utilization rates are assumed to ramp-up modestly over the forecast period, but remain below the levels between 1990 and 2005, reaching 88% in 2035. The refinery demand projections for the forecast period are detailed in Table V-2 Table V-2: Annual Refining Inputs – thousand bpd Forecast
Year Total 2010 2,277 2015 2,320 2020 2,363 2025 2,406 2030 2,450 2035 2,493
Oil Production The crude oil supply network associated with the West Coast is relatively isolated from the rest of the North American crude oil supply network. The major crude oil production areas on the West Coast are in California and Alaska. Alaskan production and the associated infrastructure are discussed in detail in a separate section of this paper. As shown in Table V-3, total West Coast and Alaskan production declined 350 thousand bpd over the past two decades, an average annual decline rate of 2.2%. Table V-3: Annual Oil Production - thousand bpd
Year California
Federal Offshore California Nevada Total
1990 879 82 11 973 1995 764 196 4 965 2000 741 96 2 839 2005 631 73 1 705 2009 567 60 1 629
Nearly all West Coast production outside of Alaska is in California where production totaled 629 thousand bpd in 2009. About 70% was produced in the San Joaquin Valley/Bakersfield area of Central

Working Document of the NPC North American Resource Development Study
Made Available September 15, 2011
Page 33 of 60
California. All oil produced in California and the adjacent state and federal offshore areas is refined in California. Over the past two decades production in California has declined at an average annual rate of slightly more than 2% per annum. The production forecasts for the West Coast and Alaska are detailed in Table V-4. Production from the West Coast region is forecast to continue to decline through the forecast period at 2% per year. Similarly, Alaskan production will decline by 2% per year through 2030 and then increase during the remaining five years of the forecast period. Table V-4: Annual Oil Production – thousand bpd Forecast
Year West Coast Region 2015 544 2020 531 2025 498 2030 471 2035 552
B. Regional Infrastructure Total crude tower capacity in the West Coast Region is approximately 2.7 million bpd. Over 92% of the refining capacity is located in three refining hubs centered near Los Angeles (1.1 million bpd), San Francisco (800 thousand bpd) and the Puget Sound area in Washington (600 thousand bpd). Total crude tower capacity exceeds oil produced in the region by nearly 2.1 million bpd. The shortfall between production and refinery runs is primarily offset by waterborne shipments of ANS from Alaska and foreign crude oil imports. West Coast Import Corridors The West Coast region is serviced by import corridors from three regions: marine deliveries from Alaska, marine imports from foreign sources and a pipeline corridor from Western Canada. Historical and forecasted throughputs on each corridor are detailed in Table V-5. Marine deliveries from Alaska have been a critical source of supply for West Coast refiners. When the last NPC study was produced, approximately 50% of the crude oil processed on the West Coast was imported from Alaska and this remained the case from 1990 to 1995. From 1995 to 2000, Alaskan production experienced a sharp decline, dropping over 500 thousand bpd (see Table V-3) and shipments from Alaska to the West Coast bore the full brunt of the decline and more, dropping more than 560 thousand bpd. The decline in both Alaskan production and shipments to the West Coast has continued for the past ten years and Alaskan production now accounts for less than 20% of the oil refined on the West Coast. This trend is projected to continue over the forecast period and imports from Alaska are projected to drop to less than 10% of refinery inputs on the West Coast by 2015 and to less than 5% by 2020. Marine imports of foreign crude to the West Coast have grown significantly as West Coast production and marine deliveries from Alaska have declined. At the time of the last NPC study, marine imports of foreign crude oil accounted for approximately 5% of total annual refinery inputs on the West Coast; marine imports of foreign crude increased to approximately 40% of total annual refinery inputs by 2009. This trend is projected to continue throughout the forecast period as refinery utilization increases and West Coast production and Alaskan production continue to decline. Marine imports of foreign crude oil to the West Coast are projected to grow by 10% per year through 2015 and reach 65% of total annual refinery inputs on the West Coast in 2015. From 2015 forward, growth is forecasted at 1% per year and

Working Document of the NPC North American Resource Development Study
Made Available September 15, 2011
Page 34 of 60
marine imports are projected to reach 75% of total annual refinery inputs on the West Coast by the end of the forecast period. Net marine receipts on the West Coast – the increase in marine imports of foreign crude less the decrease in marine deliveries of Alaskan crude – are projected to grow by over 700 thousand bpd during the forecast period. Existing marine facilities have limited excess capacity to handle throughput above current levels. The forecast assumes that additional facilities will be developed to accommodate the projected growth. The pipeline corridor from Western Canada has been in service since the 1950’s and services refineries in Western Canada as well as the Puget Sound area in Washington The portion of the corridor servicing the Puget Sound area has a capacity of approximately 155 thousand bpd. This segment of the corridor has operated at capacity for the past several years and is projected to remain full throughout the forecast period. No additional capacity expansions from Western Canada to the Puget Sound have been incorporated into the forecast. Table V-5: Import Corridor Throughput - thousand bpd
Year Alaska to West
Coast Marine Imports to
West Coast Western Canada to
West Coast 1990 1,371 132 100 1995 1,206 205 102 2000 640 598 107 2005 532 937 120 2009 403 898 144 2015 184 1,442 150 2020 108 1,574 150 2025 92 1,666 150 2030 0 1,823 155 2035 60 1,726 155
2. West Coast Export Corridors The West Coast region has no remaining export corridors. At the time of the last NPC study in the late 1980’s an export corridor that transported California production from California to a hub near Midland, Texas was in service. The corridor had a capacity of 360 thousand bpd and throughput was in excess of 100 thousand bpd in the 1990’s. In response to the changing infrastructure needs brought through shifts in supply and demand, the system was partially converted to natural gas service. C. Intra-Regional Infrastructure The largest physical crude hub in the West Coast region is in the San Joaquin Valley of Central California. Within California, substantial pipeline capacity exists connecting the San Joaquin Valley producing basins with refinery centers and in Los Angeles and San Francisco. D. Current Issues Minimum Flow Rates on Intraregional Pipeline - Most San Joaquin Valley production is heavy crude oil (18 degree API Gravity or less). The transportation of heavy crude through pipelines is complicated by the viscosity and inertia of the oil. Some of the crude oil pipeline systems require external heating and booster stations are placed at intervals on the line where heating and/or pumping units facilitate the flow of the crude through the line. The proximity of booster stations is determined by the viscosity of the

Working Document of the NPC North American Resource Development Study
Made Available September 15, 2011
Page 35 of 60
crude and by the average heat loss from the pipes from ambient weather conditions. As throughput on a heated pipeline declines, transit time between heating/pumping stations increases, resulting in lower line temperatures and difficulties pumping the crude. The systems cannot be operated below certain minimum throughput levels. In the coming years this may lead to system consolidations and lower total capacity in crude oil service. California Marine Facilities- As California production declines, the necessity for waterborne import facilities will grow significantly. With limited incremental dock capacity in Los Angeles and San Francisco, the California Energy Commission has forecasted the need to expand the existing marine import infrastructure in Southern California. It is forecasted that up to 15 million barrels of additional storage tank capacity by 2030 will be required to handle the incremental imports of crude oil. Additionally, the Marine Oil Terminal Engineering and Maintenance Standards (MOTEMS) became an enforceable part of the California Building Code in 2006 and engineering audits for high risk marine oil terminals will be required. The average age of marine oil terminals in California is over 50 years which is close to the design life of a typical facility. As such, many facilities may not comply with the new standards without significant capital outlays. Environmental Permitting Process- The environmental permitting process for new infrastructure projects in California is extremely difficult, leading to longer development time and higher project costs at a time when responsiveness in growing infrastructure demands are crucial.

Working Document of the NPC North American Resource Development Study
Made Available September 15, 2011
Page 36 of 60
VI. CANADA A. Regional Overview The Canadian market is logistically divided into the Western and Eastern regions. Western Canada includes the production region known as the Western Canadian Sedimentary Basin (WCSB) principally located in the provinces of British Columbia, Alberta and Saskatchewan. Eastern Canada includes Ontario and Quebec and the crude oil producing Atlantic Coast provinces of Newfoundland & Labrador and Nova Scotia. Refineries Canada’s refining market is relatively small and is geographically dispersed. As of 2010, Canada’s total refining capacity was approximately 2 million bpd and has declined in recent years, due to capacity consolidations in Eastern Canada.
Figure 1. Canadian Refining Market (Capacity Distribution) (CAPP) The result of refinery closures has been an increase in refinery utilization rates increasing over the past 10 years, to average over 91% over the same time period. Despite the recession-induced decline in utilization in 2009, long-term utilization trend and refinery capacity growth outlook reflect a tightly balanced refined products market, with little spare capacity that has largely remained unchanged over the past twenty years (Table VI-1).
Working Document of the NPC North American Resource Development Study
Made Available September 15, 2011
Page 37 of 60
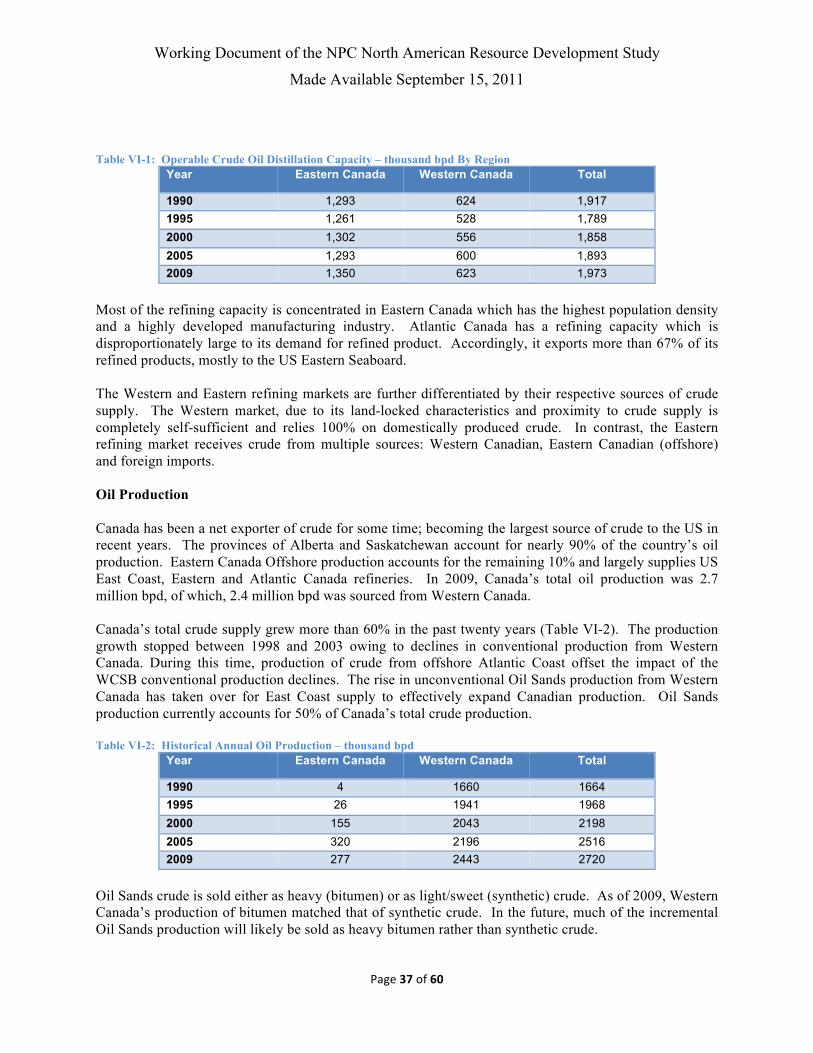
Table VI-1: Operable Crude Oil Distillation Capacity – thousand bpd By Region
Year Eastern Canada Western Canada Total
1990 1,293 624 1,917
1995 1,261 528 1,789
2000 1,302 556 1,858
2005 1,293 600 1,893
2009 1,350 623 1,973
Most of the refining capacity is concentrated in Eastern Canada which has the highest population density and a highly developed manufacturing industry. Atlantic Canada has a refining capacity which is disproportionately large to its demand for refined product. Accordingly, it exports more than 67% of its refined products, mostly to the US Eastern Seaboard. The Western and Eastern refining markets are further differentiated by their respective sources of crude supply. The Western market, due to its land-locked characteristics and proximity to crude supply is completely self-sufficient and relies 100% on domestically produced crude. In contrast, the Eastern refining market receives crude from multiple sources: Western Canadian, Eastern Canadian (offshore) and foreign imports. Oil Production Canada has been a net exporter of crude for some time; becoming the largest source of crude to the US in recent years. The provinces of Alberta and Saskatchewan account for nearly 90% of the country’s oil production. Eastern Canada Offshore production accounts for the remaining 10% and largely supplies US East Coast, Eastern and Atlantic Canada refineries. In 2009, Canada’s total oil production was 2.7 million bpd, of which, 2.4 million bpd was sourced from Western Canada. Canada’s total crude supply grew more than 60% in the past twenty years (Table VI-2). The production growth stopped between 1998 and 2003 owing to declines in conventional production from Western Canada. During this time, production of crude from offshore Atlantic Coast offset the impact of the WCSB conventional production declines. The rise in unconventional Oil Sands production from Western Canada has taken over for East Coast supply to effectively expand Canadian production. Oil Sands production currently accounts for 50% of Canada’s total crude production. Table VI-2: Historical Annual Oil Production – thousand bpd
Year Eastern Canada Western Canada Total
1990 4 1660 1664
1995 26 1941 1968
2000 155 2043 2198
2005 320 2196 2516
2009 277 2443 2720
Oil Sands crude is sold either as heavy (bitumen) or as light/sweet (synthetic) crude. As of 2009, Western Canada’s production of bitumen matched that of synthetic crude. In the future, much of the incremental Oil Sands production will likely be sold as heavy bitumen rather than synthetic crude.

Working Document of the NPC North American Resource Development Study
Made Available September 15, 2011
Page 38 of 60
B. Regional Infrastructure Given the size and location of crude oil supply, pipeline transportation is by far the prevalent form of crude transportation. Transportation of East Coast crude is facilitated by tanker traffic; however as a share of overall crude transportation, it represents a relatively small portion. VIa - WESTERN CANADA
Not only is Western Canada currently the dominant crude producing region in Canada, but going forward it is also positioned to be the largest supply basin in North America. For the past twenty years, WCSB production has increased at an average rate of 2.1% per annum. The annual growth rate in supply is expected to accelerate to 3.4% over the next 15 years (Table VI-3). Table VI -3: Annual Oil Production Forecast – thousand bpd
Year Eastern Canada Western Canada Total
2015 190 3,104 3,294
2020 190 3,692 3,882
2025 145 4,191 4,336
Mid West Rockies
West Coast
Pacific Coast

Working Document of the NPC North American Resource Development Study
Made Available September 15, 2011
Page 39 of 60
2030 106 4,740 4,846
2035 69 4,967 5,036
This creates an infrastructure challenge for the industry because out of four markets currently supplied by Western Canadian crude (the Rockies, the US West Coast, Eastern Canada and the Mid-West), only the Mid-West is large enough (from existing infrastructure standpoint) to absorb substantial increases in supply from Western Canada. One solution which is currently under review is the construction of a new corridor between Western Canada and the Canadian Pacific Coast. This market link would alleviate the mid-term pressure of excess supply in the Mid-West and also offset the effects of declining Alaskan production and a consequent rise in foreign imports off the US West Coast over the next 20 years. Western Canada’s Export Corridors Table VI-4: Western Canada’s Export Corridor Throughput - thousand bpd
Year W. Canada To Mid-West
W. Canada to Rockies
W. Canada to US West Coast
W. Canada to Pacific Coast
1990 1,035 76 100 - 1995 1,183 125 102 - 2000 1,192 213 107 - 2005 1,263 332 120 - 2009 1,539 338 144 32 2015 2,123 220 150 40 2020 2,315 269 150 382 2025 2,712 237 150 510 2030 3,103 255 155 650 2035 3,320 277 155 650
Western Canada – Mid-West
This corridor has been the main route not only for Canadian crude exports to the US, but also for crude shipments through the Mid-West to Eastern Canada. The corridor capacity has been aggressively expanded in the past couple of years in order to facilitate the disposition of higher anticipated crude production in Western Canada. Over the past 20 years approximately 68% of overall crude exports to the US have been shipped via this corridor. The corridor was expanded by 36% between 1990 and 2000 and by nearly 50% between 2000 and 2010 in response to growing infrastructure demands between the WCSB and refining hubs. Given the limited number of alternative export options for Western Canadian supply, the corridor utilization is expected to grow over the next five years. Western Canada – Rockies
Canadian crude exports to the Rockies region are facilitated by this export corridor which supplies refineries in Montana, Utah and Wyoming. The Western Canada to Rockies corridor is utilized below its available capacity due to export capacity limits leaving the Rockies region. Canadian crude is the only source of foreign crude imports into this region, while inbound infrastructure capacity can accommodate higher receipts, the lack of outbound capacity and Mid-West’s market saturation will limit future deliveries of Canadian crude along this corridor. Western Canada – US West Coast

Working Document of the NPC North American Resource Development Study
Made Available September 15, 2011
Page 40 of 60
This corridor supplies crude to the refineries in the north end of the West Coast Region. This corridor was constructed in the 1950’s and has been recently expanded to increase the export capabilities to both West Coast and offshore.
The corridor’s current capacity is dependent on the amount of heavy crude being transported for export. The corridor has historically operated close to the recent capacity of 300 thousand bpd with nominations frequently exceeding capacity. A contributing factor to the corridor’s throughput restrictions has been a significant increase in the West Coast’s demand for Canadian crude. While the bulk of the West Coast crude supply still comes from Alaska, as more fully described in the Alaskan section, production has been steadily declining over the recent past and is expected to continue into the future. Consequently, Canadian exports to the West Coast region have increased over the past twenty years. In 2009, West Coast refineries received, on average, 148 thousand bpd of Western Canadian crude. Western Canada – Pacific This corridor will be placed into service in the next six to ten years by a greenfield 525 thousand bpd pipeline which will connect Edmonton, AB with the Pacific Coast. The corridor will provide an outlet for incremental production from WCSB by facilitating an export route to the US West Coast and international markets via VLCC Pacific tanker traffic. This corridor will be important in balancing Canadian supply in the Mid-West in the midterm and will be complemented by additional infrastructure capacity between the Mid-West and the USGC. The corridor is expected to exhibit steady utilization increases from the assumed in service date in 2020 to the time when it reaches capacity in 2030. VIb - EASTERN CANADA
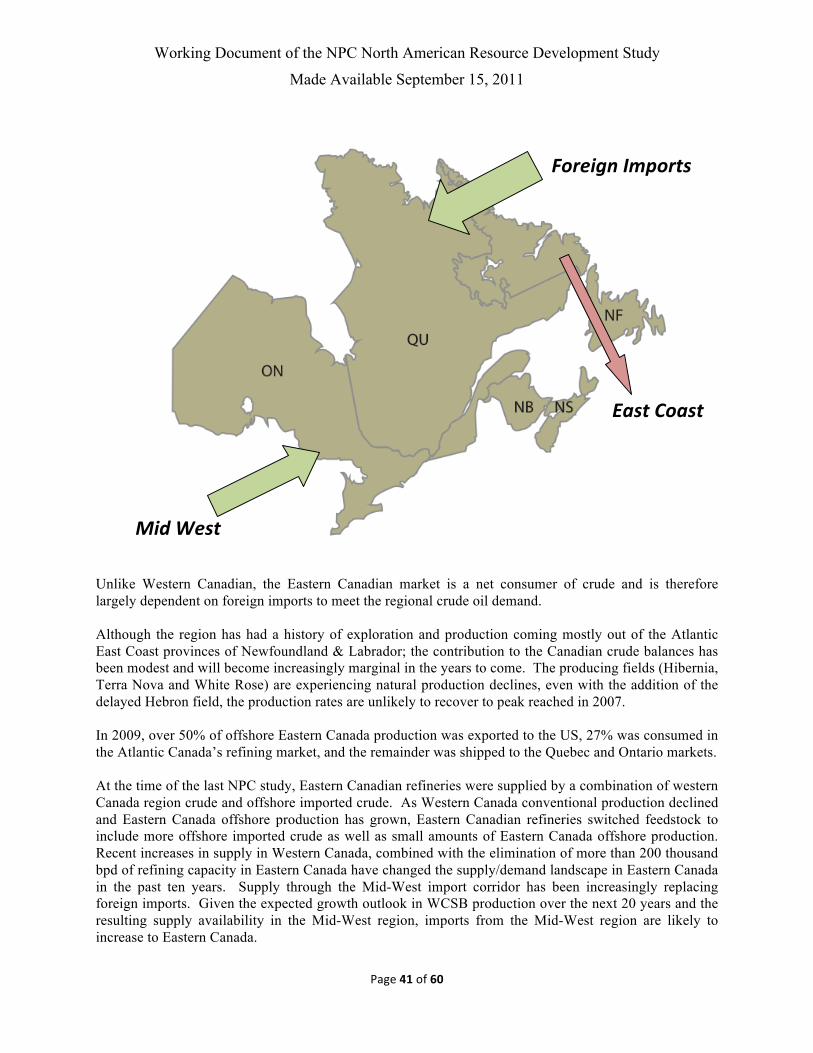
Working Document of the NPC North American Resource Development Study
Made Available September 15, 2011
Page 41 of 60
Unlike Western Canadian, the Eastern Canadian market is a net consumer of crude and is therefore largely dependent on foreign imports to meet the regional crude oil demand. Although the region has had a history of exploration and production coming mostly out of the Atlantic East Coast provinces of Newfoundland & Labrador; the contribution to the Canadian crude balances has been modest and will become increasingly marginal in the years to come. The producing fields (Hibernia, Terra Nova and White Rose) are experiencing natural production declines, even with the addition of the delayed Hebron field, the production rates are unlikely to recover to peak reached in 2007. In 2009, over 50% of offshore Eastern Canada production was exported to the US, 27% was consumed in the Atlantic Canada’s refining market, and the remainder was shipped to the Quebec and Ontario markets. At the time of the last NPC study, Eastern Canadian refineries were supplied by a combination of western Canada region crude and offshore imported crude. As Western Canada conventional production declined and Eastern Canada offshore production has grown, Eastern Canadian refineries switched feedstock to include more offshore imported crude as well as small amounts of Eastern Canada offshore production. Recent increases in supply in Western Canada, combined with the elimination of more than 200 thousand bpd of refining capacity in Eastern Canada have changed the supply/demand landscape in Eastern Canada in the past ten years. Supply through the Mid-West import corridor has been increasingly replacing foreign imports. Given the expected growth outlook in WCSB production over the next 20 years and the resulting supply availability in the Mid-West region, imports from the Mid-West region are likely to increase to Eastern Canada.
Foreign Imports
Mid West
East Coast

Working Document of the NPC North American Resource Development Study
Made Available September 15, 2011
Page 42 of 60
Eastern Canada’s Import Corridor Table VI-6: Eastern Canada’s Import Corridor Throughput - thousand bpd
Year Foreign Imports Mid-West to Eastern Canada
1990 535 530 1995 590 480 2000 913 303 2005 925 224 2009 806 309 2015 742 419 2020 619 496 2025 624 504 2030 682 524 2035 717 524
Mid-West – Eastern Canada Thirty years ago , Western Canadian crude delivered via the Mid-West used to be a main source of crude supply for the entire Eastern Canadian refining market some. As the conventional supply from WCSB fell in the late 1980s/early 1990s the refining capacity and demand expanded in Eastern Canada and WCSB crude supply failed to meet the incremental demand. As a result, infrastructure was put in place to facilitate increased imports of foreign crude into Eastern Canada. With growing supply in the Mid-West, this trend is expected to reverse, requiring additional infrastructure changes to facilitate imports from the Mid-West to Eastern Canada. Foreign Imports - Imports of foreign crude into Eastern Canada have experienced significant growth over the last 20 years, reaching a peak in the early part of this decade. A combination of increases in refinery capacity and a mismatch of crude quality produced by Eastern Canada offshore and refinery diet resulted in significant growth in offshore imports. Lower refinery demand for crude and increased availability of crude in the Mid-West region is expected to reduce Foreign Imports until later next decade. Increased refinery demand and limited capacity between the Mid-West and Eastern Canada is expected to increase the requirements to import more Foreign crude. Eastern Canada’s Export Corridor Coinciding with the startup of offshore Eastern Canadian production, Exports of Canadian crude to the US East Coast (PADD I) commenced. Exports have continued to increase over time and are expected to peak in the middle of this current decade. As production falls, exports are expected to decline. Table VI-7: Eastern Canada’s Export Corridor Throughput - thousand bpd
Year Exports to the US East Coast
1990 - 1995 8 2000 117 2005 152 2009 180 2015 236 2020 176

Working Document of the NPC North American Resource Development Study
Made Available September 15, 2011
Page 43 of 60
2025 131 2030 157 2035 141
C. Intra-Regional Infrastructure Western Canadian intra-regional infrastructure has responded to the growing production of oil sands crude to feed the large scale export pipeline systems. Substantial investment in gathering and storage facilities continue to be made to facilitate the continued expansion of western Canada crude oil supply. The Eastern Canada intra-regional infrastructure is a combination of smaller crude oil pipelines and large scale tanker facilities. With the changing import and export requirements in this region, new tanker facilities have been constructed as well as pipeline reversals undertaken. In future, some infrastructure modifications will be required to handle the changing supply/demand capabilities of the region. D. Current Issues: Higher volumes of heavy crude shipments will place strain on existing infrastructure capacity
• Shipments of heavy, viscous crudes result consume a disproportionate amount of pipeline capacity.
• Growing heavy crude demand may exacerbate the shortage of condensate in Alberta, presenting a logistical challenge for bitumen transportation.
Age and maintenance of facilities Most of the major pipeline infrastructure in the region has been in service since the 1950’s. Substantial investments to expand infrastructure have been made, but the original 1950’s era facilities are still in service. Inspection and maintenance expenditures are expected to continue to escalate. Beyond cost implications, as production ramps up, scheduling downtime for repairs are particularly challenging and impact crude oil markets significantly. Eastern Canada’s Dependence on Light Sweet Crude Imports The region is heavily dependent on light, sweet crude sources which are becoming increasingly scarce not only domestically but internationally. Higher prices of imported light sweet crudes may affect the competitiveness of a number of refiners who exclusively rely on these feed-stocks. Such a development, especially on a large scale will have future implications for infrastructure development.

Working Document of the NPC North American Resource Development Study
Made Available September 15, 2011
Page 44 of 60
VII. ALASKA REGION
A. Regional Overview Alaska production on a large scale started with the Prudoe Bay development in the mid-1970’s. Along with the completion of the Trans Alaska Pipeline System (TAPS) in 1977, Alaska production largely replaced declining U.S. lower 48 state production up until the mid 1980’s, representing roughly 25% of US domestic production by 1988. Despite the addition of production from satellite fields on the North Slope, production has declined from the peak reached in 1988. Refinery Capacity reflects a much smaller requirement for local demand. Future refinery capacity will eventually require imported crude oil if the Alaskan production forecast is realized. Refineries Table VII-1: Operable Crude Oil Distillation Capacity – thousand bpd
Year Total
1990 228
1995 289
2000 326
2005 344
2009 308
2015 306
2020 312
2025 318
West Coast
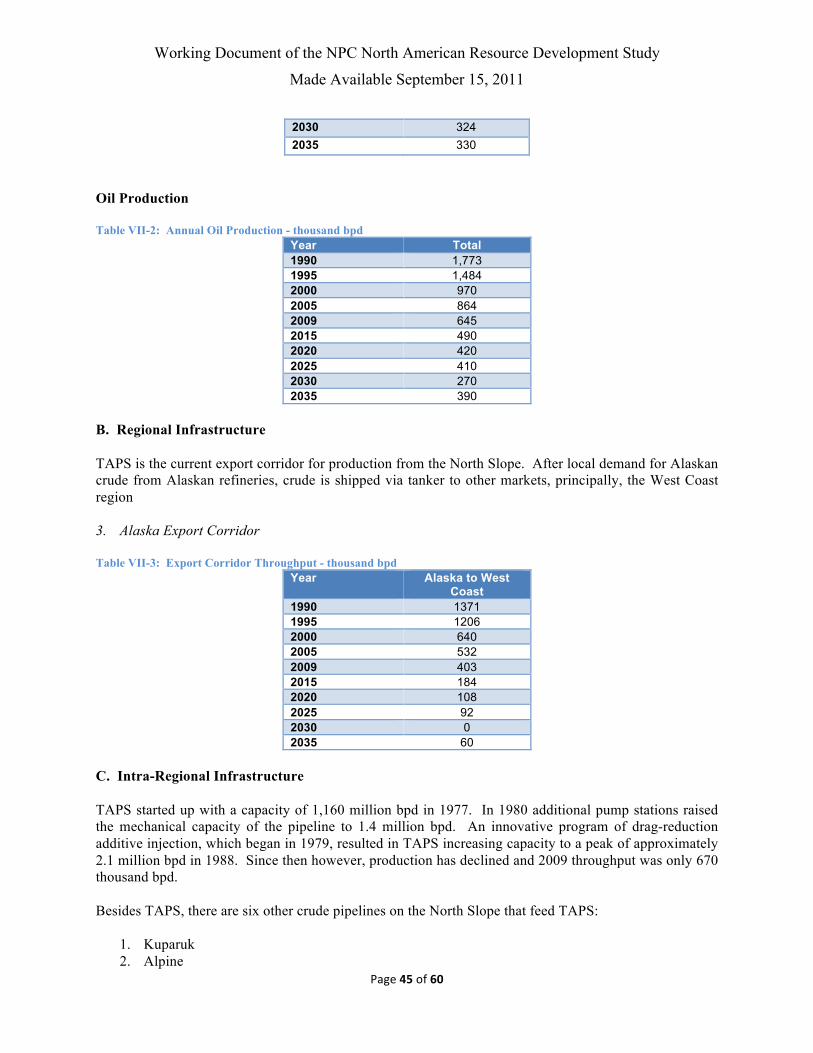
Working Document of the NPC North American Resource Development Study
Made Available September 15, 2011
Page 45 of 60
2030 324
2035 330
Oil Production Table VII-2: Annual Oil Production - thousand bpd
Year Total 1990 1,773 1995 1,484 2000 970 2005 864 2009 645 2015 490 2020 420 2025 410 2030 270 2035 390
B. Regional Infrastructure TAPS is the current export corridor for production from the North Slope. After local demand for Alaskan crude from Alaskan refineries, crude is shipped via tanker to other markets, principally, the West Coast region 3. Alaska Export Corridor
Table VII-3: Export Corridor Throughput - thousand bpd
Year Alaska to West Coast
1990 1371 1995 1206 2000 640 2005 532 2009 403 2015 184 2020 108 2025 92 2030 0 2035 60
C. Intra-Regional Infrastructure TAPS started up with a capacity of 1,160 million bpd in 1977. In 1980 additional pump stations raised the mechanical capacity of the pipeline to 1.4 million bpd. An innovative program of drag-reduction additive injection, which began in 1979, resulted in TAPS increasing capacity to a peak of approximately 2.1 million bpd in 1988. Since then however, production has declined and 2009 throughput was only 670 thousand bpd. Besides TAPS, there are six other crude pipelines on the North Slope that feed TAPS:
1. Kuparuk 2. Alpine

Working Document of the NPC North American Resource Development Study
Made Available September 15, 2011
Page 46 of 60
3. Endicott 4. Milne Point 5. Northstar 6. Badami
Figure VII-1 displays a map of Alaska’s main pipeline systems. Figure VII-1 - From State Pipeline Coordinator's Office 2009 Annual Report
D. Current Issues: With declining production from the North Slope and an uncertain future for additional production, the minimum flow rate on TAPS, as currently configured, in danger of being achieved. Below the minimum operating flow rate of TAPS, the pipeline is no longer capable of providing transportation service to the North Slope fields without modification.
_ Alpine Oil Pipeline* _ Milne Point Oil Pipeline* _ Kuparuk Pipeline Extension* _ Kuparuk Oil Pipeline* _ Northstar Oil Pipeline* _ Badami Sales Oil Pipeline* _ Endicott Pipeline* _ Trans-Alaska Pipeline System (a portion of)* *AS 38.35 crude oil pipeline leases

Working Document of the NPC North American Resource Development Study
Made Available September 15, 2011
Page 47 of 60
GENERAL FINDINGS As a whole, the entire petroleum pipeline industry and infrastructure network will face a number of common challenges over the next fifty years. Going forward, industry, policy makers, and regulatory bodies must be mindful of these challenges to ensure a balance of diligence and efficiency that will serve the best interests of petroleum producers and consumers. Changing Market Dynamics and Public Policy Since the last NPC study was produced in the late 1980s, the petroleum transportation industry has been responsive towards meeting the needs of a changing North American crude oil market landscape. Declining crude oil production in regions such as PADDs III and V has been offset by offshore imports, or imports from the WCSB, likewise refinery rationalization and Canadian imports in recent years has increased reliance on PADD II refinery hubs in Chicago and Wood River. Such shifts have been met with expansions or reductions in corridor capacity between supply regions and demand hubs. These are examples of how the commodities markets have been an effective gauge in determining future changes to infrastructure needs. The time since the last NPC study has been a period of punctuated market development whereby producing regions that had provided a relatively stable supply of crude oil began to dwindle. In the later half of 2010 and the beginning of 2011 while this report was in its draft stages, West Texas Intermediate priced at Cushing, OK, was for the first prolonged period ever priced at a significant discount to Brent and other worldwide benchmark crudes. This serves as a timely example of how changes in balance between markets can significantly impact crude pricing. Where such market inefficiencies occur, industry has acted and will continue to act as an effective balancing mechanism by identifying the economic opportunity and responding to the infrastructure needs. As it has in the past, public policy should continue to support the existing mechanisms in place and encourage the market to be responsive to what infrastructure demands emerge over the foreseeable future. Not only is this in the case of new infrastructure to be constructed or expanded, but also in underutilized infrastructure to be reversed, idled, or to undergo changes in the type of service. Energy Security Energy security in the North America is protected when the markets and industry are encouraged and able to swiftly respond to economic drivers. There is no better example of this than today’s changing North American supply and demand landscape. Today rapidly growing production from Northern Alberta’s vast energy reserves is being met with ample export capacity to the US that will allow crude oil to flow to major refining districts in the Mid-West, Mid-Continent, and ultimately the Gulf Coast. Going forward the robust energy supply position for North America will support energy security for the US so long as the necessary corridors that will continue to link production and markets are in place. While changes in supply patterns across North America will favor the expansion of certain corridors, declining utilization may merit the reduction of capacity in other corridors. Even in these cases, market forces will continue to act as an effective mechanism that will support the US’ energy security even where utilization suggests some corridors may become no longer necessary. While markets favor capacity expansions where demand is sufficient, that rarely comes at the expense of market optionality and in turn energy security.

Working Document of the NPC North American Resource Development Study
Made Available September 15, 2011
Page 48 of 60
Though today’s changing supply patterns are shifting towards a predominantly North-South flow from Canada into the Mid-West and Mid-Continent, some degree of import capacity from the USGC into those regions will always remain open, as is evident in the corridor throughput forecasts. Economics and pricing dynamics dictate that the throughput on those corridors will continue to act as a balancing mechanism for pricing hubs. This will ensure that imports from the USGC or the Strategic Petroleum Reserve will always be available to the Mid-Continent and Mid-West, though going forward the majority of the supply will originate in WCSB or Bakken play. Utilization of Existing Infrastructure As mentioned throughout the report, changing market dynamics between regions is significantly impacting how existing infrastructure is utilized. For most of the past fifty years, pipeline infrastructure was oriented in a South-North alignment. However today growing supply in Canada coupled with falling supply from traditional production regions is causing a reversal to a North-South orientation. This shift, along with other changes in market dynamics resulting from shifting crude supplies has resulted in a number of reversals, conversions, and idling of existing systems. For some pipelines this means utilizing existing infrastructure with commodities for which they were not originally designed. While this is not an issue, it is important for the industry to be responsive and aware of how the pipeline’s original design parameters combine with its current operation. In other regions, shifts in supply and demand have resulted in significantly underutilized lines. Unique situations have emerged where one or two shippers will continue to rely on a pipeline however capacity demand remains consistently below the pipeline’s economic threshold. In cases where demand on an existing pipeline falls below optimal flow rates, the question begs whether the asset ought to remain in service at a sub-optimal flow rate with potentially prohibitive operating economics, or whether the asset ought to be idled entirely. In these instances the pipeline service provider is left in a challenging predicament where the economics around a particular asset may no longer be favorable to its continued operation, but the provider is left open to shipper and regulatory scrutiny for the adverse impact the asset’s idling or abandonment may have on another business. Cases such as these needs to be carefully examined in Canada and the United States and the benefit to one party must be weighed carefully against the harm to another. Finally, if and when the decision is made to idle or abandon a pipeline, determinations and expectations around the remediation of the asset must be made. From an environmental and social perspective it may or may not be in the public’s interests to remove a pipeline and fully remediate a right of way. Such will be dependent on the specific region or environment and the local municipalities. Aging Infrastructure Much of the pipeline infrastructure in North America was laid well before the last NPC study was conducted in the late 1980s. In 2010, several systems that remain in service today already exceeded fifty years in age, with no major plans to retire existing infrastructure based on asset age alone. On systems where asset integrity remains high, and market demand still necessitates infrastructure, there is no reason to retire assets so long as adequate maintenance and integrity programs can guarantee system safety. Asset integrity cannot be directly predicted by asset age alone. In some cases, the vintage of the pipeline is a better predictor of asset condition than age, with some systems from the 1950’s showing better wear resistance than systems in the 1960’s and vice versa. However as time goes by, overall infrastructure and
Working Document of the NPC North American Resource Development Study
Made Available September 15, 2011
Page 49 of 60
integrity issues will become more common due to a number of age related issues. Among those challenges are serious issues such as;
• Internal and external pipeline coating issues • External corrosion • Third party damage • Weld seam failures • Specific integrity issue around flash welded pipe
These issues are cause for concern not only because of the obvious risk to public safety posed by aging infrastructure, but because of the heavy reliance on pipeline infrastructure in the United States economy. The United States relies heavily on the relatively small number of key pipeline transportation corridors that were discussed in this report. Mitigation and integrity programs are in place however for the foreseeable future they may result in increased operating and maintenance costs on existing systems. At the same time, downtime for planned maintenance will increase and be accompanied by an increased risk of apportionment on key pipelines. Pipelines operating outside of their design parameters such as those carrying commodities for which they were not initially designed, or high flow pipelines are at the greatest risk of integrity issues in the future due to the nature of their operation. Regulatory Challenges The development of new or Greenfield pipeline projects often faces a series of procedural challenges resulting from a complicated regulatory environment in the United States. The lack of overarching Federal oversight in the oil pipeline permitting process leaves potential projects subject to a patchwork of required state level environmental, regulatory and commercial approvals. In some instances the case is such that the drive and public benefit of a project is easily recognizable on the national level, but less so on a state level. For instance, an oil pipeline connecting supply in one region to demand in another may easily travel through one or more states without any intermediate receipts or deliveries. However for state(s) between the origin and destination there may be no immediate economic benefit to residents or businesses from the pipeline itself. At the state level it may then be determined that with no immediate and primary benefit to local residents, regulatory and environmental approvals should not be provided. In cases such as these federal level mandate is required to highlight that the project does indeed serve the public’s interests, albeit at a national rather than state level. The state level permitting process multiplies the number of separate and unique approvals required for each individual project. This increases the costs and time required for the development of new projects and introduces the significant commercial risk that one state may approve of a project while another firmly disapproves of it, with a build around solution being commercially prohibitive. As infrastructure demands from continental regions such as the oilsands growth and aging infrastructure requires replacement, a streamlined Federal level permitting process is of greater value. Changing Market Dynamics and Existing Infrastructure

Working Document of the NPC North American Resource Development Study
Made Available September 15, 2011
Page 50 of 60
As mentioned throughout the report, changing market dynamics between regions is significantly impacting how existing infrastructure is utilized. For most of the past fifty years, pipeline infrastructure was oriented in a South-North alignment. However today growing supply in Canada coupled with falling supply from traditional production regions is causing a reversal to a North-South orientation. This shift, along with other changes in market dynamics resulting from shifting crude supplies has resulted in a number of reversals, conversions, and idling of existing systems. For some pipelines this means utilizing existing infrastructure with commodities for which they were not originally designed. While this is not an issue, it is important for the industry to be responsive and aware of how the pipeline’s original design parameters combine with its current operation. In other regions shifts in supply and demand have resulted in significantly underutilized lines. Unique situations have emerged where one or two shippers will continue to rely on a pipeline however capacity demand remains consistently below the pipeline’s economic threshold. In cases where demand on an existing pipeline falls below optimal flow rates, the question begs whether the asset ought to remain in service at a sub-optimal flow rate with potentially prohibitive operating economics, or whether the asset ought to be idled entirely. In these instances the pipeline service provider is left in a challenging predicament where the economics around a particular asset may no longer be favorable to its continued operation, but the provider is left open to shipper and regulatory scrutiny for the adverse impact the asset’s idling or abandonment may have on another business. Cases such as these needs to be carefully examined in Canada and the United States and the benefit to one party must be weighed carefully against the harm to another. Finally, if and when the decision is made to idle or abandon a pipeline, determinations and expectations around the remediation of the asset must be made. From an environmental and social perspective it may or may not be in the public’s interests to remove a pipeline and fully remediate a right of way. Such will be dependent on the specific region or environment and the local municipalities. Public Perceptions With continued urban growth a growing percentage of pipeline right of way is coming in close proximity to residential and commercial development. As this trend continues over the next fifty years it will be crucial to ensure the public is aware of the facilities in their area and to manage public perceptions around leak detection. Challenges in the oil transportation industry in the past several years have brought to light vulnerabilities in leak detection technology and reminded home and business owners of the facilities that they may be in their area. As the average age of the North America’s pipeline network rises, it is important to work with municipalities to ensure emergency response plans are up to date and in place, to educate individuals/ businesses near pipeline facilities of the importance of “Call Before You Dig” programs and contact information of emergency response team if they suspect a leak. Security and Protection of Pipeline Assets As of 2009, in the U.S. there were approximately 55,000 miles of crude oil trunk lines (typically 8 - 24 inches in diameter) and tens of thousands of miles of additional feeder lines, gas lines, and natural gas liquids pipelines. Due to the sheer number of pipelines and the vast distances they cross over every type of terrain in North America, it is virtually impossible to guarantee the safety and around the clock security of the total network.
Working Document of the NPC North American Resource Development Study
Made Available September 15, 2011
Page 51 of 60
The challenges around pipeline surveillance coupled with the volume and volatility of the liquids transported through pipelines place them at a high risk for severe social and environmental fallout should the integrity of a pipeline be compromised either accidentally or intentionally. Beyond the immediate physical consequences of a severe pipeline disruption, the economic ramifications of a major pipeline corridor being taken off line even temporarily could be far reaching and result in crude shortages, refinery shutdowns and market disruptions.

Working Document of the NPC North American Resource Development Study
Made Available September 15, 2011
Page 52 of 60
Schedule Appendix A
Tables

Working Document of the NPC North American Resource Development Study
Made Available September 15, 2011
Appendix A – Table I MIDCONTINENT (thousand bpd)
MIDCONTINENT
Historical Projected
1990 1995 2000 2005 2009 2015 2020 2025 2030 2035
Supp
ly Production 2,503 2,070 1,680 1,491 1,566 1,768 2,000 2,095 2,095 1,845
Imports:
USGC to MidContinent 300 329 350 323 154 134 33 37 32 89
MidWest to MidContinent -‐ -‐ -‐ -‐ 162 425 423 548 700 845 Rockies to MidContinent 26 25 -‐ 40 50 36 26 22 21 40
2,829 2,424 2,030 1,854 1,932 2,363 2,482 2,703 2,848 2,819
Deman
d Refinery 1,251 1,317 1,375 1,409 1,384 1,658 1,687 1,716 1,746 1,775 Exports:
MidContinent to USGC 1,500 754 384 27 21 354 490 826 1,000 1,000 MidContinent to Midwest 389 327 481 378 476 351 305 161 102 44
3,140 2,398 2,240 1,814 1,882 2,363 2,482 2,703 2,848 2,819

Working Document of the NPC North American Resource Development Study
Made Available September 15, 2011
Page 54 of 60
Appendix A – Table II
UNITED STATES GULF COAST (thousand bpd)
USGC
Historical Projected
1990 1995 2000 2005 2009 2015 2020 2025 2030 2035
Supp
ly
Production (incl. O/S USGC) 1,211 1,347 1,756 1,514 1,765 2,012 2,150 1,816 2,016 1,974 Imports:
Offshore Imports 3,887 4,629 5,693 6,125 5,185 5,017 4,637 4,688 4,308 4,558 MidContinent to USGC 1,500 754 384 27 21 354 490 826 1,000 1,000 West Coast to USGC 113 199 -‐ -‐ -‐ -‐ -‐ -‐ -‐ -‐ Midwest to USGC -‐ -‐ -‐ -‐ 96 72 86 82 96 96
6,711 6,929 7,833 7,666 7,067 7,454 7,363 7,411 7,420 7,628
Deman
d
Refinery 5,457 5,746 6,476 6,426 6,358 6,830 6,944 7,059 7,173 7,288 Exports:
USGC to MidContinent 300 329 350 323 154 134 33 37 32 89 USGC to MidWest 1,085 1,130 957 918 583 490 386 315 215 250
6,842 7,205 7,783 7,667 7,095 7,454 7,363 7,411 7,420 7,627
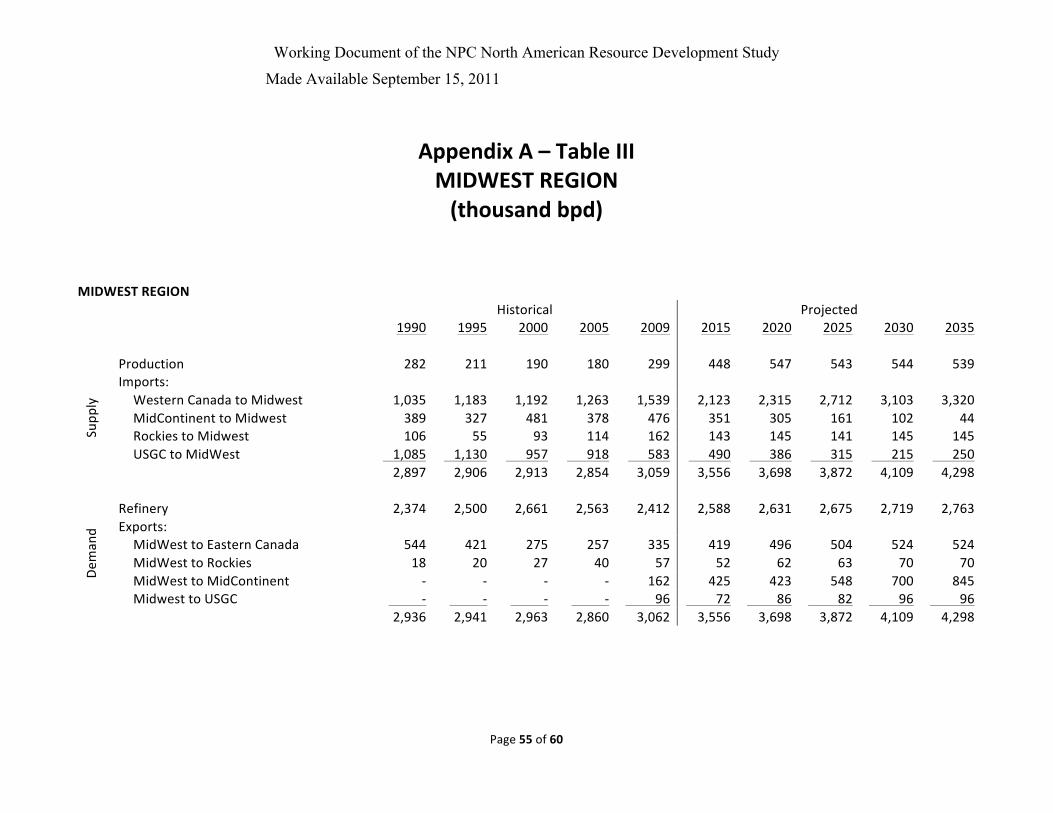
Working Document of the NPC North American Resource Development Study
Made Available September 15, 2011
Page 55 of 60
Appendix A – Table III MIDWEST REGION (thousand bpd)
MIDWEST REGION
Historical Projected
1990 1995 2000 2005 2009 2015 2020 2025 2030 2035
Supp
ly
Production 282 211 190 180 299 448 547 543 544 539 Imports:
Western Canada to Midwest 1,035 1,183 1,192 1,263 1,539 2,123 2,315 2,712 3,103 3,320 MidContinent to Midwest 389 327 481 378 476 351 305 161 102 44 Rockies to Midwest 106 55 93 114 162 143 145 141 145 145 USGC to MidWest 1,085 1,130 957 918 583 490 386 315 215 250
2,897 2,906 2,913 2,854 3,059 3,556 3,698 3,872 4,109 4,298
Deman
d
Refinery 2,374 2,500 2,661 2,563 2,412 2,588 2,631 2,675 2,719 2,763 Exports:
MidWest to Eastern Canada 544 421 275 257 335 419 496 504 524 524 MidWest to Rockies 18 20 27 40 57 52 62 63 70 70 MidWest to MidContinent -‐ -‐ -‐ -‐ 162 425 423 548 700 845 Midwest to USGC -‐ -‐ -‐ -‐ 96 72 86 82 96 96
2,936 2,941 2,963 2,860 3,062 3,556 3,698 3,872 4,109 4,298
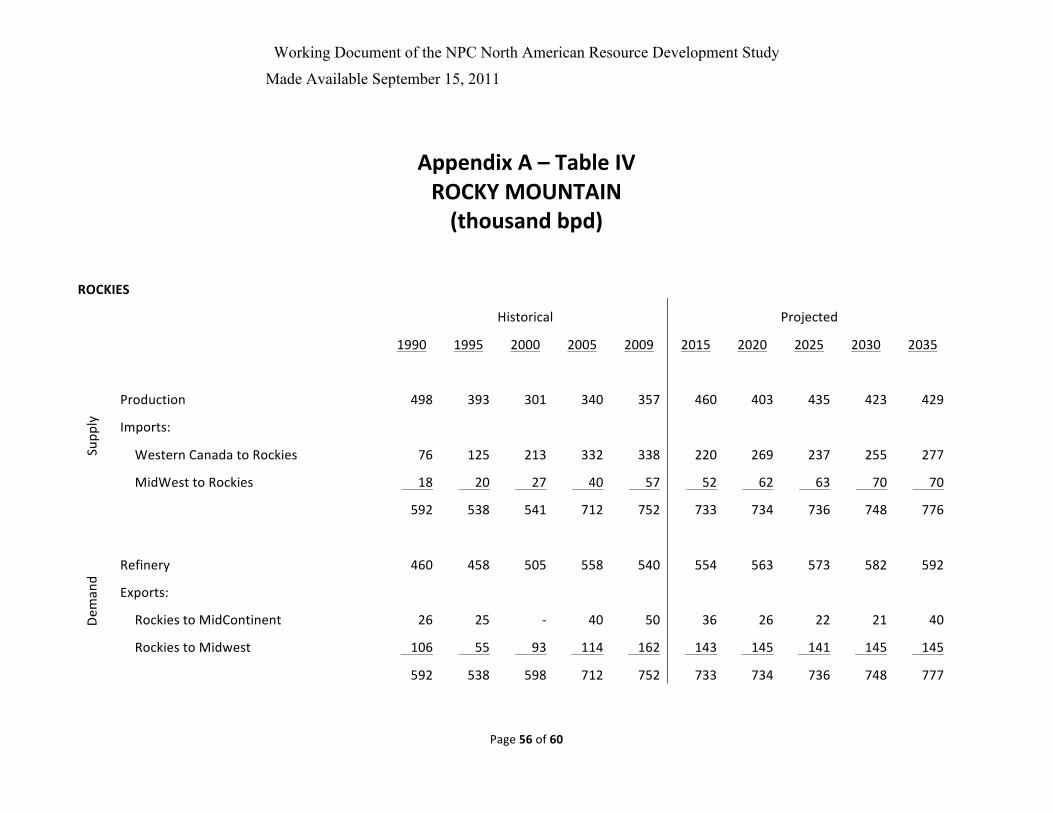
Working Document of the NPC North American Resource Development Study
Made Available September 15, 2011
Page 56 of 60
Appendix A – Table IV ROCKY MOUNTAIN (thousand bpd)
ROCKIES
Historical Projected
1990 1995 2000 2005 2009 2015 2020 2025 2030 2035
Supp
ly
Production 498 393 301 340 357 460 403 435 423 429
Imports:
Western Canada to Rockies 76 125 213 332 338 220 269 237 255 277
MidWest to Rockies 18 20 27 40 57 52 62 63 70 70
592 538 541 712 752 733 734 736 748 776
Deman
d
Refinery 460 458 505 558 540 554 563 573 582 592
Exports:
Rockies to MidContinent 26 25 -‐ 40 50 36 26 22 21 40
Rockies to Midwest 106 55 93 114 162 143 145 141 145 145
592 538 598 712 752 733 734 736 748 777
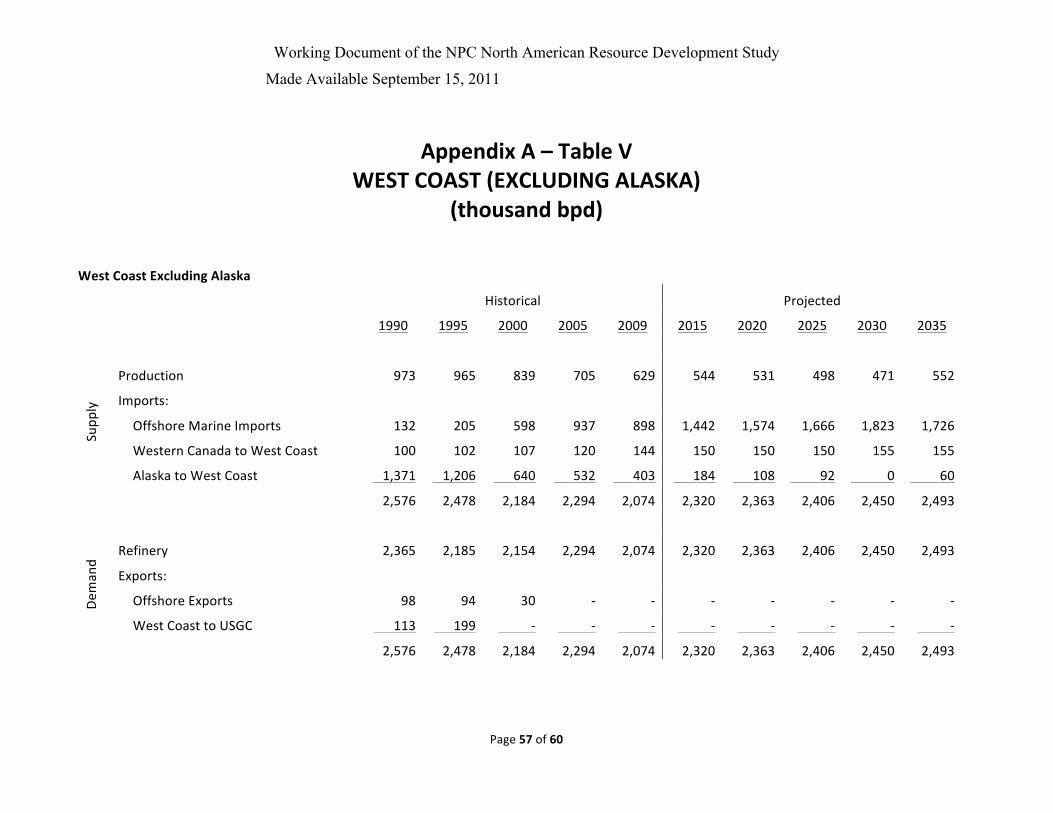
Working Document of the NPC North American Resource Development Study
Made Available September 15, 2011
Page 57 of 60
Appendix A – Table V WEST COAST (EXCLUDING ALASKA)
(thousand bpd)
West Coast Excluding Alaska
Historical Projected
1990 1995 2000 2005 2009 2015 2020 2025 2030 2035
Supp
ly
Production 973 965 839 705 629 544 531 498 471 552
Imports:
Offshore Marine Imports 132 205 598 937 898 1,442 1,574 1,666 1,823 1,726
Western Canada to West Coast 100 102 107 120 144 150 150 150 155 155
Alaska to West Coast 1,371 1,206 640 532 403 184 108 92 0 60
2,576 2,478 2,184 2,294 2,074 2,320 2,363 2,406 2,450 2,493
Deman
d
Refinery 2,365 2,185 2,154 2,294 2,074 2,320 2,363 2,406 2,450 2,493
Exports:
Offshore Exports 98 94 30 -‐ -‐ -‐ -‐ -‐ -‐ -‐
West Coast to USGC 113 199 -‐ -‐ -‐ -‐ -‐ -‐ -‐ -‐
2,576 2,478 2,184 2,294 2,074 2,320 2,363 2,406 2,450 2,493

Working Document of the NPC North American Resource Development Study
Made Available September 15, 2011
Page 58 of 60
Appendix A – Table VIa WESTERN CANADA (thousand bpd)
Western Canada
Historical Projected
1990 1995 2000 2005 2009 2015 2020 2025 2030 2035
Supp
ly
Production
1,660
1,941
2,043
2,196
2,443
3,104
3,692
4,191
4,740
4,967
1,660
1,941
2,043
2,196
2,443
3,104
3,692
4,191
4,740
4,967
Deman
d
Refinery
511
479
564
601
565
570
576
581
586
592 Exports:
Western Canada to Midwest
1,035
1,183
1,192
1,263
1,539
2,123
2,315
2,712
3,103
3,320
Western Canada to Rockies
76
125
213
332
338
220
269
237
255
277
Western Canada to West Coast
100
102
107
120
144
150
150
150
155
155
Western Canada to Pacific/Other Markets -‐
-‐
-‐
-‐
32
40
382
510
650
650
1,722
1,889
2,076
2,316
2,618
3,104
3,692
4,191
4,749
4,994

Working Document of the NPC North American Resource Development Study
Made Available September 15, 2011
Page 59 of 60
Appendix A – Table VIb EASTERN CANADA (thousand bpd)
Eastern Canada
Historical Projected
1990 1995 2000 2005 2009 2015 2020 2025 2030 2035
Supp
ly
Production
4
26
155
320
277
190
190
145
106
69 Imports:
Foreign Imports
535
590
913
925
806
742
619
624
682
717
Midwest to Eastern Canada
544
421
275
257
335
419
496
504
524
524
1,084
1,037
1,343
1,502
1,418
1,351
1,305
1,273
1,312
1,310
Deman
d Refinery
1,070
1,088
1,199
1,278
1,201
1,115
1,128
1,142
1,155
1,169 Exports:
Eastern Canada to East Coast/ West PADD I -‐
8
117
152
180
236
176
131
157
141
1070 1096 1316 1430 1381 1351 1305 1273 1312 1310
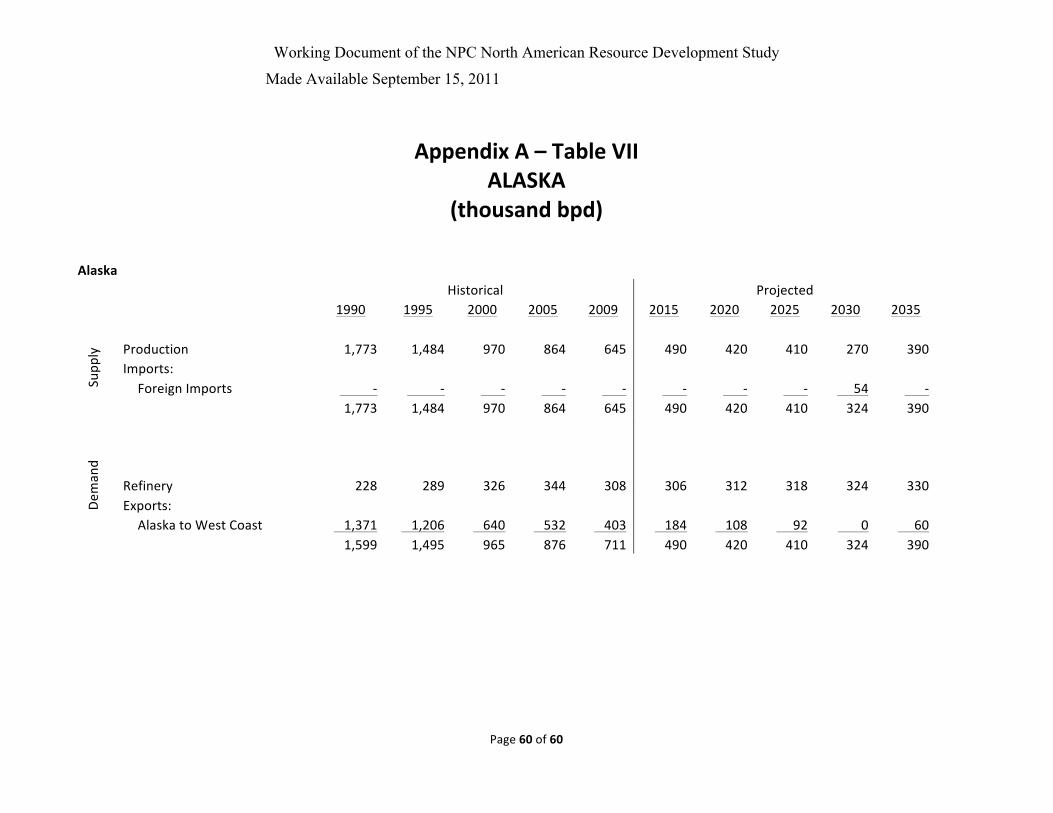
Working Document of the NPC North American Resource Development Study
Made Available September 15, 2011
Page 60 of 60
Appendix A – Table VII ALASKA
(thousand bpd) Alaska
Historical Projected
1990 1995 2000 2005 2009 2015 2020 2025 2030 2035
Supp
ly
Production 1,773 1,484 970 864 645 490 420 410 270 390
Imports:
Foreign Imports -‐ -‐ -‐ -‐ -‐ -‐ -‐ -‐ 54 -‐
1,773 1,484 970 864 645 490 420 410 324 390
Deman
d
Refinery 228 289 326 344 308 306 312 318 324 330 Exports:
Alaska to West Coast 1,371 1,206 640 532 403 184 108 92 0 60
1,599 1,495 965 876 711 490 420 410 324 390