1 1 Slide © 2003 South-Western /Thomson Learning™ Slides Prepared by JOHN S. LOUCKS St....
39
1 © 2003 South-Western /Thomson Learning™ © 2003 South-Western /Thomson Learning™ Slides Prepared by Slides Prepared by JOHN S. LOUCKS JOHN S. LOUCKS St. Edward’s University St. Edward’s University
-
Upload
meagan-hayes -
Category
Documents
-
view
215 -
download
2
Transcript of 1 1 Slide © 2003 South-Western /Thomson Learning™ Slides Prepared by JOHN S. LOUCKS St....

1 1 Slide
Slide
© 2003 South-Western /Thomson Learning™© 2003 South-Western /Thomson Learning™
Slides Prepared bySlides Prepared byJOHN S. LOUCKSJOHN S. LOUCKS
St. Edward’s UniversitySt. Edward’s University
2 2 Slide
Slide
© 2003 South-Western /Thomson Learning™© 2003 South-Western /Thomson Learning™
Chapter 11Chapter 11 Inferences about Population Variances Inferences about Population Variances
Inference about a Population VarianceInference about a Population Variance Inferences about the Variances of Two Inferences about the Variances of Two
PopulationsPopulations

3 3 Slide
Slide
© 2003 South-Western /Thomson Learning™© 2003 South-Western /Thomson Learning™
Inferences about a Population VarianceInferences about a Population Variance
Chi-Square DistributionChi-Square Distribution Interval Estimation of Interval Estimation of 22
Hypothesis TestingHypothesis Testing

4 4 Slide
Slide
© 2003 South-Western /Thomson Learning™© 2003 South-Western /Thomson Learning™
Chi-Square DistributionChi-Square Distribution
The The chi-square distributionchi-square distribution is the sum of squared is the sum of squared standardized normal random variables such asstandardized normal random variables such as
((zz11))22+(+(zz22))22+(+(zz33))22 and so on. and so on. The chi-square distribution is based on sampling The chi-square distribution is based on sampling
from a normal population.from a normal population. The sampling distribution of (The sampling distribution of (nn - 1) - 1)ss22//22 has a has a
chi-square distribution whenever a simple chi-square distribution whenever a simple random sample of size random sample of size nn is selected from a is selected from a normal population.normal population.
We can use the chi-square distribution to We can use the chi-square distribution to develop interval estimates and conduct develop interval estimates and conduct hypothesis tests about a population variance.hypothesis tests about a population variance.

5 5 Slide
Slide
© 2003 South-Western /Thomson Learning™© 2003 South-Western /Thomson Learning™
Interval Estimation of Interval Estimation of 22
Interval Estimate of a Population VarianceInterval Estimate of a Population Variance
where the where the values are based on a chi-square values are based on a chi-square distribution with distribution with nn - 1 degrees of freedom and - 1 degrees of freedom and where 1 - where 1 - is the confidence coefficient. is the confidence coefficient.
( ) ( )
/ ( / )
n s n s
1 12
22
22
1 22
( ) ( )
/ ( / )
n s n s
1 12
22
22
1 22
6 6 Slide
Slide
© 2003 South-Western /Thomson Learning™© 2003 South-Western /Thomson Learning™
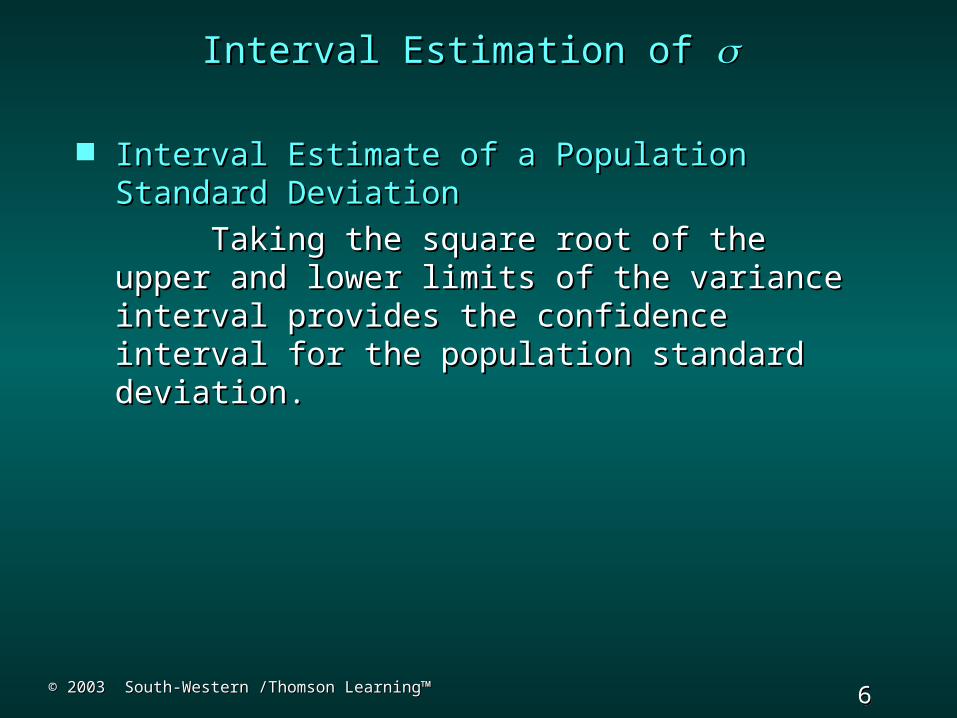
Interval Estimation of Interval Estimation of
Interval Estimate of a Population Standard Interval Estimate of a Population Standard DeviationDeviation
Taking the square root of the upper and Taking the square root of the upper and lower limits of the variance interval provides lower limits of the variance interval provides the confidence interval for the population the confidence interval for the population standard deviation.standard deviation.

7 7 Slide
Slide
© 2003 South-Western /Thomson Learning™© 2003 South-Western /Thomson Learning™
Chi-Square Distribution With Tail Areas of .025Chi-Square Distribution With Tail Areas of .025
95% of thepossible 2 values 95% of thepossible 2 values
22
00
.025.025.025.025
.9752.9752 .025
2.0252
Interval Estimation of Interval Estimation of 22

8 8 Slide
Slide
© 2003 South-Western /Thomson Learning™© 2003 South-Western /Thomson Learning™
Buyer’s Digest rates thermostats manufacturedBuyer’s Digest rates thermostats manufactured
for home temperature control. In a recent test, 10for home temperature control. In a recent test, 10
thermostats manufactured by ThermoRite were thermostats manufactured by ThermoRite were selected selected
and placed in a test room that was maintained at aand placed in a test room that was maintained at a
temperature of 68temperature of 68ooF. The temperature readings of the F. The temperature readings of the
ten thermostats are listed below. ten thermostats are listed below.
We will use the 10 readings to develop a 95%We will use the 10 readings to develop a 95%
confidence interval estimate of the population variance.confidence interval estimate of the population variance.
Therm.Therm. 1 2 3 4 5 6 7 8 1 2 3 4 5 6 7 8 9 109 10
Temp.Temp. 67.4 67.8 68.2 69.3 69.5 67.0 68.1 68.6 67.4 67.8 68.2 69.3 69.5 67.0 68.1 68.6 67.9 67.267.9 67.2
Example: Buyer’s Digest (A)Example: Buyer’s Digest (A)

9 9 Slide
Slide
© 2003 South-Western /Thomson Learning™© 2003 South-Western /Thomson Learning™
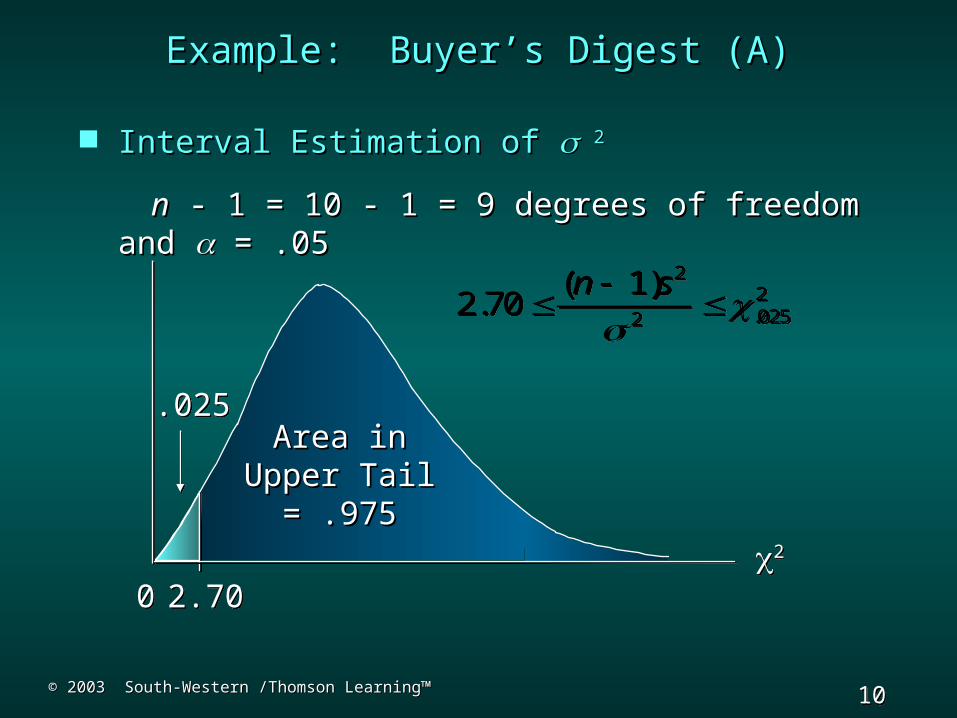
Example: Buyer’s Digest (A)Example: Buyer’s Digest (A)
Interval Estimation of Interval Estimation of 22
nn - 1 = 10 - 1 = 9 degrees of freedom and - 1 = 10 - 1 = 9 degrees of freedom and = .05= .05
22
00
.025.025.025.025
22 2.975 .0252
( 1)n s
2
2 2.975 .0252
( 1)n s
2.9752.975 2
.0252
.025
10 10 Slide
Slide
© 2003 South-Western /Thomson Learning™© 2003 South-Western /Thomson Learning™
Interval Estimation of Interval Estimation of 22
nn - 1 = 10 - 1 = 9 degrees of freedom and - 1 = 10 - 1 = 9 degrees of freedom and = .05= .05
22
00
.025.025
2.702.70
22.0252
( 1)2.70
n s
2
2.0252
( 1)2.70
n s
Example: Buyer’s Digest (A)Example: Buyer’s Digest (A)
Area inArea inUpper TailUpper Tail
= .975= .975

11 11 Slide
Slide
© 2003 South-Western /Thomson Learning™© 2003 South-Western /Thomson Learning™
Example: Buyer’s Digest (A)Example: Buyer’s Digest (A)
Interval Estimation of Interval Estimation of 22
nn - 1 = 10 - 1 = 9 degrees of freedom and - 1 = 10 - 1 = 9 degrees of freedom and = .05= .05
2 701
19 022
2.( )
. n s
2 70
119 02
2
2.( )
. n s
22
00
Area in UpperArea in UpperTail = .025Tail = .025Area in UpperArea in UpperTail = .025Tail = .025
.025.025
2.702.70 19.0219.02

12 12 Slide
Slide
© 2003 South-Western /Thomson Learning™© 2003 South-Western /Thomson Learning™
Interval Estimation of Interval Estimation of 22
Sample variance Sample variance ss22 provides a point estimate of provides a point estimate of 22..
A 95% confidence interval for the population A 95% confidence interval for the population variance is given by:variance is given by:
.33 .33 << 2 2 << 2.33 2.33
sx xni2
2
16 39
70
( ) .
.sx xni2
2
16 39
70
( ) .
.
( )..
( )..
10 1 7019 02
10 1 702 70
2 ( ).
.( ).
.10 1 70
19 0210 1 70
2 702
Example: Buyer’s Digest (A)Example: Buyer’s Digest (A)

13 13 Slide
Slide
© 2003 South-Western /Thomson Learning™© 2003 South-Western /Thomson Learning™
Using Excel to Construct an Interval Using Excel to Construct an Interval EstimateEstimate
of a Population Varianceof a Population Variance Formula WorksheetFormula Worksheet
A B C
1 Temp. Sample Size =COUNT(A2:A11)2 67.4 Variance =VAR(A2:A11)3 67.84 68.2 Confid. Coefficient 0.955 69.3 Level of Signif. (alpha) =1-C46 69.5 Chi-Sq. Value (low. tail) =CHIINV(1-C5/2,C1-1)7 67.0 Chi-Sq. Value (up. tail) =CHIINV(C5/2,C1-1)8 68.1 9 68.6 Point Estimate =C210 67.9 Lower Limit =((C1-1)*C2)/C711 67.2 Upper Limit =((C1-1)*C2)/C6

14 14 Slide
Slide
© 2003 South-Western /Thomson Learning™© 2003 South-Western /Thomson Learning™
Value WorksheetValue Worksheet
Using Excel to Construct an Interval Using Excel to Construct an Interval EstimateEstimate
of a Population Varianceof a Population Variance
A B C
1 Temp. Sample Size 102 67.4 Variance 0.7003 67.84 68.2 Confid. Coefficient 0.955 69.3 Level of Signif. (alpha) 0.056 69.5 Chi-Sq. Value (low. tail) 2.7007 67.0 Chi-Sq. Value (up. tail) 19.0238 68.1 9 68.6 Point Estimate 0.70010 67.9 Lower Limit 0.33111 67.2 Upper Limit 2.333

15 15 Slide
Slide
© 2003 South-Western /Thomson Learning™© 2003 South-Western /Thomson Learning™
Right-Tailed TestRight-Tailed Test
• HypothesesHypotheses
where is the hypothesized value where is the hypothesized value for the for the population variance population variance
• Test StatisticTest Statistic
Hypothesis Testing about a Population Hypothesis Testing about a Population VarianceVariance
H02
02: H0
202:
Ha : 202Ha : 202
22
02
1 ( )n s
22
02
1 ( )n s
20 20
16 16 Slide
Slide
© 2003 South-Western /Thomson Learning™© 2003 South-Western /Thomson Learning™
Hypothesis Testing about a Population Hypothesis Testing about a Population VarianceVariance
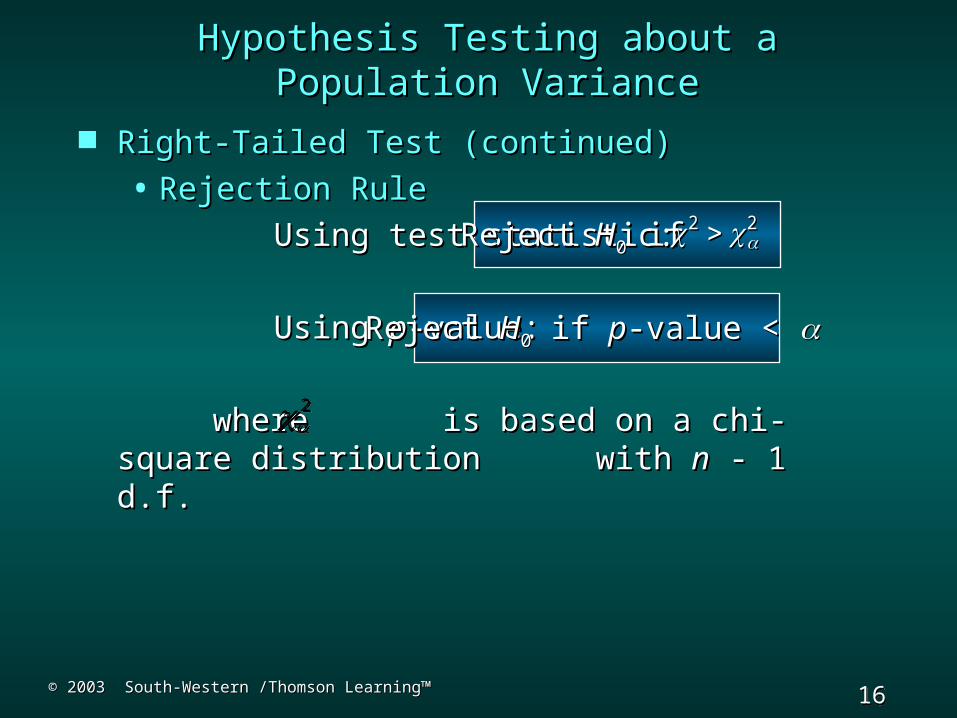
Right-Tailed Test (continued)Right-Tailed Test (continued)
• Rejection RuleRejection Rule
Using test statistic:Using test statistic:
Using Using pp-value:-value:
where is based on a chi-square where is based on a chi-square distribution distribution with with nn - 1 d.f. - 1 d.f.
Reject Reject HH00 if if 2 2 2 2
Reject Reject HH00 if if pp-value < -value <
22

17 17 Slide
Slide
© 2003 South-Western /Thomson Learning™© 2003 South-Western /Thomson Learning™
Left-Tailed TestLeft-Tailed Test
• HypothesesHypotheses
where is the hypothesized value where is the hypothesized value for the for the population variance population variance
• Test StatisticTest Statistic
Hypothesis Testing about a Population Hypothesis Testing about a Population VarianceVariance
2 20 0: H 2 20 0: H
2 20: aH 2 20: aH
22
02
1 ( )n s
22
02
1 ( )n s
20 20

18 18 Slide
Slide
© 2003 South-Western /Thomson Learning™© 2003 South-Western /Thomson Learning™
Left-Tailed Test (continued)Left-Tailed Test (continued)
• Rejection RuleRejection Rule
Using test statistic:Using test statistic:
Using Using pp-value:-value:
where is based on a chi-square where is based on a chi-square distribution distribution with with nn - 1 d.f. - 1 d.f.
Hypothesis Testing about a Population Hypothesis Testing about a Population VarianceVariance
Reject Reject HH00 if if 2 2(1 ) 2 2(1 )
Reject Reject HH00 if if pp-value < -value <
2(1 ) 2(1 )

19 19 Slide
Slide
© 2003 South-Western /Thomson Learning™© 2003 South-Western /Thomson Learning™
Two-Tailed TestTwo-Tailed Test
• HypothesesHypotheses
• Test StatisticTest Statistic
Hypothesis Testing about a Population Hypothesis Testing about a Population VarianceVariance
22
02
1 ( )n s
22
02
1 ( )n s
Ha : 202Ha : 202
H02
02: H0
202:

20 20 Slide
Slide
© 2003 South-Western /Thomson Learning™© 2003 South-Western /Thomson Learning™
Hypothesis Testing about a Population Hypothesis Testing about a Population VarianceVariance
2 2/ 2or 2 2/ 2or 2 2
(1 / 2) 2 2(1 / 2)
2 2(1 / 2) / 2 and 2 2(1 / 2) / 2 and
Two-Tailed Test (continued)Two-Tailed Test (continued)
• Rejection RuleRejection Rule
Using test statistic:Using test statistic:
Reject Reject HH00 if if
Using Using pp-value:-value:
Reject Reject HH00 if if pp-value < -value <
where are based where are based on a on a
chi-square distribution with chi-square distribution with nn - 1 - 1 d.f.d.f.

21 21 Slide
Slide
© 2003 South-Western /Thomson Learning™© 2003 South-Western /Thomson Learning™
Example: Buyer’s Digest (B)Example: Buyer’s Digest (B)
Buyer’s Digest is rating ThermoRite thermostats Buyer’s Digest is rating ThermoRite thermostats made for home temperature control. Buyer’s Digest made for home temperature control. Buyer’s Digest gives an “acceptable” rating to a thermostat with a gives an “acceptable” rating to a thermostat with a temperature variance of 0.5 or less. In a recent test, 10 temperature variance of 0.5 or less. In a recent test, 10 ThermoRite thermostats were selected and placed in a ThermoRite thermostats were selected and placed in a test room that was maintained at a temperature of 68test room that was maintained at a temperature of 68ooF. F. The temperature readings of the thermostats are listed The temperature readings of the thermostats are listed below. below.
Using the 10 readings, we will conduct a hypothesis Using the 10 readings, we will conduct a hypothesis test (with test (with = .05) to determine whether the ThermoRite = .05) to determine whether the ThermoRite thermostat’s temperature variance is “acceptable”.thermostat’s temperature variance is “acceptable”.
Therm.Therm. 1 2 3 4 5 6 7 8 9 1 2 3 4 5 6 7 8 9 10 10 Temp.Temp. 67.4 67.8 68.2 69.3 69.5 67.0 68.1 68.6 67.9 67.4 67.8 68.2 69.3 69.5 67.0 68.1 68.6 67.9 67.2 67.2

22 22 Slide
Slide
© 2003 South-Western /Thomson Learning™© 2003 South-Western /Thomson Learning™
Example: Buyer’s Digest (B)Example: Buyer’s Digest (B)
HypothesesHypotheses
Rejection RuleRejection Rule
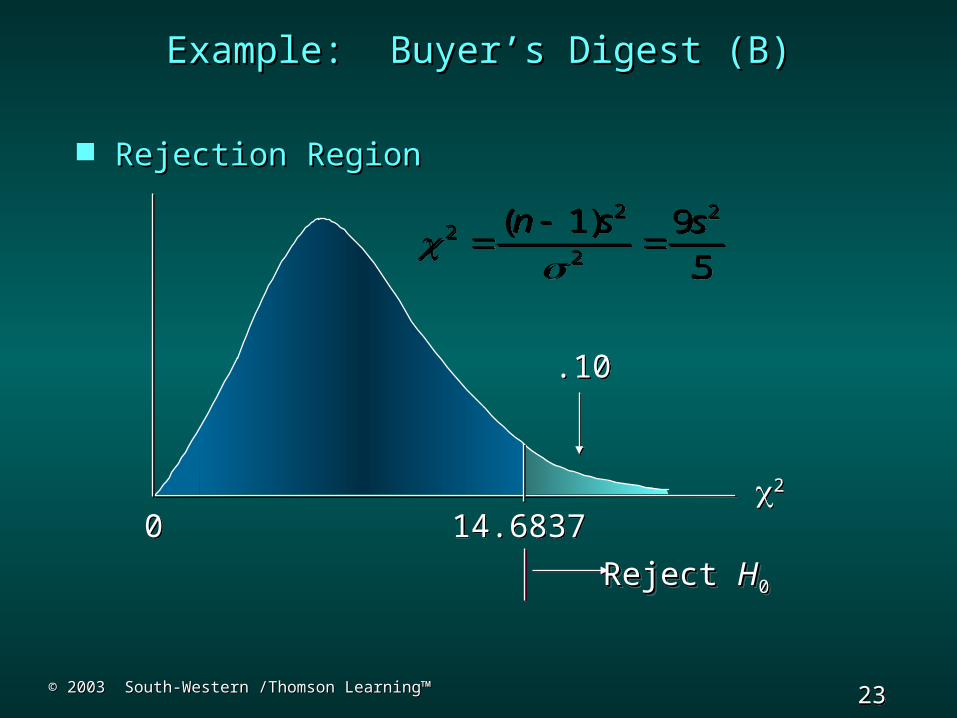
Reject Reject HH00 if if 22 > 14.6837 > 14.6837
20 : 0.5H 20 : 0.5H
2: 0.5aH 2: 0.5aH
23 23 Slide
Slide
© 2003 South-Western /Thomson Learning™© 2003 South-Western /Thomson Learning™
Example: Buyer’s Digest (B)Example: Buyer’s Digest (B)
Rejection RegionRejection Region
22
00
.10.10
2 22
2
( 1) 9.5
n s s
2 2
22
( 1) 9.5
n s s
14.683714.6837
Reject Reject HH00Reject Reject HH00

24 24 Slide
Slide
© 2003 South-Western /Thomson Learning™© 2003 South-Western /Thomson Learning™
Test StatisticTest Statistic
The sample variance The sample variance ss22 = 0.7 = 0.7
ConclusionConclusion
Because Because 22 = 12.6 is less than 14.6837, we = 12.6 is less than 14.6837, we cannot reject cannot reject HH00. The sample variance . The sample variance ss22 = .7 = .7 is insufficient evidence to conclude that the is insufficient evidence to conclude that the temperature variance for ThermoRite temperature variance for ThermoRite thermostats is unacceptable.thermostats is unacceptable.
Example: Buyer’s Digest (B)Example: Buyer’s Digest (B)
2 9(.7)12.6
.5 2 9(.7)
12.6.5

25 25 Slide
Slide
© 2003 South-Western /Thomson Learning™© 2003 South-Western /Thomson Learning™
Using Excel to Conduct a Hypothesis TestUsing Excel to Conduct a Hypothesis Testabout a Population Varianceabout a Population Variance
Formula WorksheetFormula WorksheetA B C
1 Temp. Sample Size =COUNT(A2:A11)2 67.4 Variance =VAR(A2:A11)3 67.84 68.2 Hypothesized Value 0.55 69.36 69.5 Test Statistic =((C1-1)*C2)/C47 67.0 Degrees of Freedom =C1-18 68.1 9 68.6 p -Value (Lower Tail) =1-CHIDIST(C6,C7)10 67.9 p -Value (Upper Tail) =CHIDIST(C6,C7)11 67.2 p -Value (Two Tail) =2*MIN(C9,C10)

26 26 Slide
Slide
© 2003 South-Western /Thomson Learning™© 2003 South-Western /Thomson Learning™
Value WorksheetValue Worksheet
Using Excel to Conduct a Hypothesis TestUsing Excel to Conduct a Hypothesis Testabout a Population Varianceabout a Population Variance
A B C
1 Temp. Sample Size 102 67.4 Variance 0.73 67.84 68.2 Hypothesized Value 0.55 69.36 69.5 Test Statistic 12.67 67.0 Degrees of Freedom 98 68.1 9 68.6 p -Value (Lower Tail) 0.81844336710 67.9 p -Value (Upper Tail) 0.18155663311 67.2 p -Value (Two Tail) 0.363113265
27 27 Slide
Slide
© 2003 South-Western /Thomson Learning™© 2003 South-Western /Thomson Learning™
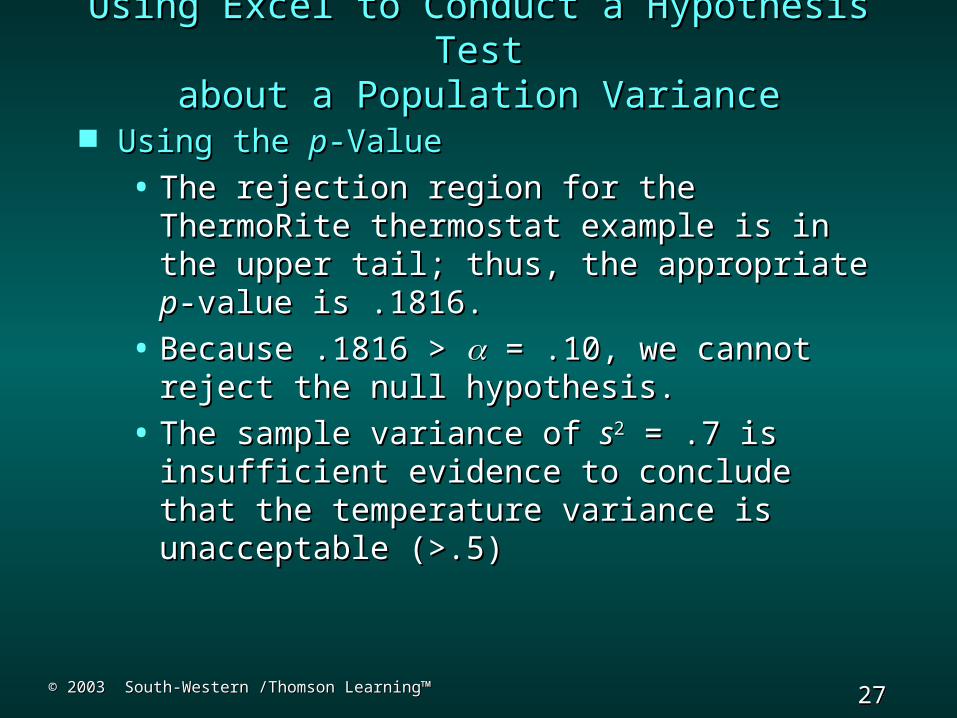
Using Excel to Conduct a Hypothesis TestUsing Excel to Conduct a Hypothesis Testabout a Population Varianceabout a Population Variance
Using the Using the pp-Value-Value
• The rejection region for the ThermoRite The rejection region for the ThermoRite thermostat example is in the upper tail; thermostat example is in the upper tail; thus, the appropriate thus, the appropriate pp-value is .1816.-value is .1816.
• Because .1816 > Because .1816 > = .10, we cannot reject = .10, we cannot reject the null hypothesis.the null hypothesis.
• The sample variance of The sample variance of ss22 = .7 is insufficient = .7 is insufficient evidence to conclude that the temperature evidence to conclude that the temperature variance is unacceptable (>.5)variance is unacceptable (>.5)

28 28 Slide
Slide
© 2003 South-Western /Thomson Learning™© 2003 South-Western /Thomson Learning™
One-Tailed TestOne-Tailed Test
• HypothesesHypotheses
Denote the population providing theDenote the population providing the larger sample variance as population larger sample variance as population
1.1.
• Test StatisticTest Statistic
Hypothesis Testing about the Variances Hypothesis Testing about the Variances of Two Populationsof Two Populations
2 20 1 2: H 2 20 1 2: H
2 21 2: aH 2 21 2: aH
21
22
sFs
21
22
sFs
29 29 Slide
Slide
© 2003 South-Western /Thomson Learning™© 2003 South-Western /Thomson Learning™
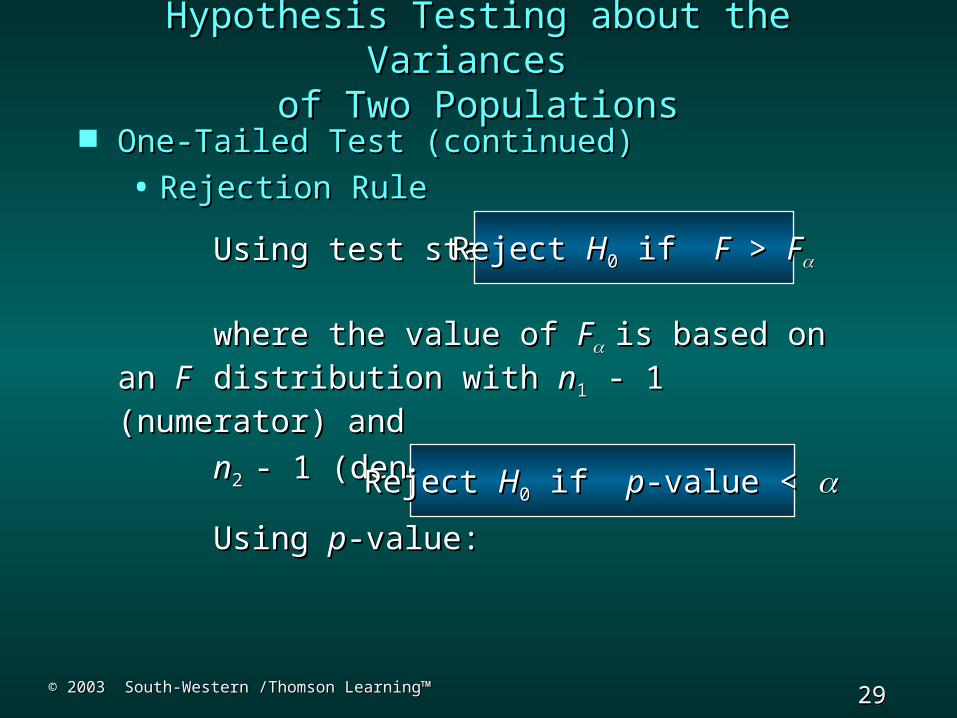
One-Tailed Test (continued)One-Tailed Test (continued)
• Rejection RuleRejection Rule
Using test statistic:Using test statistic:
where the value of where the value of FF is based on an is based on an FF distribution with distribution with nn11 - 1 (numerator) and - 1 (numerator) and
nn2 2 - 1 (denominator) d.f.- 1 (denominator) d.f.
Using Using pp-value:-value:
Hypothesis Testing about the Variances Hypothesis Testing about the Variances of Two Populationsof Two Populations
Reject Reject HH00 if if FF > > FF
Reject Reject HH00 if if pp-value < -value <

30 30 Slide
Slide
© 2003 South-Western /Thomson Learning™© 2003 South-Western /Thomson Learning™
Two-Tailed TestTwo-Tailed Test
• HypothesesHypotheses
Denote the population providing theDenote the population providing the larger sample variance as population larger sample variance as population
1.1.
• Test StatisticTest Statistic
Hypothesis Testing about the Variances Hypothesis Testing about the Variances of Two Populationsof Two Populations
H0 12
22: H0 1
222:
Ha : 12
22Ha : 1
222
21
22
sFs
21
22
sFs

31 31 Slide
Slide
© 2003 South-Western /Thomson Learning™© 2003 South-Western /Thomson Learning™
Two-Tailed Test (continued)Two-Tailed Test (continued)
• Rejection RuleRejection Rule
Using test statistic:Using test statistic:
where the value of where the value of FF/2 /2 is based on an is based on an FF distribution with distribution with nn11 - 1 (numerator) and - 1 (numerator) and
nn2 2 - 1 (denominator) d.f.- 1 (denominator) d.f.
Using Using pp-value:-value:
Hypothesis Testing about the Variances Hypothesis Testing about the Variances of Two Populationsof Two Populations
Reject Reject HH00 if if FF > > FF/2/2
Reject Reject HH00 if if pp-value < -value <

32 32 Slide
Slide
© 2003 South-Western /Thomson Learning™© 2003 South-Western /Thomson Learning™
Buyer’s Digest has conducted the same test, as wasBuyer’s Digest has conducted the same test, as was
described earlier, on another 10 thermostats, this time described earlier, on another 10 thermostats, this time
manufactured by TempKing. The temperature readingsmanufactured by TempKing. The temperature readings
of the ten thermostats are listed below. of the ten thermostats are listed below.
We will conduct a hypothesis test with We will conduct a hypothesis test with = .10 to see = .10 to see
if the variances are equal for ThermoRite’s thermostatsif the variances are equal for ThermoRite’s thermostats
and TempKing’s thermostats.and TempKing’s thermostats.
Therm.Therm. 11 22 33 44 55 66 77 88 99 10 10 Temp.Temp. 66.466.467.867.868.268.270.370.3 69.5 69.5 68.0 68.1 68.6 67.9 68.0 68.1 68.6 67.9
66.266.2
Example: Buyer’s Digest (C)Example: Buyer’s Digest (C)

33 33 Slide
Slide
© 2003 South-Western /Thomson Learning™© 2003 South-Western /Thomson Learning™
Hypothesis Testing about the Variances of Two Hypothesis Testing about the Variances of Two PopulationsPopulations
• HypothesesHypotheses
(TempKing and ThermoRite (TempKing and ThermoRite thermo-thermo- stats have same stats have same temperature variance)temperature variance)
(Their variances are not equal)(Their variances are not equal)
• Rejection RuleRejection Rule
The The FF distribution table shows that with distribution table shows that with = .10,= .10,
9 d.f. (numerator), and 9 d.f. (denominator), 9 d.f. (numerator), and 9 d.f. (denominator),
FF.05.05 = 3.18. = 3.18.
Reject Reject HH00 if if FF > 3.18 > 3.18
H0 12
22: H0 1
222:
Ha : 12
22Ha : 1
222
Example: Buyer’s Digest (C)Example: Buyer’s Digest (C)
34 34 Slide
Slide
© 2003 South-Western /Thomson Learning™© 2003 South-Western /Thomson Learning™
Hypothesis Testing about the Variances of Two Hypothesis Testing about the Variances of Two PopulationsPopulations
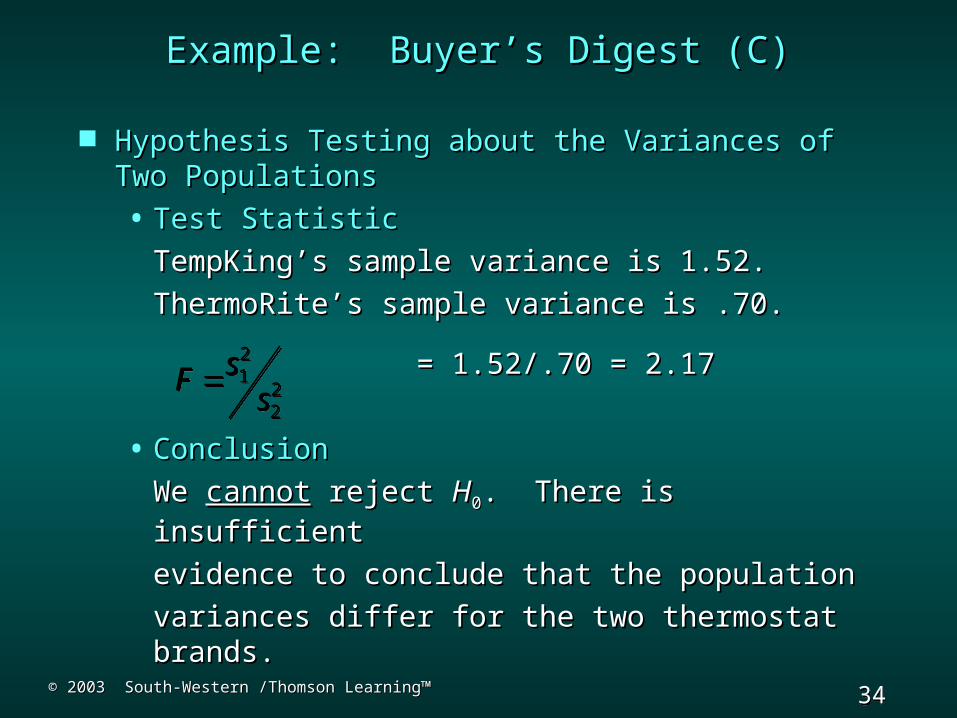
• Test StatisticTest Statistic
TempKing’s sample variance is 1.52.TempKing’s sample variance is 1.52.
ThermoRite’s sample variance is .70.ThermoRite’s sample variance is .70.
= 1.52/.70 = 2.17= 1.52/.70 = 2.17
• ConclusionConclusion
We We cannotcannot reject reject HH00. There is . There is insufficient insufficient
evidence to conclude that the populationevidence to conclude that the population
variances differ for the two thermostat variances differ for the two thermostat brands.brands.
Example: Buyer’s Digest (C)Example: Buyer’s Digest (C)
21
22
sFs
21
22
sFs

35 35 Slide
Slide
© 2003 South-Western /Thomson Learning™© 2003 South-Western /Thomson Learning™
Excel’s F-Test Two-Sample for Variances ToolExcel’s F-Test Two-Sample for Variances Tool
Step 1: Step 1: Select the Select the ToolsTools pull-down menu pull-down menu
Step 2:Step 2: Choose the Choose the Data AnalysisData Analysis option option
Step 3:Step 3: When the Data Analysis dialog box When the Data Analysis dialog box appears:appears:
Choose Choose F-Test Two Sample for F-Test Two Sample for VariancesVariances
Click Click OKOK
… … continuecontinue
Using Excel to Conduct a Hypothesis TestUsing Excel to Conduct a Hypothesis Testabout the Variances of Two Populationsabout the Variances of Two Populations
36 36 Slide
Slide
© 2003 South-Western /Thomson Learning™© 2003 South-Western /Thomson Learning™
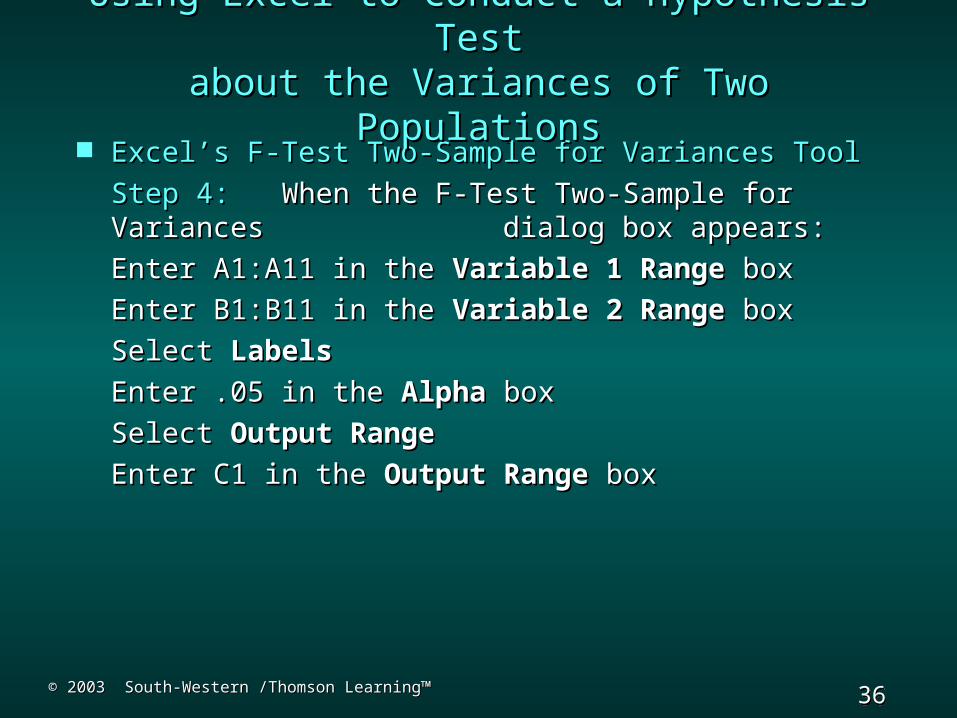
Excel’s F-Test Two-Sample for Variances ToolExcel’s F-Test Two-Sample for Variances Tool
Step 4: Step 4: When the F-Test Two-Sample for When the F-Test Two-Sample for Variances Variances dialog box appears: dialog box appears:
Enter A1:A11 in the Enter A1:A11 in the Variable 1 Variable 1 RangeRange box box
Enter B1:B11 in the Enter B1:B11 in the Variable 2 Variable 2 RangeRange box box
Select Select LabelsLabels
Enter .05 in the Enter .05 in the AlphaAlpha box box
Select Select Output RangeOutput Range
Enter C1 in the Enter C1 in the Output RangeOutput Range box box
Using Excel to Conduct a Hypothesis TestUsing Excel to Conduct a Hypothesis Testabout the Variances of Two Populationsabout the Variances of Two Populations

37 37 Slide
Slide
© 2003 South-Western /Thomson Learning™© 2003 South-Western /Thomson Learning™
Value WorksheetValue Worksheet
Using Excel to Conduct a Hypothesis TestUsing Excel to Conduct a Hypothesis Testabout the Variances of Two Populationsabout the Variances of Two Populations
A B C D E
1Temp-King
Therm-oRite F-Test Two-Sample for Variances
2 66.4 67.43 67.8 67.8 Temp-King Therm-oRite4 68.2 68.2 Mean 68.1 68.15 70.3 69.3 Variance 1.5222 0.70006 69.5 69.5 Observations 10 107 68.0 67.0 df 9 98 68.1 68.1 F 2.17469 68.6 68.6 P(F<=f) one-tail 0.1314
10 67.9 67.9 F Critical one-tail 3.178911 66.2 67.2

38 38 Slide
Slide
© 2003 South-Western /Thomson Learning™© 2003 South-Western /Thomson Learning™
Using Excel to Conduct a Hypothesis TestUsing Excel to Conduct a Hypothesis Testabout the Variances of Two Populationsabout the Variances of Two Populations
Determining and Using the Determining and Using the pp-Value-Value
• The output labeled P(F<=f) one-tail, 0.1314, The output labeled P(F<=f) one-tail, 0.1314, can be used to determine the can be used to determine the pp-value for the -value for the hypothesis test.hypothesis test.
• If the thermostat example had been a one-If the thermostat example had been a one-tailed hypothesis test, this would have been tailed hypothesis test, this would have been the the pp-value.-value.
• Because the thermostat example is a two-Because the thermostat example is a two-tailed test, we must multiply the 0.1314 value tailed test, we must multiply the 0.1314 value by 2 to obtain the correct by 2 to obtain the correct pp-value, 0.2628.-value, 0.2628.
• Because .2628 > Because .2628 > = .10, we cannot reject = .10, we cannot reject the null hypothesis.the null hypothesis.

39 39 Slide
Slide
© 2003 South-Western /Thomson Learning™© 2003 South-Western /Thomson Learning™
End of Chapter 11End of Chapter 11