1. 1. Product Control: to prove a particular gage is capable of distinguishing good parts from bad...
38
GR&R and MSA Training 1
-
Upload
jayson-chase -
Category
Documents
-
view
214 -
download
0
Transcript of 1. 1. Product Control: to prove a particular gage is capable of distinguishing good parts from bad...

GR&R and MSA Training
1
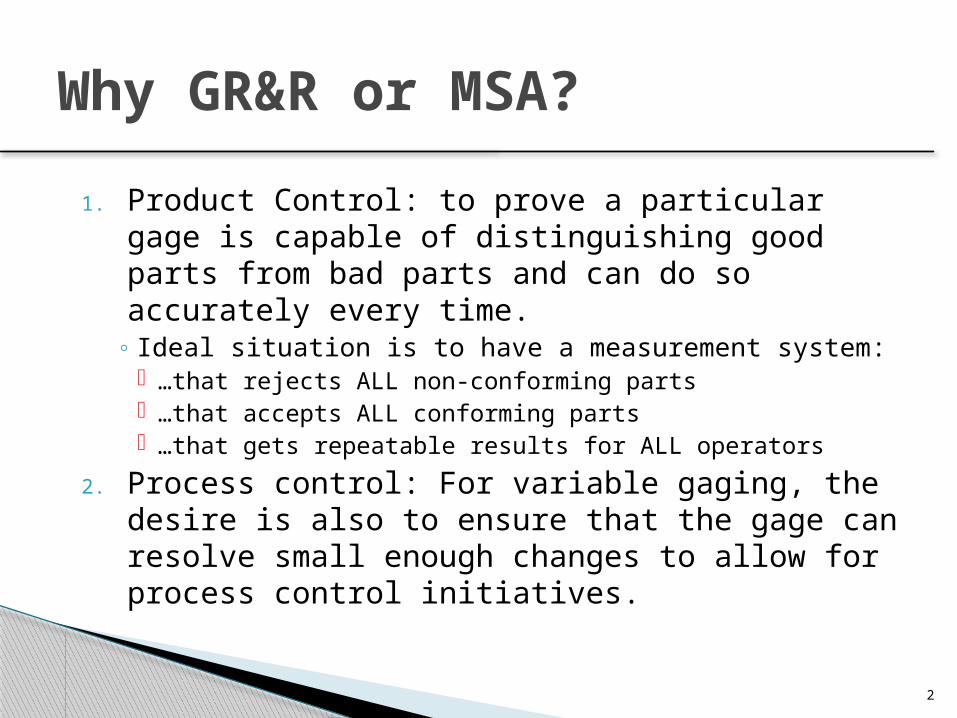
1. Product Control: to prove a particular gage is capable of distinguishing good parts from bad parts and can do so accurately every time.
◦ Ideal situation is to have a measurement system: …that rejects ALL non-conforming parts …that accepts ALL conforming parts …that gets repeatable results for ALL operators
2. Process control: For variable gaging, the desire is also to ensure that the gage can resolve small enough changes to allow for process control initiatives.
Why GR&R or MSA?
2

Gage Repeatability & Reproducibility
Repeatability: how consistently one person obtains the same measurement on a part◦ also known as Equipment Variability (EV) or within
system variation Reproducibility: how consistently multiple
people obtain the same measurement on a part◦ also known as Appraiser Variability (AV) or between
system variation
GR&R
3
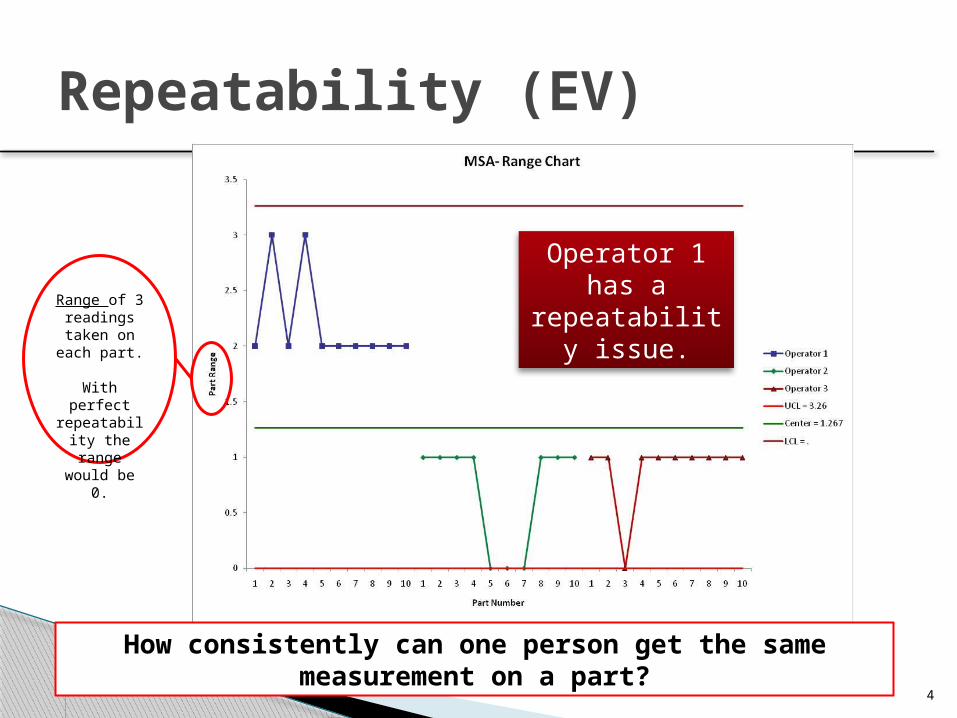
Repeatability (EV)
How consistently can one person get the same measurement on a part?
Operator 1 has a
repeatability issue.
Range of 3 readings taken on each part.
With perfect repeatability
the range would be 0.
4

Reproducibility (AV)
How consistently can multiple people get the same measurement on a part?
Operator 3 has a
reproducibility issue.
Average of 3 readings taken on each part.
With perfect reproducibility all lines would be exactly the
same.
5
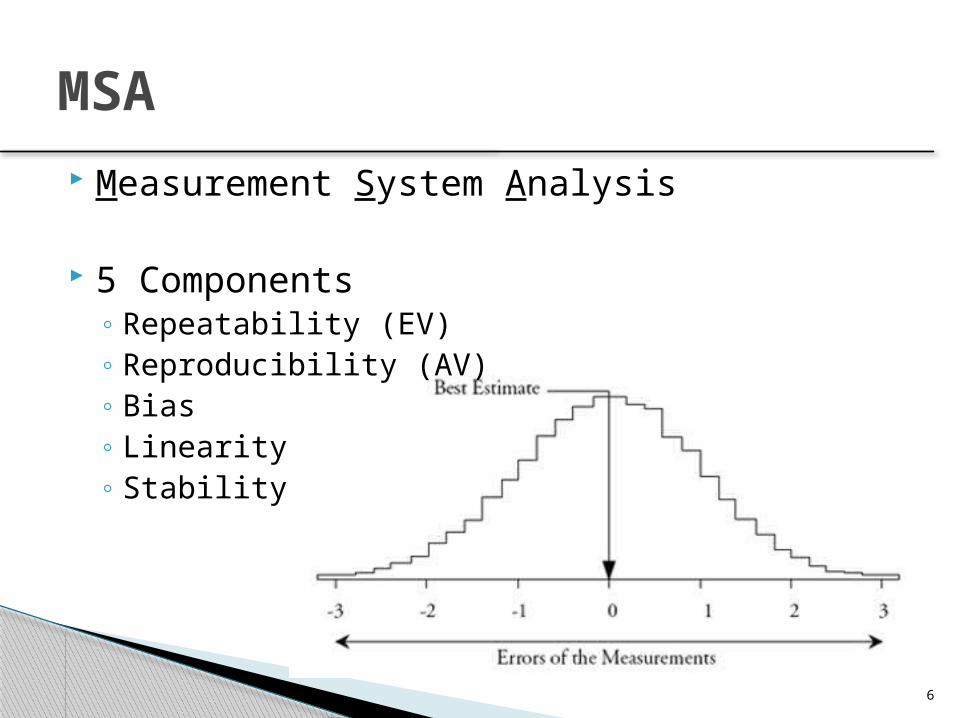
Measurement System Analysis
5 Components◦ Repeatability (EV)◦ Reproducibility (AV)◦ Bias◦ Linearity◦ Stability
MSA
6

Bias: The difference between the average of measurements and a standard value.
MSA - Bias
Bias
Value of known standard Average of measured value
Measurement Scale
7

Linearity: The difference in bias or repeatability at different points in the operating range of the gage.
MSA - Linearity
Measurement Scale High EndLow End
8

Stability: Variation in measurements of a known master over an extended period of time.◦ Variation can be in the amount or direction of
bias.◦ Variation can be in the repeatability of the
measurement.
MSA - Stability
9

10
Go watch the inspection◦ Look for potential issues with the gage◦ Look for potential issues with the method being
used◦ ASK QUESTIONS!!
Make sure you understand what is being inspected and how it is being inspected◦ Validate the gage is calibrated◦ Understand it’s finest level of discrimination
(.001, .0001, etc). Does it meet the 10:1 rule? View more than one operator if you can
◦ Look for differences in technique
Performing a StudyBefore you get started…

11
Ask to see specific instructions on the usage of the gage. (preferably written instructions)◦ If there are no formal instructions on the usage of
the gage help the operators create some.◦ Include several of the usual inspectors in the
creation of the instructions to make sure they are all on the same page.
Performing a StudyBefore you get started…
The key to a successful study is to reduce all possible variation. Eliminate as much variation as possible BEFORE getting started.

Define: The gage, the SOP, the desired outcome, etc.
Measure: Do the study Analyze: Review the study and determine if
it is acceptable or if it needs improvement Improve: Determine any changes that can
or should be made to improve the variation Control: Lock in all changes and critical
settings as part of the SOP
DMAIC
12

Performing a Study
The next slides specifically apply to Variable Data studies.
Attribute (Go/NoGo) studies will be covered later.
13

People◦ Preferably get 3 people that are familiar with
the parts, the gage, and the feature.◦ If that is not possible, get people that have
used the specific or similar gage on other parts.
◦ If that is not possible, get people that have used a wide variety of gages and can be trained on the usage of the gage by an expert.
Performing a StudyPeople, Parts & the Gage
The further you must go down this list the more variation is being brought into the study.
14
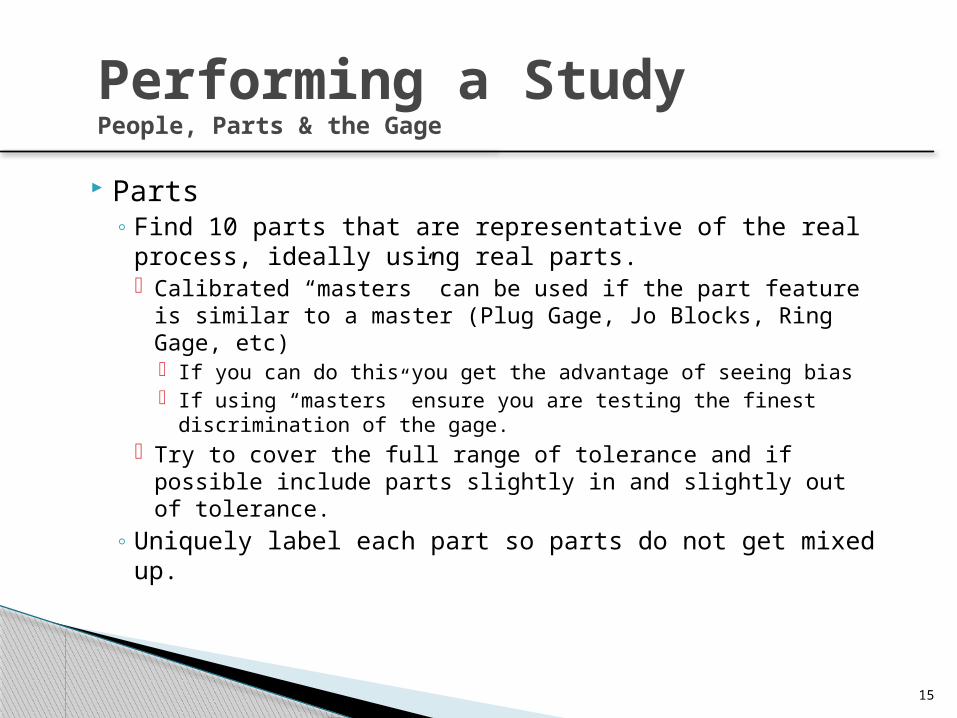
Parts◦ Find 10 parts that are representative of the real
process, ideally using real parts. Calibrated “masters” can be used if the part feature is
similar to a master (Plug Gage, Jo Blocks, Ring Gage, etc) If you can do this you get the advantage of seeing bias If using “masters” ensure you are testing the finest
discrimination of the gage. Try to cover the full range of tolerance and if possible
include parts slightly in and slightly out of tolerance.◦ Uniquely label each part so parts do not get mixed
up.
Performing a StudyPeople, Parts & the Gage
15

Parts (cont.)
◦ Variation between parts is the only variation in a study that is good.
◦ Look for the “right” amount of variation Enough spread to prove the gage can tell the
difference between parts. Not too much spread where the operator will start
to remember specific readings. Have several parts either “identical” or very close
in size as part of the group. Have sample parts at or very near each spec.
limit.
Performing a StudyPeople, Parts & the Gage
16

Parts (cont.)
Performing a StudyPeople, Parts & the Gage
.4990
.4992
.4994
.4996
.4998
.5000
.5003
.5006
.5009
.5010
Example: .495 - .505 OD with OD Mic. (w/ Vernier Scale)
.4900
.4920
.4940
.4960
.4980
.5000
.5020
.5040
.5060
.5080
.4948
.4950
.4952
.4973
.4999
.5001
.5024
.5047
.5050
.5051
BAD• WAY below &
above Spec.
• No usage of .0001’s
• Even increments may be remembered by operators regardless of randomization.
• No points @ Spec
So-So• Too tightly
within spec limits
• Ok usage of .0001’s
• Fairly Even increments may be remembered by operators regardless of randomization.
• No points @ Spec
Best• Good grouping
at both limits (in and out)
• Good usage of .0001’s
• All but 2 points hard to “remember” due to similar parts.
• Points at both specs & split
17

Gage◦ Does the gage have the right number of
discriminations for the measurement? Minimum of 5 Prefer 10 or more
◦ Verify calibration◦ Verify gage is functioning properly◦ Verify there is nothing with the gage that will
obviously sink your study.◦ If it requires “zeroing” determine what that
process will be for each inspector BEFORE starting.
Performing a StudyPeople, Parts & the Gage
18

BE PRESENT!!!!◦ Administer the study yourself.◦ Watch each operator closely◦ Document anything you notice (differences, similarities,
special “tricks,” speed, anything the operator is doing that they may not even realize they are doing.)
◦ When analyzing the study there is no substitute for personal observation.
Blind test randomization◦ Give the parts to the operators “randomly”◦ This ensures they don’t remember the “right” values◦ This also protects against error due to “slop” in the
gage
Performing a StudyThe study itself…
19

Location◦ If possible, perform the study in the same type
of environment as the actual inspections would occur
◦ Document anything about the location or environment that may be affecting the study
Timing◦ If possible, perform the study in as tight of a
time window as possible to minimize variation (unless you are doing a stability study)
Performing a StudyThe study itself…
20

Key Points to Remember:◦ BE PRESENT!!◦ Variation is the enemy◦ Observe & document everything you can
Performing a StudyThe study itself…
The more thorough you are doing the study, the more likely it is to pass.
and…
If it does fail, the more ammunition you’ll have to fix it!
21
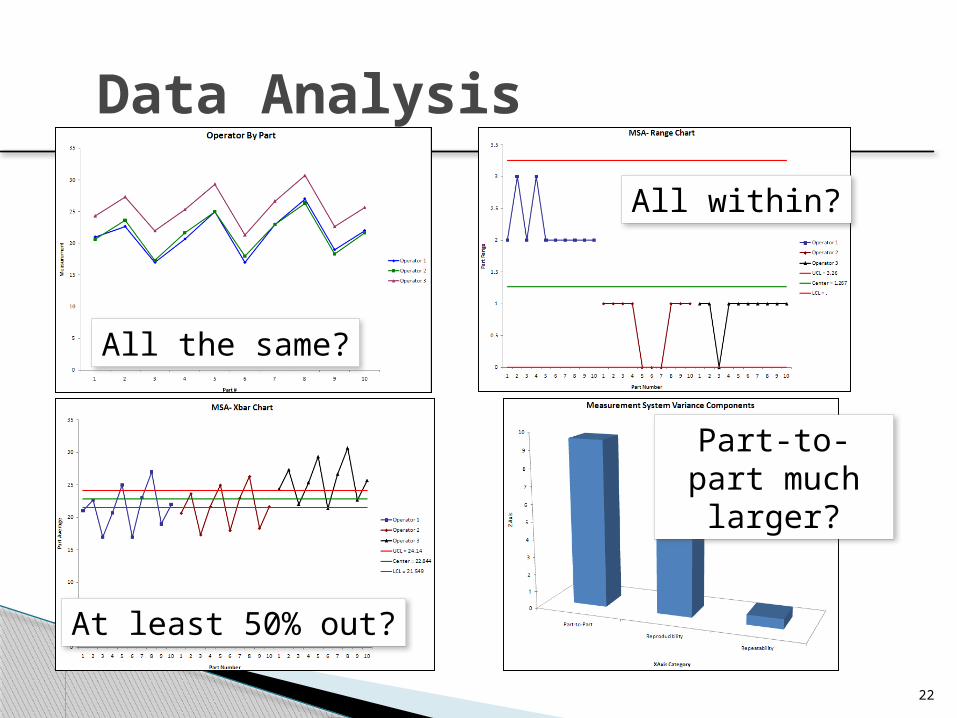
Data Analysis
All the same?
At least 50% out?
All within?
Part-to-part much larger?
22

Take the Std. Dev of the Total Measure and multiply by 5.15 (Some people will say 6)
What’s the GR&R?
2.445 * 5.15 = 12.59(This gives 99% Confidence)
2.445 * 6 = 14.67(This gives 99.73%
Confidence)
23

Documentation is everything!◦ Add a “purpose” tab to your file that includes a
detailed write up including at least: The date, location, and person giving the study. The people, parts, and gage used. Detailed instructions on how the gage was used
(attach electronic setup sheet, pictures, etc). A write up of your final analysis along with the
rationale used. Include any other observation you may have had
along the way that could be used to replicate or improve upon the study.
Finishing Up…
24

Study Complete!◦ Pass: Save a copy of your study into an
appropriate folder within the GR&R reports area
~or~
◦ Fail: DMAIC!
Finishing Up…
25

MSA Data Template
Date: 6/18/2010Part Type:
USL: 1.0LSL: 0.5
Operator 1 Operator 2 Operator 3Part # Reference Rep 1 Rep 2 Rep 3 Rep 1 Rep 2 Rep 3 Rep 1 Rep 2 Rep 3
1 0.65 0.6 0.6 0.6 0.6 0.65 0.6 0.65 0.62 1 0.95 0.95 0.95 0.95 0.95 0.95 1 13 0.85 0.8 0.8 0.8 0.75 0.75 0.8 0.8 0.854 0.85 0.95 0.9 0.8 0.75 0.75 0.8 0.8 0.85 0.55 0.45 0.5 0.4 0.4 0.45 0.45 0.5 0.456 1 1 1 1 1.05 1 1 1.05 17 0.95 0.95 0.95 0.95 0.9 0.9 0.95 0.95 0.98 0.85 0.8 0.85 0.75 0.7 0.75 0.8 0.8 0.89 1 1 1 1 0.95 0.95 1.05 1.05 110 0.6 0.65 0.65 0.55 0.5 0.55 0.65 0.6 0.6
Variable Gage R&R Class Example
For Attribute data enter A for Accept and R for Reject
Description:
26
Perform in class exercise

Do nothing? Find a new gage? Do it over? Change our tolerance? Do something to improve it?
FAIL: Now What?
Let’s try something unorthodox!
D M A I C27

28
Define:◦ We have an unacceptable GR&R or MSA!
Measure:◦ We have a GR&R of .0376 and our tolerance is .5◦ We have an EV of .0256 (8.8% of tolerance)◦ We have an AV of .0275 (9.48% of tolerance)◦ We are using 45.12% of tolerance and we know
we need to be less than 30%, preferable 10%
Continuous Improvement
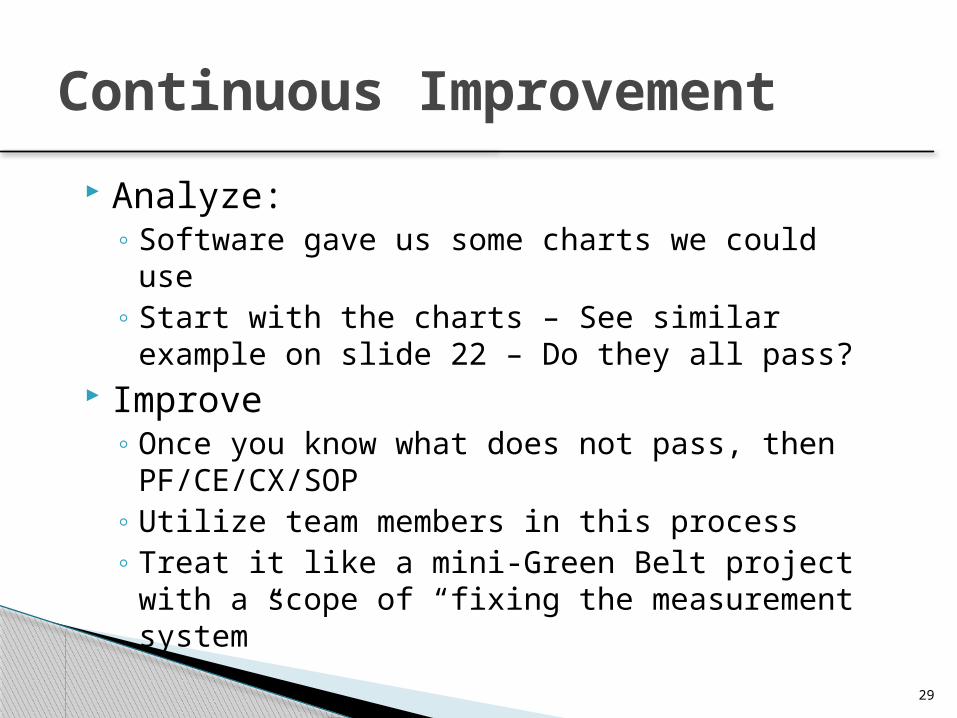
Analyze:◦ Software gave us some charts we could use◦ Start with the charts – See similar example on
slide 22 – Do they all pass? Improve
◦ Once you know what does not pass, then PF/CE/CX/SOP
◦ Utilize team members in this process◦ Treat it like a mini-Green Belt project with a
scope of “fixing the measurement system”
Continuous Improvement
29
30
Control◦ Revise and add detail to the original SOP to
reduce/eliminate variation identified by the team with the PF, CE, & CNX.
◦ Officially re-perform the study and begin the DMAIC process over again as necessary until the study gets below 30% of tolerance, 10% preferred
Continuous Improvement

Variable Study Questions?
31
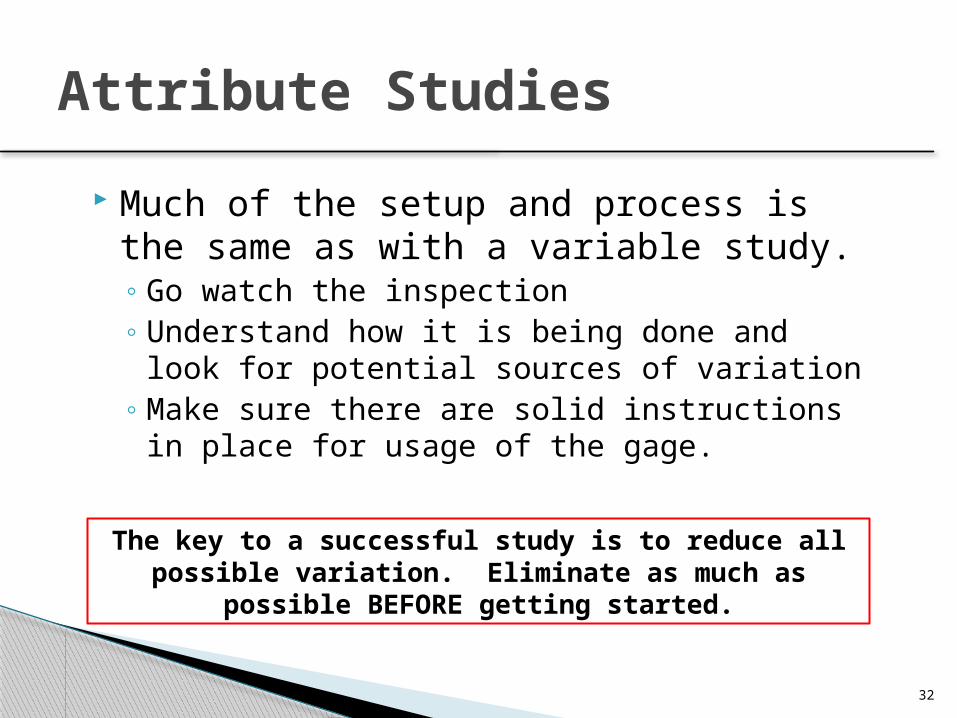
Much of the setup and process is the same as with a variable study.◦ Go watch the inspection◦ Understand how it is being done and look for
potential sources of variation◦ Make sure there are solid instructions in place
for usage of the gage.
Attribute Studies
The key to a successful study is to reduce all possible variation. Eliminate as much as possible BEFORE getting started.
32

33
People◦ This type of study uses 2 people instead of 3.
Parts◦ This type of study uses 20 parts vs. 10 parts.◦ Ideally, calibrated “masters” should be used.◦ It is as, or more, important to cover the entire range of
tolerance in this type of study.◦ If possible, have parts that are barely “good” and barely
“bad” for each potential failure mode.◦ Ideally, there should be parts that represent all types of
failure modes within the sample of parts. Gage
◦ Verify calibration and proper function.
Performing a StudyPeople, Parts & the Gage

Just like variable study…◦ BE PRESENT & document everything◦ Use randomization when evaluating the parts◦ Do the study in the normal environment where
parts will be checked in production◦ Try to get through all the checks in “one
sitting” if at all possible
Performing a StudyThe study itself…
34

MSA Data Template
Date: 6/18/2010
Part Type:
USL:
LSL:
Operator 1 Operator 2 Operator 3
Part # Reference Rep 1 Rep 2 Rep 1 Rep 2 Rep 1 Rep 2
1 a a a a a a a
2 r r r a r r r
3 a a a r r r a
4 a r a r r a a
5 r r r r r a r
6 r r r r r a a
7 r a r r r r a
8 r r r a a a a
9 r r r r r a r
10 a a a r r a a
35
Attribute Gage R&R Example
For Attribute data enter A for Accept and R for Reject
Description:
Perform in class exercise

Fixing an unacceptable attribute study is the same as a variable study.◦ Treat it like a mini-project◦ Create PF, CE, CNX and SOP
The disadvantage is that you may not have as clear of a direction to start from due to no EV, AV or charts/graphs.
Look at P(FR) and P(FA) for sources of error. Attack any sources of variation!
Unacceptable Attribute Studies
36

Attribute Study Questions?
37

Observe the entire process Document everything you see Reduce or eliminate any sources of variation
Lock down the final process with a detailed SOP
Final Thoughts…
38