0DWHULDO (6, IRU0HWDOORPLFV 7KLV - RSC
17
S1 Electronic Supplementary Information (ESI) Pharmaco-genomic Investigations of Organo-iridium Anticancer Complexes Reveal Novel Mechanism of Action Jessica M. Hearn, George M. Hughes, Isolda Romero-Caneln, Alison F. Munro, Belén Rubio-Ruiz, Zhe Liu, Neil O. Carragher, and Peter J. Sadler Supplementary Material Methods S2 Table S1 S6 Table S2 S7 Table S3 S8 Table S4 S9 Figure S1 S11 Figure S2 S12 Figure S3 S13 Figure S4 S14 Figure S5 S15 Figure S6 S16 Figure S7 S17 Reference S17 Electronic Supplementary Material (ESI) for Metallomics. This journal is © The Royal Society of Chemistry 2017
Transcript of 0DWHULDO (6, IRU0HWDOORPLFV 7KLV - RSC

S1
Electronic Supplementary Information (ESI)
Pharmaco-genomic Investigations of Organo-iridium Anticancer Complexes Reveal Novel Mechanism of Action
Jessica M. Hearn, George M. Hughes, Isolda Romero-Canelon, Alison F. Munro, Belén Rubio-Ruiz, Zhe Liu, Neil O. Carragher, and Peter J. Sadler
Supplementary Material
Methods S2
Table S1 S6
Table S2 S7
Table S3 S8
Table S4 S9
Figure S1 S11
Figure S2 S12
Figure S3 S13
Figure S4 S14
Figure S5 S15
Figure S6 S16
Figure S7 S17
Reference S17
Electronic Supplementary Material (ESI) for Metallomics.This journal is © The Royal Society of Chemistry 2017
S2
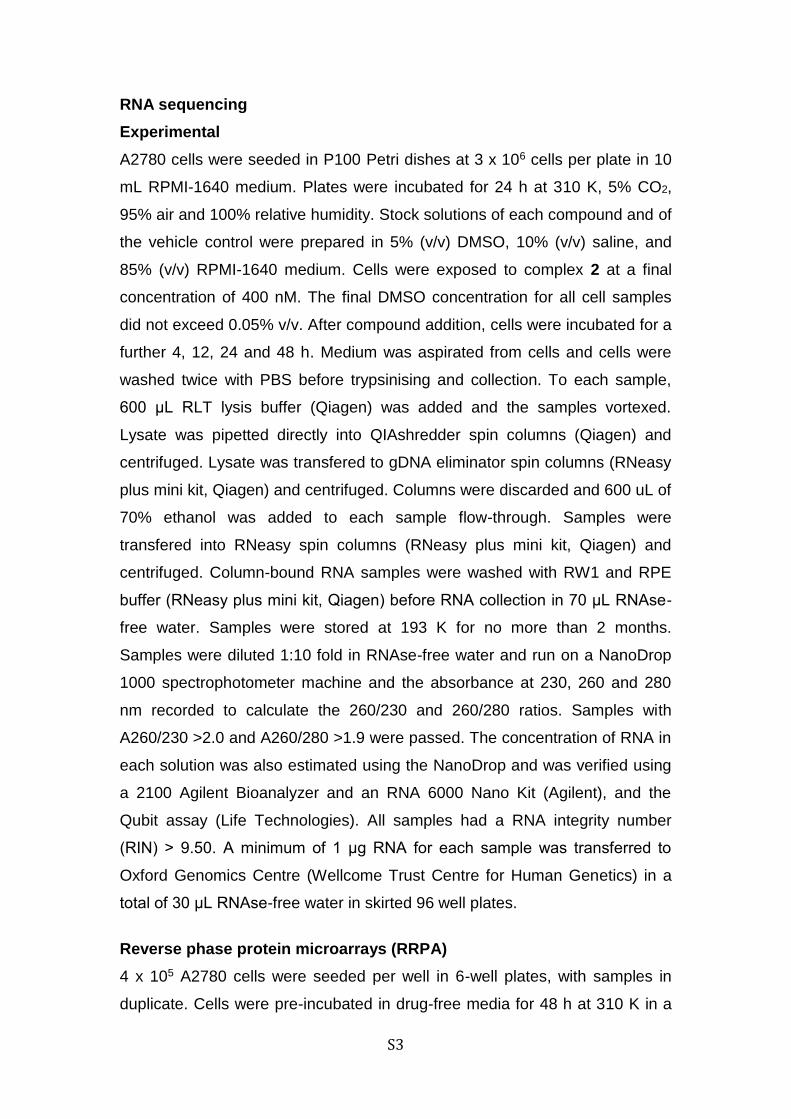
Methods Roswell Park Memorial Institute (RPMI-1640) medium, as well as foetal
bovine serum, L-glutamine, penicillin/streptomycin mixture, trypsin,
trypsin/EDTA, phosphate buffered saline (PBS) were purchased from PAA
Laboratories GmbH. HPLC grade ethanol, β-mercaptoethanol, PI (>94%),
Annexin V-FITC Apoptosis Detection Kit and RNAse A were obtained from
Sigma Aldrich. For RNA sequencing, cell shredders and mini-prep kits were
purchased from Qiagen.
Cell maintenance
The A2780, human ovarian carcinoma cell line was obtained from the
European Collection of Cell Cultures (ECACC). Cells were grown in RPMI-
1640 medium supplemented with 10% (v/v) foetal calf serum, 1% (v/v) 2 mM
glutamine and 1% (v/v) penicillin (10 k units/mL)/streptomycin (10 mg/mL). All
cells were maintained in 75 mL culture flasks at 310 K with 5% CO2
humidified atmosphere. Cells were grown as adherent monolayers and split
when 80-90% confluent, using 0.25% trypsin.
Screening in the Sanger cell panel
Briefly, cells were seeded in 96 well plates at ca.15% confluency and left to
incubate for 24 h at 310 K, 5% CO2, 95% air and 100% relative humidity. For
adherent cell lines, cells were treated with nine concentrations of each
compound (2-fold dilution series over 256-fold concentration range) and
returned to the incubator for 72 h. Cells were then fixed with 4% formaldehyde
for 30 min and stained with 1 μM Syto60 for 1 h. Quantitation of fluorescent
signal intensity was performed using a plate reader at excitation/emission
wavelengths of 630/695 nm. For suspension cell lines, cells were treated with
compound immediately following plating, and returned to the incubator for 72
h. Cells were stained with 55 μg/mL Resazurin, prepared in glutathione-free
medium, for 4 h. Quantitation of fluorescent signal intensity was performed
using a plate reader at excitation/emission wavelengths of 535/595 nm.
MANOVA analysis was performed by the Sanger Bioinformatics Institute. All
Figures presented here were reconstructed using the R statistical programme.
S3
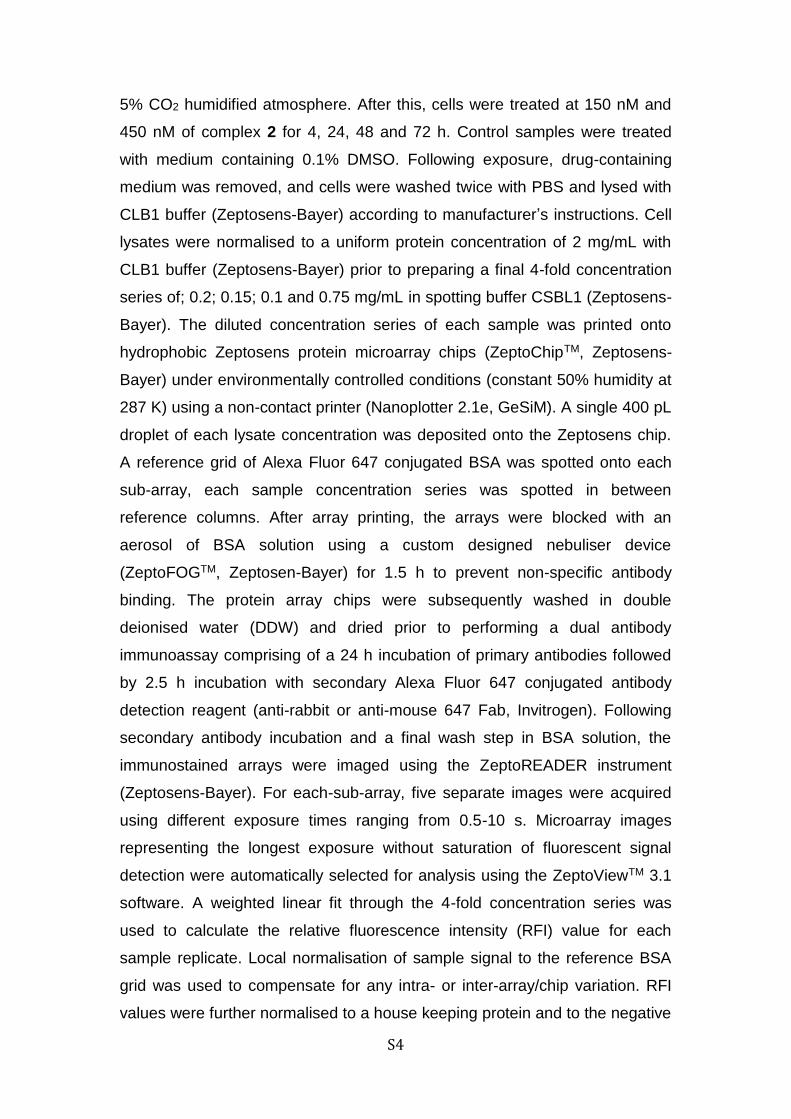
RNA sequencing
Experimental
A2780 cells were seeded in P100 Petri dishes at 3 x 10⁶ cells per plate in 10
mL RPMI-1640 medium. Plates were incubated for 24 h at 310 K, 5% CO2,
95% air and 100% relative humidity. Stock solutions of each compound and of
the vehicle control were prepared in 5% (v/v) DMSO, 10% (v/v) saline, and
85% (v/v) RPMI-1640 medium. Cells were exposed to complex 2 at a final
concentration of 400 nM. The final DMSO concentration for all cell samples
did not exceed 0.05% v/v. After compound addition, cells were incubated for a
further 4, 12, 24 and 48 h. Medium was aspirated from cells and cells were
washed twice with PBS before trypsinising and collection. To each sample,
600 μL RLT lysis buffer (Qiagen) was added and the samples vortexed.
Lysate was pipetted directly into QIAshredder spin columns (Qiagen) and
centrifuged. Lysate was transfered to gDNA eliminator spin columns (RNeasy
plus mini kit, Qiagen) and centrifuged. Columns were discarded and 600 uL of
70% ethanol was added to each sample flow-through. Samples were
transfered into RNeasy spin columns (RNeasy plus mini kit, Qiagen) and
centrifuged. Column-bound RNA samples were washed with RW1 and RPE
buffer (RNeasy plus mini kit, Qiagen) before RNA collection in 70 μL RNAse-
free water. Samples were stored at 193 K for no more than 2 months.
Samples were diluted 1:10 fold in RNAse-free water and run on a NanoDrop
1000 spectrophotometer machine and the absorbance at 230, 260 and 280
nm recorded to calculate the 260/230 and 260/280 ratios. Samples with
A260/230 >2.0 and A260/280 >1.9 were passed. The concentration of RNA in
each solution was also estimated using the NanoDrop and was verified using
a 2100 Agilent Bioanalyzer and an RNA 6000 Nano Kit (Agilent), and the
Qubit assay (Life Technologies). All samples had a RNA integrity number
(RIN) > 9.50. A minimum of 1 μg RNA for each sample was transferred to
Oxford Genomics Centre (Wellcome Trust Centre for Human Genetics) in a
total of 30 μL RNAse-free water in skirted 96 well plates.
Reverse phase protein microarrays (RRPA)
4 x 10⁵ A2780 cells were seeded per well in 6-well plates, with samples in
duplicate. Cells were pre-incubated in drug-free media for 48 h at 310 K in a
S4
5% CO2 humidified atmosphere. After this, cells were treated at 150 nM and
450 nM of complex 2 for 4, 24, 48 and 72 h. Control samples were treated
with medium containing 0.1% DMSO. Following exposure, drug-containing
medium was removed, and cells were washed twice with PBS and lysed with
CLB1 buffer (Zeptosens-Bayer) according to manufacturer’s instructions. Cell
lysates were normalised to a uniform protein concentration of 2 mg/mL with
CLB1 buffer (Zeptosens-Bayer) prior to preparing a final 4-fold concentration
series of; 0.2; 0.15; 0.1 and 0.75 mg/mL in spotting buffer CSBL1 (Zeptosens-
Bayer). The diluted concentration series of each sample was printed onto
hydrophobic Zeptosens protein microarray chips (ZeptoChipTM, Zeptosens-
Bayer) under environmentally controlled conditions (constant 50% humidity at
287 K) using a non-contact printer (Nanoplotter 2.1e, GeSiM). A single 400 pL
droplet of each lysate concentration was deposited onto the Zeptosens chip.
A reference grid of Alexa Fluor 647 conjugated BSA was spotted onto each
sub-array, each sample concentration series was spotted in between
reference columns. After array printing, the arrays were blocked with an
aerosol of BSA solution using a custom designed nebuliser device
(ZeptoFOGTM, Zeptosen-Bayer) for 1.5 h to prevent non-specific antibody
binding. The protein array chips were subsequently washed in double
deionised water (DDW) and dried prior to performing a dual antibody
immunoassay comprising of a 24 h incubation of primary antibodies followed
by 2.5 h incubation with secondary Alexa Fluor 647 conjugated antibody
detection reagent (anti-rabbit or anti-mouse 647 Fab, Invitrogen). Following
secondary antibody incubation and a final wash step in BSA solution, the
immunostained arrays were imaged using the ZeptoREADER instrument
(Zeptosens-Bayer). For each-sub-array, five separate images were acquired
using different exposure times ranging from 0.5-10 s. Microarray images
representing the longest exposure without saturation of fluorescent signal
detection were automatically selected for analysis using the ZeptoViewTM 3.1
software. A weighted linear fit through the 4-fold concentration series was
used to calculate the relative fluorescence intensity (RFI) value for each
sample replicate. Local normalisation of sample signal to the reference BSA
grid was used to compensate for any intra- or inter-array/chip variation. RFI
values were further normalised to a house keeping protein and to the negative

S5
control, to provide the final RFI to represent the relative abundance of total,
phosphorylated and cleaved proteins in compound-treated samples relative to
the DMSO control for each time point.
S6
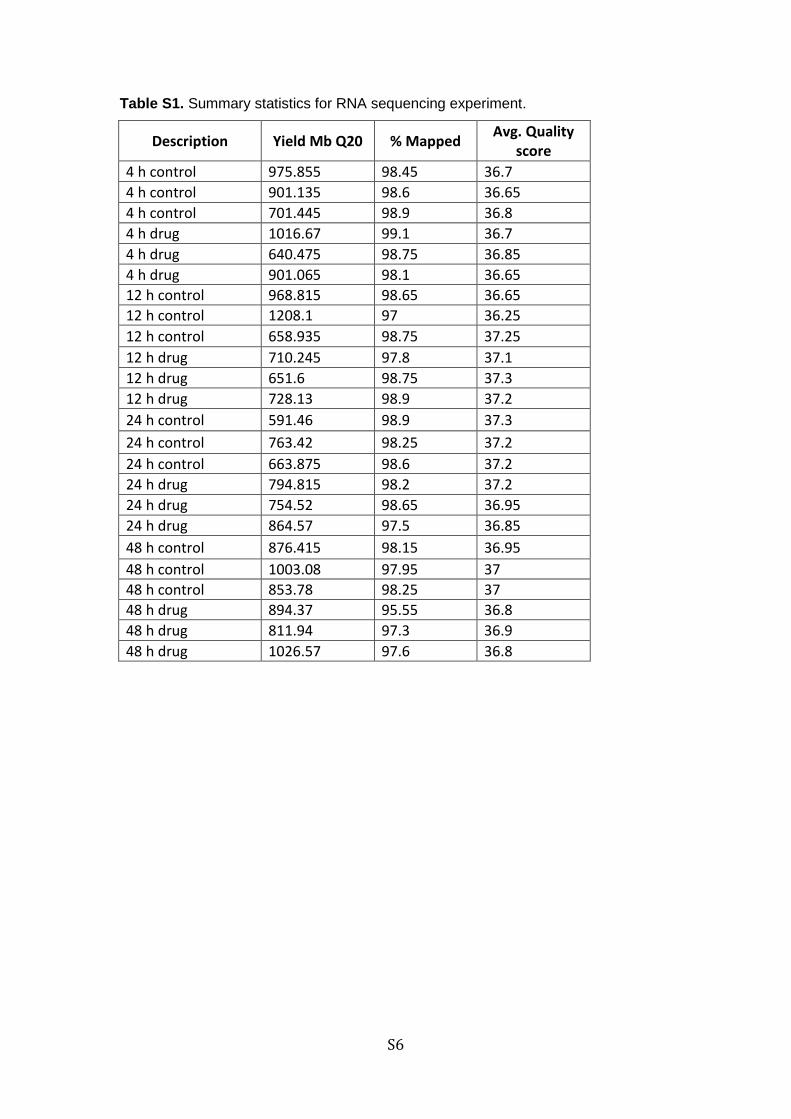
Table S1. Summary statistics for RNA sequencing experiment.
Description Yield Mb Q20 % Mapped Avg. Quality
score
4 h control 975.855 98.45 36.7
4 h control 901.135 98.6 36.65
4 h control 701.445 98.9 36.8
4 h drug 1016.67 99.1 36.7
4 h drug 640.475 98.75 36.85
4 h drug 901.065 98.1 36.65
12 h control 968.815 98.65 36.65
12 h control 1208.1 97 36.25
12 h control 658.935 98.75 37.25
12 h drug 710.245 97.8 37.1
12 h drug 651.6 98.75 37.3
12 h drug 728.13 98.9 37.2
24 h control 591.46 98.9 37.3
24 h control 763.42 98.25 37.2
24 h control 663.875 98.6 37.2
24 h drug 794.815 98.2 37.2
24 h drug 754.52 98.65 36.95
24 h drug 864.57 97.5 36.85
48 h control 876.415 98.15 36.95
48 h control 1003.08 97.95 37
48 h control 853.78 98.25 37
48 h drug 894.37 95.55 36.8
48 h drug 811.94 97.3 36.9
48 h drug 1026.57 97.6 36.8

S7
Table S2. Pathway analysis showing the top five most-mapped processes for DEGs
with -1.0 < LogFC > 1.0 and FDR < 0.05 after exposure to 2. IPA has identified
pathways of interest, with associated significance p- and z-values.
S8
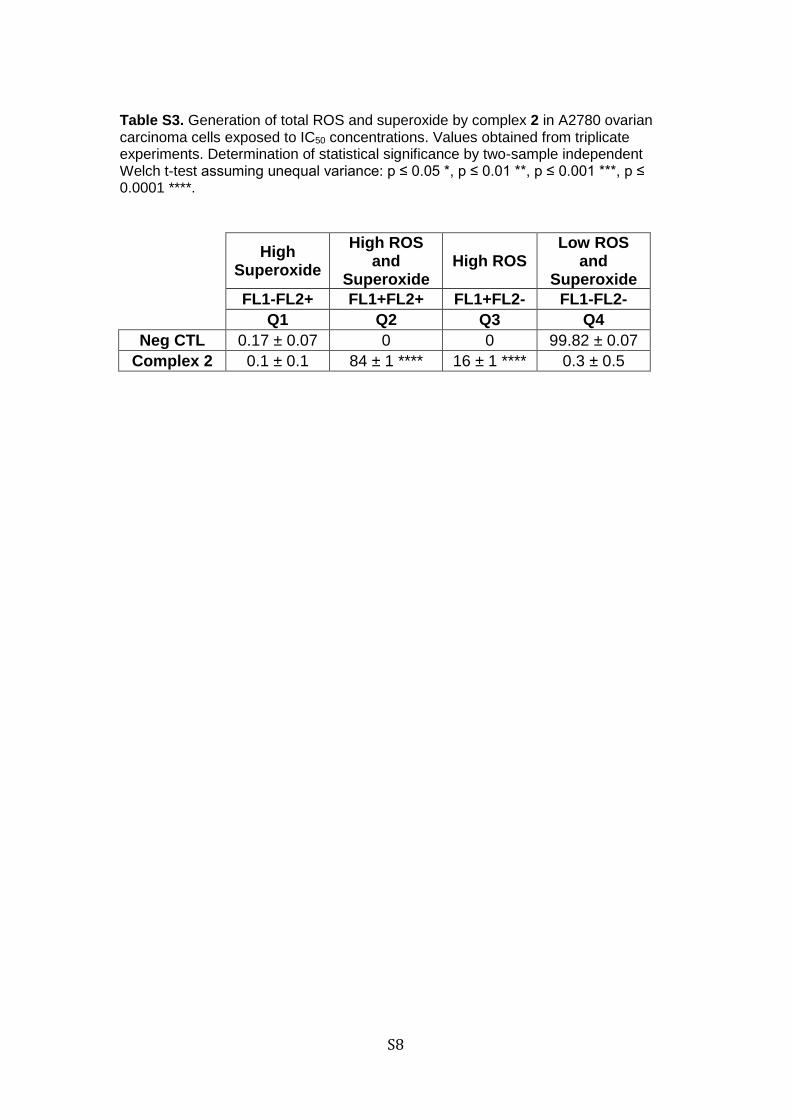
Table S3. Generation of total ROS and superoxide by complex 2 in A2780 ovarian carcinoma cells exposed to IC50 concentrations. Values obtained from triplicate experiments. Determination of statistical significance by two-sample independent Welch t-test assuming unequal variance: p ≤ 0.05 *, p ≤ 0.01 **, p ≤ 0.001 ***, p ≤ 0.0001 ****.
High Superoxide
High ROS and
Superoxide High ROS
Low ROS and
Superoxide
FL1-FL2+ FL1+FL2+ FL1+FL2- FL1-FL2-
Q1 Q2 Q3 Q4
Neg CTL 0.17 ± 0.07 0 0 99.82 ± 0.07
Complex 2 0.1 ± 0.1 84 ± 1 **** 16 ± 1 **** 0.3 ± 0.5
S9
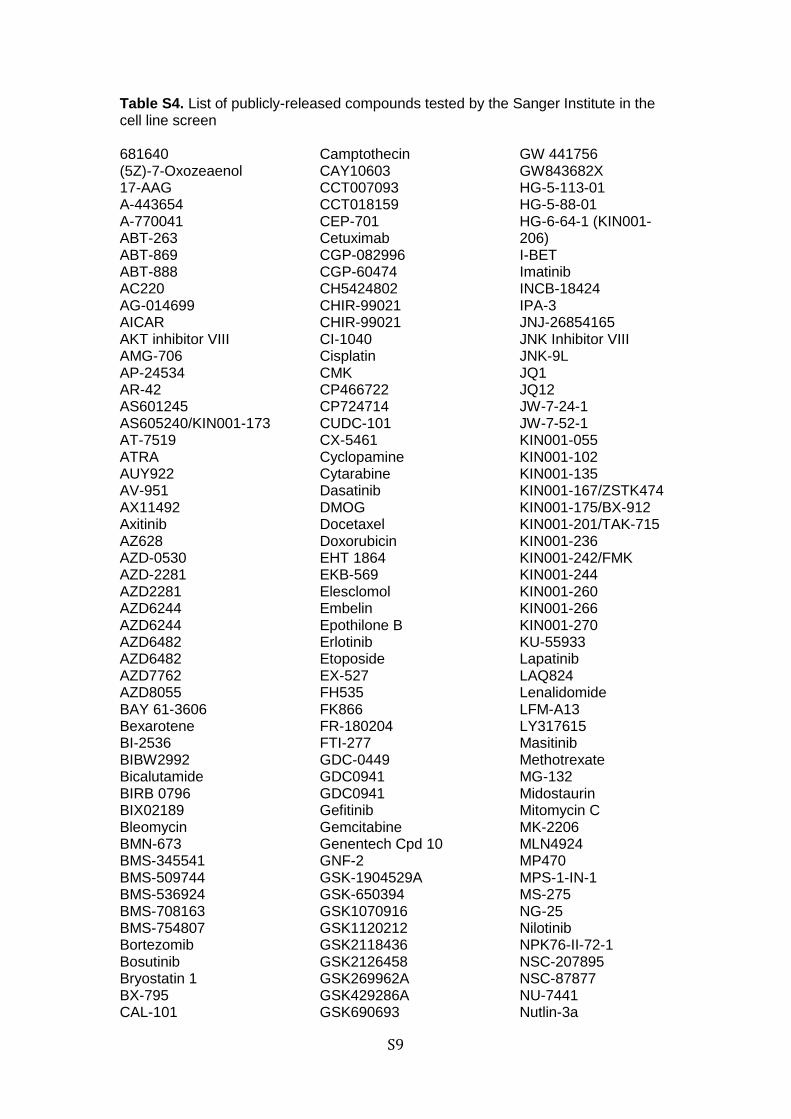
Table S4. List of publicly-released compounds tested by the Sanger Institute in the cell line screen 681640 (5Z)-7-Oxozeaenol 17-AAG A-443654 A-770041 ABT-263 ABT-869 ABT-888 AC220 AG-014699 AICAR AKT inhibitor VIII AMG-706 AP-24534 AR-42 AS601245 AS605240/KIN001-173 AT-7519 ATRA AUY922 AV-951 AX11492 Axitinib AZ628 AZD-0530 AZD-2281 AZD2281 AZD6244 AZD6244 AZD6482 AZD6482 AZD7762 AZD8055 BAY 61-3606 Bexarotene BI-2536 BIBW2992 Bicalutamide BIRB 0796 BIX02189 Bleomycin BMN-673 BMS-345541 BMS-509744 BMS-536924 BMS-708163 BMS-754807 Bortezomib Bosutinib Bryostatin 1 BX-795 CAL-101
Camptothecin CAY10603 CCT007093 CCT018159 CEP-701 Cetuximab CGP-082996 CGP-60474 CH5424802 CHIR-99021 CHIR-99021 CI-1040 Cisplatin CMK CP466722 CP724714 CUDC-101 CX-5461 Cyclopamine Cytarabine Dasatinib DMOG Docetaxel Doxorubicin EHT 1864 EKB-569 Elesclomol Embelin Epothilone B Erlotinib Etoposide EX-527 FH535 FK866 FR-180204 FTI-277 GDC-0449 GDC0941 GDC0941 Gefitinib Gemcitabine Genentech Cpd 10 GNF-2 GSK-1904529A GSK-650394 GSK1070916 GSK1120212 GSK2118436 GSK2126458 GSK269962A GSK429286A GSK690693
GW 441756 GW843682X HG-5-113-01 HG-5-88-01 HG-6-64-1 (KIN001-206) I-BET Imatinib INCB-18424 IPA-3 JNJ-26854165 JNK Inhibitor VIII JNK-9L JQ1 JQ12 JW-7-24-1 JW-7-52-1 KIN001-055 KIN001-102 KIN001-135 KIN001-167/ZSTK474 KIN001-175/BX-912 KIN001-201/TAK-715 KIN001-236 KIN001-242/FMK KIN001-244 KIN001-260 KIN001-266 KIN001-270 KU-55933 Lapatinib LAQ824 Lenalidomide LFM-A13 LY317615 Masitinib Methotrexate MG-132 Midostaurin Mitomycin C MK-2206 MLN4924 MP470 MPS-1-IN-1 MS-275 NG-25 Nilotinib NPK76-II-72-1 NSC-207895 NSC-87877 NU-7441 Nutlin-3a
S10
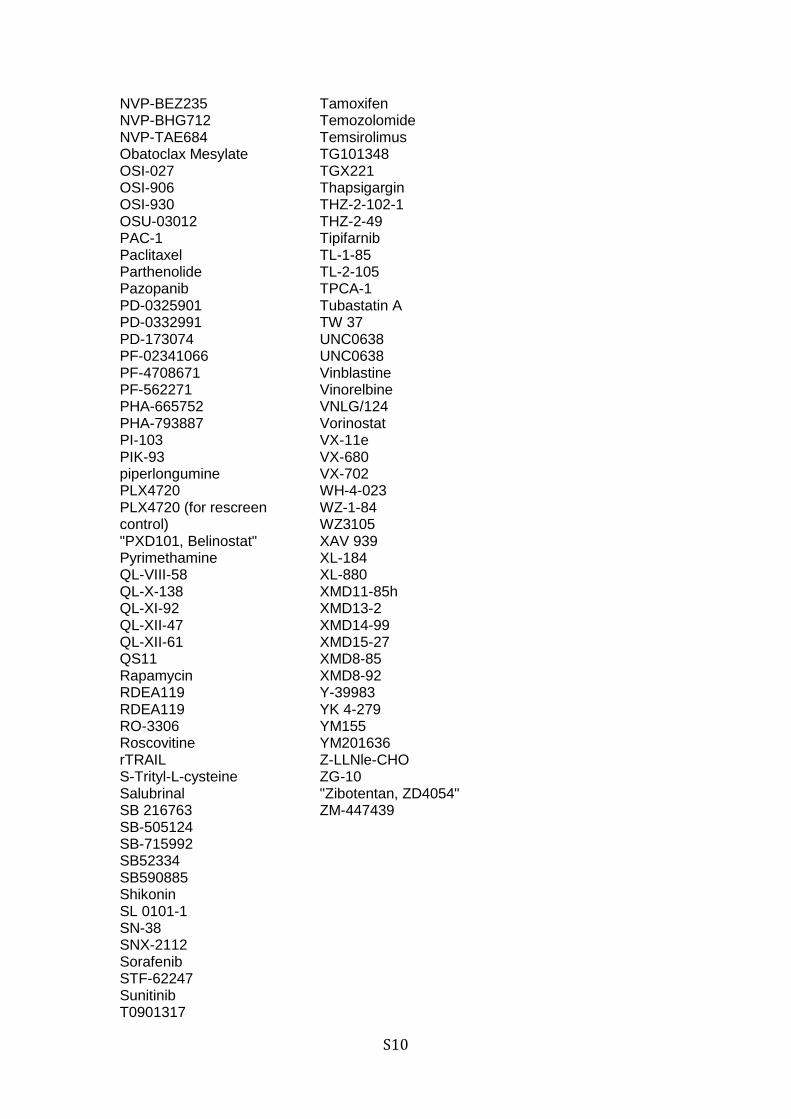
NVP-BEZ235 NVP-BHG712 NVP-TAE684 Obatoclax Mesylate OSI-027 OSI-906 OSI-930 OSU-03012 PAC-1 Paclitaxel Parthenolide Pazopanib PD-0325901 PD-0332991 PD-173074 PF-02341066 PF-4708671 PF-562271 PHA-665752 PHA-793887 PI-103 PIK-93 piperlongumine PLX4720 PLX4720 (for rescreen control) "PXD101, Belinostat" Pyrimethamine QL-VIII-58 QL-X-138 QL-XI-92 QL-XII-47 QL-XII-61 QS11 Rapamycin RDEA119 RDEA119 RO-3306 Roscovitine rTRAIL S-Trityl-L-cysteine Salubrinal SB 216763 SB-505124 SB-715992 SB52334 SB590885 Shikonin SL 0101-1 SN-38 SNX-2112 Sorafenib STF-62247 Sunitinib T0901317
Tamoxifen Temozolomide Temsirolimus TG101348 TGX221 Thapsigargin THZ-2-102-1 THZ-2-49 Tipifarnib TL-1-85 TL-2-105 TPCA-1 Tubastatin A TW 37 UNC0638 UNC0638 Vinblastine Vinorelbine VNLG/124 Vorinostat VX-11e VX-680 VX-702 WH-4-023 WZ-1-84 WZ3105 XAV 939 XL-184 XL-880 XMD11-85h XMD13-2 XMD14-99 XMD15-27 XMD8-85 XMD8-92 Y-39983 YK 4-279 YM155 YM201636 Z-LLNle-CHO ZG-10 "Zibotentan, ZD4054" ZM-447439
S11
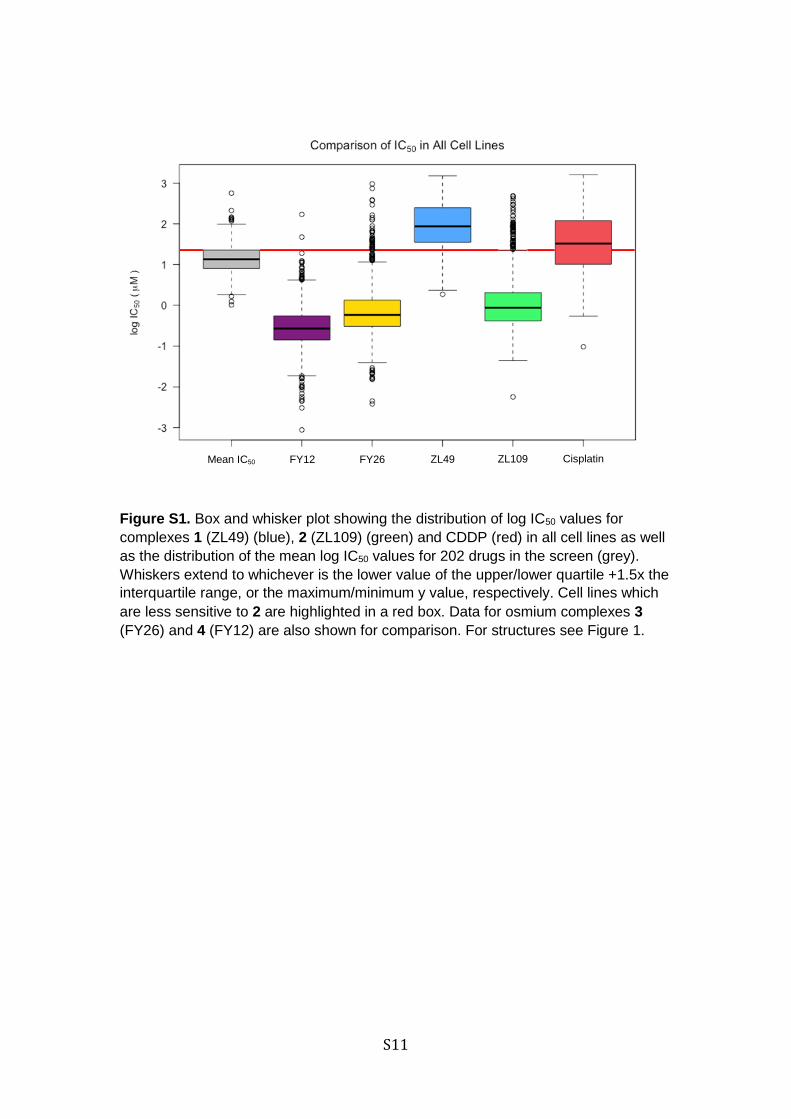
Figure S1. Box and whisker plot showing the distribution of log IC50 values for
complexes 1 (ZL49) (blue), 2 (ZL109) (green) and CDDP (red) in all cell lines as well
as the distribution of the mean log IC50 values for 202 drugs in the screen (grey).
Whiskers extend to whichever is the lower value of the upper/lower quartile +1.5x the
interquartile range, or the maximum/minimum y value, respectively. Cell lines which
are less sensitive to 2 are highlighted in a red box. Data for osmium complexes 3
(FY26) and 4 (FY12) are also shown for comparison. For structures see Figure 1.
FY26 FY12 Mean IC50 ZL49 ZL109 Cisplatin

S12
Figure S2. Bar plot of the number of cell lines of each tissue type screened against
organo-iridium complex 2. Cell lines significantly insensitive to 2 highlighted in green
with the corresponding % of total cell lines of that type. Tissue groups where no
percentage is given contained no cell lines resistant to 2.
S13
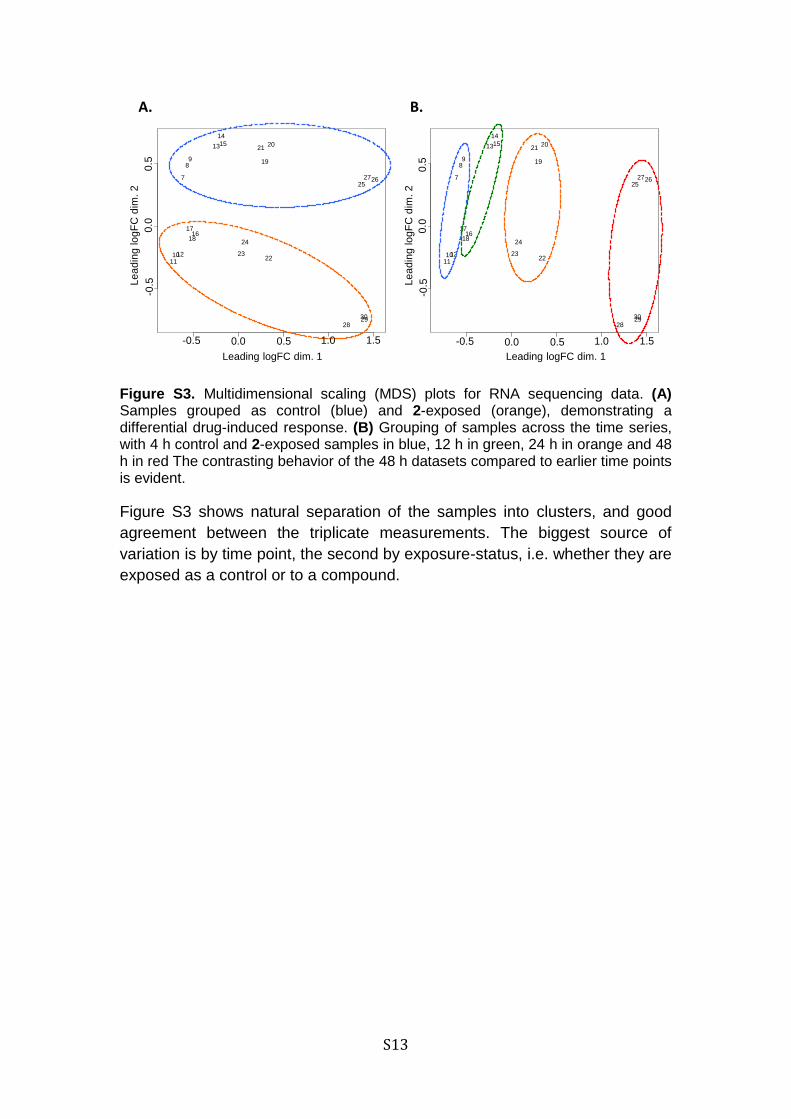
Figure S3. Multidimensional scaling (MDS) plots for RNA sequencing data. (A) Samples grouped as control (blue) and 2-exposed (orange), demonstrating a differential drug-induced response. (B) Grouping of samples across the time series, with 4 h control and 2-exposed samples in blue, 12 h in green, 24 h in orange and 48 h in red The contrasting behavior of the 48 h datasets compared to earlier time points is evident.
Figure S3 shows natural separation of the samples into clusters, and good
agreement between the triplicate measurements. The biggest source of
variation is by time point, the second by exposure-status, i.e. whether they are
exposed as a control or to a compound.
A. B.
-0.5 0.0 0.5 1.0 1.5
-0.5
0.0
0.5
Leading logFC dim 1
Lea
din
g log
FC
dim
2
1
2
3
4 56
7
89
1011
12
13
14
15
1617
18
19
2021
2223
24
252627
282930
-0.5 0.0 0.5 1.0 1.5
-0.5
0.0
0.5
Leading logFC dim 1
Lea
din
g log
FC
dim
2
1
2
3
4 56
7
89
1011
12
13
14
15
1617
18
19
2021
2223
24
252627
282930
Le
ad
ing
lo
gF
C d
im.
2
Leading logFC dim. 1 Leading logFC dim. 1
0.0
0
.5
-0.5
0.0
0
.5
-0.5
-0.5 0.0 0.5 1.0 1.5 -0.5 0.0 0.5 1.0 1.5
Le
ad
ing
lo
gF
C d
im.
2
S14
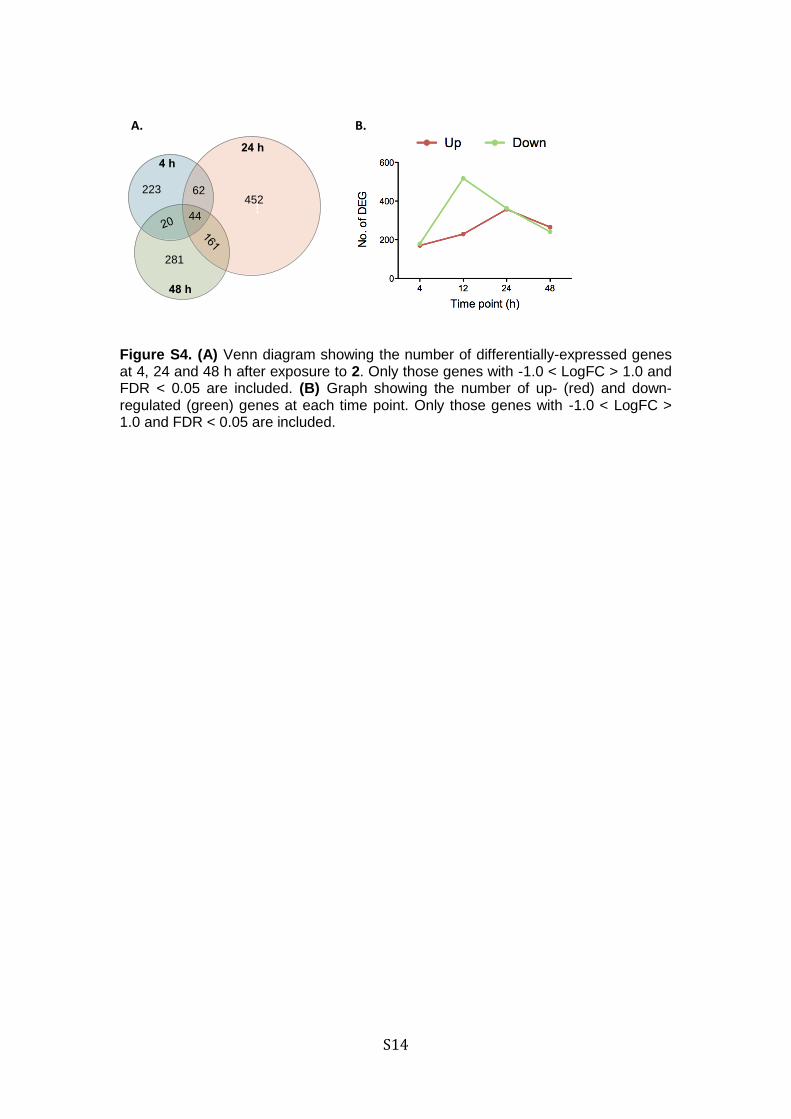
Figure S4. (A) Venn diagram showing the number of differentially-expressed genes at 4, 24 and 48 h after exposure to 2. Only those genes with -1.0 < LogFC > 1.0 and FDR < 0.05 are included. (B) Graph showing the number of up- (red) and down-regulated (green) genes at each time point. Only those genes with -1.0 < LogFC > 1.0 and FDR < 0.05 are included.
`!
4 h
24 h
48 h
223 452
281
44
`!
4 h 24 h
48 h
147 107
463
41 62
19
Os-3 Ir-10
A. B.
S15
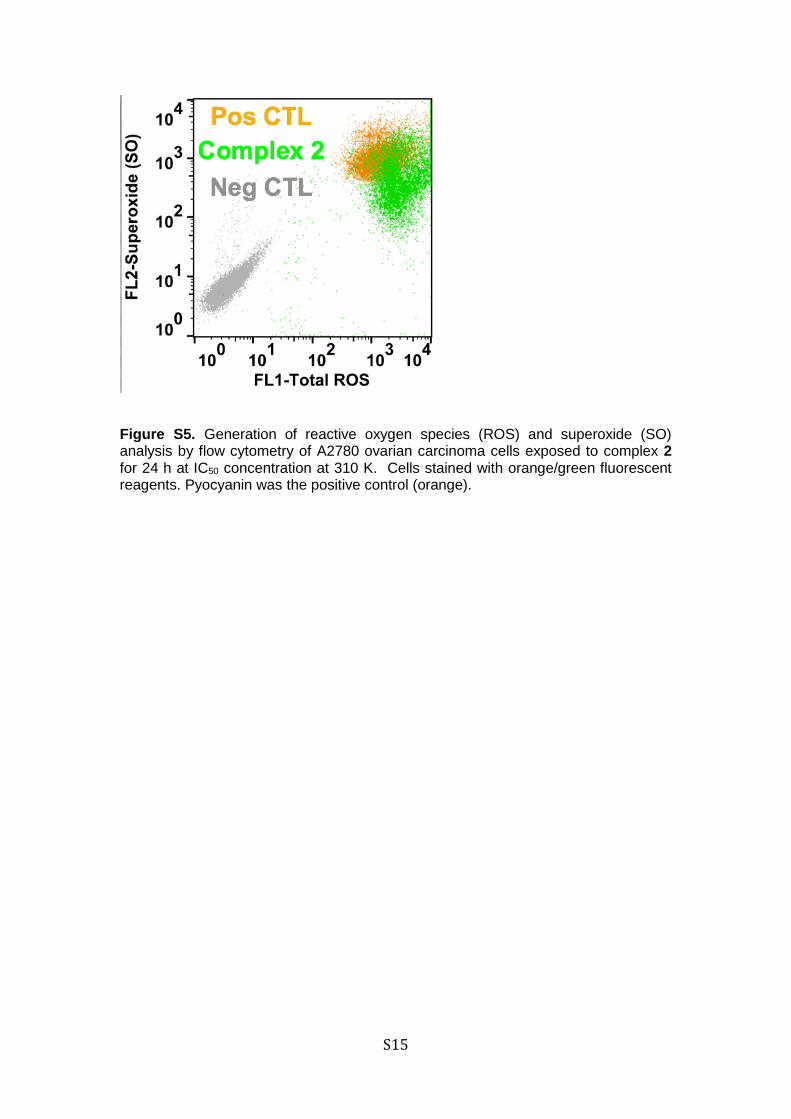
Figure S5. Generation of reactive oxygen species (ROS) and superoxide (SO) analysis by flow cytometry of A2780 ovarian carcinoma cells exposed to complex 2 for 24 h at IC50 concentration at 310 K. Cells stained with orange/green fluorescent reagents. Pyocyanin was the positive control (orange).
S16
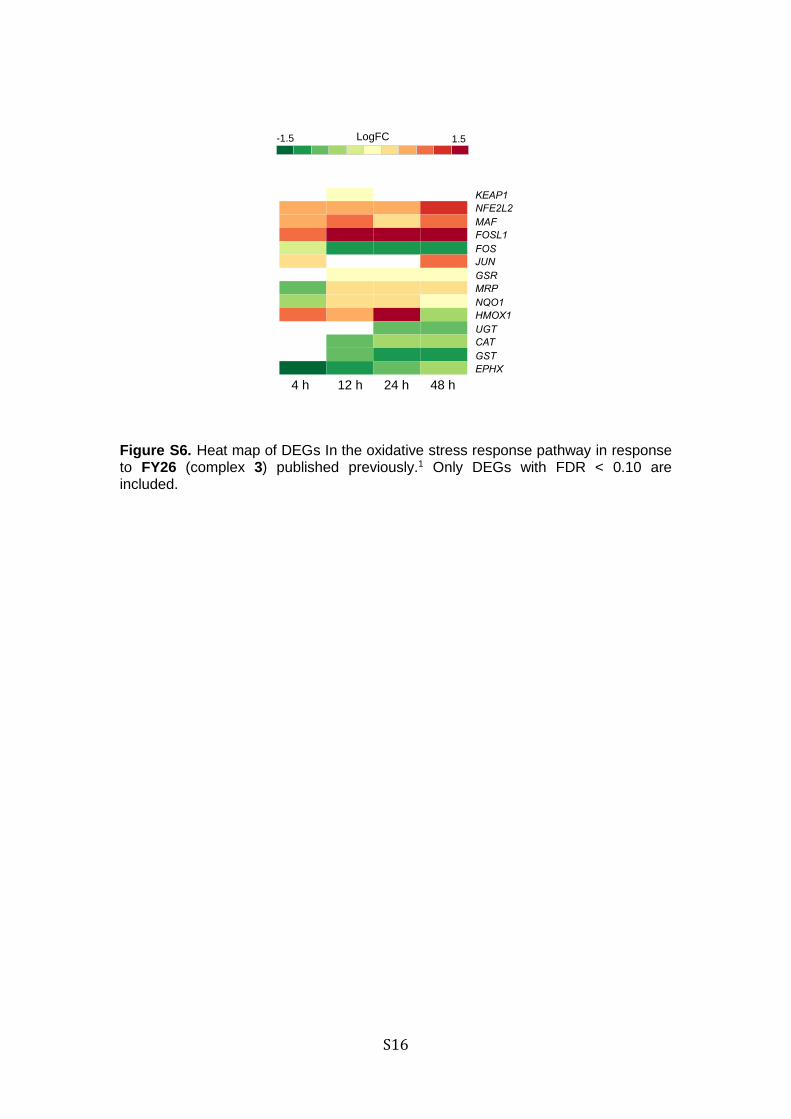
Figure S6. Heat map of DEGs In the oxidative stress response pathway in response to FY26 (complex 3) published previously.1 Only DEGs with FDR < 0.10 are included.
NRF2
Keap1
NRF2
NRF2
Maf C-FOS FRA-1
Jun Jun
hARE
GSR MRP
NQO
TXN
HO-1 UGT
CAT
GST
EPHX
Cytosol Nucleus
ROS
X4
X12
X24
X48
Keap1
NRF2
Maf
FRA-1
c-Fos
Jun
GSR
MRP
NQO
HO-1
UGT
CAT
GST
EPHX
GSR
MRP
NQO
HO-1
UGT
CAT
GST
EPHX
Keap1
NRF2
Maf
FRA-1
c-FOS
Jun
GSR MRP NQO HO-1 UGT CAT GST EPHX
ROS
BrBGPiYG
PRGnPuOrRdBuRdGy
RdYlBuRdYlGnSpectral
AccentDark2Paired
Pastel1Pastel2
Set1Set2Set3
BluesBuGnBuPuGnBu
GreensGreys
OrangesOrRdPuBu
PuBuGnPuRd
PurplesRdPuRedsYlGn
YlGnBuYlOrBr
YlOrRd
LogFC -1.5 1.5
A. B.
4 h 12 h 24 h 48 h
C. Negative control Positive control Compound 1
104
102
100
104
102
100 100 102 104 100` 102 104
FL1 (Total ROS)
FL
2 (
Sup
ero
xid
e)
104
102
100 100 102 104
KEAP1
MAF
C-JUN C-JUN
GSR
MRP
NQO
HMOX1
UGT
CAT
GST
EPHX
KEAP1
NFE2L2
MAF
FOSL1
FOS
JUN
GSR
MRP
NQO1
HMOX1
UGT
CAT
GST
EPHX
S17
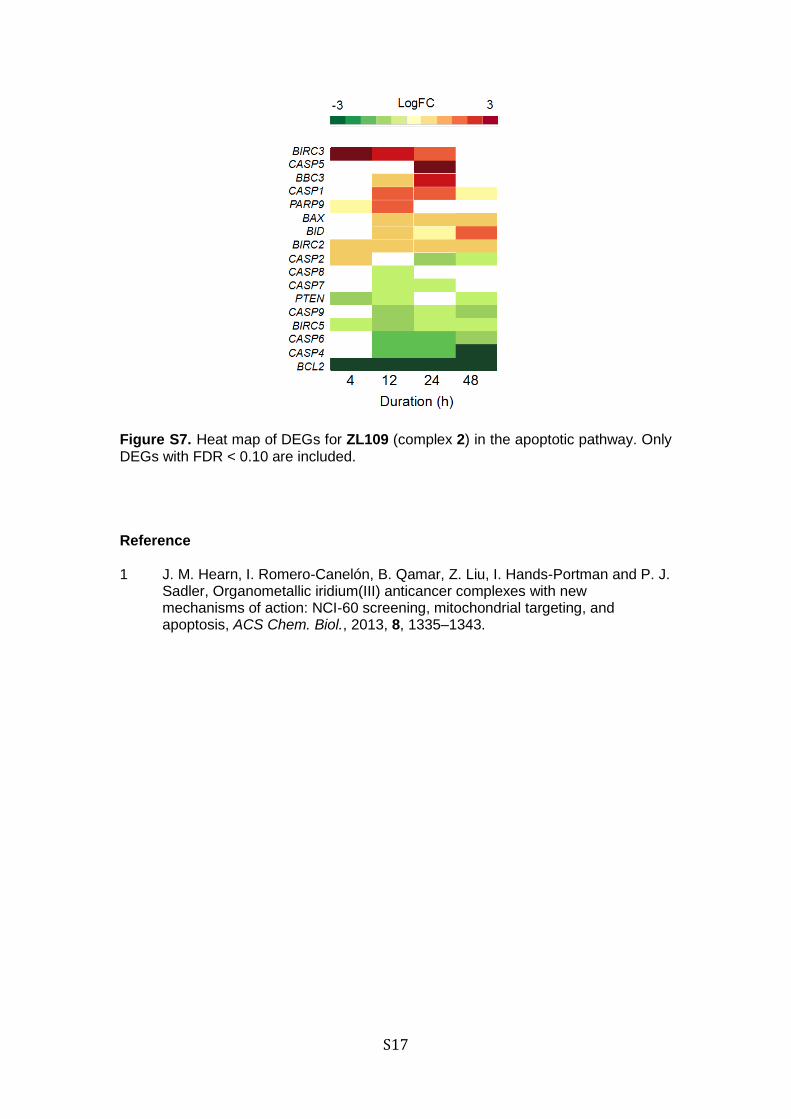
Figure S7. Heat map of DEGs for ZL109 (complex 2) in the apoptotic pathway. Only DEGs with FDR < 0.10 are included. Reference 1 J. M. Hearn, I. Romero-Canelón, B. Qamar, Z. Liu, I. Hands-Portman and P. J.
Sadler, Organometallic iridium(III) anticancer complexes with new mechanisms of action: NCI-60 screening, mitochondrial targeting, and apoptosis, ACS Chem. Biol., 2013, 8, 1335–1343.