09_Erlang.PDF
366
CDMA SC Products System Resource Guide (CSSRG) CDMA SC Products System Resource Guide (CSSRG) English June 2001 68P09298A50–A
-
Upload
piyush-sharma -
Category
Documents
-
view
62 -
download
0
description
erlang
Transcript of 09_Erlang.PDF

CDMA SC Products System Resource Guide(CSSRG)
CDMA SC Products System Resource Guide (CSSRG)
EnglishJune 200168P09298A50–A

NoticeWhile reasonable efforts have been made to assure the accuracy of this document, Motorola, Inc. assumes no liability resulting from anyinaccuracies or omissions in this document, or from use of the information obtained herein. The information in this document has beencarefully checked and is believed to be entirely reliable. However, no responsibility is assumed for inaccuracies or omissions. Motorola,Inc. reserves the right to make changes to any products described herein and reserves the right to revise this document and to makechanges from time to time in content hereof with no obligation to notify any person of revisions or changes. Motorola, Inc. does notassume any liability arising out of the application or use of any product, software, or circuit described herein; neither does it conveylicense under its patent rights or the rights of others.It is possible that this publication may contain references to, or information about Motorola products (machines and programs),programming, or services that are not announced in your country. Such references or information must not be construed to meanthat Motorola intends to announce such Motorola products, programming, or services in your country.
Copyrights
This instruction manual, and the Motorola products described in this instruction manual may be, include or describe copyrightedMotorola material, such as computer programs stored in semiconductor memories or other media. Laws in the United States andother countries preserve for Motorola certain exclusive rights for copyrighted material, including the exclusive right to copy,reproduce in any form, distribute and make derivative works of the copyrighted material. Accordingly, any copyrighted Motorolamaterial contained herein or in the Motorola products described in this instruction manual may not be copied, reproduced,distributed, merged or modified in any manner without the express written permission of Motorola. Furthermore, the purchase ofMotorola products shall not be deemed to grant either directly or by implication, estoppel, or otherwise, any license under thecopyrights, patents or patent applications of Motorola, as arises by operation of law in the sale of a product.
Usage and Disclosure Restrictions
License AgreementThe software described in this document is the property of Motorola, Inc. It is furnished by express license agreement only and maybe used only in accordance with the terms of such an agreement.
Copyrighted MaterialsSoftware and documentation are copyrighted materials. Making unauthorized copies is prohibited by law. No part of the software ordocumentation may be reproduced, transmitted, transcribed, stored in a retrieval system, or translated into any language orcomputer language, in any form or by any means, without prior written permission of Motorola, Inc.
High Risk ActivitiesComponents, units, or third–party products used in the product described herein are NOT fault–tolerant and are NOT designed,manufactured, or intended for use as on–line control equipment in the following hazardous environments requiring fail–safecontrols: the operation of Nuclear Facilities, Aircraft Navigation or Aircraft Communication Systems, Air Traffic Control, LifeSupport, or Weapons Systems (“High Risk Activities”). Motorola and its supplier(s) specifically disclaim any expressed or impliedwarranty of fitness for such High Risk Activities.
Trademarks
and Motorola are registered trademarks of Motorola, Inc.
Product and service names profiled herein are trademarks of Motorola, Inc. Other manufacturers’ products or services profiledherein may be referred to by trademarks of their respective companies.
Copyright
Copyright 2001 Motorola, Inc. All Rights Reserved
Printed on Recyclable Paper
REV011701
SPECIFICATIONS SUBJECT TO CHANGE WITHOUT NOTICE

June 2001 iCDMA SC Products System Resource Guide (CSSRG)
Table of Contents
CDMA SC Products System Resource Guide (CSSRG)
CDMA SC Products System Resource Guide (CSSRG)
List of Figures iv. . . . . . . . . . . . . . . . . . . . . . . . . . . . . . . . . . . . . . . . . . . . . . . . . . .
List of Tables vi. . . . . . . . . . . . . . . . . . . . . . . . . . . . . . . . . . . . . . . . . . . . . . . . . . .
Product Information viii. . . . . . . . . . . . . . . . . . . . . . . . . . . . . . . . . . . . . . . . . . . . . .
Foreword ix. . . . . . . . . . . . . . . . . . . . . . . . . . . . . . . . . . . . . . . . . . . . . . . . . . . . . . .
General Safety xii. . . . . . . . . . . . . . . . . . . . . . . . . . . . . . . . . . . . . . . . . . . . . . . . . . .
Revision History xiv. . . . . . . . . . . . . . . . . . . . . . . . . . . . . . . . . . . . . . . . . . . . . . . . .
Patent Notification xv. . . . . . . . . . . . . . . . . . . . . . . . . . . . . . . . . . . . . . . . . . . . . . .
Chapter 1: CDMA SC Products Expansion
CDMA SC Products Expansion Introduction 1-1. . . . . . . . . . . . . . . . . . . . . . . . . . .
Expansion Planning Introduction 1-6. . . . . . . . . . . . . . . . . . . . . . . . . . . . . . . . . . . .
General Capacity Engineering Strategy 1-7. . . . . . . . . . . . . . . . . . . . . . . . . . . . . . .
Chapter 2: Centralized Base Station Controller
Centralized Base Station Controller (CBSC) 2-1. . . . . . . . . . . . . . . . . . . . . . . . . . .
Mobility Manager (MM) 2-2. . . . . . . . . . . . . . . . . . . . . . . . . . . . . . . . . . . . . . . . . .
Transcoder Subsystem (XC) 2-18. . . . . . . . . . . . . . . . . . . . . . . . . . . . . . . . . . . . . . . .
CBSC Capacity Planning 2-22. . . . . . . . . . . . . . . . . . . . . . . . . . . . . . . . . . . . . . . . . .
CBSC Capacity Management Options 2-30. . . . . . . . . . . . . . . . . . . . . . . . . . . . . . . .
CBSC Capacity Monitoring 2-58. . . . . . . . . . . . . . . . . . . . . . . . . . . . . . . . . . . . . . . .
Chapter 3: Base Transceiver Station (BTS)
Base Transceiver Station (BTS) 3-1. . . . . . . . . . . . . . . . . . . . . . . . . . . . . . . . . . . . .
BTS Expansion 3-9. . . . . . . . . . . . . . . . . . . . . . . . . . . . . . . . . . . . . . . . . . . . . . . . . .
BTS Products – other than Japan 3-26. . . . . . . . . . . . . . . . . . . . . . . . . . . . . . . . . . . .
BTS Products – for Japan 3-56. . . . . . . . . . . . . . . . . . . . . . . . . . . . . . . . . . . . . . . . . .
Pilot Beacon 3-67. . . . . . . . . . . . . . . . . . . . . . . . . . . . . . . . . . . . . . . . . . . . . . . . . . . .
Chapter 4: Intelligent Network (IN)
Intelligent Network (IN) 4-1. . . . . . . . . . . . . . . . . . . . . . . . . . . . . . . . . . . . . . . . . . .
DMX–HLR 4-2. . . . . . . . . . . . . . . . . . . . . . . . . . . . . . . . . . . . . . . . . . . . . . . . . . . . .
Table of Contents – continued
CDMA SC Products System Resource Guide (CSSRG) June 2001ii
Message Register (MR) 4-5. . . . . . . . . . . . . . . . . . . . . . . . . . . . . . . . . . . . . . . . . . .
Chapter 5: Operations and Maintenance
Operations and Maintenance 5-1. . . . . . . . . . . . . . . . . . . . . . . . . . . . . . . . . . . . . . . .
Operations and Maintenance Center – Radio (OMC–R) 5-2. . . . . . . . . . . . . . . . . .
SwitchMATE 5-15. . . . . . . . . . . . . . . . . . . . . . . . . . . . . . . . . . . . . . . . . . . . . . . . . . .
Universal Network Operations (UNO) 5-17. . . . . . . . . . . . . . . . . . . . . . . . . . . . . . . .
Chapter 6: Data Services
Data Services 6-1. . . . . . . . . . . . . . . . . . . . . . . . . . . . . . . . . . . . . . . . . . . . . . . . . . .
Circuit Data/Inter–working Unit (IWU) 6-2. . . . . . . . . . . . . . . . . . . . . . . . . . . . . . .
Chapter 7: CDMA RF Carrier and Control Channel
CDMA RF Carrier 7-1. . . . . . . . . . . . . . . . . . . . . . . . . . . . . . . . . . . . . . . . . . . . . . .
RF Carrier Planning 7-2. . . . . . . . . . . . . . . . . . . . . . . . . . . . . . . . . . . . . . . . . . . . . .
RF Carrier Limiting Factors 7-3. . . . . . . . . . . . . . . . . . . . . . . . . . . . . . . . . . . . . . . .
RF Carrier Determining Utilization 7-9. . . . . . . . . . . . . . . . . . . . . . . . . . . . . . . . . .
RF Carrier Planning Limits 7-12. . . . . . . . . . . . . . . . . . . . . . . . . . . . . . . . . . . . . . . .
RF Carrier Symptoms of Resource Overload 7-20. . . . . . . . . . . . . . . . . . . . . . . . . . .
RF Carrier Reducing Utilization/Capacity Improvement 7-21. . . . . . . . . . . . . . . . . .
Control Channel 7-32. . . . . . . . . . . . . . . . . . . . . . . . . . . . . . . . . . . . . . . . . . . . . . . . .
Control Channel Limiting Factors 7-33. . . . . . . . . . . . . . . . . . . . . . . . . . . . . . . . . . .
Control Channel Determining Utilization 7-44. . . . . . . . . . . . . . . . . . . . . . . . . . . . .
Control Channel Planning Limits 7-78. . . . . . . . . . . . . . . . . . . . . . . . . . . . . . . . . . . .
Control Channel Symptoms of Resource Overload 7-85. . . . . . . . . . . . . . . . . . . . . .
Control Channel Reducing Utilization/Capacity Improvement 7-86. . . . . . . . . . . . .
Appendix A – CDMA Call Flow
CDMA Call Flow A-1. . . . . . . . . . . . . . . . . . . . . . . . . . . . . . . . . . . . . . . . . . . . . . . .
Appendix B – Erlang B Tables
Erlang B Tables B-1. . . . . . . . . . . . . . . . . . . . . . . . . . . . . . . . . . . . . . . . . . . . . . . . . .
Appendix C – Erlang C Tables
Erlang C Tables C-1. . . . . . . . . . . . . . . . . . . . . . . . . . . . . . . . . . . . . . . . . . . . . . . . . .

June 2001 iiiCDMA SC Products System Resource Guide (CSSRG)
List of Figures
CDMA SC Products System Resource Guide (CSSRG)
CDMA SC Products System Resource Guide (CSSRG)
Figure 1-1: Functional Block Diagram of a CDMA Network 1-8. . . . . . . . . . . . . .
Figure 1-2: Flow Diagram for Generic Capacity Engineering Process 1-10. . . . . . .
Figure 2-1: Admission Rate Control Non–Overload Condition 2-6. . . . . . . . . . . . .
Figure 2-2: Admission Rate Control Overload Condition 2-7. . . . . . . . . . . . . . . . .
Figure 2-3: Capacity Control Example 2-11. . . . . . . . . . . . . . . . . . . . . . . . . . . . . . . .
Figure 2-4: CBSC Splitting Example 2-34. . . . . . . . . . . . . . . . . . . . . . . . . . . . . . . . .
Figure 2-5: New OMC–R and CBSC 2-34. . . . . . . . . . . . . . . . . . . . . . . . . . . . . . . . .
Figure 2-6: New CBSC with an existing OMC–R 2-35. . . . . . . . . . . . . . . . . . . . . . .
Figure 2-7: Alternating OMC–R Strategy 2-35. . . . . . . . . . . . . . . . . . . . . . . . . . . . .
Figure 2-8: New CBSC with same OMC–R, new BTS IDs 2-36. . . . . . . . . . . . . . .
Figure 2-9: New CBSC with the same OMC–R, same BTS IDs 2-37. . . . . . . . . . . .
Figure 2-10: New CBSC with the same OMC–R, same BTS IDs – in two steps 2-37
Figure 2-11: New CBSC with an existing OMC–R, new MIB, same BTS IDs 2-38
Figure 2-12: Four Carriers, three–sector BTS Example 2-40. . . . . . . . . . . . . . . . . . .
Figure 2-13: Three–sector Multi–carrier BTS Example 2-41. . . . . . . . . . . . . . . . . . .
Figure 2-14: BTSs per CBSC vs. Avg. Erlangs per BTS 2-41. . . . . . . . . . . . . . . . . .
Figure 2-15: Puma MM Example 2-42. . . . . . . . . . . . . . . . . . . . . . . . . . . . . . . . . . . .
Figure 2-16: Layered CBSC Architecture Design 2-44. . . . . . . . . . . . . . . . . . . . . . .
Figure 2-17: Four–carrier, Two–layer Example 2-45. . . . . . . . . . . . . . . . . . . . . . . . .
Figure 2-18: Typical Eight–carrier Tx and Rx Configuration 2-46. . . . . . . . . . . . . .
Figure 2-19: System Redundancy in a Layered CBSC Architecture 2-49. . . . . . . . .
Figure 2-20: Inter–CBSC Handoff from Multiple Layers to a Single Layer 2-52. . .
Figure 2-21: Uneven CBSC overlay in the third Carrier Application 2-54. . . . . . . .
Figure 3-1: SC9600 3-28. . . . . . . . . . . . . . . . . . . . . . . . . . . . . . . . . . . . . . . . . . . . . .
Figure 3-2: Single RF Modem Frame Mounting Order 3-30. . . . . . . . . . . . . . . . . . .
Figure 3-3: Multiple RF Modem Frame Mounting Order 3-30. . . . . . . . . . . . . . . . .
Figure 3-4: SC4800 3-34. . . . . . . . . . . . . . . . . . . . . . . . . . . . . . . . . . . . . . . . . . . . . .
Figure 3-5: Combiner 2:1 3-36. . . . . . . . . . . . . . . . . . . . . . . . . . . . . . . . . . . . . . . . . .
Figure 3-6: Combiner 4:1 3-36. . . . . . . . . . . . . . . . . . . . . . . . . . . . . . . . . . . . . . . . . .

List of Figures – continued
CDMA SC Products System Resource Guide (CSSRG) June 2001iv
Figure 3-7: SC4812 3-38. . . . . . . . . . . . . . . . . . . . . . . . . . . . . . . . . . . . . . . . . . . . . .
Figure 3-8: Examples of SC4812 Combining Schemes 3-41. . . . . . . . . . . . . . . . . . .
Figure 3-9: SC2400 3-43. . . . . . . . . . . . . . . . . . . . . . . . . . . . . . . . . . . . . . . . . . . . . .
Figure 3-10: SC614 RF 3-48. . . . . . . . . . . . . . . . . . . . . . . . . . . . . . . . . . . . . . . . . . .
Figure 3-11: Multiple Carrier PicoCell RF Antenna Configuration 3-53. . . . . . . . . .
Figure 3-12: One and Two Carrier MicroCell RF Antenna Configurations 3-53. . . .
Figure 3-13: Three Carrier MicroCell RF Antenna Configuration 3-53. . . . . . . . . .
Figure 3-14: Four Carrier MicroCell RF Antenna Configuration 3-54. . . . . . . . . . .
Figure 3-15: SC4840 3-59. . . . . . . . . . . . . . . . . . . . . . . . . . . . . . . . . . . . . . . . . . . . .
Figure 3-16: SC2440 3-62. . . . . . . . . . . . . . . . . . . . . . . . . . . . . . . . . . . . . . . . . . . . .
Figure 3-17: Multiple Carrier PicoCell RF Antenna Configuration 3-65. . . . . . . . .
Figure 3-18: One and Two Carrier MicroCell RF Antenna Configurations 3-65. . . .
Figure 3-19: Three Carrier MicroCell RF Antenna Configuration 3-65. . . . . . . . . .
Figure 3-20: Four Carrier MicroCell RF Antenna Configuration 3-66. . . . . . . . . . .
Figure 7-1: Cell Split Example 7-27. . . . . . . . . . . . . . . . . . . . . . . . . . . . . . . . . . . . . .
Figure 7-2: Micro–Cell Example 7-28. . . . . . . . . . . . . . . . . . . . . . . . . . . . . . . . . . . .
Figure 7-3: Ubiquitous Carrier Example 7-29. . . . . . . . . . . . . . . . . . . . . . . . . . . . . .
Figure 7-4: Non–Ubiquitous Carrier Example #1 7-29. . . . . . . . . . . . . . . . . . . . . . .
Figure 7-5: Non–Ubiquitous Carrier Example #2 7-30. . . . . . . . . . . . . . . . . . . . . . .
Figure 7-6: Transition Zone 7-31. . . . . . . . . . . . . . . . . . . . . . . . . . . . . . . . . . . . . . . .
Figure 7-7: Example of Forward CDMA Channels 7-33. . . . . . . . . . . . . . . . . . . . . .
Figure 7-8: Example of Reverse CDMA Channels 7-34. . . . . . . . . . . . . . . . . . . . . .
Figure 7-9: Slotted Mode Structure Example 7-39. . . . . . . . . . . . . . . . . . . . . . . . . . .
Figure 7-10: Access Channel Slot 7-41. . . . . . . . . . . . . . . . . . . . . . . . . . . . . . . . . . .
Figure A-1: Validation and Terrestrial Circuit Assignment A-1. . . . . . . . . . . . . . . .
Figure A-2: Circuit Assignments A-2. . . . . . . . . . . . . . . . . . . . . . . . . . . . . . . . . . . .
Figure A-3: Traffic Channel Assignment A-3. . . . . . . . . . . . . . . . . . . . . . . . . . . . . .
Figure A-4: Ringback and Conversation A-4. . . . . . . . . . . . . . . . . . . . . . . . . . . . . .
Figure A-5: Paging and Control Messages though the Subsystems A-5. . . . . . . . . .
Figure A-6: Validation and Circuit Assignment A-6. . . . . . . . . . . . . . . . . . . . . . . . .
Figure A-7: Alerting and Connection A-8. . . . . . . . . . . . . . . . . . . . . . . . . . . . . . . . .
Figure A-8: Pilot Channel Assignment A-9. . . . . . . . . . . . . . . . . . . . . . . . . . . . . . . .
Figure A-9: Channel Assignment A-10. . . . . . . . . . . . . . . . . . . . . . . . . . . . . . . . . . . .
Figure A-10: Handoff Completion A-11. . . . . . . . . . . . . . . . . . . . . . . . . . . . . . . . . . .

June 2001 vCDMA SC Products System Resource Guide (CSSRG)
List of Tables
CDMA SC Products System Resource Guide (CSSRG)
CDMA SC Products System Resource Guide (CSSRG)
Table 1-1: Template for Typical Measurement Schedule 1-12. . . . . . . . . . . . . . . . . .
Table 2-1: Standard Transcoder Maximum and Planning Erlang Capacities 2-18. . .
Table 2-2: MM Capacity Limits Calculation Example 2-24. . . . . . . . . . . . . . . . . . .
Table 2-3: Example CBSC Erlang Forecast 2-26. . . . . . . . . . . . . . . . . . . . . . . . . . . .
Table 2-4: CBSC Load Balancing Example 2-30. . . . . . . . . . . . . . . . . . . . . . . . . . . .
Table 2-5: Summary of Advantages and Disadvantages of the layered CBSCapproach 2-51. . . . . . . . . . . . . . . . . . . . . . . . . . . . . . . . . . . . . . . . . . . . . .
Table 2-6: Handoff Transition Method Example 2-53. . . . . . . . . . . . . . . . . . . . . . . .
Table 2-7: Recommended Values for the Rate Overload Parameters 2-60. . . . . . . . .
Table 2-8: Summary of CBSC Monitoring 2-65. . . . . . . . . . . . . . . . . . . . . . . . . . . .
Table 3-1: Logical BTS Advantages 3-7. . . . . . . . . . . . . . . . . . . . . . . . . . . . . . . . . .
Table 3-2: Example Spreadsheet to Forecast Traffic Usage 3-17. . . . . . . . . . . . . . . .
Table 3-3: Example Spreadsheet to Forecast Required Channelization 3-18. . . . . . .
Table 3-4: CDMA Carrier Support 3-28. . . . . . . . . . . . . . . . . . . . . . . . . . . . . . . . . . .
Table 3-5: Physical Traffic Channels 3-29. . . . . . . . . . . . . . . . . . . . . . . . . . . . . . . . .
Table 3-6: Output Power/Sector vs. Number of Modules 3-32. . . . . . . . . . . . . . . . .
Table 3-7: SC9600 Operating Frequencies 3-33. . . . . . . . . . . . . . . . . . . . . . . . . . . . .
Table 3-8: CDMA Carrier Support 3-35. . . . . . . . . . . . . . . . . . . . . . . . . . . . . . . . . . .
Table 3-9: Physical Traffic Channels 3-35. . . . . . . . . . . . . . . . . . . . . . . . . . . . . . . . .
Table 3-10: SC4852/4850/4820 Operating Frequencies 3-37. . . . . . . . . . . . . . . . . . .
Table 3-11: CDMA Carrier Support 3-39. . . . . . . . . . . . . . . . . . . . . . . . . . . . . . . . . .
Table 3-12: Physical Traffic Channels 3-39. . . . . . . . . . . . . . . . . . . . . . . . . . . . . . . .
Table 3-13: SC4812 Operating Frequencies 3-42. . . . . . . . . . . . . . . . . . . . . . . . . . . .
Table 3-14: CDMA Carrier Support 3-44. . . . . . . . . . . . . . . . . . . . . . . . . . . . . . . . . .
Table 3-15: Physical Traffic Channels 3-44. . . . . . . . . . . . . . . . . . . . . . . . . . . . . . . .
Table 3-16: SC2450 Operating Frequencies 3-45. . . . . . . . . . . . . . . . . . . . . . . . . . . .
Table 3-17: CDMA Carrier Support 3-46. . . . . . . . . . . . . . . . . . . . . . . . . . . . . . . . . .
Table 3-18: Physical Traffic Channels 3-47. . . . . . . . . . . . . . . . . . . . . . . . . . . . . . . .
Table 3-19: SC614 Operating Frequencies 3-49. . . . . . . . . . . . . . . . . . . . . . . . . . . . .

List of Tables – continued
CDMA SC Products System Resource Guide (CSSRG) June 2001vi
Table 3-20: CDMA Carrier Support 3-50. . . . . . . . . . . . . . . . . . . . . . . . . . . . . . . . . .
Table 3-21: Physical Traffic Channels 3-50. . . . . . . . . . . . . . . . . . . . . . . . . . . . . . . .
Table 3-22: SC611 Operating Frequencies 3-51. . . . . . . . . . . . . . . . . . . . . . . . . . . . .
Table 3-23: CDMA Carrier Support 3-52. . . . . . . . . . . . . . . . . . . . . . . . . . . . . . . . . .
Table 3-24: Physical Traffic Channels 3-52. . . . . . . . . . . . . . . . . . . . . . . . . . . . . . . .
Table 3-25: SC300 Operating Frequencies 3-54. . . . . . . . . . . . . . . . . . . . . . . . . . . . .
Table 3-26: BTS Selection 3-55. . . . . . . . . . . . . . . . . . . . . . . . . . . . . . . . . . . . . . . . .
Table 3-27: CDMA Carrier Support 3-57. . . . . . . . . . . . . . . . . . . . . . . . . . . . . . . . . .
Table 3-28: Physical Traffic Channels 3-58. . . . . . . . . . . . . . . . . . . . . . . . . . . . . . . .
Table 3-29: SC4840 Operating Frequencies 3-59. . . . . . . . . . . . . . . . . . . . . . . . . . . .
Table 3-30: CDMA Carrier Support 3-61. . . . . . . . . . . . . . . . . . . . . . . . . . . . . . . . . .
Table 3-31: Physical Traffic Channels 3-61. . . . . . . . . . . . . . . . . . . . . . . . . . . . . . . .
Table 3-32: SC2440 Operating Frequencies 3-63. . . . . . . . . . . . . . . . . . . . . . . . . . . .
Table 3-33: CDMA Carrier Support 3-63. . . . . . . . . . . . . . . . . . . . . . . . . . . . . . . . . .
Table 3-34: Physical Traffic Channels 3-64. . . . . . . . . . . . . . . . . . . . . . . . . . . . . . . .
Table 3-35: SC340 Operating Frequencies 3-66. . . . . . . . . . . . . . . . . . . . . . . . . . . . .
Table 3-36: Pilot Beacon Output Power 3-67. . . . . . . . . . . . . . . . . . . . . . . . . . . . . . .
Table 3-37: Pilot Beacon Operating Frequencies 3-68. . . . . . . . . . . . . . . . . . . . . . . .
Table 5-1: OMC–R Capacities 5-4. . . . . . . . . . . . . . . . . . . . . . . . . . . . . . . . . . . . . .
Table 5-2: UNO 2.2 Planning Recommendations 5-19. . . . . . . . . . . . . . . . . . . . . . .
Table 7-1: Guidelines for Maximum Limit of Conversation Erlangs 7-6. . . . . . . .
Table 7-2: Guidelines for Walsh Code Erlangs Maximum Limits 7-7. . . . . . . . . . .
Table 7-3: Guidelines for Walsh Code Usage Maximum Limits (in minutes) 7-7. .
Table 7-4: Guidelines for Walsh Code Usage Planning Limits (in minutes) 7-12. . .
Table 7-5: Example Spreadsheet to Forecast WC Usage 7-14. . . . . . . . . . . . . . . . . .
Table 7-6: Paging Message Type Events 7-35. . . . . . . . . . . . . . . . . . . . . . . . . . . . . .
Table 7-7: Slot Cycle Index Time 7-37. . . . . . . . . . . . . . . . . . . . . . . . . . . . . . . . . . . .
Table 7-8: Cell Radius to PamSz (up to 60 km maximum) 7-39. . . . . . . . . . . . . . . .
Table 7-9: Access Message Type Events 7-41. . . . . . . . . . . . . . . . . . . . . . . . . . . . . .
Table 7-10: Paging Channel Workload Model Scenario 7-48. . . . . . . . . . . . . . . . . . .
Table 7-11: pmC_10 Records, General Data 7-52. . . . . . . . . . . . . . . . . . . . . . . . . . .
Table 7-12: pmC_10 Records, Origination Data 7-52. . . . . . . . . . . . . . . . . . . . . . . .
Table 7-13: pmC_52 Records 7-54. . . . . . . . . . . . . . . . . . . . . . . . . . . . . . . . . . . . . . .
Table 7-14: pmC_70 Records 7-55. . . . . . . . . . . . . . . . . . . . . . . . . . . . . . . . . . . . . . .
Table 7-15: pmC_10 Records, General Data 7-57. . . . . . . . . . . . . . . . . . . . . . . . . . .
Table 7-16: pmC_10 Records, Termination Data 7-57. . . . . . . . . . . . . . . . . . . . . . . .
Table 7-17: pmC_10 Records, Registration Data 7-59. . . . . . . . . . . . . . . . . . . . . . . .

List of Tables – continued
June 2001 viiCDMA SC Products System Resource Guide (CSSRG)
Table 7-18: pmC_52 Record for ADDS Page 7-62. . . . . . . . . . . . . . . . . . . . . . . . . .
Table 7-19: pmC_52 Record for Feature Notification 7-64. . . . . . . . . . . . . . . . . . . .
Table 7-20: pmC_52 Records for Shared Secret Data Update 7-65. . . . . . . . . . . . . .
Table 7-21: pmC_20 Records for Base Station Challenge 7-66. . . . . . . . . . . . . . . . .
Table 7-22: pmC_52 Records for Unique Challenge 7-66. . . . . . . . . . . . . . . . . . . . .
Table 7-23: Paging Channel Utilization 7-67. . . . . . . . . . . . . . . . . . . . . . . . . . . . . . .
Table 7-24: Access Channel Slots per Hour/Half–hour versus PamSz 7-69. . . . . . .
Table 7-25: Access Channel Workload Model Scenarios 7-71. . . . . . . . . . . . . . . . . .
Table 7-26: pmC_10 Records for ADDS Page Ack 7-73. . . . . . . . . . . . . . . . . . . . . .
Table 7-27: pmC_20 Records for Authentication Acknowledgements 7-73. . . . . . .
Table 7-28: Access Channel Utilization 7-74. . . . . . . . . . . . . . . . . . . . . . . . . . . . . . .
Table 7-29: Projected Paging Channel Utilization 7-80. . . . . . . . . . . . . . . . . . . . . . .
Table 7-30: Projected Access Channel Utilization 7-81. . . . . . . . . . . . . . . . . . . . . . .
Table B-1: Erlangs per Blocking B-1. . . . . . . . . . . . . . . . . . . . . . . . . . . . . . . . . . . .
Table B-2: Erlang B Spans B-13. . . . . . . . . . . . . . . . . . . . . . . . . . . . . . . . . . . . . . . . .
Table C-1: Erlangs per Blocking C-1. . . . . . . . . . . . . . . . . . . . . . . . . . . . . . . . . . . .
Table C-2: Erlang C Spans C-13. . . . . . . . . . . . . . . . . . . . . . . . . . . . . . . . . . . . . . . . .

List of Tables – continued
CDMA SC Products System Resource Guide (CSSRG) June 2001viii
Notes

Product Information
June 2001 ixCDMA SC Products System Resource Guide (CSSRG)
Model Chart
This table provides model numbers, descriptionsof model numbers and the quantity of each kitfor Product XYZ.
Model Complement For Product A – Models X, Y, Z
Model Description Quantity
Options
This table is an options model complement forproduct A.
Option Complement For Product A
Model Description Quantity
Specifications
The following tables list general, receiver andtransmitter performance specifications forProduct XYZ.
General Specifications for Product A
Specification Description
Receiver Specifications for Product A
Specification Description
Transmitter Specifications for Product A
Specification Description
Foreword
CDMA SC Products System Resource Guide (CSSRG) June 2001x
Scope of manual
This manual is intended for use by cellular telephone systemcraftspersons in the day-to-day operation of Motorola cellular systemequipment and ancillary devices. It is assumed that the user of thisinformation has a general understanding of telephony, as used in theoperation of the Public Switched Telephone Network (PSTN), and isfamiliar with these concepts as they are applied in the cellularmobile/portable radiotelephone environment. The user, however, is notexpected to have any detailed technical knowledge of the internaloperation of the equipment.
This manual is not intended to replace the system and equipmenttraining offered by Motorola, although it can be used to supplement orenhance the knowledge gained through such training.
Text conventions
The following special paragraphs are used in this manual to point outinformation that must be read. This information may be set-off from thesurrounding text, but is always preceded by a bold title in capital letters.The four categories of these special paragraphs are:
Presents additional, helpful, non-critical information thatyou can use.
NOTE
Presents information to help you avoid an undesirablesituation or provides additional information to help youunderstand a topic or concept.
IMPORTANT
*
Presents information to identify a situation in whichequipment damage could occur, thus avoiding damage toequipment.
CAUTION
Presents information to warn you of a potentiallyhazardous situation in which there is a possibility ofpersonal injury.
WARNING
. . . continued on next page
Foreword – continued
June 2001 xiCDMA SC Products System Resource Guide (CSSRG)
The following typographical conventions are used for the presentation ofsoftware information:
� In text, sans serif BOLDFACE CAPITAL characters (a type stylewithout angular strokes: i.e., SERIF versus ����������) are used toname a command.
� In text, typewriter style characters represent prompts and thesystem output as displayed on an operator terminal or printer.
� In command definitions, sans serif boldface characters represent thoseparts of the command string that must be entered exactly as shown andtypewriter style characters represent command output responsesas displayed on an operator terminal or printer.
� In the command format of the command definition, typewriterstyle characters represent the command parameters.
Changes to manual
Changes that occur after the printing date are incorporated into yourmanual by Cellular Manual Revisions (CMRs). The information in thismanual is updated, as required, by a CMR when new options andprocedures become available for general use or when engineeringchanges occur. The cover sheet(s) that accompany each CMR should beretained for future reference. Refer to the Revision History page for a listof all applicable CMRs contained in this manual.
Receiving updates
Technical Education & Documentation (TED) maintains a customerdatabase that reflects the type and number of manuals ordered or shippedsince the original delivery of your Motorola equipment. Also identifiedin this database is a “key” individual (such as DocumentationCoordinator or Facility Librarian) designated to receive manual updatesfrom TED as they are released.
To ensure that your facility receives updates to your manuals, it isimportant that the information in our database is correct and up-to-date.Therefore, if you have corrections or wish to make changes to theinformation in our database (i.e., to assign a new “key” individual),please contact Technical Education & Documentation at:
MOTOROLA, INC.Technical Education & Documentation1 Nelson C. White ParkwayMundelein, Illinois 60060U.S.A.
Phone: Within U.S.A. and Canada 800-872-8225. . . . . Outside of U.S.A. and Canada +1-847-435–5700. . FAX: +1-847-435–5541. . . . . . . . . . . . . . . . . . . . . .
. . . continued on next page

Foreword – continued
CDMA SC Products System Resource Guide (CSSRG) June 2001xii
Reporting manual errors
In the event that you locate an error or identify a deficiency in yourmanual, please take time to write to us at the address above. Be sure toinclude your name and address, the complete manual title and partnumber (located on the manual spine, cover, or title page), the pagenumber (found at the bottom of each page) where the error is located,and any comments you may have regarding what you have found. Weappreciate any comments from the users of our manuals.
24-hour support service
If you have any questions or concerns regarding the operation of yourequipment, please contact the Customer Network Resolution Center forimmediate assistance. The 24 hour telephone numbers are:
Arlington Heights, IL 800-433-5202. . . . . . . . . . Arlington Heights, International +1–847-632-5390. . Cork, Ireland 44–1793–565444. . . . . . . . . . . . . . . . . Swindon, England 44–1793–565444. . . . . . . . . . . . .

General Safety
June 2001 xiiiCDMA SC Products System Resource Guide (CSSRG)
Remember! . . . Safetydepends on you!!
The following general safety precautions must be observed during allphases of operation, service, and repair of the equipment described inthis manual. Failure to comply with these precautions or with specificwarnings elsewhere in this manual violates safety standards of design,manufacture, and intended use of the equipment. Motorola, Inc. assumesno liability for the customer’s failure to comply with these requirements.The safety precautions listed below represent warnings of certain dangersof which we are aware. You, as the user of this product, should followthese warnings and all other safety precautions necessary for the safeoperation of the equipment in your operating environment.
Ground the instrument
To minimize shock hazard, the equipment chassis and enclosure must beconnected to an electrical ground. If the equipment is supplied with athree-conductor ac power cable, the power cable must be either pluggedinto an approved three-contact electrical outlet or used with athree-contact to two-contact adapter. The three-contact to two-contactadapter must have the grounding wire (green) firmly connected to anelectrical ground (safety ground) at the power outlet. The power jack andmating plug of the power cable must meet International ElectrotechnicalCommission (IEC) safety standards.
Do not operate in an explosiveatmosphere
Do not operate the equipment in the presence of flammable gases orfumes. Operation of any electrical equipment in such an environmentconstitutes a definite safety hazard.
Keep away from live circuits
Operating personnel must:
� not remove equipment covers. Only Factory Authorized ServicePersonnel or other qualified maintenance personnel may removeequipment covers for internal subassembly, or componentreplacement, or any internal adjustment.
� not replace components with power cable connected. Under certainconditions, dangerous voltages may exist even with the power cableremoved.
� always disconnect power and discharge circuits before touching them.
Do not service or adjust alone
Do not attempt internal service or adjustment, unless another person,capable of rendering first aid and resuscitation, is present.
General Safety – continued
CDMA SC Products System Resource Guide (CSSRG) June 2001xiv
Use caution when exposing orhandling the CRT
Breakage of the Cathode–Ray Tube (CRT) causes a high-velocityscattering of glass fragments (implosion). To prevent CRT implosion,avoid rough handling or jarring of the equipment. The CRT should behandled only by qualified maintenance personnel, using approved safetymask and gloves.
Do not substitute parts ormodify equipment
Because of the danger of introducing additional hazards, do not installsubstitute parts or perform any unauthorized modification of equipment.Contact Motorola Warranty and Repair for service and repair to ensurethat safety features are maintained.
Dangerous procedurewarnings
Warnings, such as the example below, precede potentially dangerousprocedures throughout this manual. Instructions contained in thewarnings must be followed. You should also employ all other safetyprecautions that you deem necessary for the operation of the equipmentin your operating environment.
Dangerous voltages, capable of causing death, are present in thisequipment. Use extreme caution when handling, testing, andadjusting.
WARNING

Revision History
June 2001 xvCDMA SC Products System Resource Guide (CSSRG)
Manual Number
68P09298A50–A
Manual Title
CDMA SC Products System Resource Guide (CSSRG) CDMA SC Products System Resource Guide (CSSRG)
Version Information
The following table lists the manual version, date of version, andremarks on the version.
VersionLevel
Date of Issue Remarks
O December 2000 Original.
A June 2001 Revised version.
Cellular Manual RevisionInformation
The following table lists Cellular Manual Revision (CMR) number, dateof CMR, and remarks on the CMR.
RevisionLevel
Date of Issue Remarks
CMR No.

Patent Notification
CDMA SC Products System Resource Guide (CSSRG) June 2001xvi
Patent numbers
This product is manufactured and/or operated under one or more of thefollowing patents and other patents pending:
4128740 4661790 4860281 5036515 5119508 5204876 5247544 53013534193036 4667172 4866710 5036531 5121414 5204977 5251233 53013654237534 4672657 4870686 5038399 5123014 5207491 5255292 53032404268722 4694484 4872204 5040127 5127040 5210771 5257398 53032894282493 4696027 4873683 5041699 5127100 5212815 5259021 53034074301531 4704734 4876740 5047762 5128959 5212826 5261119 53054684302845 4709344 4881082 5048116 5130663 5214675 5263047 53070224312074 4710724 4885553 5055800 5133010 5214774 5263052 53075124350958 4726050 4887050 5055802 5140286 5216692 5263055 53094434354248 4729531 4887265 5058136 5142551 5218630 5265122 53095034367443 4737978 4893327 5060227 5142696 5220936 5268933 53111434369516 4742514 4896361 5060265 5144644 5222078 5271042 53111764369520 4751725 4910470 5065408 5146609 5222123 5274844 53115714369522 4754450 4914696 5067139 5146610 5222141 5274845 53134894375622 4764737 4918732 5068625 5152007 5222251 5276685 53197124485486 4764849 4941203 5070310 5155448 5224121 5276707 53217054491972 4775998 4945570 5073909 5157693 5224122 5276906 53217374517561 4775999 4956854 5073971 5159283 5226058 5276907 53233914519096 4797947 4970475 5075651 5159593 5228029 5276911 53253944549311 4799253 4972355 5077532 5159608 5230007 5276913 53275754550426 4802236 4972432 5077741 5170392 5233633 5276915 53295474564821 4803726 4979207 5077757 5170485 5235612 5278871 53296354573017 4811377 4984219 5081641 5170492 5235614 5280630 53393374581602 4811380 4984290 5083304 5182749 5239294 5285447 D3373284590473 4811404 4992753 5090051 5184349 5239675 5287544 D3422494591851 4817157 4998289 5093632 5185739 5241545 5287556 D3422504616314 4827507 5020076 5095500 5187809 5241548 5289505 D3470044636791 4829543 5021801 5105435 5187811 5241650 5291475 D3496894644351 4833701 5022054 5111454 5193102 5241688 5295136 RE318144646038 4837800 5023900 5111478 5195108 5243653 52971614649543 4843633 5028885 5113400 5200655 5245611 52992284654655 4847869 5030793 5117441 5203010 5245629 53010564654867 4852090 5031193 5119040 5204874 5245634 5301188

June 2001 CDMA SC Products System Resource Guide (CSSRG)
Chapter 1: CDMA SC Products Expansion Introduction
Table of Contents
CDMA SC Products Expansion Introduction 1-1. . . . . . . . . . . . . . . . . . . . . . . . . . . Introduction 1-1. . . . . . . . . . . . . . . . . . . . . . . . . . . . . . . . . . . . . . . . . . . . . .
Expansion Planning Introduction 1-6. . . . . . . . . . . . . . . . . . . . . . . . . . . . . . . . . . . . Introduction 1-6. . . . . . . . . . . . . . . . . . . . . . . . . . . . . . . . . . . . . . . . . . . . . .
General Capacity Engineering Strategy 1-7. . . . . . . . . . . . . . . . . . . . . . . . . . . . . . . Introduction 1-7. . . . . . . . . . . . . . . . . . . . . . . . . . . . . . . . . . . . . . . . . . . . . .
1

Table of Contents – continued
CDMA SC Products System Resource Guide (CSSRG) June 2001
Notes
1

CDMA SC Products Expansion Introduction
June 2001 1-1CDMA SC Products System Resource Guide (CSSRG)
Introduction
Because it’s the natural progression of a wireless system to expand overtime, the Systems Engineer needs current, and pertinent, informationcovering various aspects of system expansion planning.
Increased traffic demands are a function of new subscribers being addedto the network and of the greater usage of the subscribers. This increasedtraffic demand drives the requirement for more physical hardware to beinstalled in the system. The added equipment not only supports theadditional voice connections required but also supports the increase ofcall processing messaging that results due to the additional traffic.
Additional RF coverage is a function of increasing service area of thewireless system. This increase in service area can take the form of:
� Providing RF inside of buildings
� Increasing the boundaries of the wireless system
� Providing coverage in tunnels
� Providing coverage in parking garages.
An additional aspect is migrating the system from one that was designedinitially for vehicular use to one that now provides for overall betterin–building penetration. The result of this additional RF coveragetypically takes its form as additional cell sites. These cell sites can takethe form of macro cells, micro cells, or repeaters.
Each network element (Base Transceiver Station, Base Site Controller,Mobile Switching Center, Home Location Register, etc.) can beimpacted with an increase to the traffic or RF coverage. The SystemsEngineer needs to examine each of the network elements to determine ifit is sized sufficiently to support the new demands or if additionalequipment is required. Additional equipment can take the form of:
� Additional card(s)
� Additional cage(s)
� Additional frame(s)
� Additional network element(s) (BTS, BSC, MSC, etc.).
As traffic increases, additional voice channels are required at the BTS.One of the first steps in expansion is to add additional channel elements.In a CDMA system, an additional carrier is required at stages of thesystem’s development.
If the additional equipment is not installed in the system and subscribertraffic keeps increasing, the system experiences excess blocking. Excessblocking can cause many system problems. For instance, a subscriberunit may be unable to place or receive a call because there are no voicechannels available or the subscriber may attempt to access the systemseveral times before a voice channel is assigned.
Another potential problem involves a situation where a call is draggedinto a non–optimum RF area because there are no channels available in
1

CDMA SC Products Expansion Introduction – continued
CDMA SC Products System Resource Guide (CSSRG) June 20011-2
the desired target cell. This may cause an increased amount of droppedcalls. Since the subscriber is outside of its preferred site of service, thesubscriber is most likely at its full power and therefore increases thenoise in the nearby vicinity. Since the subscriber is closer to an adjacentsite and operating at full power, it is more likely to cause interference(uplink).
As a system grows from one to two to three carriers, etc., the Erlangcapacity of each site increases (for example, from eighteen to thirty–sixto fifty– four Erlangs, respectively). If one assumes that the initialsystem started with ten sites, each offering eighteen Erlangs, the CBSCwould need to be able to support 180 Erlangs. If the second carrier isadded to all ten sites, the CBSC now needs to support 360 Erlangs. Asmore carriers are installed at each BTS, the CBSC needs to expand.There comes a point where the processing and port capabilities of theCBSC will be exceeded. At this point, another CBSC needs to be addedto the network.
The MSC is also impacted with the additional traffic load. Like theCBSC, there comes a point where the processing and port capabilities ofthe MSC will be exceeded. At this point, another MSC needs to beadded to the network.
Other items also need to be considered as the system grows, such as:
� Leased T1 facilities
� Increased equipment power demands
� Operation and maintenance support
� Subscriber database management, billing, statistics, etc.
Plan for Growth
The big question is this: “When does the engineer/operator know that thesystem needs to expand?”
If the BTSs are beginning to block or shed traffic (assuming thathardware failures are not causing an overload condition), the operatorhas waited too long because some amount of potential revenue has beenlost. The system operator needs to anticipate the growth of the wirelessmarket and stay several steps ahead of the subscriber demands.
Ongoing projections of the wireless system growth should be made on aperiodic basis. The speed at which the system is growing has somecorrelation to how often the periodic projections should be done.
Marketing Projections
The wireless system’s marketing team may have projections on thenumber of subscribers to which they intend to provide services. Inaddition, they should have an understanding of how these subscribersuse the wireless service. Other factors that the marketing team canprovide include information on whether the provider is planning amarketing blitz or if buying incentives for the consumer are going to beoffered to entice subscribers to sign on at a faster rate. This could
1

CDMA SC Products Expansion Introduction – continued
June 2001 1-3CDMA SC Products System Resource Guide (CSSRG)
drastically impact the time available to order, install, and test any newequipment to support future growth requirements.
The marketing team may also be able to provide information concerningrequirements for any change to the area of wireless service. For instance,new BTS(s) may be necessary if a new subdivision or shopping mall isbeing built and the area currently has inadequate signal levels. Anothersituation might involve the improvement of coverage within specificbuildings.
Statistics
The System/Traffic Engineer monitors the system statistics to judgewhen additional capacity is needed at a cell site. With the goal ofexpanding the system in mind, the statistics need to be viewed from agrowth perspective and not for troubleshooting. Unusual data should befiltered out so the projections won’t be flawed. For example, an accidentoccurring in a given cell’s coverage area may cause an increase in traffic.Holidays, conventions, or other events also tend to skew the statisticsand the judgement of the engineer, if not properly addressed.Adjustments should also be made for seasonal variations. For instance,the summer months may show less traffic than the fall months.
New subdivisions, office complexes, or newly built–up areas need to beexamined in order to:
� Ensure that RF coverage is available
� Determine the impact on the traffic requirements.
Much care needs to be taken when reviewing system statistics so as notto arrive at erroneous conclusions. For instance, faulty equipment maybe a factor in misrepresenting traffic location. Traffic seen on a given cellmay best be served by another site if that other site was operatingproperly. Examples of one site not operating properly include:
� Misaligned antennas
� Power out of the site is not correct
� Some channel elements are out of service.
The coverage, capacity, or quality of a non–optimal site may be reducedand therefore require the assistance from a neighboring site.
Customer Complaints
Customer complaint reports can be filtered for issues which identifyareas where coverage is desired but is not currently available. This is oneindication of where a new cell site might be required. Customercomplaints can also show areas where blocking is occurring. Thestatistics should indicate the specific cell/sector where the blocking isoccurring, but the customer complaint reports may give a betterindication of where the users are located within the sector. If all of thecomplaints are in a given area within the cell, this may indicate the needfor:
� A new site to support that specific area
1

CDMA SC Products Expansion Introduction – continued
CDMA SC Products System Resource Guide (CSSRG) June 20011-4
� Additional optimization (to verify if it is an RF coverage relatedoptimization issue or a capacity issue).
Drive Tests
Drive tests can be performed to confirm issues raised by customercomplaints to determine the best method of resolution or optimization.In addition, the operator may have an idea of areas needingimprovement. Drive tests can be performed to investigate the area beforemoney is invested in additional infrastructure.
RF analysis consists of ensuring that each cell site covers a certain area.Poor system performance results in areas which do not have an adequatelevel of signal strength. RF coverage of a particular cell site can be foundby utilizing drive test collection equipment and accompanying software.Drive testing can also be a very useful aid for uncovering equipmentproblems or poorly optimized parameter settings.
Engineering and Planning
The wireless system operator needs to predict when an expansion isneeded to ensure that the installed system infrastructure is able tosupport the predicted demand. The prediction in growth rate can beapproximated with marketing forecasts and statistical analyses ofexisting data. A load line chart can be created showing the increase ofsubscribers over time. The Systems Engineers need to concernthemselves with an expansion to the coverage area or to an improvementto the signal level (for instance, providing for in–building coverage).
The current system subscriber capacity can be determined and baselinedwhen the Systems Engineers knows the:
� Desired grade of service for the wireless system
� Usage pattern of the average subscriber
� Existing traffic capacity of each site.
Using the appropriate traffic measurement data, the Systems Engineerhas the ability to predict the time progression of a system’s growth andcan therefore predict when various capacity limitations will be reached.The overall system should not be viewed as one entity but rather,individual network elements should be reviewed to predict the amount ofadditional traffic each can support prior to exhausting its resources. Forinstance, one cell site may already be blocking calls. Another cell site’sresources may be under utilized and far below its traffic capacitythreshold.
The following summarizes the minimum requirements needed forgenerating a growth plan for a system. This data is used for predictingthe amount of channels and cell sites needed to accommodate a givennumber of subscribers and only addresses the capacity requirement. RFcoverage and interference in the system can be addressed if additionalinformation is supplied for each cell site (RF link budget, antennas,height, etc.).
1

CDMA SC Products Expansion Introduction – continued
June 2001 1-5CDMA SC Products System Resource Guide (CSSRG)
Minimum Information Requirements for Capacity Planning
The following are minimum capacity planning requirements:
� Present quantity of cell sites.
� Present configuration of site (omni or sector).
� Present quantity of channels equipped and CDMA carriers per–site orper–sector.
� Location of cell sites
– The general location and relation of each cell is required ifpropagation studies are not being done.
� Present quantity of subscribers.
� Predicted quantity of subscribers (on a monthly basis) for growthperiods out to six months minimum; one year to two year projectionsare preferred.
� Present traffic for each cell and/or sector
– Determine if this traffic is from the busy or low usage period.
� Any special requirements of the customer:
– Grade of service for which to design.– Which traffic model to use (for example, Erlang B and Erlang C)– Assumes linear growth throughout the system unless otherwise
specified.
� Spectrum availability, if additional carriers are to be considered.
Traffic load projections are absolutely necessary for predicting systemcapacity. If a service provider delays an expansion effort until the systemexhibits a degradation in system performance and/or blocking, asignificant amount of revenue may be lost as a result of blocked callsand/or churn. Projections are required to allow time to properly plan fora system expansion. Time needs to be allotted for the following:
� Plan and engineer the expansion
� Order and obtain the necessary equipment
� Obtain the space/building (including necessary permits and licensing)
� Order and install the facilities
� Install, test, and optimize the equipment.
Implementation
Proper implementation of the new equipment is essential for optimumperformance of a wireless system. Implementation can involve hardware(ensuring proper bolt down, grounding and cabling, as well ascalibration of the equipment, etc.) and software. The systemadministrator needs to ensure that cell sites are added appropriately tothe MSC and Centralized Base Station Controller (CBSC) databases andthat all necessary database updates are made to other sites which may beimpacted.
Impacts to other sites include changes to neighbor lists. Too few ofneighbor sites can cause dropped calls due to no neighbor cell availableto accept the handoff.
1
Expansion Planning Introduction
CDMA SC Products System Resource Guide (CSSRG) June 20011-6
Introduction
The CDMA SC Products System Resource Guide (CSSRG) providesSystems Engineers with information on:
� What these resources are
� How to monitor resource utilization
� Possible actions which may reduce that utilization
� Impacts of many significant features
� Growth planning.
This information allows the engineer to identify which resources maylimit the capacity of the system, and those which may be near overloador have already been overloaded.
The CSSRG contains seven chapters and three appendices:
� Introduction
� Centralized Base Station Controller (CBSC)
� Base Transceiver Station (BTS)
� Intelligent Network (IN)
� Operations and Maintenance
� Data Services
� CDMA RF Carrier
� Appendix A – CDMA Call Flow
� Appendix B – Erlang B Tables
� Appendix C – Erlang C Tables.
The guide provides guidelines for managing system expansion. Itdescribes considerations to be made when additions and changes areneeded for a growing system.
1

General Capacity Engineering Strategy
June 2001 1-7CDMA SC Products System Resource Guide (CSSRG)
Introduction
The following describes a generic capacity engineering strategy to usefor all of the network elements covered by the CSSRG. The basicpremise to this strategy involves an analysis of traffic measurements andutilization measurements that can reasonably determine the busy periodstatistical traffic values, and the sensitivity of the network elementutilization to carried traffic. Current network utilization combined withmarket estimates of traffic or subscriber growth can be used to estimatefuture network element utilization. A comparison of current and/orfuture estimated network element utilization with the maximumspecified limits determines when this network element will reach itsoperating limits with respect to growth.
Traffic Environment
Figure 1-1 provides a functional block diagram of a typical CDMAnetwork. Each network element consists of subsystems that are sensitiveto carried traffic. In a cellular/PCS network, carried traffic may consist ofmultiple traffic variables that have varying degrees of correlation to eachother. For example, during a given observation period, the number ofhandoffs correlates highly to the number of call attempts while thenumber of registrations has little correlation to the number of callattempts. An environment with highly correlated multiple trafficvariables lends itself to a simpler characterization between networkelement utilization and one of the dominant traffic variables.
Network Element and Traffic Capacity
A typical network element has different subsystems designed to handledifferent subsets of the offered traffic. Examples of traffic–sensitivesubsystems include:
� Processors
� Signaling links
� Trunks
� I/O buses
� Memory and storage
� Switch fabrics
� Transcoders.
An example of a non–traffic sensitive subsystem is the clock subsystem.
Each subsystem may be sensitive to different constituent components ofthe carried traffic. Some subsystems are sensitive to event traffic, someare sensitive to Erlang traffic, and some are sensitive to both types oftraffic. Consequently, internal measurements and capacity engineeringmodels differ between subsystems. The differences in engineeringmodels between subsystems include the:
� Actual traffic variables affecting the subsystem
1

General Capacity Engineering Strategy – continued
CDMA SC Products System Resource Guide (CSSRG) June 20011-8
� Subsystem’s sensitivity to various traffic types
� Subsystem’s maximum utilization limit.
Even so, each capacity engineering model has a similar strategycontaining similar aspects. The common strategy and model aspects aredescribed in the following topics.
Figure 1-1: Functional Block Diagram of a CDMA Network
EMX 2500/
DS0 Circuit Switch
CommonChannel (SS7)
Communication
AdministrationCommonControl
NetworkCommunication
IS634/651 (A+)
Voice
Signaling/Data/Control
AnalogCell GroupManager
ServiceCircuits
Selector / Vocoder
Sub RateCircuit Switch
CDMACDMA BTS
Trunk (Span Line) Interface
CBSC
Disks
NetworkCommunication
ApplicationProcessing
Tandem
Signaling
MR or
TO OTHER EMXs
Disks
NetworkCommunication
ApplicationProcessing
TandemHLR
ANALOGBTS
Mobility(Radio)
Trunk (Span Line) Interface
XCMM
IS-41TO OMC-RConvertor
Network
PSTN
5000
Capacity Engineering Approach
The capacity engineering strategy described here provides a means todetermine the:
� Traffic carried by each network element
� Current level of utilization for each network element
� Sensitivity to traffic growth for each network element
� A process for estimating future utilization with traffic growth.
1

General Capacity Engineering Strategy – continued
June 2001 1-9CDMA SC Products System Resource Guide (CSSRG)
Given these results, it is then an easy matter to determine which networkelement is currently limiting offered traffic and which might limit trafficgrowth in the future.
A key point to be repeated is that the upper limits of a network resource,as stated in terms of carried traffic, may be different for other networkelements of the same type due to the different intensity levels of trafficsubcomponents in each network element and differences in trafficsensitivity functions. The result is that similar types of network elementsmay limit at different traffic levels due to these traffic component patterndifferences. As such, it is critical to actually determine the trafficsensitivity of each network element to the traffic actually occurring inthat network element and to define what is meant by measured trafficlevels. This strategy uses the concept of statistical traffic busy periods,requiring analysis of carried traffic in a network element measured manytimes during the observed day and for a sufficient number of observeddays to get a reasonable sample of traffic levels.
Overview of a Six Step Capacity Engineering Strategy
The following provides a generic six step capacity engineering strategythat can be applied towards capacity engineering for each type ofnetwork element. The six steps are:
1. Collect traffic and network element utilization data
2. Determine present status
Analyze traffic sensitivity using least squares method and determinebusy period traffic intensity statistics
3. Forecast utilization
Calculate estimated future utilization based upon market growthestimates, traffic sensitivity, and current busy period traffic intensitystatistics
4. Identify current and future network elements that exceed or willexceed maximum specified utilization limits
5. Evaluate relief alternatives
6. Implement appropriate relief alternative(s).
Each of the strategy’s six steps are described in further detail with aprocedure or guideline for each step. General notes are included to aid inunderstanding the use of the procedures and guidelines. Figure 1-2provides a flow diagram summarizing the procedures and guidelinesused in each step of the strategy.
1

General Capacity Engineering Strategy – continued
CDMA SC Products System Resource Guide (CSSRG) June 20011-10
Figure 1-2: Flow Diagram for Generic Capacity Engineering Process
Collect Measured Data:– Traffic Measurements– Utilization Levels
Determine Load Line Analysis (LLA)parameters (Method of LeastSquares linear function) according toequation U = a + bx, where:– U is level of utilization– a is idle level (y–intercept) param– b is traffic sensitivity param (slope)– x is traffic level
Determine:– Number of Subscriber (Ni) for a particular month– Calculate average busy period traffic for month (i) by multiplying Batt/Ns*Ni
Create utilization forecast:– Average busy period traffic for month (i) applied to Least Squares function estimates future utilization.
Evaluate results:– Identify elements that exceed limits in engineering period
Subscriber GrowthForecast(from Marketing)– Monthly and annual
Implement solution(s)
Solve capacity problems byevaluating solutions:– Reduce traffic to element– Balance traffic between elements– Upgrade element(s)– Add element(s)
Determine busy period traffic stats:– Busy period Hour/Day/Week/Season– Busy period “attempts” per subscriber (Batt/Ns)– Average and standard deviation of busy period “attempts” per subscriber.
Collect data:
Determine presentstatus:
Forecast utilization:
Identify bottlenecks:
Evaluate relief:Re–analyze
Deploy alternative:
Collect data and network element utilization data
The following generic data collection procedure applies to each networkelement:
� Identify the data to be collected.
� Determine collection intervals and start times.
1
General Capacity Engineering Strategy – continued
June 2001 1-11CDMA SC Products System Resource Guide (CSSRG)
� Collect the data according to determined times.
� Adjust collection according to observed measurements.
Identify the data to be collected
Use this to identify which network element utilization and trafficmeasurements are sufficient for (ultimately) calculating a least–squaredtrend function. It is important that measurements be acquired throughoutthe day from the lightest–loaded point to the highest–loaded point tocharacterize the full usage range of the network element. Collectingcommon “network–level” traffic measurements (for example, EMX callattempts) is preferable to collecting individual element loading (forexample, disk accesses).
However, it is important to collect traffic measurements for all trafficvariables that load the given network element. Subsequent specificcapacity engineering models may use a common, network–level loadstatistic provided in an environment where the dominant traffic loadingvariables for this network element are highly correlated. When acommon load statistic is not available for an element, use a load statisticthat has strong correlation to the predominant common load statistic.
Statistical analysis may be used in estimating pair–wisetraffic variable correlation values.
NOTE
Determine collection intervals and start times
Use this to specify traffic and utilization measurement periods. Whichperiods are specified depends on whether the measurements beingperformed are for an initial baseline or for on–going observations.Measurements for an initial baseline typically include a broader set ofdata as to characterize busy periods over time. Measurements foron–going observations, where busy period characteristics are alreadyknown, typically include samples from those busy periods. Cellulartraffic statistics may not be stationary over a one–hour period and, assuch, it is recommended, wherever possible, to take traffic andutilization measurements over a one–half hour period, rather than aone–hour period. The busy period is therefore ideally a one–half hourperiod.
Collect the data according to determined times
Use this to systematically collect data to reveal the (at least) Daily BusyPeriod and Busy Day. Typically ten or more calendar days are required.Table 1-1 provides a collection schedule template for systematicallycollecting the data. This data is used in Busy Period Traffic Analysisdescribed in the following Determine present status topic. It is importantto collect traffic measurements for all traffic variables that can load thegiven network element and to collect enough periods throughout the dayto ensure subsequent capture of the busy period for each traffic variableas well as the busiest period for network element utilization.
1

General Capacity Engineering Strategy – continued
CDMA SC Products System Resource Guide (CSSRG) June 20011-12
Busy week, busy month, and busy season are important as well, butthese items might not be readily distinguishable in rapidly growingsystems unless normalization calculations are made. Normalizationcalculations are made by dividing dominant traffic intensity busy periodvalues by the population of subscribers offering the traffic during theobservation period.
Table 1-1: Template for Typical Measurement Schedule
Hour Day 1 Day 2 Day 3 Day 4 Day 5 Day 6 Day 7 Day 8 Day 9 Day 10
00
03
04
05
09
10
11
12
14
15
16
17
18
19
20
21
Adjust collection according to observed measurements
In networks where busy periods are known, data is collected to monitortraffic patterns and to identify the most likely overloaded situations.These periods are determined following Busy Period Traffic Analysisdescribed in the following Determine present status topic. Changesdetected in traffic patterns indicate the potential for uncharacterizedloading. In this case, a new baseline may need to be established.
Determine present status
This step utilizes the data collected from the previous step to determinetwo very important results: the traffic sensitivity function parameters andthe busy period statistics. The following generic data collectionprocedure applies to each network element:
� Validate the data
1

General Capacity Engineering Strategy – continued
June 2001 1-13CDMA SC Products System Resource Guide (CSSRG)
� Record data points for each measurement period
� Determine network element’s traffic sensitivity
� Analyze busy period traffic
� Determine traffic correlation
� Calculate the regression line for each network element.
Validate the data
Validation of the collected data is important to assure consistent statisticsfor all of the traffic variables that are available for the measurementperiod. Missing or incomplete traffic data for a specific period shouldnot be counted in the busy period statistical analysis. Furthermore, thedata should be checked for any unusual traffic loading or utilizationvalues that may be indicative of environmental changes, such asadministrative actions, restarts, or failures. This may invalidate the datafor normal operation predictive purposes. Any special indicationsregarding incentives, etc., that may make the data deviate from normaltraffic environments should also be considered as abnormal trafficenvironments that are not useful for future traffic estimates. The suspectdata can be removed from the data to be analyzed if this special situationis not considered to be part of the normal traffic environment.Nevertheless, try to determine the reason for any suspect data valuesbefore discarding them since this data may represent a new traffic patternor a recurring pattern (such as, afternoon sporting events, concerts, etc.).
Record data points for each measurement period
For each measurement time period, record data points that comparenetwork element utilization versus traffic. If using a spreadsheet, create acolumn for the each traffic measurement variable and create a column forthe measured utilization or calculated utilization. The rows thenrepresent the set of values for each measurement period, traffic andutilization.
Ideally, the capacity of a given network element is sensitive to a singletraffic variable. For instance, the EMX’s Common Channel Manager(CCM) processor is sensitive to call attempts at the switch. In thesecases, single variable models sufficiently describe the relationshipbetween capacity and load. Frequently, a given network element issensitive to a set of traffic variables rather than just a single variable.
Also, in these cases, multi–variable models better describe the element’scapacity/load relationship. Multi–variable models require measurementand statistical analysis of each traffic variable as well as statisticalanalysis of the aggregate of traffic variables comprising the element’sload. Many procedures in this document are based on single–variablemodels; those procedures based on multi–variable models are noted.
Determine network element’s traffic sensitivity
The Busy Period Traffic Analysis is very dependent upon the networkoperator’s operations engineering objectives and performance objectives.There are a number of busy period statistical analysis techniques that can
1

General Capacity Engineering Strategy – continued
CDMA SC Products System Resource Guide (CSSRG) June 20011-14
be used that are more or less conservative in their calculation of averagebusy period traffic. The two most commonly used are the TimeConsistent Busy Hour Analysis and Bouncing Busy Hour Analysis.
To determine the time consistent busy period, calculate the averageacross all the observed days for each time period. The time period withthe highest average is termed the busy hour for this study. Also, calculatethe standard deviation of these values. To determine the bouncing busyperiod, find the time period for each day with the highest traffic value.Calculate the average across all of these traffic values. In addition,calculate the standard deviation of these values.
Another variant of these two approaches is to consider the use of onlythe highest traffic days of the analysis period and then perform ananalysis only for these days. Ultimately, the choice of approach is up tothe network operator.
The average busy period traffic values, when divided by the number ofsubscribers, define the average busy traffic levels per subscriber and canbe used for estimating traffic growth from subscriber growth. Theaverage busy period traffic, when plotted against the utilization trafficsensitivity curve, defines the current baseline traffic and utilization pointof operation for engineering purposes. If the busy period utilizationvalue is near the maximum specified limit, the network element requirescapacity relief.
Normal operation may not be guaranteed and is dependenton the congestion relief mechanism(s) being activated.
NOTE
Analyze busy period traffic
If the data is to represent baseline measurements for the network, busyperiod analysis should be performed first to determine the periods mostlikely for overload situations. Here, additional correlation analysis isperformed to determine the dominant traffic variables loading thenetwork element under study.
For data representing an observational busy period, an analysis isperformed to assure that stress periods remain constant. Correlationanalysis for this data assures that uncharacterized traffic variables havenot changed the pattern for the traffic load on the network element. Ifuncharacterized variables are detected, the network measurements shouldbe baselined again. New baseline measurements are not necessary if thebusy period changes but the traffic pattern has not. The results of theabove analyses are used to determine subsequent data collection.
Determine traffic correlation
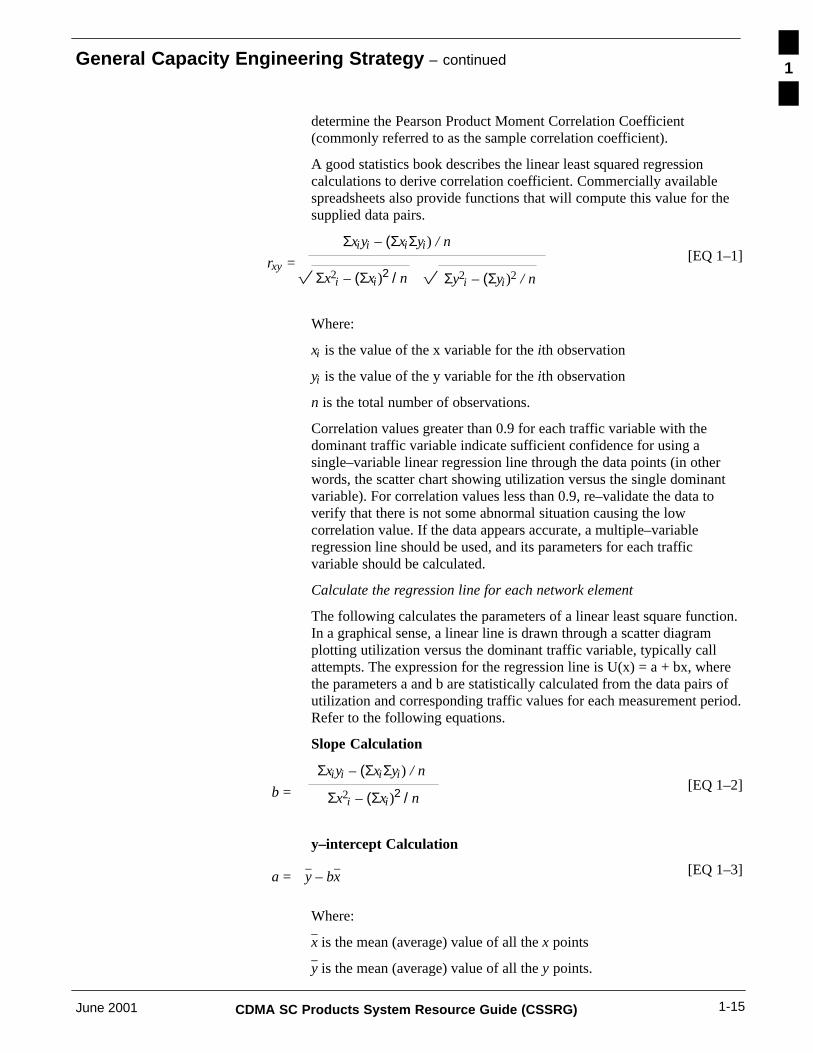
Next, the pair–wise correlations coefficients, or Pearson ProductMoment Correlation Coefficients, for each pair of traffic variablesshould be calculated. Equation 1–1 shows the calculation made to
1
General Capacity Engineering Strategy – continued
June 2001 1-15CDMA SC Products System Resource Guide (CSSRG)
determine the Pearson Product Moment Correlation Coefficient(commonly referred to as the sample correlation coefficient).
A good statistics book describes the linear least squared regressioncalculations to derive correlation coefficient. Commercially availablespreadsheets also provide functions that will compute this value for thesupplied data pairs.
rxy =
Σxiyi – (ΣxiΣyi) / n
Σx2i – (Σxi)
2 / n
[EQ 1–1] � Σy2
i – (Σyi)2 / n�
Where:
xi is the value of the x variable for the ith observation
yi is the value of the y variable for the ith observation
n is the total number of observations.
Correlation values greater than 0.9 for each traffic variable with thedominant traffic variable indicate sufficient confidence for using asingle–variable linear regression line through the data points (in otherwords, the scatter chart showing utilization versus the single dominantvariable). For correlation values less than 0.9, re–validate the data toverify that there is not some abnormal situation causing the lowcorrelation value. If the data appears accurate, a multiple–variableregression line should be used, and its parameters for each trafficvariable should be calculated.
Calculate the regression line for each network element
The following calculates the parameters of a linear least square function.In a graphical sense, a linear line is drawn through a scatter diagramplotting utilization versus the dominant traffic variable, typically callattempts. The expression for the regression line is U(x) = a + bx, wherethe parameters a and b are statistically calculated from the data pairs ofutilization and corresponding traffic values for each measurement period.Refer to the following equations.
Slope Calculation
b =
Σxiyi – (ΣxiΣyi) / n
Σx2i – (Σxi)
2 / n
[EQ 1–2]
y–intercept Calculation
a = y – bx [EQ 1–3]
Where:
x is the mean (average) value of all the x points
y is the mean (average) value of all the y points.
1

General Capacity Engineering Strategy – continued
CDMA SC Products System Resource Guide (CSSRG) June 20011-16
Any good statistics book describes the linear least squared regressioncalculations to derive the slope and y–intercept of the above function.Commercially available spreadsheets also provide functions that willcompute these parameters for the supplied data pairs.
Forecast utilization
The following requires an additional set of data to be able to forecastnetwork element utilization. The data required can be obtained frommarket forecasts of subscriber growth over the planning period. Thefollowing generic steps can be followed for each network element:
� Determine subscriber growth over the forecast period
� Derive traffic growth over the forecast period
� Calculate the estimated future utilization
� Graph utilization versus growth for the forecast period
� Assess the validity of the measurement and the data.
Determine subscriber growth over the forecast period
Subscriber growth is typically projected on a month–to–month basis, andis provided by the operator’s marketing department. However, in theabsence of such market projections, subscriber growth can beapproximated from existing baseline data if the number of subscribers inthe baseline period is known. The following technique describes how tocalculate subscriber growth in this scenario:
1. Divide the average busy period traffic value by the number ofbaseline subscribers to arrive at the average busy period trafficintensity per subscriber (xb / Nb).
2. Calculate a three–sigma value by adding three standard deviations ofthe daily average busy period standard deviation value at thebaseline date to the average, and then dividing by the number ofsubscribers.
(xb + 3sb) / Nb [EQ 1–4]
3. sb is the standard deviation of the daily busy period traffic value. Usethis to estimate an upper limit curve and an average curve ofutilization versus traffic for growth scenarios.
4. Calculate the future offered average busy period traffic level for eachgrowth date by multiplying the average busy period traffic intensityper subscriber by the number of subscribers for that date in themarket forecast.
x(i) = (xb / Nb) (Ni) [EQ 1–5]
5. Calculate the upper limit traffic growth curve to account for dailybusy period variances by multiplying the three–sigma average busyperiod per subscriber intensity levels by the number of subscribers atthat growth date.
x3s(i) = [(xb + 3s) / Nb] (Ni) [EQ 1–6]
1

General Capacity Engineering Strategy – continued
June 2001 1-17CDMA SC Products System Resource Guide (CSSRG)
6. Do this for each traffic growth date found in the variable “i”.
Derive traffic growth over the forecast period
Add the incremental average busy period traffic growth estimate for thatgrowth date to the baseline average busy period traffic growth value.Assume that the variance to average busy period ratio stays the same andcalculate the new daily standard deviation values for the growth point,with the following expression:
sb / xb = si / xi [EQ 1–7]
Where sb and xb are baseline standard deviation and average trafficvalues, respectively, for the busy period. xi and si are the new values forthe growth date. Therefore,
si = xi(sb / xb) [EQ 1–8]
Add three times the si value to the new average traffic value to estimatethe upper traffic busy period value. Perform this calculation for eachtraffic growth date.
Calculate the estimated future utilization
Using the above new average and three–sigma traffic values for thegrowth dates, calculate the future estimated network element utilizationfor each growth date by use of the utilization traffic sensitivity function,
U(x) = a +bx [EQ 1–9]
Where x is the estimated busy period traffic for each growth date.
Graph utilization versus growth for the forecast period
Draw a graph with the estimated utilization versus the growth traffic forthe average and upper three–sigma curve, including the baseline trafficvalues. Add the upper maximum specified limit to the plot and comparewith the growth trend curve. At this point, the technical analysis for thenetwork element under study has been completed.
Assess the validity of the measurement and the data
A premise underlying the validity of the capacity engineering frameworkis that the measurement and statistical analysis of current cellular traffic,and the network element average utilization traffic sensitivity parameterscalculated in the baseline, provide a reasonable basis for estimatingfuture network utilization under traffic growth conditions. This actuallyrelies on the two assumptions:
� Traffic pattern
� Traffic sensitivity.
1

General Capacity Engineering Strategy – continued
CDMA SC Products System Resource Guide (CSSRG) June 20011-18
Traffic Pattern
The capacity engineering framework assumes that the current statisticalcharacteristics are scalable to estimate future statistical values. Oneexample of a scalable characteristic is the average number of callattempts in the busy period. The future average number of call attempts(CA) at a calendar date, T, is the current average CA multiplied by somegrowth factor, g, raised to the number of growth periods, k, from now toT. This relationship is expressed by the equation.
CA(T) = CA(now) * (1 + g)k [EQ 1–10]
Another example is the daily variance around the busy period averagefor a traffic variable which is also assumed to be scalable by the growthfactor squared, for example, (1+g)2k. A third example under thisassumption is that the average proportion of soft handoffs to total callattempts for a CBSC would remain the same.
For cases where load is determined by multiple traffic variables, anassumption is made that the average proportions of all traffic eventoccurrences is constant. In turn, the statistical characteristics of thetraffic event pattern are also assumed to remain constant.
Changes in the average pattern can be ignored if thespecific direction of change does not significantly affectthe network element’s utilization.
NOTE
Traffic Sensitivity
Assume that the method of least squares provides an acceptable means toestimate traffic sensitivity parameters for a network element given thatthese parameter values remain constant over the growth estimationperiod. Also assume that the network element technology, the software,and the statistical characteristics of the traffic pattern remain the samethroughout the growth estimation period.
This latter assumption is necessary to simplify the sensitivity modelfrom a multivariable model to a univariate model. Some deviations inthe average traffic pattern are acceptable, for the same reasons mentionedpreviously, since the deviations being considered do not significantlyaffect network utilization and, therefore, won’t affect the trafficsensitivity parameter values.
Identify current and future network elements that exceed, or willexceed, the maximum specified utilization limits
The following analyzes the growth line curves from the ForecastUtilization topic and determines whether this network element exceedsthe maximum specified operating limits in the growth projection period.Those elements that exceed their maximum limits are consideredbottlenecks. The following generic steps can be followed for eachnetwork element:
1

General Capacity Engineering Strategy – continued
June 2001 1-19CDMA SC Products System Resource Guide (CSSRG)
� Overlay performance categories onto the trend line map constructed inthe Forecast Utilization topic.
� Identify network elements where, during the analysis period, the trendline is in the highest category; these elements are the bottleneck(s).
� Prioritize bottlenecks according to level of severity versus time. Thisstep provides a first–pass schedule for addressing each bottleneck inturn.
Overlay performance categories onto the trend line map
A general guideline for performance categories is 25% increments alongthe vertical axis. Each category indicates a level of urgency (from lowestto highest) associated with the time the growth trend line enters thecategory. These levels of urgency help in identifying elements that needimmediate, continuous attention (>75% utilization) versus those thatneed less attention (< 50% utilization).
An alternate guideline for performance categories is to establish aplanning limit and a maximum limit increment along the vertical axis tocreate three category regions. In this case, each category region wouldrepresent a stoplight level of urgency associated with the time the growthtrend line enters the category region. The green region would represent alow level of urgency and the network element usage would range fromlow usage up to the planning limit. The yellow region would represent amoderate level of urgency and the network element usage would rangefrom the planning limit to the maximum limit. Finally, the red regionwould represent a high level of urgency and the network element usagewould be greater than the maximum limit.
Recommended maximum operating limits for processing equipmentshould be available from the vendor. By default, the maximum operatinglimit on any processor is 100% utilization. The rule–of–thumb thresholdfor processor operation is 70%, 80%, or 90% utilization for themaximum limit of the processor. This figure varies depending on theprocessor’s configuration and application. Maximum operating limits forlinks is the maximum data bandwidth for the link. The rule–of–thumbthreshold for link utilization is 80% for maximum carried load but, aswith processors, this figure varies depending on configuration andapplication. A general rule–of–thumb threshold for a planning limit forany network element (in other words, processor or link) is typicallyaround 80% of the previously established maximum operating limit (inother words, the processor maximum limit = 85% utilization, theplanning limit = 0.8*85 = 68% utilization). The planning limit figuremay also vary depending on the configuration and application of theparticular network element under investigation.
Identify network elements where, during the analysis period, the trendline is in the highest category
Each network element is reviewed to determine at what level ofutilization it is operating. Along with the utilization levels identified inthe previous section, one can also determine if there is any traffic beingshed or blocked due to the limited resources. Those network elements
1

General Capacity Engineering Strategy – continued
CDMA SC Products System Resource Guide (CSSRG) June 20011-20
which are already shedding and not allowing new traffic are consideredbottlenecks. If corrective action is taken for this network element, thenadditional capacity for the system is allowed until the next bottleneckoccurs. Those elements operating near the recommended maximum limitprocessor utilization are not bottlenecks at the moment but will becomebottlenecks to the traffic growth that they control in the near term.
Prioritize bottlenecks according to level of severity versus time
In prioritizing the bottlenecks, various aspects need to be considered.Each market may have different strategies for determining whichnetwork element to address first. The following are some different itemsto be considered as an aid in the prioritizing process:
� Amount of Traffic Served by the Given Network Element
For instance, assume there are two network elements that are very nearcapacity and that one of the network elements impacts only a smallpercentage of all users whereas the other network element impacts alarger percentage of users. The network element that impacts the largersubscriber base would offer the best improvement to the system if itsbottleneck is removed.
� Effort Needed to Remedy the Bottleneck
If the remedy to relieve the bottleneck is easy to accomplish, from animplementation standpoint, this procedure should be prioritized abovea more time consuming option. An example is the installing a singlenew card.
� Avoidance of the Domino Effect
The network elements are implemented in a hierarchal architecture (inother words, the traffic from lower level elements flow into higherlevel elements). Correcting a bottleneck in a lower level networkelement increases the traffic at a higher level element. The SystemsEngineer should investigate the impact on the higher level element ifthe lower element bottleneck is removed. It is possible that removingthe lower level bottleneck will place an excess burden on the higherlevel element. If this is the case, it is highly advisable to improve thecapacity of the higher level element prior to removing the lower levelbottleneck. This ties back to the first bullet on trying to minimize theamount of traffic that encounters a bottleneck.
� Lead–time for the Relief Measure
The Systems Engineer needs to keep in mind the amount of timerequired to order, install, and optimize the new network element. Agiven network element may appear to have plenty of capacityavailable now, but if the time factor is considered, it is possible thatthis network element becomes a bottleneck prior to the new equipmentgetting installed.
Evaluate relief alternatives
The following examines relief for the network elements exceeding theirlimits as identified in the Identify Network Elements Exceeding Limitstopic. Each bottleneck element is evaluated individually for the various
1

General Capacity Engineering Strategy – continued
June 2001 1-21CDMA SC Products System Resource Guide (CSSRG)
relief mechanisms available for that element. After the individual reliefpossibilities are determined, a network–wide relief plan can be devised.Generic guidelines for evaluating relief alternatives are as follows:
� Determine suitable capacity relief mechanisms for each bottleneck.
� Evaluate and note the anticipated effect of relief of one networkelement on the other elements in the network (for example, willupgrading a processor just move the bottleneck to the other end of thelink?).
Providing capacity relief to a bottleneck shifts thebottleneck to a different element. Within a network, therewill always be a limiting element.
NOTE
While describing specific relief mechanisms is beyond the scope of thischapter, this step provides an interface point between capacityengineering and network planning. Network planning processes shouldcome into play in cases where the network’s topology changes (forexample, adding a new network element) to effect capacity relief.
Capacity Relief Mechanisms
Some reasons why a network element has reached its limit include:
� Suboptimal traffic distribution across network elements
� Higher traffic intensities for certain traffic components than wereoriginally expected
� Insufficient capacity configuration of the network element subsystems
� Faulty equipment or inappropriate parameter settings.
A typical sequence of capacity relief steps to consider for a networkelement is:
� Ensure that the network element is functioning properly
� Decrease traffic to network element
� Rebalance traffic to network elements
� Increase capacity of limiting network element
� Increase network capacity by adding network elements.
The case of adding network elements indicates a change in networktopology. At this point, the capacity engineering study becomes part of abroader network planning study.
Network Efficiency
One reason that a network has reached its capacity limit is that certainproportions of traffic are handled by multiple network elements and, assuch, the overall potential network capacity is limited. In thesesituations, it may be possible to provide capacity relief by networkstructure modifications, by rerouting traffic, or by rebalancing the
1

General Capacity Engineering Strategy – continued
CDMA SC Products System Resource Guide (CSSRG) June 20011-22
offered traffic to network entry elements. In this latter case, no addednetwork elements or additional capacity is required, but only rebalancingof the mapping of offered traffic to the network elements. A capacityengineering effort therefore not only identifies current limiting networkelements, but also the mapping between offered traffic and the networkelement carried traffic. This aids the investigation of any capacity reliefalternatives at the network level.
A periodic review of the mapping of offered traffic to network elementcarried traffic and respective network element utilization should beperformed to determine the network resource capacity usage efficiency.The highest efficiency occurs when uniform increases in network offeredtraffic result in uniform increase of network resource utilization andwhen, on average, the network elements utilization are at similarpercentages of their maximum capacity. There are many reasons whythis ideal is not possible. Some include nonuniform traffic distributionthrough the network, uneven offered traffic levels at different networkentry points, and different busy periods during the day for differentregional traffic sources.
Assumptions Regarding Traffic Distribution
When evaluating the effect of projected traffic load on the currentnetwork, an assumption is made that the distribution (routing) of theprojected traffic is similar to the distribution of the measured baselinetraffic. However, adding network elements, whether these elements arenew or similar to existing elements, requires that the traffic distributionbe re–evaluated.
As projected traffic load is forecasted, it is typicallyassumed that all network elements experience the samepercentage increase. In fact, it is very likely that one regionexperiences a higher percentage of traffic load than anotherregion. This produces a different loading effect on thosenetwork elements supporting the two different regions.
NOTE
Adding Similar Network Elements
When similar network elements are added, traffic is typicallyredistributed to balance the load between similar network element types.In this case, an assumption can be made that the new network elementadded will have the same traffic sensitivity parameters as the average ofthe current network elements of this type.
Adding New Network Elements
When new network element types are added, additional traffic may occuron the existing network elements that did not experience this trafficbefore. This change may then impact the overall network traffic pattern.In this situation, an investigation would have to be made for eachnetwork element to determine whether the new traffic that is generated
1

General Capacity Engineering Strategy – continued
June 2001 1-23CDMA SC Products System Resource Guide (CSSRG)
by the new network element type could be carried by the existingnetwork elements that support it.
In addition, it needs to be determined if a significant change to thecarried traffic pattern and/or the traffic sensitivity parameters results. Ifthe traffic variable associated with the new traffic does not have adominant effect on the network element utilization, then the previousbaseline traffic sensitivity parameters can be utilized with confidence. Ifthe traffic variable is a dominant traffic variable for this networkelement, the new traffic has to be added to this traffic element. It doesnot necessarily mean that the traffic sensitivity parameters would changeif the dominant variable is significantly dominant compared to the otherdominant traffic variables.
Implement appropriate relief alternative(s)
The following establishes schedules and contingencies for the reliefmechanisms decided in the Evaluate Relief Alternatives topic. Genericguidelines for implementing relief mechanisms are as follows:
� If relief includes enhancing elements, determine availability of newequipment.
� For any relief mechanism, determine length of time needed toimplement change.
� Identify dates for scheduling the changes.
� Identify backup plans for schedule changes.
� Make changes according to schedule.
Making any change to the network requires re–evaluationof the processes established in the first five steps of thestrategy. Therefore, it is recommended to make changes tothe process concurrently with changes in the physicalnetwork.
NOTE
1

General Capacity Engineering Strategy – continued
CDMA SC Products System Resource Guide (CSSRG) June 20011-24
Notes
1

June 2001 CDMA SC Products System Resource Guide (CSSRG)
Chapter 2: Centralized Base Station Controller (CBSC)
Table of Contents
Centralized Base Station Controller (CBSC) 2-1. . . . . . . . . . . . . . . . . . . . . . . . . . . Introduction 2-1. . . . . . . . . . . . . . . . . . . . . . . . . . . . . . . . . . . . . . . . . . . . . .
Mobility Manager (MM) 2-2. . . . . . . . . . . . . . . . . . . . . . . . . . . . . . . . . . . . . . . . . . Introduction 2-2. . . . . . . . . . . . . . . . . . . . . . . . . . . . . . . . . . . . . . . . . . . . . . Mobility Manager (MM) Overload Control 2-5. . . . . . . . . . . . . . . . . . . . . Overload Reporting 2-13. . . . . . . . . . . . . . . . . . . . . . . . . . . . . . . . . . . . . . . . Integrity Report 2-14. . . . . . . . . . . . . . . . . . . . . . . . . . . . . . . . . . . . . . . . . . .
Transcoder Subsystem (XC) 2-18. . . . . . . . . . . . . . . . . . . . . . . . . . . . . . . . . . . . . . . . Introduction 2-18. . . . . . . . . . . . . . . . . . . . . . . . . . . . . . . . . . . . . . . . . . . . . .
CBSC Capacity Planning 2-22. . . . . . . . . . . . . . . . . . . . . . . . . . . . . . . . . . . . . . . . . . Introduction 2-22. . . . . . . . . . . . . . . . . . . . . . . . . . . . . . . . . . . . . . . . . . . . . .
CBSC Capacity Management Options 2-30. . . . . . . . . . . . . . . . . . . . . . . . . . . . . . . . Introduction 2-30. . . . . . . . . . . . . . . . . . . . . . . . . . . . . . . . . . . . . . . . . . . . . .
CBSC Capacity Monitoring 2-58. . . . . . . . . . . . . . . . . . . . . . . . . . . . . . . . . . . . . . . . Introduction 2-58. . . . . . . . . . . . . . . . . . . . . . . . . . . . . . . . . . . . . . . . . . . . . .
2

Table of Contents – continued
CDMA SC Products System Resource Guide (CSSRG) June 2001
Notes
2

Centralized Base Station Controller (CBSC)
June 2001 2-1CDMA SC Products System Resource Guide (CSSRG)
Introduction
The Centralized Base Station Controller (CBSC) is a part of a BaseStation System (BSS) and is made up of the following two elements:
1. Transcoder Subsystem (XC)
2. Mobility Manager (MM).
The CBSC controls the following functions:
� BTS cluster control
� Switching
� Traffic concentration
� Transcoding.
When doing growth planning for the CBSC, the first item that must bedetermined is the capacity limit of the CBSC. Because the Transcodercan be equipped in many different configurations and the MMprocessing capacity is highly dependent on the call model a SystemEngineer needs to establish a set of individual CBSC capacity limits foreach and every CBSC of an entire system.
In order to determine the capacity limit of a CBSC, the engineer needs todetermine the individual capacity limits of the MM and the XC, andidentify which one of the two elements is the limiting factor.
The following sections describe the Transcoder Subsystem (XC) and theMobility Manager (MM), their components, and how they function.
The information provided in this chapter also applies to aWireless Access Manager (WAM) of a Wireless LocalLoop (WiLL) system.
NOTE
2

Mobility Manager (MM)
CDMA SC Products System Resource Guide (CSSRG) June 20012-2
Introduction
The Mobility Manager (MM), which provides the radio managementfunction for the CBSC, is connected to the:
� Operations and Maintenance Center – Radio (OMC–R) through anEthernet link
� Transcoder Subsystem (XC) through a Control Link
� Mobile Switching Center (MSC) via an A+ data link.
The MM manages all of the call processing activities for all of the BTSsunder its control. This causes the capacity of the MM to be highlydependent upon the Call Model Performance of the system.
Limiting Factors
CPU processing capacity is the limiting factor of the MM. TheCBSC/OMC–R Equipment Planning Guide recommends a 70% MMCPU utilization planning limit. It also recommends that the MM notexceed a maximum limit of 85% CPU utilization for a sustained periodof time.
The current recommendation is to correlate the CPU utilization to carriedErlang traffic, and establish a set of maximum and planning Erlanglimits for the MM. Correlating Erlang traffic to CPU utilization takesinto account the Call Model Performance of the system, which can bedifferent from system to system, as well as from MM to MM within asystem.
Use the following approach to determine a planning Erlang limit and amaximum Erlang limit for the MM. Use this approach with any type ofMM (in other words, any Helix or PUMA type).
The recommended approach to project the Erlang capacity of the MM isto use the following generic Erlang capacity projection equation.
Erlang Limit Equation = (Util_Limit – Base_Util)/(BBH_SAR_Util – Base_Util) * BBH_Erlangs [EQ 2–1]
Where:
Util_Limit is equal to Chosen MM CPU Utilization limit (70% or85%)
Base_Util is equal to CPU Utilization that doesn’t scale with callprocessing traffic (3%)
BBH_SAR_Util is equal to Measured BBH CPU Utilization from theSAR Utility
BBH_Erlangs is equal to Measured BBH Erlangs from theMM_UTIL_PERIOD SQL script.
The SAR utility and the MM_UTIL_PERIOD script are described infollowing topics.
2

Mobility Manager (MM) – continued
June 2001 2-3CDMA SC Products System Resource Guide (CSSRG)
Use the above generic equation, EQ 2–1, to establish a Maximum ErlangLimit by projecting to a 85% MM utilization which produces thefollowing equation:
Maximum Erlang Limit = (82)/(BBH_SAR_Util – 3) * BBH_Erlangs [EQ 2–2]
Also use the generic equation, EQ 2–1, to establish a Planning ErlangLimit by projecting to a 70% MM utilization which produces thefollowing equation:
Planning Erlang Limit = (67)/(BBH_SAR_Util – 3) * BBH_Erlangs [EQ 2–3]
Since it is typical to size the MM for peak system usage, it’srecommended to analyze the performance of the MM during theBouncing Busy Hour (BBH) for a particular MM. Since the call modelperformance of a system can vary throughout the day, it’s important toanalyze the MM performance with a typical call model performanceduring the BBH. As a result, the MM capacity equations utilize BBHdata to project the Maximum and Planning Erlang limits.
The measured Erlang data that’s recommended to use for the MMcapacity equations comes from the MM_UTIL_PERIOD SQL scriptwhich is designed to estimate MM utilization from existing PerformanceMeasurement (pmC) traffic peg counts. This script was created by aSuperCell System Performance group in order to understand the networkloading and provide an accurate account of all of the significant callprocessing events. It uses pmC peg counts from the Relational DataBaseManagement System (RDBMS) database and applies a softwarerelease–dependent set of work load model algorithms to estimate theutilization for the individual call processing events. The Erlangcalculation that the SQL script performs is as follows:
BBH_Erlangs = (peg_count_3 of pmC_71_hr) / 1800 [EQ 2–4]
OR
BBH_Erlangs = (peg_count_4 of pmC_51_hr) / 1800
Since the data is provided in half hour increments, the data analysisperiod used for the MM capacity equations is 30 minutes. In the absenceof the SQL script being set up to collect the data, the same Erlang datacan be produced from the Transcoder Channel Group Report(pmC_71_hr) by using the following calculation for a 30 minute datasample on a per–CBSC basis:
BBH_Erlangs = (Group Usage from Transcoder Channel Group Report) / 30 [EQ 2–5]
The data in the RDBMS database, from which the SQLscript gets its data, is stored in seconds. The Group Usagedata displayed from the Transcoder Channel Group Reportis derived from the same peg count source but it isdisplayed in minutes.
NOTE
2

Mobility Manager (MM) – continued
CDMA SC Products System Resource Guide (CSSRG) June 20012-4
The System Activity Report (SAR) data comes from a Tandem UNIXutility which monitors processor utilization and records CPUmeasurement data in ten minute intervals. There are four fields of dataprovided for each ten minute interval:
� %usr
� %sys
� %wio
� %idle.
Since the data analysis period is 30 minutes, it is recommended to takethree or four “%idle” data points for the particular half hour in questionand average them together. Subtract this from 100 to get an average MMutilization for that half hour time period:
BBH_SAR_Util = 100 – (Avg “%idle” from SAR for half hour time period) [EQ 2–6]
To determine the maximum MM capacity, use the 30 minute BBHErlang data from the SQL script along with the 30 minute BBH averagedSAR data (for the same time period as the Erlang data) and plug it intothe Maximum Erlang Limit equation, EQ 2–2, to get one data point forthe analysis. Repeat the above calculations in order to obtain 40 datapoints which can be averaged together to establish the resultantMaximum MM Erlang Limit. The 40 data points come from four weeksworth of data under the following constraints:
� Only BBH data is used
� Two 30 minute data points per BBH per day
� Use the five busiest days of the week
� Exclude any data that is anomalous (in other words, partial orobviously bad data)
� Exclude any data that does not conform to normal traffic patterns (inother words, holidays, weekends, outages, etc.).
The minimum recommended data set sample is 20 data points from twoweeks worth of data. However, the four week sample is preferred.
Use the above process to determine the MM planning limit. The onlydifference is that the Planning Erlang Limit equation, EQ 2–3, is usedinstead of the Maximum Erlang Limit equation, EQ 2–2.
Contact Motorola System Engineering for further assistance indetermining MM capacity limits.
Determining Utilization
The MM has the standard Unix System Activity Report (SAR) utility,which provides measured CPU utilization. Refer to the Unix Manual(Man) page for more details on the usage and format of the SAR utility.The data is available on the MM and is typically transferred off–platformon a regular basis for further processing and storage of the data.
Planning Limits
As shown in the CBSC/OMC–R Equipment Planning Guide (EPG), theMM CPU utilization planning limit is 70% and is not to exceed 85% fora sustained period.
2

Mobility Manager (MM) – continued
June 2001 2-5CDMA SC Products System Resource Guide (CSSRG)
Refer to the previous Limiting Factors section and the following CBSCCapacity Planning section for more information regarding PlanningLimits.
Symptoms of Resource Overload
There are two alarms that are triggered by the MM overload algorithm:
� Capacity Overload
� Admission Rate Overload.
In addition, there is a periodic report, called the Integrity Report, whichshows current and high water levels for the Capacity and AdmissionRate counters.
Mobility Manager (MM)Overload Control
Admission Rate Overload Control
Admission Rate Overload Control limits the rate at which the CBSCaccepts Call Processing work (in other words, mobile originations,mobile terminations, page requests from the MSC, mobile registrations).
Admission rate is calculated by assigning a WEIGHT to each type ofCall Processing request. This weight is based on how much CPU unittime this particular request takes on average including future externalhandovers. There are weights for:
� Mobile originations
� Mobile terminations
� Page requests from the MSC
� Mobile registrations
� Authentication and Feature Delivery (AFD) messages.
Each time one of these requests is processed, the weight for that action isadded to the appropriate rate counters. There are three Admission Ratecounters:
� Call Admission Rate Counter
This counter is increased by the appropriate weight for limiting mobileorigination/termination requests.
� Registration Admission Rate Counter
This counter is increased by the appropriate weight for limitingregistration requests.
� Aggregate Admission Rate Counter
This counter is increased by the appropriate weight for limiting:
– Mobile origination/termination requests
– Registration requests
– Page requests from the MSC
– AFD messges.
2

Mobility Manager (MM) – continued
CDMA SC Products System Resource Guide (CSSRG) June 20012-6
Every second the Admission Rate Counters are decremented by theappropriate Decrement Step Value. This allows additional requests to behandled every second. The Admission Rate Thresholds prevent theCBSC from accepting too much work in a one second timeframe. By notzeroing out the Admission Rate Counters every second, and using theDecrement Step instead, causes the Admission Rate checks to accountfor work already accepted in the previous second. This decrement stepapproach allows the Overload Feature to allow short bursts but is smartenough to detect a continuous overload condition by allowing less workin if the CBSC is overloaded.
Originations, page acknowledgements, pages, AFD messages, andregistrations each have an individual weight associated with them.Whenever work of these types is accepted into the system, their weightsare added to running counters. The running rate counters are maintainedby periodically (every second) decreasing each by a configurableamount, as demonstrated in Figure 2-1.
Figure 2-1: Admission Rate Control Non–Overload Condition
Weight
1 second
AdmissionThreshold
DecrementStep
interval
These counters are then continuously compared against overloadthresholds. When a threshold is exceeded, additional work is rejectedand alarms set. The counters continue to be decreased every second,potentially allowing new work to be admitted into the system whileexisting processes are in progress and being completed. Although thecounter may drop below the threshold limit, the alarm itself won’t clearuntil the running counters have been continuously below the admissionthresholds for a recent changeable number of consecutive one secondperiods. See Figure 2-2.
2

Mobility Manager (MM) – continued
June 2001 2-7CDMA SC Products System Resource Guide (CSSRG)
Figure 2-2: Admission Rate Control Overload Condition
Weight
1 second
AdmissionThreshold
DecrementStep
interval
AlarmSet
AlarmPersists
Reject
The Rate Alarm Clear Interval is used by all Admission Rate checks andis used to clear the Admission Rate Overload Alarm. This parameterspecifies how many consecutive one second intervals that the specifiedrate counter must stay below the rate threshold before clearing the alarm.
Parameterization
Before demonstrating how to successfully incorporate rate overloadparameters into the call processing flow, it is necessary to first define allof the involved parameters. In order to display the current systemsettings, execute the following command from an OMC–R CLI session:
OMCR > display cbsc–x rateovld (where x = cbsc number)
INFO:1 “Command Received and Accepted”COMMAND=“DISPLAY CBSC–4 RATEOVLD”
AFDCBSC ORIG PAGEACK REG PAGE CALL CALL REG REG AGG AGG CLR SHED AFD DIST# W W W W DEC T DEC T DEC T INTERVAL PAGE W W–––– –––– ––––––– ––– –––– –––– –––– ––– ––– ––– –––– –––––––– ––––– ––– ––––4 106 116 6 13 800 5040 250 416 800 5040 60 Y 2 2
ORIG W Origination Weighting Factor
This is also referred to as OrigWeight. This factor is the estimatedaverage CPU time (in milliseconds) the MM spends on onemobile–to–land call, including handoffs during the call. The averaging isdone over all mobile–to–land calls, both successful and failed.
PAGEACK W Page Acknowledgement Weighting Factor
This is also referred to as PageAckWeight. This factor is the estimatedaverage CPU time (in milliseconds) the MM spends on oneland–to–mobile call, including handoffs, after a page acknowledgementis received from the BTS (the time spent on the page itself is excluded).
2

Mobility Manager (MM) – continued
CDMA SC Products System Resource Guide (CSSRG) June 20012-8
REG W Registration Weighting Factor
This is also referred to as RegWeight. This factor is the estimatedaverage CPU time (in milliseconds) the MM spends on one registration.
PAGE W Page Weighting Factor
This is also referred to as PageWeight. This factor is the estimatedaverage CPU time (in milliseconds) the MM spends on one page.
CALL DEC Call Decrement Amount
This is also referred to as CallDecStep. This is the amount decrementedfrom the call admission rate counter on a periodic (one–second) basis.
CALL T Call Denial Threshold
This is also referred to as CallAdmThld. This threshold is used todetermine when new call requests into the CBSC shall be denied. A callrequest will be denied if the call admission rate counter is greater than orequal to CALLT when an origination or page acknowledgement arrives.
REG DEC Registration Decrement Amount
This number is also referred to as RegDecStep. This number is theamount decremented from the registration admission rate counter on aperiodic (one–second) basis.
REG T Registration Denial Threshold
This is also referred to as RegAdmThld. This threshold is used todetermine when new registration requests into the CBSC shall be denied.A request will be denied if the registration admission rate counter isgreater than or equal to REGT when a registration arrives.
AGG DEC Aggregate Decrement Amount
This is also referred to as AggDecStep. This number is the amountdecremented from the aggregate call processing admission rate counteron a periodic (one–second) basis.
AGG T Aggregate Denial Threshold
This is also referred to as AggAdmThld. This threshold is used todetermine when new call processing requests into the CBSC shall bedenied. A request is denied if the aggregate admission rate counter isgreater than or equal to AGGT when a new request (origination, pageack, registration or page) arrives.
CLR INTERVAL Clear Interval
This is the number of consecutive one–second intervals that must elapsewith the rate counters below their corresponding threshold values beforethe overload alarm will be cleared. An alarm will not clear until theassociated count is below the threshold for the full interval period.
2

Mobility Manager (MM) – continued
June 2001 2-9CDMA SC Products System Resource Guide (CSSRG)
SHED PAGE Page Message Shedding
This field specifies whether page messages from the MSC should bediscarded when call shedding is in effect from exceeding the aggregateadmission threshold.
AFD W Authentication and Feature Delivery WeightingFactor
This factor is the estimated average CPU time (in milliseconds) the MMspends on one authentication and feature delivery message.
AFD DIST W Authentication and Feature Delivery DistributedWeighting Factor
This factor is the estimated average CPU time (in milliseconds) the MMspends on one authentication and feature delivery message in distributedmode.
The decrement steps (CallDecStep, RegDecStep, AggDecStep) set thelimits on the average rate at which different types of call processingactivities the Mobility Manager admits. Since each process (origination,page acknowledgement, registration, AFD, and page) has its ownassociated weight value, the decrement steps in effect determine how theload is accepted into the system. The admission threshold parameters(CallAdmThld, RegAdmThld, AggAdmThld), aside from setting themaximum allowable work on the system, also function to manage howbursts of activity are controlled. Using RegAdmThld as an example, themaximum number of registrations contained in a burst that is recognizedby the MM is RegAdmThld/RegWeight (assuming that the counters areinitially set at zero). From then on, the Mobility Manager acknowledgesexactly RegDecStep/RegWeight registrations per second.
Decrement steps, as previously explained, establish the rate at whichcall–related processes are accepted as load into the MM. These valuesare also a representation of what is the maximum desired call processingCPU utilization on the Mobility Manager.
The following formula demonstrates how to determine the value forAggDecStep:
AggDecStep = maximum desired CPU utilization* – overhead utilization*
Where utilization values are represented as the percentage utilization,multiplied by 1000.
For example, using 85% as the total maximum utilization and reserving5% for various overhead, non–call processing related activities on theMM, then:
AggDecStep = 850 – 50 = 800
In other words, AggDecStep is the maximum CPU load due to callprocessing that the Mobility Manager admits. It is a general rule to setboth AggDecStep and CallDecStep (AGG DEC and CALL DEC) to thesame values. To explain this theory, remember that call admission
2

Mobility Manager (MM) – continued
CDMA SC Products System Resource Guide (CSSRG) June 20012-10
threshold (CALL T or CallAdmThld) is a measure of the number oforiginations and page acknowledgements that come into the system.Aggregate admission rate threshold (AGG T or AggAdmThld)encompasses ALL call processing entities. In order to allow the mostemphasis to be placed on actual call activity (originations andterminations), the values for the aggregate variables should equal what iscalculated for the call–only parameters. This allows the maximumnumber of possible calls through the system. The flexibility of theAdmission Rate Overload feature offers the ability to lower the callvariables to allow for higher paging and registration activity.
One important distinction to make is that when the Admission RateOverload alarms have been triggered, causing some type of activity to berejected, the only work that is denied is NEW call processing requests.All existing, in–progress activities continue. For example, handoffrequests from the mobile are processed normally by the MM, andoperations and maintenance commands are still forwarded to and fromthe BTS devices. In other words, the purpose of properly setting andmaintaining the Admission Rate Overload parameters is to guaranteethat if/when an overload situation is encountered, current processes arepreserved.
Refer to the CBSC Capacity Monitoring section and Table 2–7 for moreinformation on the recommended settings and the monitoring of thesesettings.
Other CPU–Intensive Activities
Although Admission Rate Overload functions by using a representationof what the MM’s maximum desired call processing CPU utilizationshould be, it is important to remember that fluctuations in the actualutilization will not necessarily trigger the overload mechanism. In otherwords, the algorithm does not do any real–time measurements on actualMobility Manager CPU utilization. A System Activity Report (SAR) onthe MM may show utilization variances over the recommended 85%maximum usage, but these utilization spikes can also be attributed toother non–call processing related activities on the MM.
For example, every Mobility Manager has a cronjob set up (under userscadm) that monitors disk space on the MM. When usage reaches acertain threshold, large Supercell process files are cleared out in order tomaintain adequate disk space. BSS System Release 7 introducedimprovements to the Supercell process file storage procedure so that theactual amount of stored data is kept to a minimum but, under rarecircumstances, it is possible for the file system to fill up. When thishappens, CPU time is taken away from call processing and dedicatedtoward purging the overloaded files. This can potentially cause callprocessing queues to fill up so that when the file clearing is complete, aburst of pending, new call processing jobs comes into the MobilityManager. If the burst of activity is great enough, Rate Overload alarmsare “falsely” triggered whereas under normal circumstances the amountof activity is acceptable. Because other file and system maintenancecommands, such as compressing large data files, can also falsely triggerthe overload mechanism, exercise caution when using these commands.
2

Mobility Manager (MM) – continued
June 2001 2-11CDMA SC Products System Resource Guide (CSSRG)
Capacity Load Control
Capacity Load Control functions by monitoring the quantity ofconcurrent activities and determining whether accepting new callprocessing work (originations, page acknowledgements, or registrations)to the Mobility Manager exceeds allowable ceiling thresholds. Thenumber of current registrations and call counts are accumulated inrunning counters. Once the counters (individually or combined) exceedthe associated threshold or ceiling, new activity is rejected. When thein–progress workload decreases by an amount that allows new work intothe system without compromising the MM’s capabilities, work is againaccepted. Although shedding no longer occurs once counter values dropbeneath the ceiling and shedding threshold, alarms that are set due anoverload condition are not cleared until current counts are adequatelybeneath the alarm clear threshold. See Figure 2-3.
Figure 2-3: Capacity Control Example
AlarmClear
AlarmClear
Threshold
AlarmSet
Reject
Reject
Ceiling
Parameterization
As with Admission Rate Overload, Capacity Overload has its ownassociated parameters. To display the current settings, execute thefollowing command from an OMCR CLI session:
OMCR > display cbsc–x capovld (where x designates the cbsc number)
INFO:1 “Command Received and Accepted”COMMAND=“DISPLAY CBSC–1 CAPOVLD”
CBSC CALL CALL CALL REG REG REG SHED(cbsc) ACLR SCLR MAX ACLR SCLR MAX PAGE–––––– –––––– ––––– ––––– ––––– ––––– –––– –––––1 994 1024 1024 150 200 200 Y
Given that Capacity Overload is a more simplified procedure thanAdmission Rate Overload in that it measures the number of concurrentcalls (including both originations and terminations) and registrations, theparameter definitions can be combined since the process behaves thesame for both types of call activities.
2

Mobility Manager (MM) – continued
CDMA SC Products System Resource Guide (CSSRG) June 20012-12
CALL ACLR/REG ACLR Call/Registration Overload Alarm Clear
This is also referred to as Call/RegCeilingAClrT. This threshold clearsan overload alarm condition after the maximum allowable number ofconcurrent calls or registrations has been exceeded. The alarm, once set,persists until the current activity level drops below this clear threshold.
CALL SCLR/REG SCLR Call/Registration Shedding Clear
This is also referred to as Call/RegCeilingSClrT. This is the thresholdthat clears shedding after concurrent calls or registrations have exceededthe acceptable amount and new activity is being denied. Once the currentcounts fall below the callsclr/regsclr values, new work will again beaccepted into the system.
CALL MAX/REG MAX Call/Registration Maximum
This is also known as Call/RegCeiling. This is the maximum number ofsimultaneous calls or registrations allowed. Once this has beensurpassed, an alarm is set and new work is rejected.
SHED PAGE Page Message Shedding.
This field specifies whether or not page messages from the MSC arediscarded when call shedding is in effect from reaching the call–ceilingthreshold.
Capacity Overload parameters were designed, as Figure 2-3 shows, toalarm and start rejecting new work once the number of current callprocessing tasks surpass desired values. Once the activity levels fall backbelow the ceiling (shedding clear) thresholds, new calls and registrationswill again be admitted to the system. However, the alarm continues to beactive until the call processing operations are sufficiently beneath thealarm clear threshold values. This serves as a warning to the systemoperator that the CBSC is still running at higher than normal activitylevels. In order to make optimum use of the Capacity Overload feature,the following guidelines are observed:
� Set Overload Alarm Clear thresholds to less than or equal to theShedding Clear thresholds
� Set Call/Registration Maximum thresholds to greater than or equal tothe Shedding Clear values.
The current recommendation is to set the concurrent CALL parametersfor the Capacity Overload feature high enough to basically disable thisfeature from functioning. Utilize the Admission Rate Overload featureinstead. Therefore, set the Capacity Overload CALL parameters higherthan the maximum XC hardware capacity limit. A suggested rule ofthumb is to set it 20% higher than the maximum XC capacity limit.
For the registration REG parameters, the following settings arerecommended:
� REG MAX = 200
� REG SCLR = 200
2

Mobility Manager (MM) – continued
June 2001 2-13CDMA SC Products System Resource Guide (CSSRG)
� REG ACLR = 150.
For most situations involving registration activity, the Admission RateOverload feature will still most likely go into effect before the CapacityOverload feature can be triggered using the above recommendedsettings.
Finally, set the SHED PAGE parameter to Y to allow page messages tobe discarded if call shedding were to go in effect.
Overload Reporting
Admission Rate/Capacity Overload Alarms
When an Admission Rate/Capacity Overload threshold has beenexceeded and new call processing work is being rejected, the CBSC willstore statistics on what type and how much work was denied during theoverload period. These statistics are reported in two ways: through theAlarm Clear message written to the Event Log, and in the IntegrityReport automatically generated every ten minutes (also written to theEvent Log). Following are examples of the Aggregate Rate Exceededalarm and the associated Clear message.
CBSC–1 98–06–10 15:01:21 dot61 MM–1 A000000.00000 483895/245929** ALARM: 13–5172 “Admission Rate Overload: Aggregate Rate Exceeded”
ORIGINATIONS_DISCARDED=0 PAGE_ACKS_DISCARDED=0REGS_DISCARDED=0 PAGES_DISCARDED=0AFD_DISCARDED=0 AFD_ACK_DISCARDED=0
CBSC–1 98–06–10 15:03:13 dot61 MM–1 A000000.00000 483927/245984CLR ALARM: 13–5172 “Admission Rate Overload: Aggregate Rate Exceeded”
ORIGINATIONS_DISCARDED=3 PAGE_ACKS_DISCARDED=0 REGS_DISCARDED=8 PAGES_DISCARDED=3
AFD_DISCARDED=0 AFD_ACK_DISCARDED=0
There are three types of Admission Rate Overload alarms that can occur:
� Admission Rate Overload: Call Rate Exceeded
� Admission Rate Overload: Registration Rate Exceeded
� Admission Rate Overload: Aggregate Rate Exceeded.
There are also two types of Capacity Overload alarms that can occur:
� Capacity Overload: Call Ceiling Reached
� Capacity Overload: Registration Ceiling Reached.
The example above is for an Admission Rate Overload alarm where theAggregate Rate threshold was exceeded. All of the Admission RateOverload or Capacity Overload alarms will look similar to the exampleabove. The differences between the various alarms are the triggeringmechanisms that are used to set the alarm.
An active alarm’s corresponding clear indication (CLR displayed)includes statistics on work shed during the alarm period.
2
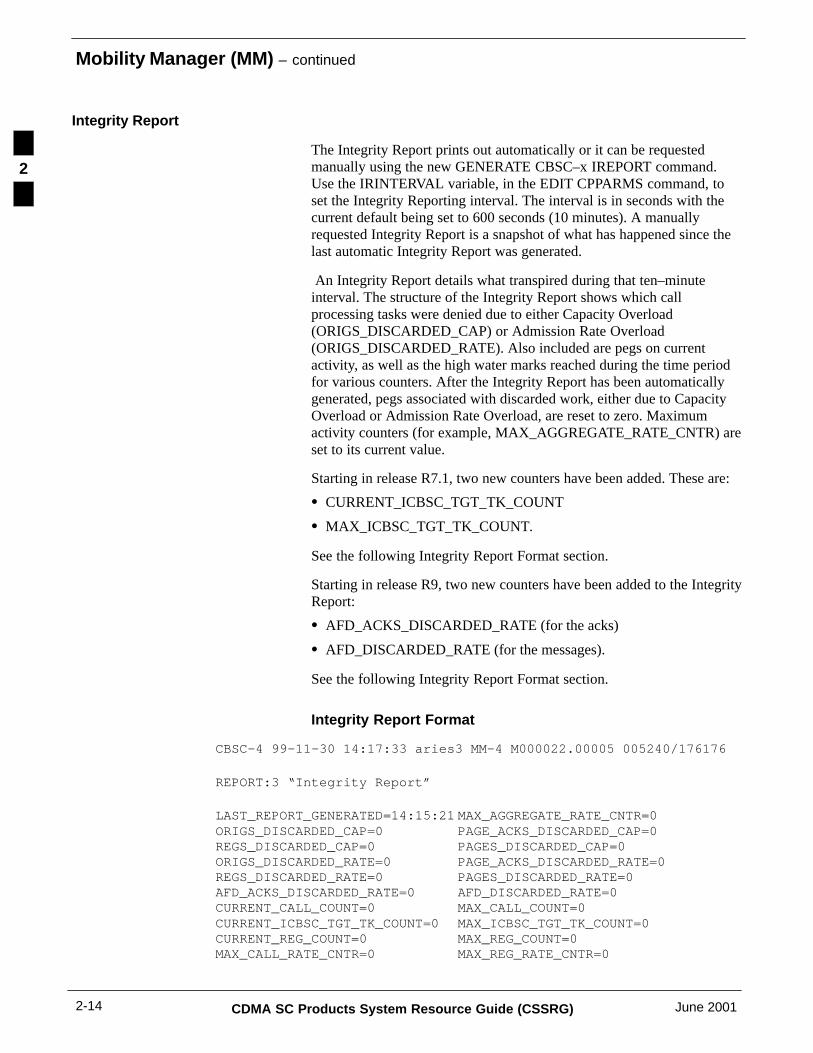
Mobility Manager (MM) – continued
CDMA SC Products System Resource Guide (CSSRG) June 20012-14
Integrity Report
The Integrity Report prints out automatically or it can be requestedmanually using the new GENERATE CBSC–x IREPORT command.Use the IRINTERVAL variable, in the EDIT CPPARMS command, toset the Integrity Reporting interval. The interval is in seconds with thecurrent default being set to 600 seconds (10 minutes). A manuallyrequested Integrity Report is a snapshot of what has happened since thelast automatic Integrity Report was generated.
An Integrity Report details what transpired during that ten–minuteinterval. The structure of the Integrity Report shows which callprocessing tasks were denied due to either Capacity Overload(ORIGS_DISCARDED_CAP) or Admission Rate Overload(ORIGS_DISCARDED_RATE). Also included are pegs on currentactivity, as well as the high water marks reached during the time periodfor various counters. After the Integrity Report has been automaticallygenerated, pegs associated with discarded work, either due to CapacityOverload or Admission Rate Overload, are reset to zero. Maximumactivity counters (for example, MAX_AGGREGATE_RATE_CNTR) areset to its current value.
Starting in release R7.1, two new counters have been added. These are:
� CURRENT_ICBSC_TGT_TK_COUNT
� MAX_ICBSC_TGT_TK_COUNT.
See the following Integrity Report Format section.
Starting in release R9, two new counters have been added to the IntegrityReport:
� AFD_ACKS_DISCARDED_RATE (for the acks)
� AFD_DISCARDED_RATE (for the messages).
See the following Integrity Report Format section.
Integrity Report Format
CBSC–4 99–11–30 14:17:33 aries3 MM–4 M000022.00005 005240/176176
REPORT:3 “Integrity Report”
LAST_REPORT_GENERATED=14:15:21 MAX_AGGREGATE_RATE_CNTR=0ORIGS_DISCARDED_CAP=0 PAGE_ACKS_DISCARDED_CAP=0REGS_DISCARDED_CAP=0 PAGES_DISCARDED_CAP=0ORIGS_DISCARDED_RATE=0 PAGE_ACKS_DISCARDED_RATE=0REGS_DISCARDED_RATE=0 PAGES_DISCARDED_RATE=0AFD_ACKS_DISCARDED_RATE=0 AFD_DISCARDED_RATE=0CURRENT_CALL_COUNT=0 MAX_CALL_COUNT=0CURRENT_ICBSC_TGT_TK_COUNT=0 MAX_ICBSC_TGT_TK_COUNT=0CURRENT_REG_COUNT=0 MAX_REG_COUNT=0MAX_CALL_RATE_CNTR=0 MAX_REG_RATE_CNTR=0
2

Mobility Manager (MM) – continued
June 2001 2-15CDMA SC Products System Resource Guide (CSSRG)
Integrity Report Definitions
LAST_REPORT_GENERATED
This field contains the time when this reporting interval was started. Allthe fields were reset at that time.
MAX_AGGREGATE_RATE_CNTR
This field contains the maximum value this counter reached during anyone second rate interval in this reporting interval. Evaluate this counteragainst the aggregate admission rate threshold (AGGT) setting.
ORIGS_DISCARDED_CAP
This field contains the total number of mobile origination requestsdiscarded during this reporting interval because of an OverloadCondition exceeding the Call Capacity limit.
PAGE_ACKS_DISCARDED_CAP
This field contains the total number of mobile termination requestsdiscarded during this reporting interval because of an OverloadCondition exceeding the Call Capacity limit
REGS_DISCARDED_CAP
This field contains the total number of mobile registration requestsdiscarded during this reporting interval because of an OverloadCondition exceeding the Registration Capacity limit.
PAGES_DISCARDED_CAP
This field contains the total number of page requests from the MSCdiscarded during this reporting interval because of an OverloadCondition exceeding the Call Capacity limit.
ORIGS_DISCARDED_RATE
This field contains the total amount of mobile origination requestsdiscarded during this reporting interval because of an OverloadCondition exceeding the Call or Aggregate Admission Rate limit.
PAGE_ACKS_DISCARDED_RATE
This field contains the total amount of mobile termination requestsdiscarded during this reporting interval because of an OverloadCondition exceeding the Call or Aggregate Admission Rate limit.
REGS_DISCARDED_RATE
This field contains the total amount of mobile registration requestsdiscarded during this reporting interval because of an OverloadCondition exceeding the Registration or Aggregate Admission Ratelimit.
2

Mobility Manager (MM) – continued
CDMA SC Products System Resource Guide (CSSRG) June 20012-16
PAGES_DISCARDED_RATE
This field contains the total amount of page requests from the MSCdiscarded during this reporting interval because of an OverloadCondition exceeding the Aggregate Admission Rate limit.
AFD_ACKS_DISCARDED_RATE
This field contains the number of authentication and feature deliveryacknowledgements discarded during this reporting interval because of anOverload Condition exceeding the Aggregate Admission Rate limit.
AFD_DISCARDED_RATE
This field contains the number of authentication and feature deliverymessages discarded during this reporting interval because of an OverloadCondition exceeding the Aggregate Admission Rate limit.
CURRENT_CALL_COUNT
This field contains the current number of mobile originations, mobileterminations, and external handovers in progress. Evaluate this counteragainst the capacity call parameter (CALLMAX, CALLSCLR,CALLACLR).
MAX_CALL_COUNT
This field contains the maximum number of concurrent mobileoriginations, mobile terminations, and handovers detected during thisreporting interval. Evaluate this counter against the capacity callparameters (CALLMAX, CALLSCLR, CALLACLR).
CURRENT_ICBSC_TGT_TK_COUNT
This field contains the number of active CDMA inter–CBSC softhandoff (trunking) target calls.
MAX_ICBSC_TGT_TK_COUNT
This field contains the high water mark of the number of active CDMAinter–CBSC soft handoff (trunking) target calls.
CURRENT_REG_COUNT
This field contains the current number of registrations in progress.Evaluate this counter against the capacity registration parameters(REGMAX, REGSCLR, REGACLR).
MAX_REG_COUNT
This field contains the maximum number of concurrent mobileregistrations detected during this reporting interval. Evaluate this counteragainst the capacity registration parameters (REGMAX, REGSCLR,REGACLR).
2

Mobility Manager (MM) – continued
June 2001 2-17CDMA SC Products System Resource Guide (CSSRG)
MAX_CALL_RATE_CNTR
This field contains the maximum value this counter reached during anyone second rate interval in this reporting interval. Evaluate this counteragainst the call admission rate threshold (CALLT) setting.
MAX_REG_RATE_CNTR
This field contains the maximum value that this counter reached duringany one second rate interval in this reporting interval. Evaluate thiscounter against the registration admission rate threshold (REGT) setting.
Reducing Utilization/Capacity Improvement
Refer to the following CBSC Capacity Management Options section forinformation on reducing utilization and capacity improvement.
Contact Motorola System Engineering for assistance in determiningCBSC capacity and the options available for reducing utilization/capacity improvements.
2

Transcoder Subsystem (XC)
CDMA SC Products System Resource Guide (CSSRG) June 20012-18
Introduction
The Transcoder Subsystem (XC), which performs speech encoding anddecoding for the Centralized Base Station Controller (CBSC), isconnected to the:
� Base Transceiver Station(s) (BTS)
� Mobile Switching Center (MSC)
� Mobility Manager (MM) through a Control Link
� Operations and Maintenance Center – Radio (OMC–R) through anOperations Manager Process (OMP) link
� Other CBSCs – for inter–CBSC soft handoffs.
The XC interfaces the CBSC with the Mobile Switching Center (MSC)and a BTS cluster. Key functions are provided by the following circuitcards:
� Transcoder (XCDR)
� Mobile Station Identifier (MSI)
� Generic Processor (GPROC).
The Kiloport Switch (KSW) and Kiloport Switch Extended (KSWX)equipment provides for switching between these three cards.
Limiting Factors
The processor utilization for all the various XC cards won’t be the XCbottleneck as long as a standard XC configuration is used, as stated inthe CBSC/OMC–R Equipment Planning Guide (EPG). However, thereare maximum hardware configurations which limit the port capacitywithin the XC (KSW/DSW switch matrix equipage) and the circuitcapacity to the MSC (XCDR card equipage).
The standard XC configurations are designed around supporting themaximum capacity allowed by the XCDR card equipage. As a result, themaximum capacity of a standard XC configuration is limited by themaximum number of XCDR cards that a particular configuration cansupport. Table 2-1 shows the maximum conversation Erlang capacities(calculated using Erlang B @ 0.1%) for the current set of standardconfigurations.
Table 2-1: Standard Transcoder Maximum and Planning Erlang Capacities
Cages XCDRs PerCage
Total XCDRs Total Circuits Maximumd
Erlang LimitPlanninge
Erlang Limit
4 4 16 384 338 304
4 5 20 480 429 386
4a 6 24 576 521 469
6 4 24 576 521 469
. . . continued on next page
2

Transcoder Subsystem (XC) – continued
June 2001 2-19CDMA SC Products System Resource Guide (CSSRG)
Table 2-1: Standard Transcoder Maximum and Planning Erlang Capacities
Cages Planninge
Erlang LimitMaximumd
Erlang LimitTotal CircuitsTotal XCDRsXCDRs Per
Cage
6 5 30 720 659 593
6a 6 36 864 798 719
6b 7c 38 912 845 761
8 4 32 768 706 635
8 5 40 960 891 802
8a 6 48 1152 1078 970
8b 7c 52 1248 1172 1054
10b 4 40 960 891 802
10b 5 50 1200 1125 1012
10b 6 60 1440 1359 1223
10b 7c 66 1584 1500 1350
12b 4 48 1152 1078 970
12b 5 60 1440 1359 1223
12b 6 72 1728 1641 1477
12b 7c 80 1920 1829 1646
NOTEa Available with R9.2 using DSWs without EGPsb Targeted for G15 using DSWs and EGPsc First four cages (0 – 3) have a limit of six XCDRs per caged Maximum Erlang limit calculated using Erlang B at 0.1%e Planning Erlang limit calculated to be 90% of the maximum limit
As new features become available to expand the capacity of the XC, theCBSC/OMC–R Equipment Planning Guide is updated with a new set ofstandard configurations so that the maximum number of XCDR cardssupported with the new configuration again determines the maximumXC capacity limit.
Determining Utilization
Obtain the total Erlang utilization of the XC for a given time period fromthe Transcoder Channel Group Report (which is derived frompmC_71_hr peg count 3). To determine the total Erlang utilization, addall the Group Usage time in minutes for all the various channel groupsfor a given time period. Then divide the total usage by the number ofminutes in the given time period. These channel groups are:
2
Transcoder Subsystem (XC) – continued
CDMA SC Products System Resource Guide (CSSRG) June 20012-20
� Voice
� Circuit data
� Low–speed packet data
� High–speed packet data.
The Erlang utilization can also be obtained from theMM_UTIL_PERIOD SQL script (as described in the Mobility Manager(MM) section).
Even though processor utilization is not the limiting factor if thestandard XC configuration is used, Generic Processor (GPROC)utilization can be measured via TTY port connections. In R9.0 and later,this utilization will be remotely accessible from the OMC–R.
Planning Limits
The recommended Planning Limit for the standard XC is 90% of themaximum Erlang Limit (see Table 2-1 for specific values). Use thePlanning Limit in a forecasted growth plan (if the XC is the limitingfactor of the CBSC) to determine when capacity relief mechanisms needto be implemented. If circuit and/or packet data hardware is equipped, anadditional level of planning for the voice and data Erlangs will benecessary.
Separate traffic engineering of the voice and data (circuit and/or packet)traffic usage of the XC must also be performed to properly maintain adesired Grade of Service for each service option. This is in addition tothe maximum and planning Limit engineering of the total voice and datausage.
Refer to the CBSC/OMC–R Equipment Planning Guide and the DataServices chapter of this guide for additional information regarding circuitand packet data planning limits and capacity planning guidelines.
The following are required for more detailed XC planning:
� Expected Erlang load at the CBSC for:
– Voice
– Data
– Inter–CBSC soft handoff
� Blocking probability at the MSC
� The ratio of Busy Hour Call Attempts (BCHA) to CBSC Erlangs
� Number of BTSs per CBSC
� Total number of BTS span lines at the CBSC
� Types of all span lines connected to the CBSC.
Refer to the CBSC/OMC–R Equipment Planning Guide (EPG) foradditional XC subsystem guidelines and information on PlanningLimits.
Symptoms of Resource Overload
Resource Overload can be detected by looking at the PM pegs forTerrestrial Circuit (TerCkt) blocking or from Transcoder Channel Group
2

Transcoder Subsystem (XC) – continued
June 2001 2-21CDMA SC Products System Resource Guide (CSSRG)
Overflows (pmC_71_hr peg count 2). The Call Failure Class (CFC) fieldin the Call Data Log (CDL) can also indicate failures.
Reducing Utilization/Capacity Improvement
Since the standard XC is considered to be hardware–limited by themaximum number of XCDRs supported, the following options areavailable to reduce utilization and increase capacity:
� Current utilization can be reduced, by reparenting some of the BTStraffic to other existing or new CBSCs/XCs (also refer to thefollowing section on CBSC Capacity Management Options).
� Depending upon the current software release, it may be possible toupgrade the standard XC configuration. This may allow more XCDRsper XC and thus increase the hardware capacity of the XC. Upgradesto the standard configuration consists of:
– Upgrade from KSW cards to DSW cards
– Upgrade from GPROC cards to EGP cards
– Upgrade from an 8 cage maximum to a 12 cage maximumconfiguration.
As new upgrades are provided with new software releases, newstandard configurations will be provided, which will increase thehardware capacity of the XC. Refer to the CBSC/OMC–R EquipmentPlanning Guide for the specific software release of a system todetermine the standard XC capacity options that are available.
Refer to the following CBSC Capacity Management Options section forinformation on reducing utilization and capacity improvement.
Contact Motorola System Engineering for assistance in determiningCBSC capacity and the options available for reducing utilization/capacity improvements.
2

CBSC Capacity Planning
CDMA SC Products System Resource Guide (CSSRG) June 20012-22
Introduction
The steps provided below are intended to provide a Systems Engineerwith a set of guidelines for CBSC capacity planning. It utilizes some ofthe strategies from the Six Step Capacity Engineering Strategy topic toperform capacity management planning. With a CDMA system, CBSCcapacity management planning and monitoring is required to beperformed on an ongoing basis.
Perform and analyze each of the following steps for each individualCBSC in a system:
1. Collect Data to Determine Capacity Limits
2. Determine Present Status
3. Forecast Utilization
4. Identify When Bottlenecks Will Occur
5. Evaluate Relief Alternatives
6. Implement Relief Mechanisms.
The analysis should typically forecast out in time, up to one to two yearsfrom the present date. Repeat the analysis on a periodic basis. Therecommended frequency of performing a growth planning exercise isquarterly, but the frequency can be increased or decreased dependingupon how fast the system usage grows.
Collect Data to Determine Capacity Limits
Determine the CBSC capacity by identifying the limiting factor betweenthe MM Erlang capacity limits and the standard XC Erlang capacitylimits. For most standard XC configurations, use Table 2-1 to determinethe XC Erlang capacity limits.
For a non–standard XC configuration, determine an estimate of the XCcapacity by adding up the total number of circuits provided by all of theXCDRs. Then, calculate the Erlang load that can be supported by thesecircuits using an Erlang B table with a 0.1% blocking Grade Of Service.This becomes the Maximum Erlang Limit. Calculate the Planning ErlangLimit by using 90% of the Maximum Erlang Limit. Since this is anon–standard XC configuration, these limits are an estimate of the truelimits. This is because it is not known if one of the processor may belimiting the XC to a lower limit. A more detailed procedure to determinethe XC capacity for non–standard configurations won’t be covered and isbeyond the scope of this guide.
Once the XC Erlang capacity limitations are determined, the next step isto collect the data to calculate the MM Erlang capacity limits. As statedearlier, the minimum recommendation is to collect two weeks worth ofdata but four weeks worth is preferred. Collect SAR data from the MMand Erlang data either from the MM_UTIL_PERIOD SQL script orderived from the Transcoder Channel Group Report (both of which arederived from the pmC_71_hr performance management peg count). Ifthe system supports voice and data, verify that voice, circuit data, and
2

CBSC Capacity Planning – continued
June 2001 2-23CDMA SC Products System Resource Guide (CSSRG)
packet data are recorded separately and totaled together in to the Erlangdata calculation.
For initial baseline measurements, the measurement interval forcollecting Erlang data should be large enough to capture the bouncingbusy hour for each MM. The SAR utilization data should be used todetermine the bouncing busy hour for each MM. The busy hour asdetermined from SAR utilization should typically match the busy hourfrom the Erlang data. If the bouncing busy hour from the two sources ofdata do not match, investigate the validatity of the data and/or validatethe performance of the MM.
Once the bouncing busy hour characteristics for each MM have beenestablished, a smaller window of data collection could be implementedfor collecting the Erlang data. Since SAR data is automatically collectedfor a 24 hour period, seven days a week, no special requirements areneeded in order to capture the required bouncing busy hour SAR data.Save the data in a storage location so that it can be processed at a laterdate.
Determine Present Status
One of the first things to do is to validate the integrity of the datacollected. Investigate partial data or anomalous data and eliminate itfrom the analysis. If the data represents an abnormal traffic period, itshould not be considered as part of the normal traffic environment.Abnormal data is not be useful for future traffic forecast estimates.
Prior to using the SAR data to establish MM capacity limits, validate theperformance of the MM by comparing the SAR performance of the MMagainst the call model projections. Compare collected SAR data for thebusy periods to call model estimated utilization results from theMM_UTIL_PERIOD SQL script. Comparing the SAR data against thecall model predictions may identify an MM performing belowexpectations. This may indicate a potential problem with that particularMM. An acceptable range for the delta between the SAR data and thecall model prediction is a delta that is lower than seven percentage points(where SAR is greater than the call model prediction). The ideal case is adelta around zero or if the SAR data is actually lower than the call modelprediction.
There is cause for concern if the delta is in the range of seven to tenpercentage points and the actual utilization of the MM is close to the70% planning limit. Contact a Network Engineering Services group or adevelopment group to conduct an investigation into the performance ofthe MM, if this condition exists. Investigate the performance of the MMif the delta is greater than ten percentage points, regardless of the actualutilization of the MM. At a minimum, the investigation should analyzeall of the processes and scripts running on the MM to verify that thereare no extra non–call processing related processes or scripts running,which are not required.
Once the data is validated, the next step is to determine the maximumand planning MM capacity limits. To determine the maximum MM
2

CBSC Capacity Planning – continued
CDMA SC Products System Resource Guide (CSSRG) June 20012-24
capacity, take the 30 minute BBH Erlang data from the SQL script alongwith the 30 minute BBH averaged SAR data (for the same time period asthe Erlang data) and plug it into the Maximum Erlang Limit equation[EQ 2–2] and the Planning Erlang Limit equation [EQ 2–3] to get onedata point for each limit calculation.
Repeat the above calculations in order to obtain either 20 or 40 datapoints each (20 data points for a two week analysis or 40 data points fora four week analysis) which can be averaged together to establish theresultant Maximum and Planning MM Erlang Limits. Table 2-2 showsan example of a spreadsheet (with only 10 data points) which can becreated to calculate the Maximum and Planning MM Erlang Limitcalculations.
Table 2-2: MM Capacity Limits Calculation Example
A B C D E F G H I J K
CBSC DATE BBH Time SAR1 SAR2 SAR3 SAR Avg SAR Util SQL Erl. Max Limit Plan Limit
1 4/5/99 17:00 67 66 67 66.7 33.3 202 546 446
1 4/5/99 17:30 67 67 67 67.0 33.0 197 538 440
1 4/6/99 17:00 70 67 69 68.7 31.3 189 547 447
1 4/6/99 17:30 67 65 66 66.0 34.0 208 550 450
1 4/7/99 17:00 66 60 62 62.7 37.3 215 513 420
1 4/7/99 17:30 64 63 62 63.0 37.0 223 538 439
1 4/8/99 17:00 65 64 64 64.3 35.7 212 532 435
1 4/8/99 17:30 64 62 65 63.7 36.3 218 536 438
1 4/9/99 17:00 63 59 61 61.0 39.0 231 526 430
1 4/9/99 17:30 60 62 63 61.7 38.3 235 545 446
Avg=> 537 439
The following steps explain the information in the spreadsheet example.
MM Capacity Limits Calculation Example
1. Columns A through C provide a CBSC reference along with the dateand time of the data points. Note that this example only uses 10 datapoints in the average calculation where 20–40 data points arerecommended.
2. Columns D through F are %idle SAR data points taken during the 30minute time period starting at the time shown in Column C.
3. Column G is the average of the three SAR data points (in otherwords, AVERAGE(D1:F1)). Using the first line of data from theexample above: SAR Avg = (67+66+67)/3 = 66.7.
4. Column H converts the %idle value to a percent utilization value (inother words, 100 – G1). Using the first line of data from the exampleabove: SAR Util = 100–66.7 = 33.3.
2

CBSC Capacity Planning – continued
June 2001 2-25CDMA SC Products System Resource Guide (CSSRG)
5. Column I is the Erlang measurement for the 30 minute periodstarting at the time shown in Column C. The Erlang data comesfrom the MM_UTIL_PERIOD SQL script or it can be derived fromthe Transcoder Channel Group Report.
6. Column J calculates the 85% Maximum MM Erlang Limit from thedata in columns H and I (in other words, (82/(H1–3))*I1). Using[EQ 2–2] and the first line of data from the example above:Max Limit = (82/(33.3–3))*202 = 546.
7. Column K calculates the 70% Planning MM Erlang Limit from thedata in columns H and I (in other words, (67/(H1–3))*I1). Using[EQ 2–3] and the first line of data from the example above:Plan Limit = (67/(33.3–3))*202 = 446.
8. At the bottom of column J is the Maximum MM Erlang Limit whichis calculated by averaging the Max Limit results for all of the datapoints collected (in other words, AVERAGE(J1:J10)). Using all ofdata from the example above: Avg Max Limit =(546+538+547+550+513+538+532+536+526+545)/10 = 537.
9. At the bottom of column K is the Planning MM Erlang Limit whichis calculated by averaging the Plan Limit results for all of the datapoints collected (in other words, AVERAGE(K1:K10)). Using all ofdata from the example above: Avg Plan Limit =(446+440+447+450+420+439+435+438+430+446)/10 = 439.
To continue this example, let’s assume the CBSC was equipped with astandard XC with six cages and five XCDRs per cage. Thus, the XCErlang capacity limits (per Table 2-1) are as follows:
� XC Maximum Erlang Limit = 659
� XC Planning Erlang Limit = 593.
The final step for this example is to compare the MM Erlang Limits andthe XC Erlang Limits. Determine which one is the limiting factor for theCBSC. The MM Erlang capacity limits for this example (per Table 2-2)are as follows:
� MM Maximum Erlang Limit = 537
� MM Planning Erlang Limit = 439.
After comparing the two results, it is obvious that the MM is the limitingfactor for this example. As a result, use the capacity limits for the MM asthe capacity limits for the CBSC. The next step is to repeat this entireprocess for each CBSC deployed in the system.
Forecast Utilization
Several different strategies can be used to forecast utilization. Each ofthem may have different figures of merit to justify their usage. Themarketing departments of cellular operators typically project futuregrowth through subscriber projections, which are used as the baselineparameter to gauge future system utilization. For CBSC expansionplanning, a forecasted estimate of total Erlangs (voice and data) on aper–CBSC basis is required. If the customer’s marketing department
2

CBSC Capacity Planning – continued
CDMA SC Products System Resource Guide (CSSRG) June 20012-26
provides the Systems Engineer with subscriber projections for a CBSCgrowth analysis, the following procedure can be used to forecast Erlangson a per–CBSC basis. Table 2-3 shows an example of a spreadsheetwhich can be used to perform a forecast of CBSC Erlangs.
Table 2-3: Example CBSC Erlang Forecast
A B C D E F G H I J K L M N O
Future
CBSC #1CE
#2CE
#3CE
#4CE
AVGCE
STDCE
CBSC%SysLoad
CurrentSystem
Subs
AVGmE/Sub
per CBSC
AVG + 3STD
mE/Subper CBSC
SystemSubs
%SysLoad
AVGErl.
3 STDErl.
1 330 337 342 336 336 5 22.1% 50000 30.43 31.77 75000 22.1% 504 527
2 257 272 260 275 266 9 17.5% 50000 30.43 33.46 75000 17.5% 399 439
3 305 310 308 315 310 4 20.3% 50000 30.43 31.67 75000 20.3% 464 483
4 315 311 318 323 317 5 20.8% 50000 30.43 31.89 75000 20.8% 475 498
5 289 295 290 298 293 4 19.3% 50000 30.43 31.75 75000 19.3% 440 459
The following steps explain the information in the spreadsheet example.
Example CBSC Erlang Forecast
1. Column A identifies all of the CBSCs supporting the system underanalysis.
2. The data in columns B through E is total carried Erlang data for thebusy hour, of the busy day of the week, for four weeks. Two 30minute samples of Erlang data for the busy hour are averagedtogether. The Erlang data comes from the MM_UTIL_PERIOD SQLscript or it can be derived from the Transcoder Channel GroupReport. If applicable, verify that voice and data Erlangs are addedtogether.
3. Columns F and G provide the average (in other words,AVERAGE(B1:E1)) and standard deviation (in other words,STDEV(B1:E1)) of the carried Erlangs for each CBSC. Using thefirst line of data from the example above:AVG CE = (330+337+342+336)/4 = 336.25 ~ 336 andSTD CE = STDEV(330,337,342,336) = 4.92 = ~5.
4. Column H is the distribution percentage of the average carriedErlangs for the CBSC when compared to the total system averagecarried Erlangs (in other words, F1/SUM(F1:F5)). Using all of thedata in column F from the example above: CBSC %Sys Load =336/ (336+266+310+317+293) = 0.2207 = ~22.1%.
5. Column I is the average number of subscribers using the systemassociated with the four weeks of data being analyzed.
6. Column J is the average milli–Erlangs of usage per subscriber for thesystem (which will be applied for each CBSC) for the busy hour ofthe busy day of the week (in other words, (F1/ (I1*H1))*1000).
2

CBSC Capacity Planning – continued
June 2001 2-27CDMA SC Products System Resource Guide (CSSRG)
Using the first line of data from the example above: AVG mE/Subper CBSC = (336.25/(50000*0.2210))*1000 = ~30.43.
7. Column K is the average milli–Erlangs plus three standarddeviations of usage per subscriber for the CBSC for the busy hour ofthe busy day of the week (in other words, ((F1+(3*G1))/(I1*H1))*1000). Using the first line of data from the example above:AVG+3STD mE/ Sub per CBSC =((336.25+(3*4.92))/(50000*0.2210))*1000 = ~31.77.
8. Column L is the total number of system subscribers projected for afuture date which is based upon customer provided subscribergrowth projections.
9. Column M is the future distribution percentage of the averagecarried Erlangs for the CBSC when compared to the total systemaverage carried Erlangs. Currently, this column represents the samedistribution as shown in column H. The purpose of this column is tobe able to adjust the system load distribution to account for newCBSC(s) added to the system which allow the growth plan tocontinue beyond the first bottleneck CBSC.
10. Column N is the projected Erlang usage for the CBSC based uponthe future system subscriber growth projection (column L), thefuture CBSC system load percentage (column M), and the averagemilli–Erlangs of usage per subscriber for the system (column J) (inother words, (L1*M1)*(J1/1000)). Using the first line of data fromthe example above:AVG Erl. = (75000*0.2210)*(30.43/1000) = 504.37 = ~504.
11. Column O is the projected Erlang usage for the CBSC based uponthe future system subscriber growth projection (column L), thefuture CBSC system load percentage (column M), and the averagemilli–Erlangs plus three standard deviations of usage per subscriberfor the CBSC (column K) (in other words, (L1*M1)*(K1/1000)).Using the first line of data from the example above:3STD Erl. = (75000*0.2210)*(31.77/1000) = 526.5 = ~527.
If the customer’s marketing department provides the Systems Engineerwith something other than subscriber projections, modifications to theapproach above can be made to project a linear relationship according tothe customer–supplied projection parameter.
If the customer requires a non–linear growth projection, modifications tothe approach above are necessary. The modifications depend upon thespecified non–linear growth projection requirements. For example, thecustomer may specify a variable subscriber growth rate along with avariable usage rate which may be based upon seasonal changes and/ormarketing promotions.
In either case, the desired outcome projects an average Erlang usage anda three–sigma Erlang usage for each CBSC in the system. The currentrecommendation is to project Erlang usage for a one to two year periodbeyond that of the data collection period.
The example in Table 2-3 projects Erlang usage on a per–CBSC basisbased upon a subscriber estimate for a future date. If subscriber growth
2

CBSC Capacity Planning – continued
CDMA SC Products System Resource Guide (CSSRG) June 20012-28
estimates are provided on a monthly basis, columns L, M, N, and O canbe repeated for each month where a subscriber growth estimate isprovided. With monthly projections, an estimate of when a particularCBSC will exceed the planning or maximum limit can be performed.Although the frequency of performing a full analysis depends upon therate of growth for the system being monitored, perform a full one to twoyear projection analysis on a quarterly basis. For large systems, whichare growing at a rapid rate, a monthly full analysis may be necessary.
Identify When Bottlenecks Will Occur
The next step is to compare the individual CBSC planning andmaximum Erlang limits established in the Determine Present Statussection to the average Erlang usage projection. Also, compare thethree–sigma Erlang usage projection for each CBSC in the system todetermine when each CBSC will reach the different limits. Implement aCBSC capacity relief mechanism before it is projected to reach theplanning limit using average Erlang usage data projections or themaximum limit, using the three–sigma Erlang usage data projections(whichever one is projected to occur first).
Evaluate Relief Alternatives
A decision needs to be made whether to:
� Re–parent BTSs onto new CBSC(s) to offload traffic
� Re–parent BTSs onto existing CBSC(s) to offload and balance out thetraffic
� Add a new carrier onto a new CBSC layer to off–load traffic
� If possible, upgrade the MM (from Helix to Puma) to increase thetraffic capacity of the existing CBSC (if the CBSC is MM–limited)
� If possible, upgrade the standard XC configuration to increase theXCDR card capacity of the existing CBSC (if the CBSC isXC–limited)
� Implement some other options or a combination of options listed inthe following CBSC Capacity Management Options section.
One option may have certain short term or long term advantages ordisadvantages over other options as well as different cost of deploymentadvantages. Ultimately, it is the service provider’s decision as to whatoption is chosen to provide capacity relief for any CBSC(s) projected toexceed the Erlang limits. The account team’s Systems Engineer workswith the service provider’s Systems Engineer to determine the variousdifferent options that are technically feasible. They also discuss thevarious different advantages and disadvantages of each option (from anengineering and deployment perspective, including complexity, risks,and cost) in order to support the service provider’s decision in choosingthe appropriate CBSC growth plan for their system.
Implement Relief Mechanisms
This step establishes schedules and contingencies for the reliefmechanisms decided in Evaluate Relief Alternatives section. Genericguidelines for implementing relief mechanisms are as follows:
2

CBSC Capacity Planning – continued
June 2001 2-29CDMA SC Products System Resource Guide (CSSRG)
� If relief includes adding or upgrading elements, determine availabilityof new equipment.
� For any relief mechanism, determine length of time needed toimplement change.
� Identify dates for scheduling the changes.
� Create a method of procedure.
� Identify back–up plans for schedule changes.
� Make changes according to schedule.
2

CBSC Capacity Management Options
CDMA SC Products System Resource Guide (CSSRG) June 20012-30
Introduction
The appropriate CBSC capacity management option to choose candepend upon many different factors:
� Customer inputs and requests
� Cost of implementation
� Market size
� Terrain
� The current design of the system
� Rate of market growth
� The number and location of the CBSCs which exceed the planninglimit.
CBSC Load Balancing thru BTS Re–Parenting
For markets which are not growing at a rapid rate, a load balancing effortof the existing CBSCs may be a viable option. If the Erlang distributionfor the CBSCs of a system are disproportionate, it may be possible toanalyze the future Erlang projections to determine if a load balancingeffort will extend the timeframe when a CBSC will reach its planninglimit.
As a general guideline, a large scale load balancing project should not beimplemented unless the effort is projected to extend the planning limittimeframe of a CBSC by at least six months (refer to the example inTable 2-4).
Table 2-4: CBSC Load Balancing Example
Before Load Balancing
CBSC–1 CBSC–2
Current busy hour Erlangs 350 150
Percent of system 70% 30%
Planning Limit (Erlangs) 480 550
Projected Erlang growth per month 21 9
Projected time to reach planning limit 6.2 months 44.4 months
After Load Balancing
CBSC–1 CBSC–2
Projected busy hour Erlangs 250 250
Projected percent of system Erlangs 50% 50%
Planning Limit (Erlangs) 480 550
Projected Erlang growth per month 15 15
Projected time to reach planning limit 15.3 months 20 months
2
CBSC Capacity Management Options – continued
June 2001 2-31CDMA SC Products System Resource Guide (CSSRG)
In Table 2-4, the projected time to reach the planning limit for CBSC–1was extended by ~9 months (from 6.2 to 15.3 months), but the projectedtime for CBSC–2 to reach the planning limit was reduced by ~24months (from 44.4 to 20 months).
A load balancing effort extends the planning limittimeframe of one CBSC by reducing the planning limittimeframe of another CBSC. Since it does not add actualErlang capacity to the system, CBSC load balancing is nota very effective capacity relief option. It provides capacityrelief for one CBSC by taking away some capacityheadroom from another CBSC.
Unless there are other circumstances within the systemdesign which influence the relocation of an inter–CBSCborder, CBSC load balancing for capacity relief purposesshould be proposed as a low priority option.
NOTE
It is also important to note some of the implementation issuessurrounding a CBSC load balancing effort. The following threeimplementation options explain some of these issues for a basic twoCBSC example where sites are re–parented from one CBSC to another.For situations where more than two CBSCs are involved, these conceptscan still be applied or a combination of multiple options may need to beapplied as appropriate.
Implementation Option 1
If the two CBSCs involved with the re–parenting effort are managed bytwo different OMC–R databases, the re–parented BTSs can be easilyadded to the re–parented OMC–R database with the same BTS IDs. Thisallows toy cell call processing verification testing of the re–parentedBTSs on the new OMC–R/CBSC prior to the actual cutover activity.
A typical toy cell is a minimally configured, fullyfunctional, spare BTS co–located within the samefacility/building as the MSC/CBSC hardware. For thosesites utilizing a toy cell, it is used for various differenttypes of testing, including call processing verificationtesting.
NOTE
During the cutover procedure, only those sites that are being re–parentedare subjected to an outage as the sites are disabled on one CBSC, thespans for the sites are redirected to the new CBSC, and the sites areenabled on the new CBSC. This is a preferred option since it minimizesthe affected outage area to just those sites which are being re–parentedand it maximizes the pre–cutover verification testing capabilities.
2

CBSC Capacity Management Options – continued
CDMA SC Products System Resource Guide (CSSRG) June 20012-32
Implementation Option 2
If the two CBSCs involved with the re–parenting effort are managed byone OMC–R database and it is acceptable to permanently change theBTS IDs for the re–parented sites, the re–parented BTSs can be easilyadded to the same OMC–R database with a different BTS ID. This willalso allow toy cell call processing verification testing of the re–parentedBTSs on the new CBSC (same OMC–R) prior to the actual cutoveractivity. During the cutover, only those sites that are being re–parentedare subjected to an outage as the sites are disabled on one CBSC, thespans for the sites are redirected to the new CBSC, and the sites areenabled on the new CBSC. This is also a preferred option since itminimizes the affected outage area to just those sites which are beingre–parented and it maximizes the pre–cutover verification testingcapabilities.
Implementation Option 3
If the two CBSCs involved with the re–parenting effort are managed byone OMC–R database and it is not acceptable to permanently change theBTS IDs for the re–parented sites, it becomes more difficult toimplement a re–parenting effort.
There are basically three approaches to implement this option:
� The first approach, which is preferred, involves deleting the BTS fromone CBSC and immediately re–adding the BTS onto the new CBSC.This is done for one or more sites at a time, over a period of severalnights (maybe weeks, if the size of the project is large). This approachminimizes the outage area to one or a few sites at a time (dependingupon the deployment strategy). However, it still lacks the capability ofperforming verification testing of the database changes with the actualhardware configuration prior to deploying it into a commercialsystem. Even though this is a time– and resource–consuming activity,this approach reduces the risk factors because it affects only one ormore sites at a time in those situations where the exact same BTS IDsneed to be re–parented from one CBSC to another CBSC under oneOMC–R.
� The second approach involves two major steps:
1. The first step is to re–parent all of the sites to their new CBSCsusing temporary BTS IDs.
2. Once the performance of these temporary sites has stabilized, eachtemporary BTS ID can be deleted and re–added back to the sameCBSC with the original BTS ID (prior to executing step oneabove).
This approach allows for pre–cutover verification testing for the stepone above re–parenting activity, but it does not allow for pre–cutoververification testing for the step two above re–numbering activity.This approach is not as efficient as other approaches, since itrequires two major activities in order to accomplish the overallre–parenting task. It also requires two outages for each site beingre–parented (one outage for the re–parenting step and another outage
2

CBSC Capacity Management Options – continued
June 2001 2-33CDMA SC Products System Resource Guide (CSSRG)
for the re–numbering step). Since this approach is even more of atime– and resource–consuming activity than that of the firstapproach, this approach should be recommended as a secondaryalternative to the first approach.
� The third approach involves creating new OMC–R/CBSC and XCdatabases offline from the system. During the cutover, the entireportion of the system under the one OMC–R is disabled, the olddatabases are removed, the new databases are installed, the spans forthe re–parented sites are redirected to the new CBSC, and the systemis brought back up. Although this is a viable approach forImplementation Option 3, this type of approach is typically notrecommended due to the high risk factors associated with creating anew database without thoroughly testing it with the actual hardwareconfiguration before deploying it into a commercial system. It alsocauses a larger outage area since all of the sites under an OMC–R areaffected instead of just those sites that need to be re–parented.
In general, the process of managing all of the parameter and neighbor listdatabase modifications associated with a large scale re–parenting activityis a difficult task, regardless of which re–parenting option is chosen.Because of this difficulty, a Motorola internal tool was developed to helpsimplify this task. A CDMA cellular database restructuring tool, calledRaven, is currently available to help create most of the databasecommands (in other words, parameters and neighbor lists) necessary tore–parent BTSs from one CBSC parent to another. It provides thecapability of keeping the BTS ID the same or to renumber the BTS ID aspart of the move operation.
Although Raven helps to eliminate some of the human error involvedwith duplicating a site’s parameters and neighbors from one CBSC toanother, there is still a significant amount of effort involved withmanaging the appropriate usage of the tool. The results must also bevalidated in order to verify that the final re–parenting activity issuccessful. The re–parenting option approach that is chosen should takeinto account the usage of this tool in order to simplify the deploymentprocess.
CBSC Splitting
Since the Erlang call processing capacity of a CBSC is basically fixed,the BTS Erlang usage will exceed the planning limit of a CBSC as thecarried–Erlang usage of the BTSs under a CBSC increases over time(which is enabled through the expansion of CDMA RF carriers).
When this occurs, CBSC splitting can be used to off–load existingCBSC(s) by re–parenting sites onto new CBSC(s) which are added to asystem. This reduces the number of BTSs that are controlled by theCBSC which reduces the BTS footprint coverage area of the CBSC. It isalso the most common method of expanding the Erlang call processingcapacity of a system, which in effect increases the number of subscribersthat can be supported by the system.
Figure 2-4 shows a CBSC splitting example where sites from twoexisting CBSCs are re–parented to a new third CBSC. Figure 2-4 shows
2

CBSC Capacity Management Options – continued
CDMA SC Products System Resource Guide (CSSRG) June 20012-34
that the total system capacity increases from 1200 Erlangs to 1800Erlangs (if we assume a CBSC capacity of 600 Erlangs). It also showsthat the BTS footprint coverage area for CBSCs 1 and 2 reduce fromsupporting 62 BTSs before the CBSC splitting expansion effort to 44BTSs after the addition of a new CBSC.
Figure 2-4: CBSC Splitting Example
62 CBSC #2 Sites62 CBSC #1 Sites
Before CBSC Splitting After CBSC Splitting
44 CBSC #2 Sites44 CBSC #1 Sites 36 CBSC #3 Sites
Total system capacity = 1200 Erlangs(assuming 600 erlangs per CBSC)
Total system capacity = 1800 Erlangs(assuming 600 erlangs per CBSC)
Because the addition of a new CBSC into a network requiresre–parenting sites from an existing CBSC to the newly added CBSC, thesame implementation issues surrounding a CBSC load balancingre–parenting activity also affect a CBSC splitting re–parenting activity.The following three implementation options explain some of these issuesfor a basic two CBSC example where sites are re–parented from oneexisting CBSC to a newly added CBSC. For situations where more thantwo CBSCs are involved, the concepts below can still be applied or acombination of multiple options below may need to be applied asappropriate.
Implementation Option 1
If the two CBSCs involved with the CBSC splitting/re–parenting effortare managed by two different OMC–R databases, the re–parented BTSscan be easily added to the re–parented OMC–R database with the sameBTS IDs. If a new OMC–R is added along with the new CBSC (seeFigure 2-5), a new database is created for the new OMC–R/CBSChardware.
Figure 2-5: New OMC–R and CBSC
Re-parent BTSs
with same BTS IDs
OMC-NewOMC-1
CBSC-1
CBSC-2
CBSC-3 CBSC-New
= Existing Hardware = New Hardware
2

CBSC Capacity Management Options – continued
June 2001 2-35CDMA SC Products System Resource Guide (CSSRG)
If a new CBSC is added to an existing OMC–R (see Figure 2-6), theexisting OMC–R database needs to be modified to add a new CBSCplatform (via a MIB Only Mode modification to the OMC–R MIB).
Figure 2-6: New CBSC with an existing OMC–R
Re-parent BTSs
with same BTS IDs
OMC-1
CBSC-1
CBSC-2
CBSC-3
= Existing Hardware = New Hardware
OMC-2
CBSC-4
CBSC-5CBSC-New
In either case, adding a new CBSC with this approach allows toy cellcall processing verification testing and/or cluster call processingverification testing of the re–parented BTSs on the new OMC–R/CBSCprior to the actual cutover of the new OMC–R/CBSC into commercialservice. During the cutover, only those sites being re–parented will besubjected to an outage as the sites are disabled on one CBSC, the spansfor the sites are redirected to the new CBSC, and the sites are enabled onthe new CBSC. Since it minimizes the affected outage area to just thosesites which are being re–parented and it maximizes the pre–cutoververification testing capabilities, this is the preferred implementationoption. The larger amount of pre–cutover testing that is performed, thegreater the chances are of executing a successful CBSC deployment.
This implementation option of re–parenting BTSs onto differentOMC–Rs leads toward a strategy where a Systems Engineer shouldattempt to design a system expansion plan with adjacent CBSCs beingcontrolled by different OMC–Rs (see Figure 2-7). This alternatingOMC–R strategy enables a Systems Engineer to more easily implementOption 1 where BTSs are re–parented with the same BTS IDs.
Figure 2-7: Alternating OMC–R Strategy
OMC-1 / CBSC-1
OMC-2 / CBSC-3
OMC-3 / CBSC-5
OMC-1 / CBSC-2
OMC-2 / CBSC-4
OMC-3 / CBSC-6
OMC-1CBSC-1
OMC-2CBSC-5
OMC-1CBSC-2
OMC-3CBSC-8
OMC-2CBSC-4
OMC-3CBSC-7
OMC-2CBSC-6
OMC-1CBSC-3
= OMC-2= OMC-1 = OMC-3
Striped Checkerboard
OMC-1CBSC-2
OMC-3CBSC-8
OMC-2CBSC-4
OMC-3CBSC-7
OMC-1 / CBSC-1
OMC-2 / CBSC-5
OMC-2 / CBSC-6
OMC-1 / CBSC-3
Hybrid
The striped alternating OMC–R strategy shown in Figure 2-7 can beimplemented with horizontal (as shown), vertical, or even diagonalstripes to segment the BTSs in a system under differentOMC–R/CBSCs.
2

CBSC Capacity Management Options – continued
CDMA SC Products System Resource Guide (CSSRG) June 20012-36
From a CBSC capacity perspective (regardless of the OMC–R strategy),the striped CBSC strategy can be effective if it is possible to grow thesystem with an adequate CBSC coverage area. If the area between twoICSHO borders becomes too narrow with the striped approach, theCBSC may be burdened with too much inter–CBSC handoff activity,which may reduce the capacity potential of the CBSC. A checkerboardCBSC approach increases the required number of physical IC linksbetween CBSCs, but this should not have a negative effect on MMprocessor capacity. It is an increase in the ratio of inter–CBSC handoffactivity to intra–CBSC handoff activity, which reduces the processorcapacity potential of the MM. The MM utilizes more processor CPUtime to process inter–CBSC handoff messages than it does forintra–CBSC handoff messages. One of the goals of a CBSC layoutdesign is to minimize the ratio of inter–CBSC handoff activity tointra–CBSC handoff activity. For most applications, a hybrid type ofapproach may be implemented to help minimize this ICSHO activity.
Implementation Option 2
If the two CBSCs involved with the CBSC splitting/re–parenting effortare managed by one OMC–R database and it is acceptable topermanently change the BTS IDs for the re–parented sites, there–parented BTSs can be easily added to the same OMC–R databasewith a different BTS ID.
Figure 2-8: New CBSC with same OMC–R, new BTS IDs
Re-parent BTSs
with NEW BTS IDsCBSC-1 CBSC-2 CBSC-New
= Existing Hardware = New Hardware
OMC-1
This type of approach also allows toy cell call processing verificationtesting and/or cluster call processing verification testing of there–parented BTSs on the new CBSC (same OMC–R) prior to the actualcutover activity. During the cutover, only those sites that are beingre–parented are subjected to an outage as the sites are disabled on oneCBSC, the spans for the sites are redirected to the new CBSC, and thesites are enabled on the new CBSC. This is also a preferred option sinceit minimizes the affected outage area to just those sites which are beingre–parented and it maximizes the pre–cutover verification testingcapabilities.
Implementation Option 3
If the two CBSCs involved with the re–parenting effort are managed byone OMC–R database and it is not acceptable to permanently change theBTS IDs for the re–parented sites, it becomes more difficult toimplement a re–parenting effort. There are basically three approaches toimplement this option.
2

CBSC Capacity Management Options – continued
June 2001 2-37CDMA SC Products System Resource Guide (CSSRG)
� The first approach involves deleting the BTS from one CBSC andimmediately re–adding the BTS onto the new CBSC, one or a fewsites at a time, over a period of several nights (see Figure 2-9).
Figure 2-9: New CBSC with the same OMC–R, same BTS IDs
Gradually
One or more a nightCBSC-1 CBSC-2 CBSC-New
= Existing Hardware = New Hardware
OMC-1
Re-parent BTSs
This approach minimizes the outage area to one or more sites at a time(depending upon the deployment strategy), but it still lacks thecapability of performing verification testing of the database changeswith the actual hardware configuration prior to deploying it into acommercial system.
Even though this is a time– and resource–consuming activity, the riskfactor is reduced to affecting only one or more sites at a time. Thatmakes this the preferred approach where the exact same BTS IDs needto be re–parented from one CBSC to another CBSC under oneOMC–R.
� The second approach involves two major steps (see Figure 2-10).
Figure 2-10: New CBSC with the same OMC–R, same BTS IDs – in two steps
2-Step approach:
2. Re-number BTS IDsCBSC-1 CBSC-2 CBSC-New
= Existing Hardware = New Hardware
OMC-11. Re-parent all BTSs w/temp IDs
One or more a night
1. The first step is to re–parent all of the sites to the new CBSCusing temporary BTS IDs.
2. Once the performance of these temporary sites have stabilized,each temporary BTS ID can be deleted and re–added back to thesame CBSC with the original BTS ID (prior to executing step oneabove).
This approach does allow for pre–cutover verification testing for thestep one re–parenting activity, but it does not allow for pre–cutoververification testing for the step two above re–numbering activity.This approach is not as efficient as other approaches since it requirestwo major activities in order to accomplish the overall CBSCdeployment. It also requires two outages for each site beingre–parented to the new CBSC (one outage for the re–parenting stepand another outage for the re–numbering step). Since this approachis even more of a time– and resource–consuming activity than thatof the first approach, this approach should be recommended as asecondary alternative to the first approach.
2

CBSC Capacity Management Options – continued
CDMA SC Products System Resource Guide (CSSRG) June 20012-38
� The third approach involves the creation of a new OMC–R/CBSC andXC databases offline from the system.
Figure 2-11: New CBSC with an existing OMC–R, new MIB, same BTS IDs
CBSC-1
OMC-1
CBSC-1 CBSC-2
CBSC-New= Existing Hardware = New Hardware
OMC-1
CBSC-2
Before Cutover After Cutover
(New MIB)
During the cutover, the entire portion of the system under the oneOMC–R is disabled, the old databases are removed, the new databasesare installed, the spans for the re–parented sites are redirected to the newCBSC, and the system is brought back up. Although this is a viableapproach for this option, this type of approach is typically notrecommended due to the high risk factors associated with creating a newdatabase without thoroughly testing it with the actual hardwareconfiguration before deploying it into a commercial system. It alsocauses a larger outage area since all of the sites under an OMC–R (allsites on CBSCs 1 and 2 in the above example) are affected instead ofjust those sites that need to be re–parented.
Regardless of the chosen CBSC splitting option, it’s a difficult taskmanaging all of the parameter and neighbor list database modificationsconnected with a large scale re–parenting activity associated with theaddition of a new CBSC.
There are two internal Motorola tools available that can be used to helpthe deployment of a new CBSC into a commercial system. TheConfiguration Management (CM) tool can be used to create a newdatabase for the new CBSC. The Raven tool can help create most of thedatabase commands (in other words, parameters and neighbor lists)necessary to re–parent BTSs from one CBSC parent to a new CBSC. Itprovides the capability of keeping the BTS ID the same or to renumberthe BTS ID as part of the move operation.
Although the tools help eliminate some of the human error involved withduplicating a site’s parameters and neighbors from one CBSC to another,there is still a significant amount of effort involved with managing theappropriate usage of the tool and validating the desired results from thetool in order to verify that the final CBSC splitting activity will besuccessful. The chosen CBSC splitting approach should take intoaccount the usage of this tool in order to simplify the deploymentprocess.
Layered CBSC Overlay
The layered CBSC overlay approach provides two important capacitybenefits when deployed:
� CBSC capacity relief
2

CBSC Capacity Management Options – continued
June 2001 2-39CDMA SC Products System Resource Guide (CSSRG)
� RF carrier capacity relief.
If an area within a system requires both types of capacity relief, theoverlay approach option should be seriously considered. But, if it hasalready been decided that additional BTS frames are required to add anew carrier to an area within a system, the layered CBSC overlayapproach is highly recommended and should definitely be considered forthis new carrier deployment.
As the traffic volume grows, the Cellular or PCS system begins toexpand from a single–carrier service to multi–carrier service. In thecurrent system release, a single BTS can be expanded up to eight carriersunder one CBSC. Meanwhile, the MM processing capability of eachCBSC is not expandable and in essence the traffic capacity capability ofthe CBSC is basically fixed. As additional carriers are added to a BTS,the BTS expands its traffic capacity capability. This causes the CBSC tobe able to support fewer and fewer BTSs. The following examplecalculates the number of BTSs per CBSC for a typical four–carriersystem configuration with the following assumptions.
Example
� Calculated CBSC Maximum Limit = 600 Erlangs (Helix MMassumed)
� System Configuration: 3–sector, 800 MHz, 100% 8kb mobiles
� BTS Maximum Erlang Limit per sector = 15.5 Erlangs
� BTS Maximum Erlang Limit per cell = 46.5 Erlangs
� Average Percentage Loading of BTS Max. Limit for All Cells Underthe CBSC = 50%
� Number of Carriers per BTS = 4
� Number of BTSs per CBSC = 600/(46.5*0.50*4) = 6.45 = ~6 cells.
It is obvious from the example that a CBSC should not be designed withfour carriers under the conditions stated if the maximum number ofBTSs supported by the CBSC is about six. In order to maintain areasonable CBSC coverage area, the minimum recommended planningguideline of BTSs under one CBSC is a cluster of about 19 cells (ideally,one core cell surrounded by six inner ring cells and 12 outer ring cells).Obviously, this is not a hard limit of any sort. A lower number of BTSsper CBSC may need to implemented for certain high capacity situations.The 19 BTS per CBSC guideline is a target minimum below which oneshould try not to go.
For a sectored BTS, it is very unlikely for the Erlang traffic growth to beevenly distributed among all of the sectors of a BTS. Therefore, the BTStypically won’t reach its maximum Erlang limit potential. It is even moreunlikely for the Erlang traffic growth to be evenly distributed such thatall of the BTSs (including all sectors) under a CBSC reach theirmaximum Erlang limit all at the same time.
Since the growth rates for the individual BTSs under a CBSC aredifferent, an analysis of the number of BTSs per CBSC can be
2

CBSC Capacity Management Options – continued
CDMA SC Products System Resource Guide (CSSRG) June 20012-40
performed using an average percentage loading of the BTS maximumErlang limit. Figure 2-12 plots the number of BTSs per CBSC versus theaverage percentage loading of the cells for all of the differentthree–sector configurations with each of them having four carriers perBTS. The legend displays the maximum assumed BTS load used for theanalysis.
Figure 2-12: Four Carriers, three–sector BTS Example
10
5
15
20
25
30
35
Average % of Loading of Cells
# o
f B
TS
s p
er C
BS
C
10% 20% 30% 40% 50% 60% 70% 80% 90% 100%0%
Number of BTSs per CBSC(4 Carriers, 3 Sector BTS, CBSC Limit = 600Erl.)
40
45
0
800 MHz, 13kb, 18 Erl/BTS Max.
800 MHz, 8kb, 46.5 Erl/BTS Max.
1900 MHz, 13kb, 21.6 Erl/BTS Max.
1900 MHz, 8kb, 55.8 Erl/BTS Max.
42
35
23
10
17
14
21
9
12
28
8
17
14
10
9
12
8 7
32
16
11
8
56
45
433
13
9
7
45
34
3
27
The results above show that a three–sector site (with any type of systemconfiguration) won’t support four carriers if the following designassumptions are required: CBSC Erlang limit is 600 Erlangs, 19 cellsminimum per CBSC, and an average loading of 50% of the maximumBTS load. Consider the example in Figure 2-13 which plots the numberof BTSs per CBSC versus the average percentage loading of the cells formultiple carriers under one BTS/system configuration (three–sector BTSat 800 MHz with a 13kb vocoder and a CBSC limit of 600 Erlangs).
2

CBSC Capacity Management Options – continued
June 2001 2-41CDMA SC Products System Resource Guide (CSSRG)
Figure 2-13: Three–sector Multi–carrier BTS Example
20
80
60
100
Average % of Loading of Cells
# o
f B
TS
s p
er C
BS
C
10% 20% 30% 40% 50% 60% 70% 80% 90% 100%0%
Number of BTSs per CBSC(3 Sector BTS, 800 MHz, 13kb, CBSC Limit = 600Erl.)
40
120
0
4 Carriers
3 Carriers
2 Carriers
1 Carrier
111 111
33
48
83
42
28
37
56
33
42
56
83
67
8
12
9
2421 19
17
1114
1619
22
28
37
56
83
1214
17
42
28
10
21
The system configuration shown can support up to three carriers and stillmeet the 19 cell minimum per CBSC with an average of 50% for themaximum BTS loading. If the minimum cells per CBSC is reduced to 17or the average BTS loading is reduced to less than 50%, a four–carriersystem could be supported by the CBSC. Figure 2-14 plots the numberof BTSs per CBSC versus the average Erlangs per BTS (independent ofthe system or BTS configuration) for multi–carrier configurations with aCBSC Erlang limit of 600 Erlangs (an assumed value for a Helix MM).
Figure 2-14: BTSs per CBSC vs. Avg. Erlangs per BTS
10
20
80
60
100
Average Erlangs per BTS
# o
f B
TS
s p
er C
BS
C
5 10 15 20 25 30 35 40 45 500
Number of BTSs per CBSC(assume Helix CBSC Limit = 600 Erlangs)
40
120
0
4 Carriers – Helix
3 Carriers – Helix
2 Carriers – Helix
1 Carrier – Helix
120
6060
30
40
2420
17 15 1313
15
2020
15
10
30
40
1013 12
30
9 8 76
8 7 6 5 4 48
6 5 4 4 4 3
2

CBSC Capacity Management Options – continued
CDMA SC Products System Resource Guide (CSSRG) June 20012-42
The average Erlangs presented in Figure 2-14 is basedupon conversation Erlangs and not on traffic channel orWalsh code Erlangs.
NOTE
As shown in Figure 2-14, if the desired minimum number of BTSs perCBSC were 20, then a:
� One–carrier CBSC could support an average of 30 conversationErlangs per–carrier, per BTS
� Two–carrier CBSC could support an average of 15 conversationErlangs per–carrier, 30 Erlangs total per BTS
� Three–carrier CBSC could support an average of 10 conversationErlangs per–carrier, 30 Erlangs total per BTS
� Four–carrier CBSC could support an average of 7.5 conversationErlangs per–carrier, 30 Erlangs total per BTS (again, assuming theCBSC limit is 600 Erlangs).
As an alternate option, an upgrade to a Puma MM can be performed inorder to gain an estimated 1.9 times the capacity of the Helix MM(assuming that the planned port capacity features are available to makethe Puma MM processing capability the limiting factor). Figure 2-15 isan example of the Puma capacity. It plots the number of BTSs per CBSCversus the average Erlangs per BTS for multi–carrier configurations withan estimated Puma CBSC Erlang limit of 1100 Erlangs (1.83 times theprevious Helix estimate).
Figure 2-15: Puma MM Example
20
80
60
100
Average Erlangs per BTS
# o
f B
TS
s p
er C
BS
C
5 10 15 20 25 30 35 40 45 500
Number of BTSs per CBSC(assume Puma CBSC Limit = 1100 Erlangs)
40
120
0
4 Carriers – Puma
3 Carriers – Puma
2 Carriers – Puma
1 Carrier – Puma
110110
73
5555
37
44
37
3128
2422
28
2218
16 1412
11
73
37
24
1815
10 9 87
12
55
28
1814
119 8 7 6 6
As shown in Figure 2-15, if the desired minimum number of BTSs perCBSC were 20, then a:
� One–carrier CBSC could support an average of 55 conversationErlangs per–carrier, per BTS
2

CBSC Capacity Management Options – continued
June 2001 2-43CDMA SC Products System Resource Guide (CSSRG)
� Two–carrier CBSC could support an average of 27.5 conversationErlangs per–carrier, 55 Erlangs total per BTS
� Three–carrier CBSC could support an average of 18.33 conversationErlangs per–carrier, 55 Erlangs total per BTS
� Four–carrier CBSC could support an average of 13.75 conversationErlangs per–carrier, 55 Erlangs total per BTS (again, assuming thePuma CBSC limit is 1100 Erlangs).
If a layered CBSC overlay approach is not used, the shrinking CBSCcoverage area (a CBSC connected to a few sites) can eventually impact
system growth in the following ways:
� Decrease CBSC traffic capacity
� Generate more inter–CBSC handoffs
� Increase the complexity of inter–CBSC border planning andoptimization
� Increase the number of paging areas
� Increase frequency of CBSC load balancing through BTS re–parenting
� Increase complexity of database management, etc.
In most cases where a system is planned to grow beyond four carriers,the layered CBSC overlay approach is a necessity. As a result, theSystems Engineer supporting a design of a multi–carrier system shouldanalyze the growth of the individual system and start planning on howand when to implement the layered CBSC overlay approach. Once it hasbeen determined that a layered CBSC overlay system design isnecessary, network planning can be performed to simplify the migrationfrom the current system design to the overlay system design.
System Architecture
The layered CBSC architecture links two BTSs to two different CBSCs.Each CBSC is considered to be on a different layer of carriers. The newsystem architecture is shown in Figure 2-16. In this example, a BTS hasfour carriers in service. The first two carriers, F1 and F2, reside on oneof the BTS frames. This frame is linked to CBSC#1, which is in turncontrolled by MSC#1. The second two carriers, F3 and F4, reside on thesecond BTS frame. This frame is served by CBSC #2, which in turn islinked with MSC#2. Utilizing a layered MSC approach (a different MSCper layer as shown Figure 2-16) is not necessarily required for a layeredCBSC implementation, but it does have some advantages of its own. Inthis case, each layer has its own virtually independent end–to–endservice from the MSC to the mobile.
2

CBSC Capacity Management Options – continued
CDMA SC Products System Resource Guide (CSSRG) June 20012-44
Figure 2-16: Layered CBSC Architecture Design
Layer 1, F1 & F2
Layer 2, F3 & F4
CBSC 1
CBSC 2Switch 2
Switch 1BTS100F1 & F2
BTS200F3 & F4
In this approach, adding layers vertically provides for system growth,instead of reducing the CBSC coverage size horizontally by reducing thenumber of BTSs connected to the CBSC by re–parenting BTSs to newCBSC(s). As an added benefit, this also provides redundancy in serviceand enhances system reliability. The enhanced system reliability is dueto the fact that if one CBSC fails, the other CBSC on the other layer isstill be able to provide service to the affected CBSC outage area. Thedetails of these advantages and disadvantages are described in theAdvantages and Disadvantages section.
The layered CBSC structure is not limited to two carriers per layer ortwo layers per system (shown in Figure 2-16). Although two carriers perlayer presents a more ideal system configuration, up to four carriers perlayer can be supported. This is typically limited by the maximumnumber of carriers that the highest density BTS product deployed in thesystem can currently support in one frame. With the current CBSCcapacity combined with the current spectrum availability, the maximumnumber of carriers per layer should be limited to four or less carriers perlayer. Aside from any antenna combining restrictions and spectrumavailability, there is no limit to the number of layers that can be deployedin a system.
BTS Hardware
In a layered configuration, a maximum of eight CDMA carriers at theBTS location can still be duplexed together to share the same set of twoantennas per–sector. As a result, the cell RF coverage footprint can bethe same across all eight carriers regardless of which CBSC layer thecarrier is on.
In a four–carrier, two–layer example system (shown in Figure 2-17), thefour–carrier BTS hardware actually consists of two co–located BTS
2

CBSC Capacity Management Options – continued
June 2001 2-45CDMA SC Products System Resource Guide (CSSRG)
frames. These two frames have a separate BTS ID. The Logical BTSfeature (FR# 970B) cannot be used with the layered CBSC approachbecause this feature requires both BTS frames to be connected to thesame CBSC/OMC–R. The BTS IDs for the two frames can share thesame BTS ID (even without the logical BTS feature) if the two CBSCsare interfaced to two different EMXs (similar to what is shown inFigure 2-16) as well as two different OMC–Rs.
As seen in Figure 2-17, each BTS frame is linked to a different CBSC.Using a Tx combiner, the RF output from each frame can be combinedonto the same Tx antenna, while the Rx path can be split between thetwo frames. By using a duplexer to combine Tx and Rx paths onto oneantenna, a single pair of antennas per sector can be used to feed bothBTS frames. Depending upon the amount of redundancy desired, asecond GPS antenna can be used to feed the second frame or one GPSantenna can be used to feed both frames. Refer to the latest version ofthe CDMA RF Planning Guide for more information on multiple frameantenna and GPS configurations that are supported by the various BTSproduct lines.
Figure 2-17: Four–carrier, Two–layer Example
CBSC #1 CBSC #2
GPS
F1 & F2Frame
2-carrierFrame 1BTS ID: 100
F3 & F4Frame
GPS
2-carrierFrame 2BTS ID: 200
Most of the current BTS products (see the Base Transceiver Station(BTS) chapter for more details) can be expanded to eight carriers with asingle pair of antenna per sector. For example, a four–carrier systemusing the SC4800 series BTS is shown in Figure 2-18. Four Tx carriersare combined and duplexed onto the primary Rx antenna. The second setof four Tx carriers from the 2nd combiner are duplexed onto the diversityreceive antenna. Refer to the latest version of the CDMA RF PlanningGuide for further information regarding antenna duplexing and isolationconsiderations.
2

CBSC Capacity Management Options – continued
CDMA SC Products System Resource Guide (CSSRG) June 20012-46
Figure 2-18: Typical Eight–carrier Tx and Rx Configuration
SC4850 series supports up to 8 carriers with a single pair of TX antenna.
Quad CavityCombiner
DuplexerTo RX “A” To RX “B”
Quad CavityCombiner
Duplexer
F1 F3
(F5) (F7)
F2 F4
(F6) (F8)
Mobile Hashing
Mobile hashing among carriers in idle mode is controlled by the numberof carriers in the CDMA Channel List Message. All of the availablecarriers in service for all layers should be listed in the channel listmessage. All mobiles are uniformly distributed among all of the carrierslisted in the channel list message based upon the mobile’s InternationalMobile Station Identity (IMSI). The IMSI is comprised of the mobilecountry code (MCC), the mobile network code (MNC), and the mobilestation identification number (MSIN). Refer to ANSI standardJ–STD–008 for further definition on the operation of the hashingalgorithm.
All the carriers in the same BTS site location broadcast an identicalCDMA Channel List Message with all of the available carriers listed.Upon receiving this message from the paging channel, a mobilecalculates the corresponding carrier based on the hashing equation.
Advantages and Disadvantages of the layered CBSC OverlayApproach
The following provides some of the advantages and disadvantages of thelayered CBSC Overlay approach.
CBSC Coverage Area
In a layered overlay approach, the number of BTSs per CBSC ismaximized and can stay fairly fixed. The actual coverage area benefitfrom using a layered approach depends on the system configuration andthe number of carriers per layer.
In a non–layered approach, the number of BTSs per CBSC mayconstantly need to change. The CBSC is limited in the amount of traffic
2
CBSC Capacity Management Options – continued
June 2001 2-47CDMA SC Products System Resource Guide (CSSRG)
(BHCA, Erlang) that it can support. As the traffic increases at a physicalBTS location (in other words, more RF carriers added), the CBSC isable to support fewer BTSs (due to greater Erlangs per BTS). Forexample, consider a CBSC with 600 Erlangs of capacity which cansupport 40 one–carrier BTSs carrying 15 Erlangs each. This same CBSCwould only be able to support 20 two–carrier BTSs carrying 30 Erlangseach. This causes the CBSC coverage area to shrink (in other words, areduction in the number of BTSs supported by the CBSC).
Optimization
In a layered overlay approach, the overlaid CBSCs can be designed to bethe same as the underlaid carriers such that the inter–CBSC soft handoffborders occur at the same locations for all layers. In this case, theoptimization effort of an ICSHO border for a new layer is minimizedsince the same optimization parameters of a previously optimized layercan be reused for the new layer. Even if the ICSHO borders of a newlayer are partially aligned with an existing layer, there is still asignificant benefit in the border optimization process.
In a non–layered approach, CBSC borders are frequently changing dueto re–parenting in order to add new CBSCs into the network to expandErlang capacity, along with the re–parenting of BTSs across existingCBSCs in order to balance Erlang traffic. These re–parenting eventscreate a significant amount of border optimization work, where not onlydoes the new ICSHO borders need to be optimized, but the old ICSHOborders may need to be verified and/or re–optimized.
Database Management
In a layered overlay approach with the overlaid CBSCs designed tocorrespond on a one–to–one basis with the underlaid carriers, databasemanagement is simplified since basically the same database parameterscan be re–used for each layer. If the co–located BTS frames in a layeredCBSC approach are also interfaced in a layered EMX and a layeredOMC–R approach (in other words, each BTS layer is supported by adifferent CBSC, OMC–R, and EMX), an added benefit is introducedwhere the BTS IDs for each of the co–located BTS frames supportingeach layer can now re–use the same BTS ID.
Since the EMX is limited to 511 BTS IDs, re–using BTS IDs on differentlayers can simplify the BTS numbering scheme of co–located BTSframes without the need of a Logical BTS feature. If this numberingscheme is used, most of the neighbor lists and XCSECT table entriescould be re–used with just minor modifications. The Logical BTSfeature (FR# 970B) cannot be used with the layered CBSC overlayapproach because it cannot be implemented unless both BTS frames arebe connected to the same CBSC/OMC–R. The logical BTS feature doesprovide some additional advantages aside from the BTS ID advantage,and as a result, those advantages won’t be available when the layeredCBSC overlay approach is used.
In a non–layered approach, there are frequent, significant, and complexdatabase modifications involved with the re–parenting activities
2

CBSC Capacity Management Options – continued
CDMA SC Products System Resource Guide (CSSRG) June 20012-48
associated with adding new CBSCs or load balancing CBSCs. Althoughthere is currently a Motorola internal tool available, named Raven, tohelp simplify the task, managing and verifying the neighbor listdatabases associated with a CBSC re–parenting activity is still achallenging effort. One advantage of the non–layered approach is that thelogical BTS feature can be implemented to allow the system to treatmultiple frames at a physical location (up to four frames) as a singlelogical site. Refer to feature request number 970B for more informationregarding the details of the Logical BTS feature.
System Redundancy
In a layered overlay approach, one of the main advantages involves theextra level of inherent redundancy built into the technique which canenhance system reliability and availability. With this technique, eachcell’s coverage area is essentially served by at least two CBSCs at onetime. Consider a redundant system design where layered MSCs andCBSCs are present, shown in Figure 2-19. If an outage occurred on onelayer (see points a, b, or c in Figure 2-19), 50% of the idle mobiles in thefailed area remain in service and 50% of the mobiles with calls inprogress in the failed area will not drop their calls (assuming there isequal traffic on each layer).
For point c, the failed area is just one BTS. For point b, the failed areacovers all of the BTSs under one CBSC. For point a, the failed areacovers all of the BTSs under all of the CBSCs under the MSC. The keypoint to note about the built–in redundancy is that all of the active callson the non–failed layer(s) will not drop (which should improve systemreliability) and all of the idle mobiles utilizing the non–failed layer(s)stay in service (which should improve system availability).
Furthermore, if the other CBSC(s) on the other layer(s) were not close tooperating at its maximum capacity or the outage occurred during anon–busyhour timeframe, the subscribers being served by theoutage–inflicted CBSC could be manually moved to one of the otheroperating layers. Although it is currently a form of manual redundancy,re–establishing service by moving subscribers from an outage–inflictedlayer to a non–failed layer, in a timely fashion, further enhances theavailability of the system. In this situation, full RF service would still beavailable, but potentially at a degraded grade of service (in other words,more blocking). Once the subscribers supported by the failed CBSChave been manually relocated to another layer, this allows more time totroubleshoot the root cause of the outage since it is no longer necessaryto immediately restore service to the failed CBSC. Therefore, as anadded benefit, the layered CBSC approach enables a more thoroughanalysis in troubleshooting the root cause of outages.
2

CBSC Capacity Management Options – continued
June 2001 2-49CDMA SC Products System Resource Guide (CSSRG)
Figure 2-19: System Redundancy in a Layered CBSC Architecture
Switch#1 CBSC#1BTS
F3, F4
Subscribers
Switch#2 CBSC#2BTS
F1, F2
a bc
Co-locatedBTS Frames
In a non–layered approach, there is no CBSC–level or system–levelredundancy built into the system design. If a CBSC fails, a hole incoverage results which causes 100% of the active calls to drop and 100%of the idle mobiles to lose service in the area of the BTSs controlled bythe failed CBSC.
Disaster Recovery
In a layered overlay approach, the system can be designed with thehardware to support the different CBSC/EMX layers located in differentphysical MTSO building locations. With this type of system design,creating and implementing a disaster recovery plan is significantlysimplified.
In a non–layered approach, designing and implementing a disasterrecovery plan could be very difficult.
Maintenance and Upgrade
In a layered overlay approach, scheduled maintenance and softwarerelease upgrades can be performed with zero downtime with propermaintenance operation procedure planning. The maintenance window, toconduct outage–related activities, can be significantly extended since anactual outage won’t occur due to service being reallocated to anotherlayer prior to performing an outage activity. New software releases canalso be deployed to one layer at a time with zero downtime and with anextended maintenance window timeframe. A thorough analysis and soakperiod can be performed on one layer, which limits the potentialsubscriber impact prior to deploying it to another layer. For largesystems, the software release upgrade process is significantly reduceddue to the extended maintenance window timeframe, which has thepotential to reduce an upgrade task that would normally take severalweeks down to several days.
In a non–layered approach, scheduled outage related maintenanceactivities still need to be performed in the limited maintenance window
2

CBSC Capacity Management Options – continued
CDMA SC Products System Resource Guide (CSSRG) June 20012-50
timeframes. This will also apply to software release upgrades as well. Asthe number of CBSCs in a system significantly grows, the ability toperform a system software release upgrade becomes difficult to managewithin the timeframes of the limited maintenance windows. For largesystems, the software release upgrade process may take several weeks tocomplete in order to minimize subscriber impact by managing theupgrade process within the required maintenance window timeframes(typically on weekends only).
Adding a New CBSC
In a layered overlay approach, adding a new CBSC to an existinglayered CBSC network allows a combination of several previousadvantages (database management, optimization, and extendedmaintenance windows) to be implemented to simplify the deploymentprocess. Since the subscriber impact is minimized, a thoroughverification testing and optimization process can be performed due to theextended maintenance window timeframe. Assuming there is enoughcapacity on the other layers during the extended maintenance windowtimeframe, drive testing BTSs re–parented to new CBSC hardware onone layer can be performed with test mobiles without affectingsubscriber service on the other layer(s). This allows a more gradualimplementation of new hardware into the network as opposed to a flashcut type of approach that is typically used.
In a non–layered approach, adding a new CBSC to an existingnon–layered network combines all of the previously stated disadvantagesinvolving database management, optimization, and limited maintenancewindows on top of the requirement of deploying a CBSC with the flashcut approach. The flash cut approach is a high–stress, high–risk,complex activity. However, it can also be a very effective deploymentapproach if it is planned and implemented properly.
CBSC Capacity
In a layered overlay approach, the capacity of the CBSC is more likelyto stabilize at a certain level once the layer has matured to the pointwhere adding new CBSCs is no longer necessary to handle the capacityof the layer. At this point, the call model of the CBSC should stabilizewhich in turn should stabilize the Erlang capacity of all of the CBSCs onthe layer.
In a non–layered approach, the frequency of adding new CBSCs orperforming load balancing re–parenting activities increases. This alsoimpacts the call model of the CBSC. As the number of BTSs per CBSCdecreases, the amount of ICSHO and registration activity typicallyincreases which, depending upon the system design, can have asignificant negative effect on the overall CBSC Erlang capacity.
Carrier Overflow Trunking Efficiency
In a non–layered approach with a four–carrier BTS, all of the MCCchannel card resources are available to all of the four carriers through the
2

CBSC Capacity Management Options – continued
June 2001 2-51CDMA SC Products System Resource Guide (CSSRG)
overflow option in the setup of the in–route table. When all of the trafficchannels on any one carrier are busy, any new incoming call is assignedto one of the other three carriers as configured in the in–route table. Thisallows for a higher carrier overflow trunking efficiency whenimplemented properly.
In a layered overlay approach, the pool of traffic channel resources islimited by the number of carriers on the layer. For example, if the systemis designed with two carriers per layer, overflow is still permitted, but itis only from one carrier to another (in other words, from F1 to F2 or viceversa). The carrier overflow trunking efficiency for a two–carrier case islower than that of the four–carrier case. Therefore, a layered CBSCoverlay approach with less than four carriers per layer has a lower carrieroverflow trunking efficiency than that of a four–carrier BTS.
Summary
Table 2-5 summarizes the advantages and disadvantages of the LayeredCBSC approach as opposed to system expansion without layering theCBSCs.
Table 2-5: Summary of Advantages and Disadvantages of the layered CBSC approach
Topic Layered CBSC Expansion Expansion without Layering
CBSC Coverage Area Maximizes BTSs per CBSCcoverage area
Minimizes BTSs per CBSCcoverage area
Optimization Minimal efforts where CBSCborders are aligned between layers
Re–optimizing required as borderschange frequently
Database Management No major changes for matchinglayers, potential BTS ID re–use iflayered EMXs and OMC–Rs areimplemented
Constant modification to neighborlists, ICSHO, etc. for re–parenting
System Redundancy System/CBSC redundancymaintains degraded service duringoutage, subscribers can be movedto another layer to troubleshootoutage
No System/CBSC redundancy
Disaster Recovery Built in if CBSC/EMX hardwareis located in different buildings
Difficult to design and implement aplan
Maintenance and Upgrade Allows an extended maintenancewindow and zero downtime withproper planning
Downtime required during a limitedmaintenance window
Adding new CBSC Easier to test and deploy with agradual cutover of new hardware
More difficult to deploy due to database, optimization, and flashcutover of new hardware
. . . continued on next page
2

CBSC Capacity Management Options – continued
CDMA SC Products System Resource Guide (CSSRG) June 20012-52
Table 2-5: Summary of Advantages and Disadvantages of the layered CBSC approach
Topic Expansion without LayeringLayered CBSC Expansion
CBSC Capacity Potential to stabilize at the currentcapacity level
Potential reduction in capacity withincreasing ICSHO and registrationactivities
Carrier Overflow TrunkingEfficiency
Carrier overflow may be limited if< four carriers per layer
No carrier overflow limitations
Partial CBSC Overlay Design
Multiple carriers/layers may be required in high traffic areas to supportthe traffic demands. However, multiple carriers/layers may not benecessary in remote areas. A remote area may only need one or twocarriers to handle the relatively small traffic requirement. As a result, ahard handoff needs to be established between the multiple carriers on themultiple layers in the core area and a single layer in the remote area.Figure 2-20 shows a diagram of an example of going from multiplelayers (two carriers per layer) to a single layer.
Figure 2-20: Inter–CBSC Handoff from Multiple Layers to a Single Layer
CBSC 1
ICSHO
ICSHO
F1 & F2CBSC 2F1 & F2
CBSC 4F3 & F4
CBSC 5F3 & F4
CBSC 6F5 & F6
CBSC 7F7 & F8
CBSC 3F1 & F2
DAHO
DAHO
DAHO
ICSHO
DAHO Approach
CBSC 1
ICSHO
ICSHO
F1 & F2CBSC 2F1 & F2
CBSC 4F3 & F4
CBSC 5F3 & F4
CBSC 6F5 & F6
CBSC 7F7 & F8
CBSC 3F1 & F2
ICSHO
MAHO Approach
Multiple Layered CBSCs Single Layer CBSC
ÎÎÎÎÎÎÎÎÎÎÎÎ
ÎÎÎÎÎÎÎÎÎÎÎÎÎÎÎ
Pilot Beacon
Pilot Beacon
2

CBSC Capacity Management Options – continued
June 2001 2-53CDMA SC Products System Resource Guide (CSSRG)
For the CBSCs operating on the same carrier frequency, inter–CBSC softhandoff are enabled. For CBSCs operating on different carrierfrequencies, a DAHO approach or a MAHO approach with pilot beaconsshould be utilized to initiate an inter–CBSC hard handoff in order toswitch carrier frequencies. In general, the MAHO using pilot beaconsapproach is preferred for better call reliability (fewer dropped calls) andperformance. The pilot beacon can be established by using an actualBTS sector hardware or using a standalone pilot beacon unit. Frequencyhopping pilot beacon units (when available) are highly recommended forthese applications. As a result, the handoff methods to transition fromfour layers (two carriers each) to a single layer is listed in Table 2-6 (forthe same example in Figure 2-20).
Table 2-6: Handoff Transition Method Example
Originated Carrier From four layers to two layer From two layers to one layer
F1 / F2 F1 / F2 (soft handoff) F1 / F2 (soft handoff)
F3 / F4 F3 / F4 (soft handoff) F1 or F2 (hard handoff)
F5 / F6 F1 or F2 (hard handoff) F1 / F2 (soft handoff)
F7 / F8 F3 or F4 (hard handoff) F1 or F2 (hard handoff)
Handoff Transition Method Example
In the reverse direction from one–layer rural sites to multiple–layer coresites, the subscriber unit transitions through the system usinginter–CBSC soft handoff, staying on the same layer that the calloriginated on while in the rural area. Once the subscriber terminates thecall in the core area, the mobile tunes to the appropriate carrier frequencyand layer, based on the hashing algorithm. If the mobile traverses thereverse direction in the idle mode, the mobile:
� Crosses the boundary between CBSCs
� Gets a new CDMA Channel List Message
� Re–calculates the hashing algorithm
� Retunes to the corresponding carrier frequency and layer.
Uneven Overlay
For some situations, the traffic demand requires only one carrier to bedeployed onto a new layer. Because of lower traffic density (one carrierper CBSC), the CBSC(s) supporting the new one–carrier layer typicallyhave a larger coverage area than that of the CBSC(s) serving themulti–carrier layer. It is very likely that the CBSCs footprints betweenlayers may not match. A diagram depicting this type of configurationusing two carriers per layer is shown in Figure 2-21. Again, it isrecommended to use a pilot beacon unit to initiate the inter–CBSC hardhandoff between the F3 carrier down to the F1 or F2 carrier.
2

CBSC Capacity Management Options – continued
CDMA SC Products System Resource Guide (CSSRG) June 20012-54
Figure 2-21: Uneven CBSC overlay in the third Carrier Application
CBSC 1 ICSHO
F1 & F2CBSC 2F1 & F2
CBSC 3F1 & F2
ICSHO
ÎÎÎÎÎÎÎÎÎÎÎÎ
Pilot Beacon
DAHO Approach
CBSC 4F1 & F2
ICSHO
DAHO DAHO
CBSC 1 ICSHO
F1 & F2CBSC 2F1 & F2
CBSC 3F1 & F2
ICSHO
CBSC 5F3
MAHO Approach
CBSC 4F1 & F2
ICSHO
ÎÎÎÎÎÎÎÎÎÎÎÎ
Pilot Beacon
CBSC 5F3
It should be noted that utilizing an uneven overlay approach does addsome complexity to the deployment process of this approach. Since theCBSC borders from the initial layer to the uneven overlay layer are notaligned, the process used to create the neighbor list databases for theuneven overlay layer is more difficult to generate from the initial layer.The advantage of essentially duplicating most of the already optimizedparameters and neighbor lists from the initial layer is significantlyreduced. This also causes some additional effort required in thedeployment process of an uneven layer in order to optimize the areaswhere the borders do not align with the initial layer.
Part of this process involves the optimization of a DAHO border or aMAHO with pilot beacon border which can be a challenging effortdepending upon the system design. However, the optimization of DAHOor MAHO with pilot beacon borders is not unique to the layered CBSCdeployment approach. This same type of optimization is required withany non–uniform RF carrier deployment. Finally, the uneven overlaidapproach can also add some complexity to the design andimplementation of paging areas to the system. This is especially true, if alayered MSC approach is also used where two different MSC switchesare used to support the two different layers.
Other Issues to Consider
Current multiple carrier assignment and carrier overflow features aretypically not designed to function across different CBSCs. For example,the round robin carrier assignment access feature which can be used in
2

CBSC Capacity Management Options – continued
June 2001 2-55CDMA SC Products System Resource Guide (CSSRG)
an attempt to evenly distribute access attempts in a multiple carriersystem currently won’t work across different carriers on differentCBSCs. For a layered CBSC system, the mobile hashing method has tobe used. This method has been shown to be fairly effective at evenlydistributing traffic across all of the carriers of a multiple carrier system.However, for a system with two CBSC layers and two or more carriersper layer, it is possible to use mobile hashing to distribute trafficbetween layers and use the round robin approach to distribute trafficbetween the carriers within the layer. Any future features which attemptto provide load detection and balancing across carriers also need tofunction across multiple CBSCs in order for it to be compatible with theLayered CBSC approach. In addition, the carrier overflow feature whichallows a blocked access attempt on one carrier to overflow to anothercarrier currently won’t work across carriers on different CBSCs. Similarto the round robin feature, the carrier overflow feature works for multiplecarriers within one layer, which is controlled by one CBSC. In a layeredCBSC system, this has an effect of reducing the overall trunkingefficiency of the system since blocked calls won’t be able to overflowfrom one layered CBSC to another.
For systems using different BTS product lines for different layers, thesharing of antennas becomes a more difficult task to implement (if it iseven possible). Different BTS product lines may not be compatible toeasily allow the sharing of Rx and/or Tx antennas between multipleframes co–located at the same location. If a redundant antenna scheme isnot used, the appropriate splitting and combining of the RF paths to theRx and/or Tx antennas can be difficult to implement without degradingthe performance of one or both of the co–located BTS frames. Refer tothe latest version of the CDMA RF Planning Guide for more informationon some of the pre–approved antenna combining configurations formultiple frame SCTM BTS products. If a redundant antenna scheme isused, there is an extra level of redundancy provided by the second set ofantennas used for the second layer. The reduction in redundancy alsoapplies to the GPS antenna. One GPS antenna can be used to feedmultiple co–located BTS frames with a loss of GPS antenna redundancy.Obviously, the more redundancy implemented with the layered CBSCapproach, the more it costs to deploy due to the added hardware. Thelevel of redundancy required depends upon the level desired by theservice provider.
For systems utilizing a four–carrier BTS product, the typical layeredCBSC deployment approach is to implement all of the four carriers ofthe first BTS frame before adding a new layer with a second frame. Thiscreates a disproportionate amount of traffic being served by the twodifferent layers (in other words, four carriers on one layer and one carrieron the new layer). Since the new one–carrier layer won’t be able tosupport the traffic capabilities of the existing four–carrier layer, thisreduces the redundancy benefit provided by the layered approach, wherethe four–carrier BTS frame might have an outage that the one–carrierframe (or layer) won’t be able to provide adequate redundant support.For long term planning and growth, an ideal scenario would be to launcha system with a four carrier BTS for carrier one on CBSC layer one, and
2

CBSC Capacity Management Options – continued
CDMA SC Products System Resource Guide (CSSRG) June 20012-56
deploy a second four–carrier BTS for carrier two on CBSC layer two. Asthe system grows, one can alternate the addition of a carrier from onelayer to the next, which automatically balances the load between layerswhen an even number of carriers exists in the system. Of course, thenegative side of this approach is the cost associated with deploying thesecond carrier with a complete overlay of CBSCs and BTSs. There arealso some ways to achieve some of the benefits of a layered approachwith a non–ubiquitous overlay system. For long term planning, a view ofwhat the network will look like in the future helps determine when alayered approach is beneficial.
For systems utilizing two SCTM 9600 modem frames feeding only onehigh–power LPA frame, there is a reduction in BTS redundancy sincethe one LPA frame is controlled by only one of the modem frames. Thetwo modem frames can be controlled by two different CBSC layers butif only one LPA frame is used, there is no LPA redundancy. For thisconfiguration, the second modem frame is added with an LPA in a ghostmode where the first modem frame has full control and alarmingfunctionality of the one LPA.
Within 800 MHz cellular systems, if the layer with the CBSC whichcontrols the primary channel goes out of service, all of the currentmobiles using the primary channel and all of the future mobilesattempting to acquire service from the primary channel are redirected toanalog service.
XC Upgrades
There are several upgrades in the product roadmap of the CBSC toincrease the Erlang capacity of the XC. Some of the major plannedcapacity upgrades are:
� Upgrade from KSW cards to DSW cards
� Upgrade from GPROC cards to EGP cards
� Upgrade from an 8 cage maximum to a 12 cage maximumconfiguration.
The upgrade from KSWs to DSWs allows a Standard XC configurationto use a maximum of six XCDR cards per cage. The upgrade fromGPROCs to EGPs in conjunction with the DSW upgrade allows aStandard XC configuration to use a maximum of seven XCDR cards percage. Finally, an upgrade from 8 to 12 cages allows a maximum Erlangcapacity of the XC to exceed 1800 Erlangs (see Table 2–1 for moredetails).
Additional details regarding specific modifications to the Standard XCconfiguration are provided in the software release–specificCBSC/OMC–R Equipment Planning Guide as each of these upgrades arerolled out.
Helix to Puma MM Upgrade
Another option used to add MM processing capacity to a system is toupgrade a Helix MM to a Puma MM. As far as CPU processing capacity
2

CBSC Capacity Management Options – continued
June 2001 2-57CDMA SC Products System Resource Guide (CSSRG)
is concerned, the Puma MM (R10K model) is projected to increase thecall processing capacity by a factor of 1.9 times that of the Helix MM.For example, if the call model performance of a Helix MM produced an85% CPU maximum capacity limit of 600 Erlangs, a Puma MMoperating under the same call model conditions would have an 85% CPUmaximum capacity limit of 1140 Erlangs. Under these conditions, theCPU capacity of the new Puma MM may no longer be the limiting factorof the CBSC. The CBSC may now be XC–limited. Therefore, the 1140Erlangs in the previous example may not be the new maximum capacitylimit to use for planning purposes.
With a Puma MM using a standard Helix transcoder configuration,typically the CBSC is now XC hardware limited by either the KSW portand/or the XCDR card capacity. The new CBSC capacity limit dependsupon the system–specific XC configuration. Capacity enhancing featuresare being planned for future releases which are projected to expand thecurrent XC and Puma MM capacity limitations to support around 1800Erlangs (the actual limit depends upon the call model performance of thesystem).
As a result, the actual Erlang capacity benefit that can be achieved froma Helix to Puma MM upgrade must be analyzed on a case–by–case basis,depending upon the specific system configuration and the availability ofcertain capacity enhancing features for the MM or XC at the time of theupgrade.
2

CBSC Capacity Monitoring
CDMA SC Products System Resource Guide (CSSRG) June 20012-58
Introduction
The MM processing capacity can be the limiting factor of the CBSC. Asa result, various call model performance parameters which have animpact on the MM capacity should be monitored on a periodic basis andstored for future trending and analysis purposes. Although the MM orXC is typically the limiting factor, some of the other devices within theCBSC should also be monitored on a periodic basis and verified that itscapacity is within the defined limits. Data for the other devices shouldalso be stored for future trending and analysis purposes. The followingsections identify the data that should be monitored, verified to be withinlimits, and stored.
Most of the data recommended to be monitored comes from output ofSQL scripts. The SQL scripts have been developed by a SuperCellSystem performance group to provide CPU and link utilization estimatesdirectly related to measured traffic intensity. Estimated device utilizationis reported with no additional equipment required (no sniffers, nomonitors, etc.) and with no additional software in the network devices(no added statistics, no code instrumentation, etc.). The scripts simplyuse existing PM traffic intensity measurements which are combined withworkload model specifics hard–coded into the SQL scripts. The SQLscripts are CBSC system software release dependent and are typicallysetup to run on the AP/SC UNO or UNO offline platform. For MotorolaSystems Engineers, the release dependent scripts can be found at theSuperCell System performance group’s internal Motorola web pagecurrently at the following URL:
http://scwww.cig.mot.com/people/platform/ArchPerf/performance/
Look under the Estimating Device Utilization – AP SQL Scripts link inthe Tools section. For more information on the setup and usage of thesescripts refer to the above web page. Service providers can contact theiraccount team Systems Engineer for copies of the SQL scripts and formore information.
Monitoring Levels
Implement a two–level approach to CBSC capacity monitoring:
� Level 1 is recommended when the CBSC is operating below theplanning limit (for an MM– or XC–limited CBSC). Since the CBSCis operating below the planning limit, it is not as critical to monitor alarge amount of data, so a smaller time frame of data is analyzed andon a less frequent basis.
� Level 2 is recommended when the CBSC is operating above theplanning limit (for an MM– or XC–limited CBSC) and is approachingthe maximum limit. As the CBSC approaches its maximum limit, it isimportant to monitor the CBSC more closely to verify the capacityperformance under a heavily loaded condition. As a result, Level 2monitoring requires a larger time frame of data to be analyzed and ona more frequent basis. Since it is recommended to utilize the planning
2
CBSC Capacity Monitoring – continued
June 2001 2-59CDMA SC Products System Resource Guide (CSSRG)
limit to forecast when CBSC capacity relief is required, Level 2monitoring may not be necessary, if CBSC capacity relief options areactually implemented at or near the CBSC planning limit.
The following sections provide both Level 1 and Level 2 monitoringrecommendations for the timeframe of data, which type of data shouldbe collected, and the frequency of how often to process or analyze theparticular data.
MM CPU Monitoring
There are two sets of data that should be monitored and stored for MMCPU monitoring:
� The first set of data comes from the MM_UTIL_PERIOD SQL script.This script provides the key statistics associated with the call modelperformance of the MM.
� The second set of data comes from the System Activity Report (SAR)which comes from a Tandem UNIX utility which monitors processorutilization and records CPU measurements data in ten minuteintervals.
The %idle data from the SAR report should be converted to a percentutilization by averaging the three or four %idle data points for aparticular half hour period and subtracting it from 100 (also see thesupporting information associated with [EQ 2–6]). The maximum MMutilization data derived from the SAR report should be monitored toverify that the MM utilization is less than the 70% planning limit and itshould not exceed the 85% maximum limit.
The performance of the MM should be validated by comparing the SARperformance of the MM against the call model projections. The SARdata that is collected for the busy periods should be compared to callmodel estimated utilization results from the MM_UTIL_PERIOD SQLscript. Comparing the SAR data against the call model predictions mayidentify an MM performing below expectations which may indicate apotential problem with that particular MM or it may indicate a need tofine tune the call model equation to achieve better accuracy. Anacceptable range for the delta between the SAR data and the call modelprediction is a delta that is lower than seven percentage points (whereSAR is greater than the call model prediction).
The ideal case is a delta around zero or if the SAR data is actually lowerthan the call model prediction. There is cause for concern if the delta isin the range of seven to ten percentage points and the actual utilization ofthe MM is close to the 70% planning limit. Contact a NetworkEngineering Services group or a development group to conduct aninvestigation into the performance of the MM if this occurs.
If the delta is greater than ten percentage points an investigation into theperformance of the MM should be performed, regardless of the actualutilization of the MM. At a minimum, the investigation performed onthe MM should analyze all of the processes and scripts running on theMM to verify that there are no extra non–call processing relatedprocesses or scripts running on the MM, which are not required.
2

CBSC Capacity Monitoring – continued
CDMA SC Products System Resource Guide (CSSRG) June 20012-60
For Level 1 monitoring, process and analyze the SAR andMM_UTIL_PERIOD data for each MM on a weekly basis. The SARdata timeframe is already designed to collect 24 hours of data, but aprocess needs to be implemented to save the data to an offline storagelocation on a daily basis. Set up the MM_UTIL_PERIOD data to collecta window of data (in half hour segments) around the normal busy hourof the day and saved on a daily basis. Usually, three hours of data (sixhalf hour segments) centered around the normal busy hour of the day isadequate to capture any busy hour fluctuations.
For Level 2 monitoring, process and analyze the SAR andMM_UTIL_PERIOD data for each MM on a daily basis. Set up theMM_UTIL_PERIOD data to collect and store a full 24 hours worth ofdata (48 half hours). Since the SAR data already collects 24 hours ofdata, no change is required to the SAR data collection process for Level2 monitoring.
CBSC Rate Overload Parameters Monitoring
The CBSC rate overload parameters are designed to prevent the MMfrom reaching dangerously high CPU utilization by discardingoriginations, page acknowledgments, pages, and registrations once theMM reaches a specified call volume threshold. The parameters controlthe weighting and threshold used for the detection of admission rateoverload and thresholds used for clearing of admission rate overloadalarms and shedding.
Some of the rate overload parameters are dependent upon the current callmodel performance of the MM. If the rate overload parameters are setproperly, the overload algorithm should shed traffic at the desiredmaximum MM utilization percentage (approximately), which is basedupon the real time admission rate levels of originations, pageacknowledgments, pages, and registrations. Table 2-7 provides a list ofthe recommended values for the rate overload parameters for thedifferent available MM types.
Table 2-7: Recommended Values for the Rate Overload Parameters
CLI Field Parameter Name Helix MM Puma MM R10K
ORIG W Origination Weighting Factor Adjusteda Adjusteda
PAGEACK W Page Acknowledgment Weighting Factor Adjustedb Adjustedb
REG W Registration Weighting Factor 6 3
PAGE W Page Weighting Factor 13 7
PAGE W (UDP) Page Weighting Factor (for UDP mode) 3 2
CALL DEC Call Decrement Amount 820d 820d
CALL T Call Denial Threshold Adjustedc Adjustedc
. . . continued on next page
2

CBSC Capacity Monitoring – continued
June 2001 2-61CDMA SC Products System Resource Guide (CSSRG)
Table 2-7: Recommended Values for the Rate Overload Parameters
CLI Field Puma MM R10KHelix MMParameter Name
REG DEC Registration Decrement Amount 250 250
REG T Registration Denial Threshold 490 490
AGG DEC Aggregate Decrement Amount 820d 820d
AGG T Aggregate Denial Threshold Adjustedc Adjustedc
CLR INTERVAL Clear Interval 60 60
SHED PAGE Page Message Shedding Y Y
AFD W (UDP) Authentication and Feature DeliveryWeighting Factor
3 2
AFD DIST W (UDP) Authentication and Feature DeliveryDistributed Weighting Factor
3 2
NOTEa Calculated from the OrigWeight_Period SQL scriptb Calculated from the PageAckWeight_Period SQL scriptc Calculated from the CallAdmThld_Period SQL scriptd A value of 820 reflects a recommended maximum utilization of 85%
Since the call model performance of the MM can change as the systemgrows (in other words, system design changes for growth expansion,subscriber usage pattern changes, etc.), some of the rate overloadparameters need to be adjusted on a periodic basis, so the algorithm canaccurately reflect the current call model performance and shed traffic atthe desired level. The OrigWeight_Period, PageAckWeight_Period, andCallAdmThld_Period SQL scripts are used to monitor the current callmodel performance of the system and calculates the rate overloadparameters for ORIG W, PAGEACK W, CALL T, and AGG T. Thecalculated CallAdmThld value should be used for both, the CALL T andAGG T parameter settings.
Set up these scripts to collect busy hour data for each MM on a dailybasis. If a particular MM operates below the 70% planning limit (Level1), compare the calculated parameters from the script outputs to thecurrent rate overload settings on a weekly basis. Make adjustments to therate overload settings if there is a difference between the current and newsettings of +/– 10%. If a particular MM is operating above the 70%planning limit (Level 2), compare the calculated parameters from thescript outputs to the current rate overload settings on a daily basis.Adjustments to the rate overload settings should be made if there is adifference between the two settings of +/– 10% for two consecutive daysin a row. Abnormal or anomalous data should be investigated andeliminated from the analysis.
2

CBSC Capacity Monitoring – continued
CDMA SC Products System Resource Guide (CSSRG) June 20012-62
CPP Monitoring
Use the CPP_UTIL_PERIOD SQL script to monitor the estimatedutilization of the CPPs. Monitor the maximum CPP utilization derivedfrom the SQL script to verify that the CPP utilization is less than the70% planning limit. It should not exceed the 85% maximum limit. If theCPP is measured by the SQL script to be greater than the 70% planninglimit, perform an analysis to determine if the CPP is the limiting factorof the CBSC.
For Level 1 monitoring, set up the CPP_UTIL_PERIOD script to collecta window of data (in half hour segments) around the normal busy hourof the day. Save this data on a daily basis. Usually, three hours of data(six half hour segments) centered around the normal busy hour of theday is adequate to capture any busy hour fluctuations. Although the datais collected and stored on a daily basis, monitoring the data on a monthlybasis to verify the CPP utilization is below the planning limit isadequate.
For Level 2 monitoring, set up the CPP_UTIL_PERIOD script to collectand store a full 24 hours worth of data (48 half hours). Also, monitor thedata on a daily basis to verify the CPP utilization is below the planninglimit.
FEP Monitoring
For FEP monitoring, know the BTS to FEP layout assignments for eachCBSC prior to setting up the scripts. As new BTSs are added to thesystem and brought into service, change the script setup to add any newBTSs. If any configuration changes are made to the BTS to FEP layout,modify the script setup accordingly. There are three SQL scripts thatneed to be set up:
� The BTS_FEP_UTIL_PERIOD SQL script estimates the portion ofFEP utilization attributed to supporting the BTS links assigned to eachindividual FEP.
� The CPP_FEP_UTIL_PERIOD SQL script estimates the portion ofFEP utilization attributed to supporting a CPP link (used only if a FEPis configured to support a CPP link). Apply the output from the CPPscript to all FEPs supporting a CPP link.
� The IC_FEP_UTIL_PERIOD SQL script estimates the portion of FEPutilization attributed to supporting ac IC link (used only if a FEP isconfigured to support an IC link). Apply the output from the IC linkscript to all FEPs supporting an IC link.
If a FEP is equipped to support a CPP link, add the resultant utilizationestimates from the BTS_FEP_UTIL_PERIOD andCPP_FEP_UTIL_PERIOD SQL scripts together to get the finalutilization estimate for the individual FEP. If a FEP is configured tosupport an IC link, add the IC_FEP_UTIL_PERIOD SQL script outputto the previous outputs for those FEPs supporting IC links. Monitor themaximum FEP utilization derived from the SQL script(s) to verify thatthe FEP utilization is less than the 70% planning limit. It should not
2

CBSC Capacity Monitoring – continued
June 2001 2-63CDMA SC Products System Resource Guide (CSSRG)
exceed the 85% maximum limit. If the FEP is measured by the SQLscript to be greater than the 70% planning limit, perform an analysis todetermine if the FEP is the limiting factor of the CBSC.
For Level 1 monitoring, set up the FEP scripts to collect a window ofdata (in half hour segments) around the normal busy hour of the day andsaved on a daily basis. Usually, three hours of data (six half hoursegments) centered around the normal busy hour of the day is adequateto capture any busy hour fluctuations. Although the data is collected andstored on a daily basis, monitor the data on a monthly basis to verify theFEP utilization is below the planning limit.
For Level 2 monitoring, set up the FEP scripts to collect and store a full24 hours worth of data (48 half hours). Also, monitor the data on a dailybasis to verify the FEP utilization is below the planning limit.
SS7 (A+) Link Monitoring
For SS7 (A+) link monitoring, there are two SQL scripts that need to beset up. The A+_UPLINK_PERIOD SQL script estimates the utilizationof each A+ link in the uplink direction which is defined as from the MMto MSC. The A+_DNLINK_PERIOD SQL script estimates theutilization of each A+ link in the downlink direction which is defined asfrom the MSC to MM. Monitor the maximum uplink or downlink A+link utilization derived from the SQL scripts to verify that the A+ linkutilization is less than 40%.
There are two SS7 cards in a CBSC. Each one is able to support up tofour links each (eight links total). It is recommended to add the A+ linksin pairs (one for each SS7 card). Since the SS7 subsystem provides loadbalancing across all of the links, the maximum utilization for the A+ linkis set to 40% to allow for an SS7 card failover condition, where eachlink in failover mode needs to support an 80% maximum utilization loadin the event of an SS7 card failure. If the A+ link is measured by theSQL script to be greater than the 40%, perform an analysis to determineif the A+ link is the limiting factor of the CBSC and to determine if anadditional set of A+ links are required.
For Level 1 monitoring, set up the SS7 (A+) link scripts to collect awindow of data (in half hour segments) around the normal busy hour ofthe day and saved on a daily basis. Usually, three hours of data (six halfhour segments) centered around the normal busy hour of the day isadequate to capture any busy hour fluctuations. Although the data iscollected and stored on a daily basis, monitor the data on a monthlybasis to verify the FEP utilization is below the planning limit.
For Level 2 monitoring, set up the SS7 (A+) link scripts to collect andstore a full 24 hours worth of data (48 half hours). Also, monitor the dataon a daily basis to verify the SS7 (A+) link utilization is below theplanning limit.
Inter–CBSC Soft Handoff Link Monitoring
There are two monitoring processes that need to be performed in order toadequately monitor the Inter–CBSC soft handoff (IC) links:
2

CBSC Capacity Monitoring – continued
CDMA SC Products System Resource Guide (CSSRG) June 20012-64
� Monitor the amount of inter–CBSC soft handoff traffic
The first process involves monitoring the amount of inter–CBSC softhandoff traffic occurring on the links and applying normal trafficengineering practices in order to obtain the established, desired gradeof service (GOS). Once a desired GOS has been established, use the“Inter–CBSC Soft Handoff Trunk Group Traffic Report” (which ispart of the “PMSHO” CDMA statistics report tool output) to monitorthe traffic on the links.
� Monitor IC link control channel utilization
The second process for monitoring IC links involves monitoring thecontrol channel utilization of the IC links. Although it is typicallyunder utilized and not anticipated to be a problem, this is an areawhere an SQL script needs to be developed which estimates theutilization of the control channel for an IC link.
BTS LAPD Link Monitoring
For each BTS link, monitor the utilization of the LAPD control channelon a periodic basis. There are two SQL scripts that need to be set up:
� The LAPD_BTS_UPLINK_UTIL_PERIOD SQL script
Estimates the LAPD utilization in the uplink direction which isdefined as from the BTS to the CBSC.
� The LAPD_BTS_DNLINK_UTIL_PERIOD SQL script
Estimates the LAPD utilization in the downlink direction which isdefined as from the CBSC to the BTS.
Monitor the maximum uplink or downlink LAPD utilization derivedfrom the SQL scripts to verify that the utilization is less than 80%.Typically, the utilization of the LAPD control channel should be betweenfive and 40 percent. If the LAPD utilization is measured by the SQLscript to be greater than 80%, perform an analysis to determine if theLAPD link is a limiting factor.
For Level 1 monitoring, set up the BTS LAPD link scripts to collect andstore a full 24 hours worth of data (48 half hours) for the typical busyday of the month, on an every other month basis (bi–monthly).
For Level 2 monitoring, set up the BTS LAPD link scripts to collect andstore a full 24 hours worth of data (48 half hours) for the typical busyday of the month on a monthly basis.
Summary of CBSC Monitoring
Table 2-8 shows a summary of the utilities or SQL scripts that need to beset up in order to monitor the various aspects of the CBSC.
2

CBSC Capacity Monitoring – continued
June 2001 2-65CDMA SC Products System Resource Guide (CSSRG)
Table 2-8: Summary of CBSC Monitoring
Level 1 Level 1 Time Level 2 Level 2 Time
Utility or SQL Script Frequency Frame Frequency Frame
SAR Utility Weekly 24 Hours Daily 24 Hours
MM_UTIL_PERIOD Weekly Busy Hour Daily 24 Hours
CPP_UTIL_PERIOD Monthly Busy Hour Daily 24 Hours
BTS_FEP_UTIL_PERIOD Monthly Busy Hour Daily 24 Hours
CPP_FEP_UTIL_PERIOD Monthly Busy Hour Daily 24 Hours
A+_UPLINK_PERIOD Monthly Busy Hour Daily 24 Hours
A+_DNLINK_PERIOD Monthly Busy Hour Daily 24 Hours
LAPD_BTS_UPLINK_UTIL_PERIOD Bi–monthly 24 Hours Monthly 24 Hours
LAPD_BTS_DNLINK_UTIL_PERIOD Bi–monthly 24 Hours Monthly 24 Hours
OrigWeight_Period Weekly Busy Hour Daily Busy Hour
PageAckWeight_Period Weekly Busy Hour Daily Busy Hour
CallAdmThld_Period Weekly Busy Hour Daily Busy Hour
Summary of CBSC Monitoring
Because the SQL scripts generate a great deal of data, it is highlyrecommended to create an automated script/process to condense andreformat the data for storage, trending, and monitoring purposes.
2
CBSC Capacity Monitoring – continued
CDMA SC Products System Resource Guide (CSSRG) June 20012-66
Notes
2

June 2001 CDMA SC Products System Resource Guide (CSSRG)
Chapter 3: Base Transceiver Station (BTS)
Table of Contents
Base Transceiver Station (BTS) 3-1. . . . . . . . . . . . . . . . . . . . . . . . . . . . . . . . . . . . . Introduction 3-1. . . . . . . . . . . . . . . . . . . . . . . . . . . . . . . . . . . . . . . . . . . . . .
BTS Expansion 3-9. . . . . . . . . . . . . . . . . . . . . . . . . . . . . . . . . . . . . . . . . . . . . . . . . . Introduction 3-9. . . . . . . . . . . . . . . . . . . . . . . . . . . . . . . . . . . . . . . . . . . . . . BTS Expansion – Coverage 3-10. . . . . . . . . . . . . . . . . . . . . . . . . . . . . . . . . . BTS Expansion – Traffic 3-11. . . . . . . . . . . . . . . . . . . . . . . . . . . . . . . . . . . . RF Optimization 3-24. . . . . . . . . . . . . . . . . . . . . . . . . . . . . . . . . . . . . . . . . .
BTS Products – other than Japan 3-26. . . . . . . . . . . . . . . . . . . . . . . . . . . . . . . . . . . . Introduction 3-26. . . . . . . . . . . . . . . . . . . . . . . . . . . . . . . . . . . . . . . . . . . . . . SC9600 3-27. . . . . . . . . . . . . . . . . . . . . . . . . . . . . . . . . . . . . . . . . . . . . . . . . SC4800 (excluding the SC4812) 3-33. . . . . . . . . . . . . . . . . . . . . . . . . . . . . . SC4812 3-37. . . . . . . . . . . . . . . . . . . . . . . . . . . . . . . . . . . . . . . . . . . . . . . . . SC2400/2450 3-43. . . . . . . . . . . . . . . . . . . . . . . . . . . . . . . . . . . . . . . . . . . . . SC614/SC614T/SC604 3-46. . . . . . . . . . . . . . . . . . . . . . . . . . . . . . . . . . . . . SC611/SC601 3-49. . . . . . . . . . . . . . . . . . . . . . . . . . . . . . . . . . . . . . . . . . . . SC300 3-51. . . . . . . . . . . . . . . . . . . . . . . . . . . . . . . . . . . . . . . . . . . . . . . . . . Reduction of BTS Offerings 3-54. . . . . . . . . . . . . . . . . . . . . . . . . . . . . . . . .
BTS Products – for Japan 3-56. . . . . . . . . . . . . . . . . . . . . . . . . . . . . . . . . . . . . . . . . . Introduction 3-56. . . . . . . . . . . . . . . . . . . . . . . . . . . . . . . . . . . . . . . . . . . . . . SC4840 3-56. . . . . . . . . . . . . . . . . . . . . . . . . . . . . . . . . . . . . . . . . . . . . . . . . SC2440 3-60. . . . . . . . . . . . . . . . . . . . . . . . . . . . . . . . . . . . . . . . . . . . . . . . . SC340 3-63. . . . . . . . . . . . . . . . . . . . . . . . . . . . . . . . . . . . . . . . . . . . . . . . . .
Pilot Beacon 3-67. . . . . . . . . . . . . . . . . . . . . . . . . . . . . . . . . . . . . . . . . . . . . . . . . . . . Introduction 3-67. . . . . . . . . . . . . . . . . . . . . . . . . . . . . . . . . . . . . . . . . . . . . .
3

Table of Contents – continued
CDMA SC Products System Resource Guide (CSSRG) June 2001
Notes
3

Base Transceiver Station (BTS)
June 2001 3-1CDMA SC Products System Resource Guide (CSSRG)
Introduction
For CDMA systems, the Base Station System (BSS) itself is comprisedof two parts:
� A Centralized Base Station Controller (CBSC)
� A number of Base Transceiver Stations (BTS).
The BTS is an essential part of a Base Station System (BSS) and is theinterface between the Centralized Base Station Controller (CBSC) linesand the site antennas.
The BTS may consist of many variations. It is not possibleto detail all these variations in this topic. Please refer to thedocumentation for the particular BTS to be installed forspecific details.
NOTE
The functions of the BTS are:
� Routes voice and data traffic to and from the Public SwitchedTelephone Network (PSTN) through the CBSC.
� Supports the network interface with the CBSC in order to send andreceive traffic and control information
� Provides a transmit and receive air interface between a personalcommunication subscriber unit and the CBSC
� Reports the results of alarms and self–diagnostic routines for systemfault management.
A separate Japan CDMA (JCDMA) test menu is includedfor JCDMA BTSs.
NOTE
Limiting Factors
Various BTS products exist and can be tailored for certain types ofapplications. These products include:
� Micro–cell BTS for small capacity micro–cell applications
� Macro–cell BTS for high–powered, high–capacity applications.
Some BTS products are designed for operation in certain frequency bands.Also, different BTS products are designed for different capacity growthcapabilities. The primary subelements of the BTS that may limit the capacityof the BTS are:
� CDMA RF air interface capacity
� Number of Walsh codes
3

Base Transceiver Station (BTS) – continued
CDMA SC Products System Resource Guide (CSSRG) June 20013-2
� Number of channel elements (MCC or MAWI cards) that can besupported
� Number of CDMA carrier frequencies that can be supported
� Site configuration (omni, three–sector, six–sector) that can besupported
� Number of frames/cabinets that can be supported
� Maximum PA power available
� Number of T1/E1 interfaces
� Control link statistics.
The capacity of the CDMA RF air interface is a physical limitation whichdetermines how many users can be supported via the air interface regardlessof the BTS product. This may limit how much traffic the BTS is ultimatelyable to support. Though more channels can be equipped at the site, theadditional subscribers using these channels increase the level of interferencewhich results in poor performance.
As traffic increases at a given site and the RF air interface capacity has notbeen reached, the site eventually begins blocking calls unless correctiveaction is taken. Blocking occurs because of a higher traffic demand thanwhat the site is currently able to handle. For example, there may not beenough channel elements.
In order to avoid blocking at the BTS level, the system designer mustimprove the traffic handling capacity of the BTS. The Systems Engineer caninvestigate the following several options that are available to increase theoffered traffic capability of the site or area:
� Equipping additional BTS channel elements (MCC or MAWI)
� Adding new CDMA carrier frequencies
� Changing the BTS configuration (omni, three–sector, six–sector)
� Deploying an additional site(s).
As a means to add new CDMA carrier frequencies to the site, the engineerneeds to ensure there is frequency spectrum available to use and that theexisting BTS can support the additional carriers. It’s possible that anotherframe or cabinet will be required at the site to house the new carrier.
A new site may be required to provide additional traffic capability in an areawhere there is blocking. The long–term requirement for the site should beconsidered so that an appropriate BTS product is selected.
The number of T1/E1 spans must also be considered. The T1/E1 span is thephysical connection between the BTS and the CBSC (transcoder cage). Thenumber of T1/E1 spans required is a function of the number of channelelements required. Refer to the specific BTS product documentation as to thenumber of T1/E1 connections that are possible. As a means to minimize thenumber of span lines required, three or four traffic channels can becompressed into one DS0 timeslot.
3

Base Transceiver Station (BTS) – continued
June 2001 3-3CDMA SC Products System Resource Guide (CSSRG)
Cell sites with E1 or T1–B8ZS (clear channel) span linescan compress four TCHs into one DS0. Cell sites withT1–AMI (non–clear channel) span lines can compress threeTCHs into one DS0.
NOTE
Determining Utilization
BTS utilization can be determined using the following threemeasurements:
� Walsh Code Usage
� Traffic Channel Usage
� Control Link Statistics.
Walsh Code Usage
The Performance Measurement (PM) record, pmC_20_hr for CarrierSector Channel Group Record (obtained from the OMC–R), contains agrouping of Carrier per Sector Channel Group level measurementcomponents. These measurements provide usage information on theresources within a Carrier per Sector Channel Group (for example,Walsh Code Usage).
Walsh codes, as applied here, represent a group of Walshcodes assigned to a carrier in a particular sector, for trafficchannel purposes only.
NOTE
The Walsh Code Usage field, peg count 2 from the pmC_20 record,indicates the total time, in seconds, that the Walsh code was in use (inother words, not on the idle list). This usage time includes the periodbetween disconnect and when the device is finally restored to an idlestatus. This measurement characterizes the distribution of carried trafficacross the sectors. Also, a percent softer handoff can be calculated.Together with the “Walsh Code Equipped” measurement, also containedin pmC_20, the number of Walsh codes can be “engineered” for thissector.
In the short term, Walsh codes may be used to artificially limit traffic ona per–sector basis until a more sophisticated pole response mechanismcan be created. Refer to the SC CDMA Product Family PerformanceAnalysis manual for further information.
Traffic Channel Usage
Refer to the following BTS Expansion section for informationconcerning Traffic Channel Usage and Traffic Channel Element Capacityplanning.
3
Base Transceiver Station (BTS) – continued
CDMA SC Products System Resource Guide (CSSRG) June 20013-4
Control Link Statistics
With CDMA Release 2.9, the following statistics are available for thevarious inter–processor links within the BTS (Intra–BTS LinkDiagnostic, Feature #316):
� GLI to GLI
� MGLI to LCLI
� GLI to BBX
� GLI to MCC
� GLI to FEP
� 485 Bus.
These statistics are collected and stored in the BTS. They can beretrieved by the OMC/UNO user with the DIAGNOSE CLI command.These statistics include such measurements that can assess:
� Utilization
� Single end–point anomalies
� Physical layer problems.
Planning Limits
Refer to the BTS product documentation regarding the specific BTS forthe capabilities of the BTS product. Items to note are:
� Number of channel cards that can be equipped (MCC or MAWIs)
� Number of channel elements per each card (8 or 24 for MCC, 16 or 36for MAWI)
� Number of T1/E1 connections possible
� Number of carriers that can be equipped
� Site configurations that are possible
� Power amplifier and capacity.
Refer to the following sections for a summary of the BTS capabilities:
� BTS Products – other than Japan
� BTS Products – for Japan.
Additional items need to be addressed before installing any incrementalchannel element equipment. For example, when additional channelelements are added, there may be a question of whether or not the linearpower amplifier (LPA) can support the additional users. Since thesechannel elements allow more users to be served by the site, more poweramplifier (PA) power is required. If the PA is already near its rated limit,this signifies that an additional carrier may be required.
Propagation characteristics might exist that may not allow the sector toreach the RF channel capacity. These characteristics can includeproblems with the terrain which may restrict how far the RF signal canpropagate and may determine how many users can be served. If this isthe case, an additional site might be required.
If additional channel elements can be added to the site without exceedingthe PA capabilities or RF capacity, the engineer needs to ensure that the
3

Base Transceiver Station (BTS) – continued
June 2001 3-5CDMA SC Products System Resource Guide (CSSRG)
additional channel elements can be placed onto the leased facility(T1/E1) back to the CBSC. It’s possible that an additional T1/E1 may berequired. Compression of traffic channels occurs on each DS0.Depending on the configuration of the T1/E1, either three or four trafficchannels can be compressed into one DS0 timeslot.
The addition of more traffic channels at a BTS generates more traffic tothe CBSC. The impact upon the CBSC needs to be considered to ensurethat the CBSC has sufficient resources available, such as:
� CPU utilization
� Port capacity
� MSI capacity
� XCDR capacity.
Symptoms of Resource Overload
Monitor the All Traffic Channel Element Busy Time for each site toassess those times when the channel element resources are all occupied.This is an indication that:
� Not enough channel elements are equipped at the site
� Some existing channel elements are out of service
� Some traffic needs to be off–loaded onto another carrier or site.
The All Channels Busy time, in seconds, is acquired from peg count 4 ofthe Performance Measurement (PM) pmC_61 record or pmC_60 record(for older software releases), which is obtained from the OMC–R.
The All Traffic MCC Channel Elements Busy Time field indicates thetime, in seconds, during which all traffic channel elements were not idle.This time defines the probability of blocking and must include OOStime, as well as traffic use, or all non–idle time. The MM starts the AllTraffic Channel Elements Busy Time when the last available channelelement is removed from the idle MCC Channel Element resource list.This could be due to call processing (MCC Channel Element to service amobile) or fault management (MCC Channel Element OOS).
The count stops when at least one MCC Channel Element is placed backon the idle MCC Channel Element resource list. The timer is reset at thestart of the collection period with the state of All Traffic Channel Busypreserved. Refer to the SC CDMA Product Family PerformanceAnalysis manual for further information.
Other PM data available to show the lack of resources:
� Call Redirection – Walsh Code Overflows, pmC_20 peg count 16
� Call Redirection – Channel Element Overflows, pmC_62 peg count 5
� Walsh Code Overflows, pmC_20 peg count 4
� Traffic MCC Channel Element Overflows, pmC_62 peg count 2.
Call Failure Class (CFC) codes, which are recorded in the Call DetailLogs (CDL), are another source for monitoring symptoms of resourceoverload. A CFC–20, No Radio Resource Available, is an indication that
3

Base Transceiver Station (BTS) – continued
CDMA SC Products System Resource Guide (CSSRG) June 20013-6
the system was not able to acquire all of the necessary radio resources toset up the call.
Call Failure Class code 33 (CFC–33) is available in CDMA release 2.9.CFC–33 is defined as... “The CBSC did not have a channel element orWalsh Code available to assign for a mobile origination or a mobiletermination and the call attempt was redirected to an analog system withautomatic re–access.”
Reducing Utilization/Capacity Improvement
Calibrate each BTS to compensate for site–specific cabling and normalequipment variations. Calibration guarantees that all gains and losses ofall cables and devices does not cause improper site operation.
The appropriate BTS–level capacity relief management plan to choosedepends upon many different factors, such as:
� Customer inputs and requests
� Cost of implementation
� Site acquisition availability
� Design of the system
� Rate of market growth.
It’s up to the system designer to choose the appropriate capacitymanagement options to create a capacity management plan that best fitsthe particular situation.
Refer to the BTS Expansion section for additional information oncapacity relief management options.
Software Features
Software features will be introduced over time to improve thecapabilities of the BTS, such as:
� Logical BTS (Feature 970A/B)
� Multiple Carriers per CCP cage in BSS Release 2.8.3 (Feature #945)
� Multiple Spans per CCP cage in BSS Release 2.8.3 and 2.9 (Feature #949)
� Multiple PA’s per Sector in BSS Release 2.9 (Feature #1174).
Logical BTS (Feature# 970B, 970A)
The logical BTS feature enhancement allows all modem frames at aphysical base site location to be treated as a single logical site.(Previously, when additional modem frames were added to a site, thenew frames were viewed from the system as a new, separate cell site.)By grouping frames in a single logical cell, hardware and operationsavings are possible.
The Logical BTS for Four Digit Base Stations (Feature# 970B) featurein BSS Release 2.9 allows all four digit modem frames at a physicalbase site location to be treated as a single logical site.
3

Base Transceiver Station (BTS) – continued
June 2001 3-7CDMA SC Products System Resource Guide (CSSRG)
Common hardware such as span lines, timing sources, and modems willbe shared among frames and managed by the system. Commonconfiguration and alarm information, available for the entire site,simplifies operation, maintenance, and performance.
Logical BTS Support is a software feature which provides systemsupport for multiple modem frames in a BTS. This feature enhances theBTS configuration database to support up to four modem frames in asingle BTS. Performance management software will be updated so thatthe performance statistics for the carrier/sectors of each modem framecan be view as one integrated BTS. Fault management alarms arecorrelated to the same BTS, and frame level alarms contain a frame ID.
Table 3-1: Logical BTS Advantages
Prior to logical BTS With logical BTS
Channels assignment between framesis not supported.
Channel assignment can be directedto any carrier in the site.
Each BTS can share a GPS antennabut requires an independent GPSreceiver.
The BTS can operate with a singleGPS and backup timing source.(Requires additional hardware.)
Separate dial–up modem andtelephone lines are required for eachRFMF.
The BTS supports a single dial–upmodem for all RFMFs.
Configuration databases is set up foreach RFMF.
The BTS has an integratedconfiguration database (for example,neighbor lists).
DAHOs can only be set to carriersupported by an RFMF.
All carriers can act as DAHO targets.
DSOs with excess capacity cannot begroomed to second RFMF.
Unused DSO capacity may begroomed to a second RFMF.
Performance statistics are logged byeach RFMF (each has it’s own BTSID).
Performance statistics are logged forthe entire BTS.
Frame alarms do not designate aspecific frame.
Frame alarming contain a Frame IDso alarms are frame–specific.
Multiple Carriers per CCP cage in BSS Release 2.8.3 (Feature# 945)
The Multiple Carriers per Cage feature supports more than one CDMAcarrier per cage in the SC4812(T), SC4840, and SC2440 base stations toprovide double density capacity. Multiple Carriers per Cage allows aCCP 12 Cage to support more than one carrier depending on the sectorconfiguration, such as:
� One sector (omni) with up to four CDMA carriers
� Six sectors with up to two CDMA carriers
� Three sectors with up to four CDMA carriers.
3

Base Transceiver Station (BTS) – continued
CDMA SC Products System Resource Guide (CSSRG) June 20013-8
Refer to the Release Notes for further information.
Multiple Spans per CCP cage in BSS Release 2.8.3 and 2.9 (Feature#949)
This feature provides the system support needed to terminate multiplespan lines at each cage of a BTS.
Refer to the Release Notes for further information.
Multiple PA’s per Sector in BSS Release 2.9 (Feature# 1174)
This feature provides capability of more than one PA per sector to beprovisioned and managed in a BTS (LBTS).
Refer to the Release Notes for further information.
3

BTS Expansion
June 2001 3-9CDMA SC Products System Resource Guide (CSSRG)
Introduction
The BTS comprises the necessary RF infrastructure equipment thatsupports the air–interface. This equipment includes such items as theradio channel transceivers, power amplifiers, and control processorsneeded to translate the voice/data traffic between the CBSC and thesubscriber units. BTSs are designed according to IS–95 and IS–97standards for the CDMA cellular air–interface and base stations,respectively. The purpose of the BTS is to provide the RF coverage overa given area and to support the subscribers within that area.
The BTS provides the RF interface between the subscriber units and theMobile Switching Network (MSN). The function of the BTS is to createthe network interface with the CBSC for the transmission and receptionof traffic and control information.
Before the Systems Engineer can start expanding the RF portion of thesystem, they have to understand the present state of the system and whatis truly necessitating an expansion to the system. The followinghigh–level questions are a few of the many questions the systemdesigner needs to ask:
� Is an additional area of coverage required?
� Is an improved signal level desired?
� Are more users required to be supported?
� Are current users using the wireless service more?
The desired coverage area is the region in which the wireless serviceprovider wishes to provide service to a group of subscribers. This has adirect relationship to the number of cell sites required. Generallyspeaking, the larger the area to be covered, the more sites that arerequired. As areas of coverage expand, or as improvements in signallevels are desired, the system requires additional BTS equipment tosupport this increase of RF coverage or improved RF signal level.
Additionally, traffic forecasts impact the number of sites and the numberof CDMA carriers required at each site. Traffic requirements may alsodictate the specific configuration required (omni, sector) at each site. Insome situations, traffic may be the driving force in the quantity of sites.In this case, while the desired coverage area may yield only therequirement for a few sites, the traffic demands may dictate thatadditional sites are required to provide for the subscriber usage. Astraffic demands grow, the system eventually needs additional BTSequipment to support this traffic increase. The additional equipment canbe BTS equipment required to:
� Add additional traffic channels to a site
� Add additional carriers to a sector (adding second, third, fourth, etc.carrier)
� Convert from omni to three–sector
� Convert from omni to six–sector
3

BTS Expansion – continued
CDMA SC Products System Resource Guide (CSSRG) June 20013-10
� Convert from three–sector to six–sector
� Add additional cell sites.
In addition, BSC, MSC, HLR, VLR, and OMC equipment is required tosupport the additional traffic or users.
This section focuses on the expansion capabilities of the BTSequipment. Various BTS products exist and can be tailored for certaintypes of applications, such as small capacity BTS products formicro–cell applications or high–power BTS products for providinggreater range, etc.
The given design of a particular BTS may also have alower growth potential as compared to other BTS options.
NOTE
The following topics highlight the various BTS products offered byMotorola. Some products are designed for operation in certain frequencybands or designed for a limited capacity growth capability.
BTS Expansion – Coverage
A new site may be required to provide coverage in an area where the RFsignal is inadequate. Consider the long term requirement for the site sothat an appropriate BTS product is selected. Regard this new site as anexpansion to the total number of BTS network elements in the system.This increase of BTS network elements impacts the network elementswhich control and monitor the BTS devices. Therefore, the SystemsEngineer must be aware of the impact the new BTS elements have uponthe other network elements (such as, CBSC, MSC, etc.).
Once the new BTS hardware is installed and calibrated, it is necessary tomake the updates to the OMC–R/CBSC database and to download thesoftware and data to the new modules. Modify the database so that theneighbor lists of adjacent sites recognize the new site(s). If there aremultiple CBSCs in the network, determine to which CBSC the new siteis to connect. If the new site is physically located next to sites that are allconnected to one CBSC, then that CBSC is the best candidate for thisnew site. If the new site happens to be physically located along theborder between two CBSCs, this site can potentially connect to either ofthe CBSCs. The engineer needs to investigate the resources available onboth of the CBSCs, determine the predominant handoff situations, andthen make an educated determination as to the proper CBSC for the newsite to be connected.
Before adding a new site(s) to a CBSC, the engineer needs to ensure thenew site won’t overburden the CBSC. It’s possible the engineer needs torelocate some of the sites onto a different CBSC in order to allow thenew site(s) to be added. The process of relocating a site(s) from oneCBSC to another requires the deletion of the site from one CBSCdatabase and entering the site information into the database of a different
3

BTS Expansion – continued
June 2001 3-11CDMA SC Products System Resource Guide (CSSRG)
CBSC (a process referred to as re–parenting or re–homing the database).In addition to the database change, the physical span connection betweenthe BTS and CBSC needs to be disconnected from the old CBSC andconnected to the new CBSC.
BTS Expansion – Traffic
As traffic demand increases at a given site, the site eventually begins toblock calls due to a higher traffic demand than what is currently offered.In order to avoid this blocking, the system designer must improve thetraffic handling capacity of the system. The CDMA RF Carrier chapteraddresses methods to improve the traffic capacity of the CDMA RFcarrier. This section addresses methods to increase traffic capability ofthe BTS site so that it can support the additional RF capacity. TheSystems Engineer can investigate several options that are available toincrease the offered traffic capability of the site or area:
� Equipping additional BTS channel elements
� Adding new CDMA carrier frequencies
� Changing the BTS configuration (Omni, three–sector, six–sector)
� Deploying an additional site(s).
A new site may be required to provide additional traffic capability in anarea where there is blocking. Consider the long term requirement for thesite in order to select the appropriate BTS product.
Both an expansion to an existing BTS or the addition of a new BTSimpacts the supporting CBSC. Investigate CBSC resources to determineif sufficient resources are available to support the new traffic or ifadditional resources are required.
The following topics highlight the methods that can be investigated bythe Systems Engineer to increase the traffic capacity of a BTS.
Not all of the methods will be available for a given BTS.
NOTE
BTS Channel Elements
Installing additional channel elements is the simplest method for addingcapacity to a site. This takes the form of:
� Installing and equipping an additional MCC(s) into an existing CCPshelf
� Replacing an MCC–8E(s) with an MCC–24(s)
� Replacing a 16 channel MAWI board(s) with a 36 channel MAWIboard(s).
Channel element cards support the paging and sync channels in additionto the traffic channels. Also, the traffic channel elements are required tosupport the primary link and any soft handoff links.
3

BTS Expansion – continued
CDMA SC Products System Resource Guide (CSSRG) June 20013-12
A three–sector site minimally equipped with three MCC–8 cards cansupport two overhead channels for each sector (page and sync) andeighteen traffic channels. These eighteen traffic channels are necessary tosupport the primary link to the subscriber and any soft handoff links withsubscribers connected to another site. These eighteen channels offer 11.5Erlangs of traffic with a 2% GOS (assuming Erlang B). These 11.5Erlangs serve those subscribers in a one–way or a soft handoff conditionwith this site.
Table 7–1 shows that the maximum Erlang limit for one sector of athree–sector site operating at 1900 MHz and supporting only 13 Kbpsusers is 7.2 Erlangs. If you assume 50% additional traffic is used for softhandoff, the maximum traffic channel elements required at this site is 42:
7.2Erlangs
sector * 3 sectors * 1.5 = 32.4 Erlangs
32.4 Erlangs (assuming Erlang B and 2% GOS) yields 42 circuits.
Six overhead channels plus the 42 traffic channels requires six MCC–8cards to be installed at the site.
42 TrafficChannels + 6 Overhead = 48 ChannelElements
= 648 ChannelElements
8 ChannelElementsperMCC8
If a site was initially implemented with a minimum number of channelelement cards (for example, three MCC–8 cards), the full RF capacity ofthe site is not realized until additional channel element cards areinstalled. Monitor the traffic usage (which includes soft handoffs) foreach site to assess the number of channel elements required. The trafficusage, in seconds, is obtained from the Performance Measurement (PM)record pmC_61 or pmC_60 (for older software releases) obtained fromthe OMC–R. Traffic channel usage, in minutes, is obtained by dividingthis value by 60 seconds. Erlangs are obtained by dividing this value bythe number of seconds in the collection period (the PM data is collectedevery half–hour or 1800 seconds). The Systems/Traffic Engineer canperform traffic calculations to determine the number of channel elementsrequired at the site to maintain performance criteria.
For those BTS products which share channel elementsacross multiple carriers, the pmC peg count provides totalusage across all carriers of the channel element resourcepool. The pmC peg count also provides total usage for allof the service options that are available (for example,voice, circuit data, and/or packet data).
NOTE
Additional items need to be addressed before installing incrementalchannel element equipment. For example, adding the additional channel
3

BTS Expansion – continued
June 2001 3-13CDMA SC Products System Resource Guide (CSSRG)
elements, the linear power amplifier (LPA) may or may not be able tosupport the additional users. Since these channel elements allow moreusers to be served by the site, more PA power is required. If the PA isalready near its rated limit, this suggests an additional carrier may berequired.
Propagation characteristics may exist that won’t allow the sector to reachthe RF capacity guidelines of a given CDMA carrier as detailed in Table7–1. If this is the case, an additional carrier may also be required.
If additional channel elements can be added to the site without exceedingthe PA capabilities or RF capacity, ensure that the additional channelelements can be placed onto the leased facility (T1/E1) back to theCBSC. It is possible that an additional T1/E1 may be required.Compression of traffic channels occurs on each DS0. Depending on theconfiguration of the T1/E1, either three or four traffic channels can becompressed into one DS0 timeslot.
The addition of more traffic channels at a BTS generates more traffic tothe CBSC. This impact upon the CBSC should also be considered toensure that the CBSC has sufficient resources available (CPU utilization,port capacity, MSI capacity, XCDR capacity, etc.).
Once the physical changes to a BTS are complete, it is necessary tomake updates to the OMC–R/CBSC database and to download softwareand data to the new modules.
The following steps, provided below, are intended to provide a SystemsEngineer with a set of guidelines for channel element planning on a BTSlevel:
1. Collect Data
2. Determine Present Status
3. Forecast Utilization
4. Identify Bottlenecks
5. Evaluate Relief Alternatives
6. Implement Relief Mechanisms.
These guidelines utilize strategies from the Six–Step CapacityEngineering Strategy (from the General Capacity Engineering StrategyIntroduction) to perform the planning. Perform and analyze thefollowing steps individually, on a per–carrier basis, for those systemswith multiple carriers already deployed. Analyze each carrier like itsown separate system. For those BTS products which share channelelements across multiple carriers, the total usage across all of the BTScarriers are analyzed. The analysis should forecast out in time from thepresent date and should be repeated on a periodic basis. The frequency ofthe planning and monitoring exercise depends upon how fast the systemusage grows. The more frequent the monitoring, the sooner a plan can beformulated and implemented to minimize any capacity managementissues before growth causes performance degradation.
3

BTS Expansion – continued
CDMA SC Products System Resource Guide (CSSRG) June 20013-14
Collect Data
Collect and monitor, as the primary data, the BTS traffic channelelement minutes of usage data on a per–BTS basis. For systems whichalready have multiple carriers deployed, collect and analyze the data on aper–carrier basis (depending upon the BTS product being used). Sincethe analysis being performed is on a cell site level, the measurementcollection interval should be large enough to identify the Bouncing BusyHour (BBH) peak traffic period for each cell.
Additionally, the measurement collection interval should be large enoughto capture the Busy Day Bouncing Busy Hour (BDBBH) for the weekfor each cell/carrier. If the system being monitored has a significant dropin subscriber usage as well as a shift in the traffic pattern for theweekend, perform an analysis on only the weekday data. Collect theBBH and BDBBH usage data for each cell/carrier on an ongoing weeklybasis. However, for the initial baseline measurement, collect and fullyanalyze a minimum of four weeks of data.
Collect and monitor, as the secondary data, the BBH performancestatistics on a per–carrier basis. The performance statistics consist of ablocked call rate and a grade of service.
As a result, the typical data collection process stores BBH traffic usagedata and performance statistics. It also stores, on an ongoing weeklybasis, the BBH time of day for each sector/cell in the system for Mondaythrough Friday data (assuming weekend data can be disregarded).Although the frequency of performing a full analysis depends upon therate of growth for the system being monitored, the minimumrecommendation is to perform a full year projection analysis on aquarterly basis. A monthly full analysis is preferred. In either case,perform a weekly review of the present status to keep track of anycurrent sites requiring more channel elements.
Refer to the PMTRAF User’s Manual for CDMA PM Statistics/TrafficReport for further information regarding the data to be collected.PMTRAF is a program which produces a bouncing busy hour trafficreport based on the OMC–R PM peg counts, showing various statisticssuch as:
� Channels equipped
� Carried Erlangs
� Blocking
� Grade of service.
Determine Present Status
Validate the integrity of the data being collected. Investigate andeliminate missing data or anomalous data from the analysis. If the datarepresents an abnormal traffic period, the abnormal data won’t be usefulfor future traffic forecast estimates.
Three planning limits exist that should concern the Systems/TrafficEngineer:
3

BTS Expansion – continued
June 2001 3-15CDMA SC Products System Resource Guide (CSSRG)
� The Existing Channelization Planning Limit
This corresponds to the amount of traffic that can be offered by thesite as it is currently configured (based on number of channel elementscurrently equipped at the site).
� The BTS Hardware Maximum Limit
This corresponds to the maximum amount of traffic that can be offeredby the site if the site was fully populated with the maximum numberof channel elements that could be supported by the given BTSproduct.
� The Walsh Code Usage Maximum Limit
This is defined in the CDMA RF Carrier chapter.
Once the data is validated, analyze the four week average of BDBBHdata for each site (on a per–carrier basis for systems with multiplecarriers) to identify any sites which show blocking or exceed the desiredgrade of service. For those sites using BTS products which can sharechannel elements across multiple carriers, analyze the BDBBH usagedata for all of the carriers supported by the BTS. For those cellsexceeding the Existing Channelization Planning Limit, investigatecapacity management options. The objective of capacity managementplanning is to implement capacity relief mechanisms before aperformance degradation occurs. The existence of performancedegradation should not be a requirement for determining orimplementing a capacity management plan. Use the existence ofperformance degradation to increase the priority of implementingcapacity relief options to those cells/sectors exhibiting the performancedegradation.
Establish the limits into category regions which represent a stoplightlevel of urgency. This is applied to the BDBBH traffic usage data andanalyzed on a weekly basis. The green region represents a low level ofurgency where the BTS traffic usage ranges from low usage up to theExisting Channelization Planning Limit. The yellow region represents amoderate level of urgency with the BTS traffic usage ranging from theExisting Channelization Planning Limit to the BTS Hardware MaximumLimit or Walsh Code Usage Maximum Limit. Finally, the red regionrepresents a high level of urgency with the BTS traffic usage beinggreater than the BTS Hardware Maximum Limit or Walsh Code UsageMaximum Limit. Monitoring the traffic usage data in this fashion can beused to simplify the notification of potential problem areas.
The BTS Hardware Maximum Limit and the Walsh CodeUsage Maximum Limit do not necessarily occur at thesame point or level. Depending on the BTS product andapplication (mobile, fixed, mixed, etc.), one of these limitsis reached first and determines the actual limit for the BTS.
NOTE
The appropriate BTS–level capacity relief management plan to choosecan depend upon many different factors, such as:
3

BTS Expansion – continued
CDMA SC Products System Resource Guide (CSSRG) June 20013-16
� Customer inputs and requests
� Cost of implementation
� Site acquisition availability
� The design of the system
� Rate of market growth.
The system designer chooses the appropriate capacity managementoptions to create a capacity management plan that best fits the particularsituation. The following is a summary of the capacity management/reliefoptions:
� Add additional channel element cards
� Replace existing site with an EMAXX supported product (EMAXXmay improve reverse link capacity, trunked PA may offer additionalforward link capacity assuming that the forward link capacity was nota limiting factor beforehand)
� Readjust Pilot powers to distribute traffic to underutilized sites
� Reorient and/or downtilt antennas to distribute traffic to underutilizedsites
� Modify parameters to distribute traffic to underutilized sites or toreduce power requirements
� Sectorize
� Implement a micro–cell (new site)
� Implement a cell split (new site).
Forecast Utilization
There are several different strategies that forecast utilization. Each ofthem has different figures of merit to justify their usage. The marketingdepartments of cellular operators typically project future growth throughsubscriber projections, which are then used as the baseline parameter togauge future system utilization. Ultimately for channel elementplanning, what is required is a forecasted estimate of traffic usageminutes on a per–carrier, per–cell basis. For sites which can sharechannel elements across multiple carriers, an estimate of total usageacross all of the carriers is required. If the customer’s marketingdepartment provides the Systems/Traffic Engineer with subscriberprojections for the analysis, the following procedure can be used toforecast traffic usage minutes on a per–cell basis. Table 3-2 shows anexample of a spreadsheet which can be easily created to perform thefollowing forecast of traffic usage minutes.
Procedure to forecast traffic usage minutes:
1. Collect the BDBBH traffic usage minute data (including voice andcircuit/packet data usage) for four weeks worth of current data (fourdata points per site, one per week), for each cell in the system on aper–carrier basis (on a multiple carrier basis if the channel elementsare shared across carriers). See columns B thru E in Table 3-2.
2. Baseline the system by calculating the average BDBBH traffic usageminutes from the four weeks worth of current data for each cell in
3

BTS Expansion – continued
June 2001 3-17CDMA SC Products System Resource Guide (CSSRG)
the system [in other words, AVERAGE(B1:E1)]. See column F inTable 3-2.
3. Calculate the standard deviation (1–sigma) for the average BDBBHtraffic usage minutes for each cell in the system. See column G inTable 3-2.
4. Obtain the average number of subscribers using the systemassociated with the four weeks of data being analyzed. See column Hin Table 3-2.
5. Calculate the Average BDBBH traffic usage per subscriber on aper–cell basis [in other words, F1/ H1]. See column I in Table 3-2.
6. Calculate the Average BDBBH traffic usage + 3–sigma persubscriber on a per–cell basis [in other words, (F1+(3*G1))/H1]. Seecolumn J in Table 3-2.
7. Obtain the projected subscriber growth for the system. See column Kin Table 3-2.
8. Calculate the projected Average BDBBH traffic usage on a per–cellbasis [in other words, K1*I1]. See column L in Table 3-2.
9. Calculate the projected 3–sigma Average BDBBH traffic usage on aper–cell basis [in other words, K1*J1]. See column M in Table 3-2.
Table 3-2: Example Spreadsheet to Forecast Traffic Usage
A B C D E F G H I J K L M
BTSID
Week 1BDBBHTrf. Min.
Week 2BDBBHTrf. Min.
Week 3BDBBHTrf. Min.
Week 4BDBBHTrf. Min.
AVG STD CurrentSubs
AVG Trf.Usage
per Sub
AVG + 3 STDTrf. Usage
per Sub
FutureSubs
AVGTrf.MinFuture
AVG + 3STD
Trf.MinFuture
1 1092 957 1012 982 1011 59 50000 0.02022 0.02373 75000 1516 1780
2 536 490 524 447 499 40 50000 0.00999 0.01238 75000 749 928
3 704 709 743 779 734 35 50000 0.01468 0.01676 75000 1101 1257
4 340 325 374 380 355 27 50000 0.00710 0.00869 75000 532 651
5 605 633 634 577 612 27 50000 0.01225 0.01387 75000 918 1040
If the customer’s marketing department provides the Systems/TrafficEngineer with something other than subscriber projections,modifications can be made to the above approach to project a linearrelationship according to the customer–supplied projection parameter. Ifthe customer requires a non–linear growth projection, modifications arenecessary to the above approach which depend upon the specifiednon–linear growth projection requirements. For example, the customermay specify a variable subscriber growth rate along with a variableusage rate which may be based upon seasonal changes and/or marketingpromotions. In either case, the desired outcome projects an averageBDBBH traffic usage and a 3–sigma average BDBBH traffic usage (inminutes) for each cell.
The example in Table 3-2 projects traffic utilization based upon asubscriber estimate for a future date. If subscriber growth estimates are
3

BTS Expansion – continued
CDMA SC Products System Resource Guide (CSSRG) June 20013-18
provided on a monthly basis, then columns K, L, and M can be repeatedfor each month where a subscriber growth estimate is provided. With amonthly analysis, an estimate of when a particular cell will exceed itscurrent channel element capacity or maximum limit can be performed.This type of analysis can be helpful in determining whether a BTS–levelor a system–level capacity relief mechanism should be implemented.
Table 3-3: Example Spreadsheet to Forecast Required Channelization
A L M N O P Q R S T U
BTSID
AVGTrf.MinFuture
AVG + 3 STDTrf.MinFuture
AVGErlangFuture
ChannelElements
Future
CE andOverhead
Future
MCC 8Future
AVG + 3ErlangFuture
ChannelElements
Future
CE andOverhead
Future
MCC 8Future
1 1516 1780 25.3 34 40 5 29.7 39 45 6
2 749 928 12.5 20 26 4 15.5 23 29 4
3 1101 1257 18.3 26 32 4 21.0 29 35 5
4 532 651 8.9 15 21 3 10.9 18 24 3
5 918 1040 15.3 23 29 4 17.3 25 31 4
The following steps are used to continue the analysis (channel elementforecast) based on the forecasted traffic usage:
1. Calculate the projected Average BDBBH Erlang requirement on aper–cell basis [in other words, L1/ 60]. See column N in Table 3-3.
2. From an Erlang table determine the number of channel elementsrequired to support the Erlang requirement [in other words,determine number of circuits required for a given grade of service tooffer the Erlang requirement in column N]. See column O inTable 3-3 (this assumes an Erlang B table with a desired 2% grade ofservice).
3. Increase the calculated channel element requirement by the numberof channel elements required for the control channels (page andsync). See column P in Table 3-3. [Assuming a three–sector site, sixoverhead channels are added.] For multiple carrier sites which sharechannel elements across all carriers, include the control channelrequirements for all of the carriers that are supported.
4. Determine the number of channel element cards required. [In otherwords, column P divided by the number of channel elementsprovided by the channel element card]. See column Q in Table 3-3.(MCC–8s were assumed for this scenario.)
5. Calculate the projected 3–sigma Average BDBBH Erlangrequirement on a per cell basis [in other words, M1/60]. See columnR in Table 3-3.
6. From an Erlang table, determine the number of channel elementsrequired to support the 3–sigma Erlang requirement. [In other words,determine number of circuits required for a given grade of service tooffer the Erlang requirement in column R]. See column S inTable 3-3 (this assumes an Erlang B table with a desired 2% grade ofservice).
3

BTS Expansion – continued
June 2001 3-19CDMA SC Products System Resource Guide (CSSRG)
7. Increase channel element requirement by the number of channelelements required for the control channels (page and sync). Seecolumn T in Table 3-3. [Assuming a three–sector site, six overheadchannels are added.] For multiple carrier sites which share channelelements across all carriers, include the control channel requirementsfor all of the carriers that are supported.
8. Determine the number of channel element cards required. [in otherwords, column T divided by the number of channel elementsprovided by the channel element card]. See column U in Table 3-3.(MCC–8s were assumed for this scenario.)
High–Speed Packet Data Considerations
The following guidelines apply towards systems with High–SpeedPacket Data (HSPD) deployed and still have a low penetration rate ofHSPD usage ( < 1%). There are two site equippage configurations whichneed to be considered:
� Site is equipped to handle the maximum limit
� Site is not equipped to handle the maximum limit.
For those sites already equipped to handle the BTS Hardware MaximumLimit or the Walsh Code Usage Maximum Limit, no additional channelelements are required. This is due to the premise that the supplementalchannel allocation algorithm only attempts to allocate supplementalchannels when there is excess RF carrier capacity.
For those sites which currently experience little or no excess RF carriercapacity during the busy hour (for example, sites which are near orexceeding the Walsh Code Usage Maximum Limit), no additionalchannels are needed because the HSPD calls receive little or nosupplemental channels under these conditions. However, when thesesame sites are operating during a lower traffic period, when excess RFcarrier capacity is available, a HSPD call receives supplemental channelsbecause the site has been already equipped to handle the Walsh CodeUsage Maximum Limit.
For sites which are not already equipped to handle the BTS HardwareMaximum Limit or the Walsh Code Usage Maximum Limit, it isrecommended to traffic engineer the channel elements according to theprocess provided in this section and then implement an additional fivechannel elements to each HSPD site. This guideline of adding fivechannel elements to each site is recommended, because the Erlang Bmodel, which is used to estimate the number of channels required, doesnot take into account the aspect of one HSPD user requiring multiplechannel element resources. The Erlang B model underestimates therequired channel element resources for a HSPD site. This guideline ofadding five channel elements is intended to maintain a compositegrade–of–service below the desired 2% level.
Identify Bottlenecks
Once the traffic usage is forecast to some point in the future on aper–cell, per–carrier basis, it’s time to once again identify, on a BTS
3

BTS Expansion – continued
CDMA SC Products System Resource Guide (CSSRG) June 20013-20
level, any sites which exceed either of the Existing Channelization, BTSHardware, or Walsh Code Usage Maximum Limits. Establish theplanning limit into category regions which represent a stoplight level ofurgency applied to the forecasted traffic usage data (for both average and3–sigma values). The green region represents a low level of urgency withthe BTS traffic usage ranging from low usage up to the ExistingChannelization planning limit. The yellow region represents a moderatelevel of urgency with the BTS traffic usage ranging from the ExistingChannelization planning limit to the BTS Hardware or Walsh CodeUsage Maximum limits. Finally, the red region represents a high level ofurgency with the BTS traffic usage greater than the BTS Hardware orWalsh Code Usage Maximum limits.
The BTS Hardware Maximum Limit and the Walsh CodeUsage Maximum Limit do not necessarily occur at thesame point or level. Depending on the BTS product andapplication (mobile, fixed, mixed, etc.), one of these limitswill be reached first and determines the actual limit for theBTS.
NOTE
Evaluate Relief Alternatives
A decision needs to made as to how to increase the traffic capacity of thesystem to resolve the bottleneck conditions. The options include:
� The addition of channel elements to the site
� A replacement of the existing BTS product with a different BTSproduct that provides for more channel element capacity
� The addition of more CDMA sites
� The addition of another CDMA carrier.
At this point, make a plot showing the traffic usage data in aRed/Yellow/Green stoplight fashion onto a System/CBSC level BTSlocation map. This plot is useful in identifying isolated cells and/ordetermining areas which have exceeded the BTS Hardware or WalshCode Usage Maximum Limit and are candidates for adding a newCDMA carrier or site. Create an individual traffic usage location map asdescribed above for each carrier deployed in the system.
The appropriate capacity management plan to choose on a BTS orSystem level is dependent upon many different factors, some of whichare:
� Customer inputs and requests
� Cost of implementation
� Market size
� Terrain
� Site acquisition availability
3

BTS Expansion – continued
June 2001 3-21CDMA SC Products System Resource Guide (CSSRG)
� The design of the system
� Rate of market growth
� The number and location of the sites/sectors which exceed theplanning or maximum limit.
Choose the appropriate capacity management option(s) to create acapacity management plan that best fits the particular situation.
Implement Relief Mechanisms
The engineer establishes schedules and contingencies for the reliefmechanisms in the Evaluate Relief Alternatives section. Genericguidelines for implementing relief mechanisms are as follows:
� Determine availability of any new equipment required for the reliefmeasure
� For any relief mechanism, determine length of time needed toimplement change
� Identify dates for scheduling the changes
� Create a method of procedure
� Identify backup plans for schedule changes
� Make changes according to schedule.
Making any change to the network requires re–evaluationof the previously established processes. Make changes tothe process concurrently with changes in the physicalnetwork.
NOTE
Addition of a New CDMA Carrier Frequency
The addition of a new CDMA carrier (1.25 MHz RF channel) to a BTSrequires the addition of various equipment at the BTS location. TheCDMA RF Carrier chapter described in detail how to determine when anew RF carrier needs to be introduced into the system. The SystemsEngineer needs to ensure that the BTS product has the capability ofexpanding to the new carrier and that there is frequency spectrumavailable to utilize. This section highlights the requirements needed atthe site to support the additional carrier. [Analysis as to whether it ispossible for the system to support another carrier (frequency spectrum,equipment, etc.) needs to be considered.] Some of the basic componentsare:
� Interframe Cabling (for both the transmit and receive RF paths)
� Filters and Cables in the Appropriate BTS Frame
� LPA/ELPA Shelves
� Bandpass Filters
� Directional Couplers (if new antennas are required)
3

BTS Expansion – continued
CDMA SC Products System Resource Guide (CSSRG) June 20013-22
� Duplexers (if new antennas are required)
� Transceiver Modules (BBX cards or MAWI cards)
� Channel Element Cards
� Transmit Combiners
Only CDMA Channels which are at a minimum of 2.5 MHz spacing,center frequency to center frequency, can be combined onto the sameTX combiner.
� Additional CCP Cage (the CCP–12 cage can support multiple carriers)
� Expansion BTS Frame or Cabinet (as required)
� 19 inch Rack for the Combiners
� Directional Antennas (if new antennas are required)
� New Tower Cable Transmission Runs (if new antennas are required)
� Additional DC power.
Once the physical changes are complete, it is necessary to make updatesto the OMC–R/CBSC database and to download software and data to thenew modules. RF calibration is required for the new hardware.
The addition of a CDMA RF carrier at a BTS generates more traffic tothe CBSC. This impact upon the CBSC needs to be considered to ensurethat the CBSC has sufficient resources available.
Converting Cell Site Configurations
Converting a cell site from an omni configuration to a sectorconfiguration provides for greater capacity at the site. Other benefits ofsectorizing a site are:
� Better control of the RF signal by having the ability to downtilt ororient a narrow beam antenna associated with each sector.
� Potential for having higher gain base antennas to provide for betterin–building coverage, longer subscriber battery life, or greater range.
The Systems Engineer determines if the existing BTS product at the siteis capable of the sector conversion desired. The available BTS productmay limit the options that are available to the Systems Engineer.Furthermore, the conversion of a BTS to a different configuration mayresult in more traffic to the CBSC. This impact upon the CBSC needs tobe considered to ensure that the CBSC has sufficient resources available.
Omni to Three–Sector
Expanding an omni–configured BTS to three–sector coverage requiresthe addition of various equipment at the BTS location. The reader iscautioned that there are some BTS products that won’t allowthree–sector operation (for instance, the SC611). Some of the basiccomponents, which may be required to convert the cell from Omni tothree–sector, are:
� Interframe Cabling (for both the transmit and receive RF paths)
� Filters and Cables in the Appropriate BTS Frame
3

BTS Expansion – continued
June 2001 3-23CDMA SC Products System Resource Guide (CSSRG)
� LPA/ELPA Shelves
� Bandpass Filters
� Directional Couplers
� Duplexers
� Transceiver Modules (BBX cards or MAWI cards)
� Channel Element Cards
� Directional Antennas (for both transmit and receive frequencies)
� New Tower Cable Transmission Runs
� Additional DC power.
The standard omni BTS/SIF includes filter paths for one sector of threeantennas (one transmit, two receive). To convert this to three–sectoroperation requires the addition of cables and filters for two more sectors.
Once the physical changes are complete, make updates to theOMC–R/CBSC database and download software and data to the newmodules. The new hardware requires RF calibration.
Omni to Six–Sector
Expanding an omni–configured BTS to six–sector coverage is similar tothe omni to three–sector conversion. The only difference is in theamount of equipment required. Again, the reader is cautioned that not allof the BTS products are able to be configured as a six–sector site. Someof the basic components, which may be required to convert the cell fromthree–sector to six–sector, are:
� Interframe Cabling (for both the transmit and receive RF paths)
� Filters and Cables in the Appropriate BTS Frame
� LPA/ELPA Shelves
� Bandpass Filters
� Directional Couplers
� Duplexers
� Transceiver Modules (BBX cards)
� Channel Element Cards
� Directional Antennas (for both transmit and receive frequencies)
� New Tower Cable Transmission Runs
� Additional DC power.
The standard omni BTS/SIF includes filter paths for one sector withthree antennas (one transmit, two receive). To convert this to six–sectoroperation requires the addition of cables and filters for five more sectors.
Once the physical changes are complete, make updates to theOMC–R/CBSC database and download software and data to the newmodules. The new hardware requires RF calibration.
Three–Sector to Six–Sector
Expanding a three–sector BTS to six–sector coverage is similar to theomni to six–sector conversion except that three sectors as opposed to
3
BTS Expansion – continued
CDMA SC Products System Resource Guide (CSSRG) June 20013-24
five sectors of equipment are required. (Refer to the Omni to Six–Sectorsection).
Once the physical changes are complete, make updates to theOMC–R/CBSC database and download software and data to the newmodules. The new hardware requires RF calibration.
New Site for Traffic
When an existing site can no longer be expanded to offer the amount oftraffic required, a new site or several new sites may be required as ameans to add the additional system capacity to the wireless network.Consider the long term requirement for the site(s) in order to select theappropriate BTS product.
Refer to the BTS Expansion – Coverage section for additional items tobe considered when a new site is added to the system.
RF Optimization
Verify any BTS hardware expansion done in the field for properoperation by drive testing and collecting data from the new equipment.Some optimization may be required to tailor the new equipment to theparticular system. This is necesary to ensure that all of the newequipment, and its associated new cabling, is properly installed beforecommercial users begin to utilize the newly installed equipment.
The following list gives various items that can be verified or performedto ensure proper operation of the equipment:
� Verify Proper Sector/Carrier Topology
� Optimize Appropriate DAHO or MAHO with Pilot BeaconParameters
� Coordinate Site Functional Tests for New Carrier
� Development Handoff Zone Drive Routes
� Coordinate Pre–Commercial Testing and Launch
� For testing purposes, set up the new CDMA carrier such that onlymobiles with security class 10 or above have access to the system.
� Create drive routes and drive the system on an existing CDMA carrierfrequency (preferably at night when there is little traffic) and the newCDMA carrier frequency. With certain diagnostic monitors (DMs),two phones can be connected to allow the data to be collected at thesame time. Otherwise, the system needs to be driven once for theexisting carrier and a second time for the new carrier.
� Collect (log) drive test data and post process it. Generate plots ofFER, Ec/Io, TGA, Tx Power along with the Averages and StandardDeviations for the entire drive. If any differences are seen, furthertesting may be required in that area.
� Monitor statistics between the carriers to ensure the load is balancedacross the carriers. The performance of the carriers should be similar.
� Each CDMA carrier can be viewed as a separate CDMA system whichneeds to be monitored.
3

BTS Expansion – continued
June 2001 3-25CDMA SC Products System Resource Guide (CSSRG)
� The statistics need to be looked at for each carrier separately, notcombined.
� Analyze the new site with respect to the surrounding sites. Makeadjustments to the surrounding sites, if required.
3
BTS Products – other than Japan
CDMA SC Products System Resource Guide (CSSRG) June 20013-26
Introduction
Before planning the BTS network, the Systems Engineer needs anawareness of the various different Motorola BTS products at theirdisposal. There are differences in the BTS products which may make oneBTS product more suitable for an application as opposed to another BTSproduct. The Systems Engineer needs to weigh all of these factors, inaddition to the customer’s desires, when selecting the appropriate BTSproduct. The following highlights some of the differences between theavailable BTS products:
� Spectrum of Operation
– 800 MHz
– 900 MHz
– 1700 MHz
– 1900 MHz
� Site Configuration
– Omni
– Three–sector
– Six–sector
� Mixed Mode (CDMA/Analog) Operation
� Size and Number of Frames
� Power Amplifier
– Enhanced Linear Power Amplifier (ELPA)
– Single Tone Linear Power Amplifier
– Trunked LPA
� Tower Top Amplifier
� Number of CDMA Carriers Supported per Frame or cabinet
� Number of Channel Elements Supported.
Certain products are meant for different types of applications. Forexample:
� Only a few BTS products support a mixed mode (Analog and CDMA)configuration (SC9600, SC2400)
� The SC611 is designed mainly for spot coverage
� The SC4812 can operate in a six–sector configuration.
The following is a brief description of many of the BTS products. Someof the BTS products are no longer being manufactured (See Reduction ofBTS Offerings for additional information) but are listed below since anexisting system may have some of them installed. For furtherinformation concerning the availability of a given BTS, contact yourlocal Motorola representative. Also, for further information, refer to thelatest BTS Product manuals, which are available from the TechnicalEducation and Documentation group.
Information is provided to the extent that additional equipment can beadded to support increased traffic demands. Not all product numbers are
3

BTS Products – other than Japan – continued
June 2001 3-27CDMA SC Products System Resource Guide (CSSRG)
described, however, and other products may resemble those which arelisted below.
The BTS specifications and descriptions in this section are based on thecurrent structure of the various BTS CDMA products.
SC9600
The SC9600 CDMA BTS is a three frame (minimum), indoor basestation designed to support medium to high–density cell sites. Theseframes include the:
� Site Interface Frame (SIF)
The SIF contains the cell site filters, multicoupler, dial–up modem,and optional duplexers and directional couplers.
� Radio Frequency Modem Frame (RFMF), which is also called theModem Frame.
The Modem Frame houses the control and radio equipment for timesynchronization, call processing, and base station fault management.
� Linear Power Amplifier (LPA) Frame.
The LPA (or ELPA) Frame contains the multi–tone linear poweramplifiers, and PA controllers. An Expandable Linear PowerAmplifier (ELPA) Frame can be used in place of a LPA Frame. Likeall other frame types, cable entry and exit is at the top of the frames,and all frames are front accessible.
The SC9600 CDMA BTS supports the 800 MHz CDMA air interface ineither omni transmit/omni receive or three–sector transmit/three–sectorreceive configurations.
The SC9600 BTS site can be configured for operation with the followingtypes of air–interface (in other words, duplex RF link between BTS siteand subscriber):
� Analog (AMPS/NAMPS) – supports only analog subscriber units
� Code Division Multiple Access (CDMA) – supports only CDMAsubscriber units
� Mixed mode – supports analog and CDMA subscriber units.
3

BTS Products – other than Japan – continued
CDMA SC Products System Resource Guide (CSSRG) June 20013-28
Figure 3-1: SC9600
CCP 1 CCP 2
Distribution Shelf
RF Modem FrameSite Interface Frame
CCP 3 CCP 4
LPA Shelf 3
LPA Shelf 2
LPA Shelf 1
ELPA Frame
Shelf 3
Shelf 2
Shelf 1
Shelf 4
Shelf 5
Shelf 6Carrier 1BBX
GLIMCC
Carrier 3BBX
GLIMCC
Carrier 2BBX
GLIMCC
Carrier 4BBX
GLIMCC
(SCLPA Frame)Linear Power Amplifier Frame
RFDS Dial–upModem
RX Filters
(CDMA Only)
SC9600 CDMA Carrier Support
The CDMA Only SC9600 BTS Hardware can be equipped with up totwo Modem Frames, two LPA frames or two ELPA Frames, and one SIFto support a maximum of eight CDMA carriers.
One mixed mode (CDMA and analog) SC9600 Modem Frame supportsone CDMA carrier. Alternatively, the SC4812 Expansion Modem Frame(no LPAs) may be used as the SC9600 Modem Frame expansion.
Table 3-4: CDMA Carrier Support
Number of shelves per BTS modem frame 4
Number of carriers per shelf – Omni 1
Number of carriers per shelf – three–sector 1
Number of carriers per shelf – six–sector N/A
Maximum number of CDMA modem frames 4 (see Note)
NOTEBasic site equipment is able to support up to four RFMFs. The amount offrequency spectrum available may limit the number of CDMA carriers and,therefore, the number of frames needed.
SC9600 Channel Element Support
The MCC–8 card contains the circuitry necessary to implement CDMAchannels of any type specified in the IS–95 standard, except the pilotchannel. The supported channel types are the:
� Sync channel
� Paging channel
3

BTS Products – other than Japan – continued
June 2001 3-29CDMA SC Products System Resource Guide (CSSRG)
� Access channel
� Traffic channel.
A single CDMA channel on an MCC–8 is referred to as a channelelement, and an MCC–8 supports up to eight channel elements.
The MCC channels can be pooled across the sectors within a given CCPcage, but are not pooled across CCP cages. In other words, the MCCcards are dedicated to a single cage and therefore to a single carrierfrequency.
Table 3-5: Physical Traffic Channels
Physical Traffic Channels per MCC–24 N/A
Physical Traffic Channels per MCC–8 8
Minimum Number of MCC/Shelf 1 per sector+ 1 for
redundancy
Maximum Number of MCC/Shelf 20
Maximum Physical Traffic Channels/Shelf 160
Number of CDMA Shelves in Frame 4
Maximum Physical Traffic Channels/Frame 640
Each CCP shelf can be connected to two span lines, or a total of eightspan lines for an RFMF with all four CCP shelves installed.
SC9600 RF Cabling
When two RF Modem frames feed a single LPA or ELPA frame, a DualLPA TX Input kit must be installed on the top of the LPA or ELPAframe. The installation takes place after the frames are mounted butbefore installing the cabling. Install the Dual LPA TX Input kit byfollowing the procedure given in the Dual LPA TX Input Kit manual.
When more than two RF Modem frames feed a single LPA or ELPAframe, a Multi–Input Combiner Kit must be installed on the top of theLPA or ELPA frame. The installation will take place after the frames aremounted but before the cabling is installed.
When more than thirty IP addresses are required, a RFM LAN RepeaterOption must be installed on the top of the Expansion RF Modem frame.The installation will take place after the frames are mounted but beforethe cabling is installed. Install the RFM LAN Repeater Option byfollowing the procedure given in the RFM LAN Repeater Optionmanual.
For multiple RF Modem frame systems, there are two transmit cablingphilosophies:
� Combine the output of the RF Modem frames at the input of theELPA/LPA (using the Dual or Multi–Port LPA TX Input Option).This shares the ELPAs/LPAs and antennas between the RF Modemframes.
3

BTS Products – other than Japan – continued
CDMA SC Products System Resource Guide (CSSRG) June 20013-30
� Use separate antennas and ELPAs/LPAs for each RF Modem frame’stransmit path.
The interconnect panel located at the top of the SIF has one of twodifferent adapter plates. Use the two–way adapter plate in systems withone or two RF Modem frames. Use the four–way adapter plate insystems with three or four RF Modem frames. The number of connectorspopulated on the adapter plate is dictated by the site configuration.
The recommended orders of the frames for single RF Modem framesystems are shown in Figure 3-2.
Figure 3-2: Single RF Modem Frame Mounting Order
RF Modem Frame LPA (or ELPA) Frame SIF
SIF LPA (or ELPA) Frame RF Modem Frame
For sites that require the LAN Repeater option, the general rule is:
� Keep the Master RF Modem frame and all LPA (or ELPA) frames onthe same side of the LAN Repeater Option (same Ethernet LAN).
� Keep the expansion RF Modem frames and SIF on the other side ofthe LAN Repeater Option (same Ethernet LAN).
The recommended orders of the frames for multiple RF Modem framesystems are shown in Figure 3-3. ELPA frames must not be mountednext to any other rear–exhaust frame (like another ELPA).
Figure 3-3: Multiple RF Modem Frame Mounting Order
Master RFModem FrameSIF Expansion RF
Modem Frame(s)LPA (or ELPA)
Frame(s)
LPA (or ELPA)Frame(s) SIFMaster RF
Modem FrameExpansion RF
Modem Frame(s)
SC9600 Power Amplifier Capabilities
Each SCLPA Frame can house up to three SCLPAs and is capable ofsupporting up to three–sectors. Two SCLPA Frames (with three SCLPAseach) can be used to support six–sector sites.
The SCLPA hardware is no longer available.
NOTE
3

BTS Products – other than Japan – continued
June 2001 3-31CDMA SC Products System Resource Guide (CSSRG)
Up to two SCLPAs can operate on each sector, or up to a total of sixSCLPAs in a three–sector cell with two TX antennas per sector. Asix–sector cell may expand to up to 12 SCLPAs (or four SCLPA frames).However, once the number of SCLPAs exceeds six, a second SIF andRFDS is required. (If the RFDS is not used, a second SIF is notrequired.) SC9600 SCLPAs are available as either high power (125W) orlow power (70W).
The SC Series Expandable Linear Power Amplifier (ELPA) is amulti–carrier linear power amplifier which is effective at large,capacity–limited cell sites where combining many channels onto acommon antenna is desirable. Motorola ELPAs can support both linearand non–linear modulation formats. This means that it is possible to usean ELPA to combine and amplify both analog and digital carriers in acell site and transmit with the same antenna. The ELPA amplifiersupports all known techniques of modulation, including both wide bandand narrow band FDMA, TDMA, and CDMA.
The ELPA frame is designed to replace existing SC9600 LPA products.One ELPA frame can replace two SC9600 LPA frames containing thesame number and type of inputs and outputs at the top of the frame(s).
The ELPA frames can contain from one to six ELPA shelves. Each shelfcan support from two to four ELPA modules. Each shelf represents asector, which can be placed on its own individual antenna or combinedwith other sectors on a single antenna. Two ELPA Frames can besupported per cellular base station or BTS site.
Minimum number of ELPAs at a BTS site
The following is the minimum number of ELPAs required for each typeof site transmit antenna system:
� Omni–transmit site
At least one shelf with a minimum of two ELPA modules installed(one ELPA frame). The minimum number of modules for this siteconfiguration is two.
� 120 degree sector–transmit site
Three ELPA shelves with a minimum of two ELPA modules per shelf(one ELPA frame). The minimum number of modules for this siteconfiguration is six.
� 60 degree sector–transmit site
Six ELPA shelves with a minimum of two ELPA modules per shelf(one ELPA frame). The minimum number of modules for this siteconfiguration is 12.
Total number of RF carriers per ELPA
Each ELPA Module can be driven to the average rated output power withone CDMA carrier. One shelf (up to four ELPA modules) can power asingle CDMA carrier or 20 analog carriers. When more than one CDMAcarrier or more than 20 analog carriers are amplified, the output power
3

BTS Products – other than Japan – continued
CDMA SC Products System Resource Guide (CSSRG) June 20013-32
will be derated from 120 W. Refer to the ELPA Functional Descriptionor CDMA RF Planning Guide for further information concerning thederated power.
Multiple ELPA Modules on a sector
If the desired number of RF carriers and the per carrier power output tobe used on a sector exceeds the limits of two ELPA Modules, it isnecessary to equip the sector with additional ELPA Modules. Thestandard maximum number of ELPA Modules per sector is four. TheELPA Multicage option allows the standard maximum of four ELPAModules per sector to increase to eight modules per sector by combiningtwo shelves. This option requires additional hardware to couple shelvestogether in pairs.
Maximum ELPAs at a Site
The ELPA RF output power varies depending on the number of moduleswithin a sector. In practical applications, the RF carrier capacity of thesectors at most sites requires the minimum number of ELPA Modules.There are many applications with some sites having certain sectorsequipped with several ELPAs for additional RF carrier capacity.
If a site requires multiple ELPA Frames, the maximum number of ELPAModules at a BTS site is 48 (two frames with a total of 12 ELPA shelvesor six Multicages). Each ELPA Frame sector power output is generatedfrom the equipped ELPA Modules of one or two (Multicage option)shelves. Standard configurations allow for 60, 90, or 120 Watts persector. The Multicage option allows for 100, 150, or up to 200 Watts persector. A sector’s power can be increased by adding more ELPAModules. The Multicage option combines the power of two ELPAshelves per sector. It can be ordered from the factory new or can beretrofit in the field.
Table 3-6: Output Power/Sector vs. Number of Modules
Number of ELPA Modules Maximum Output Power Per Sector (at Top of Frame)
2–3–4 RF NetworkConfiguration
4–6–8 RF NetworkConfiguration
2 60 Watts N/A
3 90 Watts N/A
4 120 Watts 100 Watts
6 N/A 150 Watts
8 N/A 200 Watts
NOTEA minimum of two ELPA modules is required for each sector to provide soft fail redundancy.Multicage option supports the 4–6–8 RF Network configurations.
3
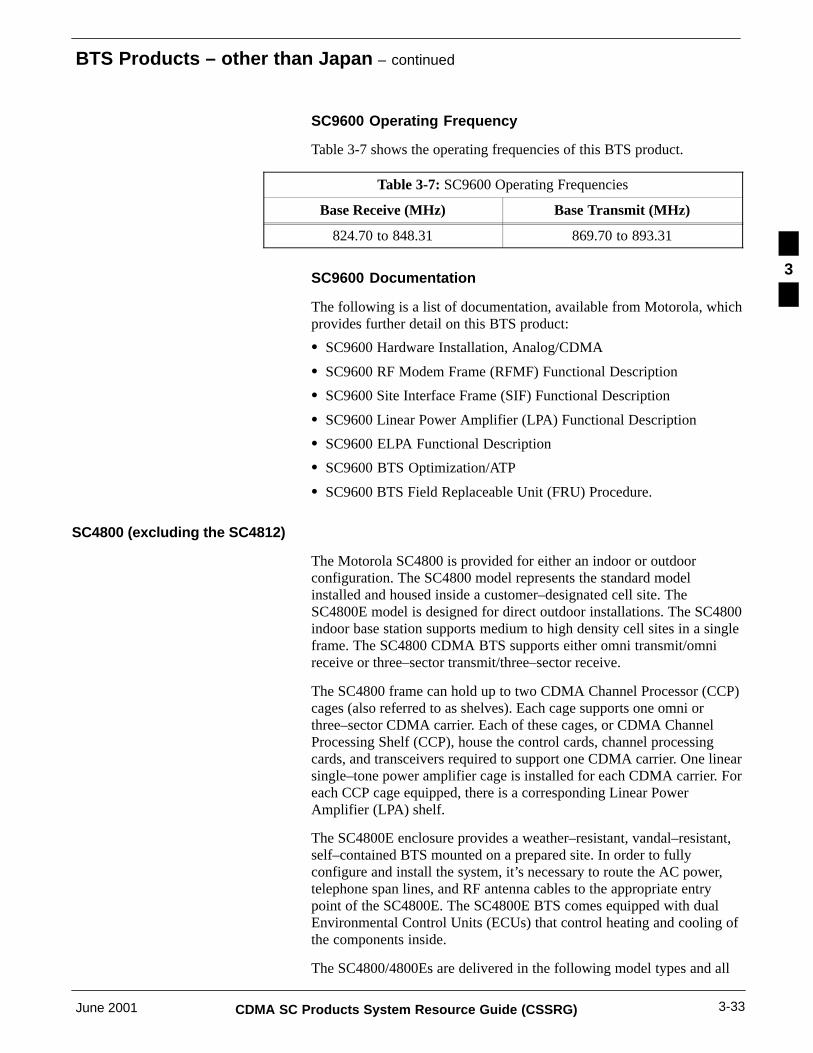
BTS Products – other than Japan – continued
June 2001 3-33CDMA SC Products System Resource Guide (CSSRG)
SC9600 Operating Frequency
Table 3-7 shows the operating frequencies of this BTS product.
Table 3-7: SC9600 Operating Frequencies
Base Receive (MHz) Base Transmit (MHz)
824.70 to 848.31 869.70 to 893.31
SC9600 Documentation
The following is a list of documentation, available from Motorola, whichprovides further detail on this BTS product:
� SC9600 Hardware Installation, Analog/CDMA
� SC9600 RF Modem Frame (RFMF) Functional Description
� SC9600 Site Interface Frame (SIF) Functional Description
� SC9600 Linear Power Amplifier (LPA) Functional Description
� SC9600 ELPA Functional Description
� SC9600 BTS Optimization/ATP
� SC9600 BTS Field Replaceable Unit (FRU) Procedure.
SC4800 (excluding the SC4812)
The Motorola SC4800 is provided for either an indoor or outdoorconfiguration. The SC4800 model represents the standard modelinstalled and housed inside a customer–designated cell site. TheSC4800E model is designed for direct outdoor installations. The SC4800indoor base station supports medium to high density cell sites in a singleframe. The SC4800 CDMA BTS supports either omni transmit/omnireceive or three–sector transmit/three–sector receive.
The SC4800 frame can hold up to two CDMA Channel Processor (CCP)cages (also referred to as shelves). Each cage supports one omni orthree–sector CDMA carrier. Each of these cages, or CDMA ChannelProcessing Shelf (CCP), house the control cards, channel processingcards, and transceivers required to support one CDMA carrier. One linearsingle–tone power amplifier cage is installed for each CDMA carrier. Foreach CCP cage equipped, there is a corresponding Linear PowerAmplifier (LPA) shelf.
The SC4800E enclosure provides a weather–resistant, vandal–resistant,self–contained BTS mounted on a prepared site. In order to fullyconfigure and install the system, it’s necessary to route the AC power,telephone span lines, and RF antenna cables to the appropriate entrypoint of the SC4800E. The SC4800E BTS comes equipped with dualEnvironmental Control Units (ECUs) that control heating and cooling ofthe components inside.
The SC4800/4800Es are delivered in the following model types and all
3

BTS Products – other than Japan – continued
CDMA SC Products System Resource Guide (CSSRG) June 20013-34
operate in the North American PCS frequency bands:
� SC4850
� SC4852
� SC4852R
� SC4850E
� SC4852E
� SC4852ER
In addition, the SC4820 and SC4820E operate in the Korean PCSfrequency bands.
� SC4820
� SC4820E.
The “E” version corresponds to outdoor enclosures. The “R” versionincorporates the required equipment to support Tower Top receiveAmplifiers (TTA) and optional 40 Watt transmit output.
There are also expansion frames for the SC4852 and SC4820. Theexpansion frames provide the capability to add more than two CDMAcarriers to a cell site.
Figure 3-4: SC4800
CCP 2 CCP 1
Distribution Shelf
RF Modem Frame
SCLPA Shelf
SCLPA Shelf
Carrier # 1
Carrier# 2
Carrier 1BBX
GLIMCC
Carrier 2BBX
GLIMCC
SC48xx CDMA Carrier Support
An SC4800 BTS can support up to two CDMA carriers. Each CCP shelf(or, cage) supports one CDMA carrier.
If needed, up to three expansion frames can be added to the first SC4800BTS frame. The SC485X expansion frames are identical to the firstframe except for the RF connection and distribution. In a maximumconfiguration, this allows for 8 CDMA carriers. For the SC4800E, twoadditional enclosures can be installed for a maximum configuration ofsix CDMA carriers.
Alternatively, the SC4812T may be used to expand SC485X sites andthe SC4812ET to expand SC485XE sites.
3

BTS Products – other than Japan – continued
June 2001 3-35CDMA SC Products System Resource Guide (CSSRG)
Table 3-8: CDMA Carrier Support
Number of shelves per BTS modem frame 2
Number of carriers per shelf – Omni 1
Number of carriers per shelf – three–sector 1
Number of carriers per shelf – six–sector N/A
Maximum number of CDMA modem frames:
SC48xx
SC48xxE
4
3
SC48xx Channel Element Support
The channel element support is provided by the MCC–8 card, same as inthe SC9600, in the CCP cages of the SC4800. The MCC channels can bepooled across the sectors within a given CCP cage, but cannot be pooledacross cages. In other words, the MCC cards are dedicated to a cage andcarrier frequency.
Table 3-9: Physical Traffic Channels
Physical Traffic Channels per MCC–24 N/A
Physical Traffic Channels per MCC–8 8
Minimum Number of MCC/Shelf 1 per sector+ 1 for
redundancy
Maximum Number of MCC/Shelf 17
Maximum Physical Traffic Channels/Shelf 136
Number of CDMA Shelves in Frame 2
Maximum Physical Traffic Channels/Frame 272
SC48xx RF Cabling
The SC4800 frame is capable of supporting a maximum of six receiveantenna input ports. Two RX (N–type) connectors are provided for eachsector within a cell, using a diversity receive scheme that minimizessignal fading. This provides three–sector operation with full diversityreceive. The Expansion Frames receive input signals from the StarterFrame through an expansion cable that connects the ports (EXP1, EXP2,or EXP3) on the Starter Frame to the appropriate ports on the ExpansionFrame.
There is a maximum of six transmit antenna ports: three for the firstcarrier and three for the second carrier.
Figure 3-5 and Figure 3-6 demonstrate the transmit combining that canbe used to combine up to eight carriers on a single set of antennas. Use a4:1 or 2:1 cavity combiner to combine four or two non–adjacent CDMAcarriers onto a single TX antenna. Use a combiner only when the carriers
3
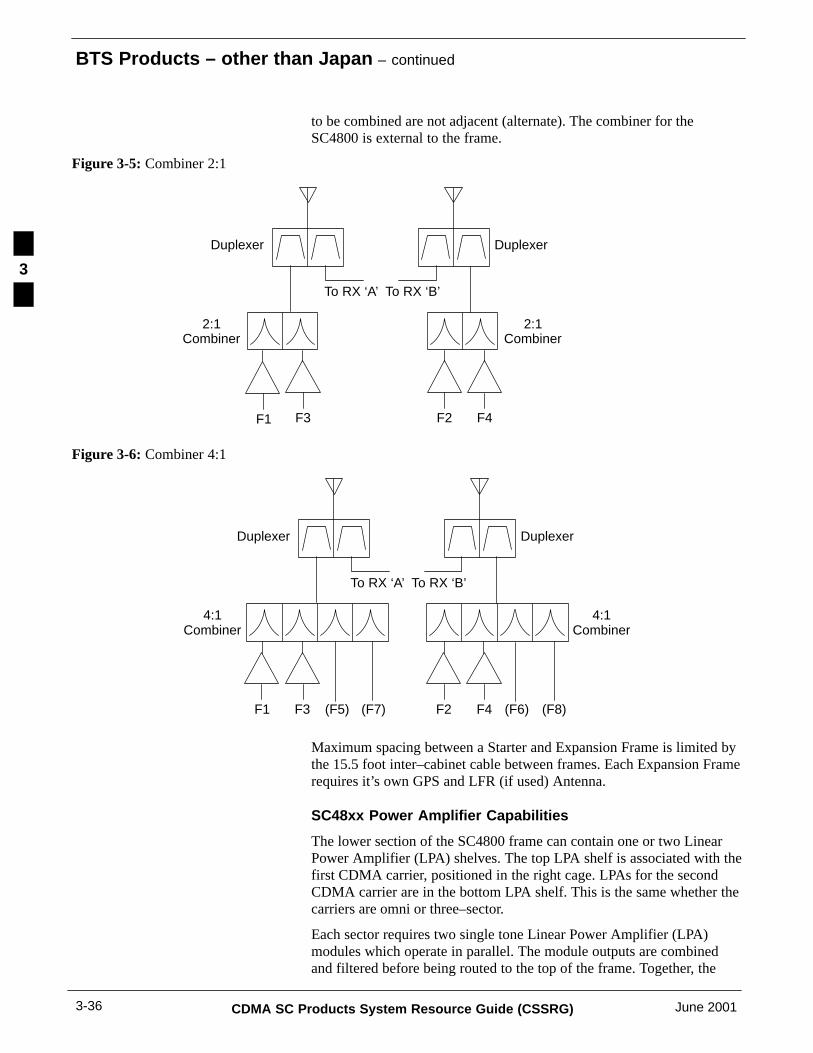
BTS Products – other than Japan – continued
CDMA SC Products System Resource Guide (CSSRG) June 20013-36
to be combined are not adjacent (alternate). The combiner for theSC4800 is external to the frame.
Figure 3-5: Combiner 2:1
F1 F2F3 F4
Duplexer
2:1Combiner
To RX ‘A’ To RX ‘B’
Duplexer
2:1Combiner
Figure 3-6: Combiner 4:1
F1 F2F3 F4(F5) (F6)(F7) (F8)
Duplexer
4:1Combiner
To RX ‘A’ To RX ‘B’
Duplexer
4:1Combiner
Maximum spacing between a Starter and Expansion Frame is limited bythe 15.5 foot inter–cabinet cable between frames. Each Expansion Framerequires it’s own GPS and LFR (if used) Antenna.
SC48xx Power Amplifier Capabilities
The lower section of the SC4800 frame can contain one or two LinearPower Amplifier (LPA) shelves. The top LPA shelf is associated with thefirst CDMA carrier, positioned in the right cage. LPAs for the secondCDMA carrier are in the bottom LPA shelf. This is the same whether thecarriers are omni or three–sector.
Each sector requires two single tone Linear Power Amplifier (LPA)modules which operate in parallel. The module outputs are combinedand filtered before being routed to the top of the frame. Together, the
3

BTS Products – other than Japan – continued
June 2001 3-37CDMA SC Products System Resource Guide (CSSRG)
LPA modules produce 20 watts of average output power per sector. Addtwo additional LPA modules to provide a total of 40 watts per sector.This is especially useful for link balance on the extended range models(those with the Tower Top Amplifier, or TTA).
The 20 Watts of average output power per sector holds true for allSC48XX models except the extended range models (SC4852R/4852ER)which offer 30–40 watts per sector.
There are up to four linear power amplifiers (LPAs) per sector combinedin soft–fail redundancy. In soft–fail redundancy, if an LPA module fails,the sector is not out of service but operating at reduced power. EachSC4850 and SC4820 amplifier delivers 7.5 Watts. Each SC4852amplifier delivers 10 watts. The SC4850 and SC4852 amplifiers can bemixed without adverse affects. Each amplifier operates independently.
SC48xx Operating Frequency
Table 3-10 shows the operating frequencies of this BTS product.
Table 3-10: SC4852/4850/4820 Operating Frequencies
Base Receive (MHz) Base Transmit (MHz)
SC4820 1750 to 1780 1840 to 1870
SC485x 1850 to 1910 1930 to 1990
SC48xx Documentation
The following is a list of documentation, available from Motorola, whichprovides further detail on this BTS product:
� SC4800 Hardware Installation
� SC4800/4800E BTS Functional Description
� SC4800E BTS Indoor Outdoor Enclosure Hardware Installation
� SC4800/4800E BTS Optimization/ATP
� SC4800 BTS Field Replaceable Unit (FRU) Procedure
� SC4800 CDMA 2nd Carrier Installation
� SC2450/4850/4852/4820 Starter Frame to Expansion FrameConversion.
SC4812
The SC4812 single frame CDMA BTS is an 800 MHz High Capacity,indoor, CDMA base station product designed to support medium to highdensity cell sites.The Motorola SC4812 Base Transceiver Subsystem(BTS) starter frame contains RX front–end and LPAs housed in oneframe. An expansion frame may be added to the SC4812 starter framefor increased carrier and channel capacity.
The SC4812 Standalone Frame (SAF) is designed for use with internalsingle–tone LPAs. The SC4812 CDMA BTS can be configured as anomni transmit/omni receive, three–sector transmit/ three–sector receive,or six–sector transmit/six–sector receive site.
3

BTS Products – other than Japan – continued
CDMA SC Products System Resource Guide (CSSRG) June 20013-38
The SC4812T BTS is available as an 800 MHz or 1900 MHz indoorBTS designed for use with internal single–tone LPA’s. The SC4812Tuses a new RF trunking technique that reduces the number of LPA’srequired and provides increased forward power capability.
The SC4812T (800 MHz) replaces the non–trunked version of theSC4812, SC2450, CDMA SC2400 with ELPA, and the CDMA SC9600.The SC4812T (1900 MHz) replaces the SC485X BTS. There is also anoutdoor version of the SC4812T, the SC4812ET, available in both the800 MHz and 1900 MHz frequency bands. The trunked LPA cage,trunking module, and trunked LPA sets will not be available to retrofit inthe product that was originally shipped with the conventional SC4812(in other words, non–trunked) LPA scheme.
Figure 3-7: SC4812
CCP 1
SC4812 BTS Frame
CDMA Channel
LPA Cages
Carrier 1, (2)BBX
MCC–E, GLI
Processor(Double Density)
Carrier 3, (4)BBX, MCC–E, GLI
SC4812 CDMA Carrier Support
The SC4812T (800 MHz) supports up to four CDMA carriers per framein omni through three–sector configuration and up to two CDMAcarriers per frame in four through six–sector configurations(non–adjacent carriers). SC4812T (800 MHz) sites can expand to amaximum of two frames for a total of eight CDMA carriers per omni orthree–sector site or up to four CDMA carriers per six–sector site.
The SC4812T (1900 MHz) supports up to four CDMA carriers per framein omni through three–sector configurations and up to two CDMAcarriers per frame in four through six–sector configurations(non–adjacent carriers). SC4812T (1900 MHz) sites can expand to amaximum of three frames for a total of 12 CDMA carriers for athree–sector site or up to six CDMA carriers for a six–sector site.
The single SC4812 Combined CDMA Channel Processor (C–CCP) cagesupports up to a total of twelve sector–carriers (for example,three–sector, four–carrier or six–sector, two–carrier).
3
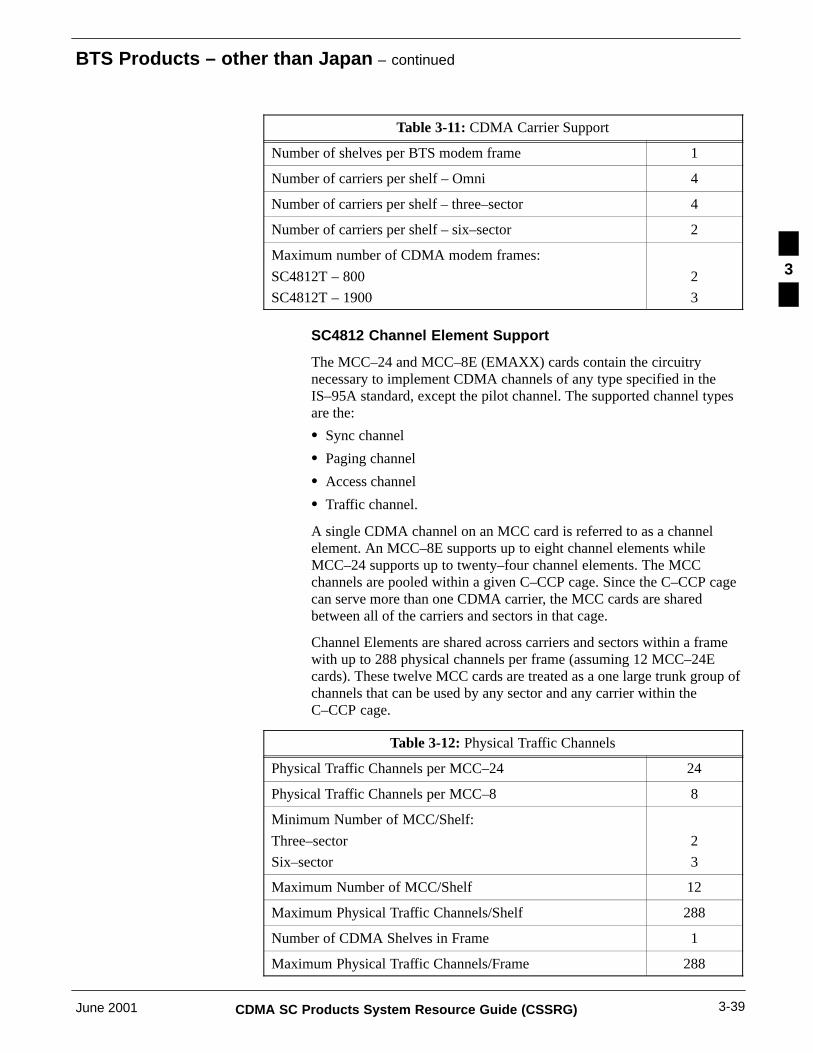
BTS Products – other than Japan – continued
June 2001 3-39CDMA SC Products System Resource Guide (CSSRG)
Table 3-11: CDMA Carrier Support
Number of shelves per BTS modem frame 1
Number of carriers per shelf – Omni 4
Number of carriers per shelf – three–sector 4
Number of carriers per shelf – six–sector 2
Maximum number of CDMA modem frames:
SC4812T – 800
SC4812T – 1900
2
3
SC4812 Channel Element Support
The MCC–24 and MCC–8E (EMAXX) cards contain the circuitrynecessary to implement CDMA channels of any type specified in theIS–95A standard, except the pilot channel. The supported channel typesare the:
� Sync channel
� Paging channel
� Access channel
� Traffic channel.
A single CDMA channel on an MCC card is referred to as a channelelement. An MCC–8E supports up to eight channel elements whileMCC–24 supports up to twenty–four channel elements. The MCCchannels are pooled within a given C–CCP cage. Since the C–CCP cagecan serve more than one CDMA carrier, the MCC cards are sharedbetween all of the carriers and sectors in that cage.
Channel Elements are shared across carriers and sectors within a framewith up to 288 physical channels per frame (assuming 12 MCC–24Ecards). These twelve MCC cards are treated as a one large trunk group ofchannels that can be used by any sector and any carrier within theC–CCP cage.
Table 3-12: Physical Traffic Channels
Physical Traffic Channels per MCC–24 24
Physical Traffic Channels per MCC–8 8
Minimum Number of MCC/Shelf:
Three–sector
Six–sector
2
3
Maximum Number of MCC/Shelf 12
Maximum Physical Traffic Channels/Shelf 288
Number of CDMA Shelves in Frame 1
Maximum Physical Traffic Channels/Frame 288
3
BTS Products – other than Japan – continued
CDMA SC Products System Resource Guide (CSSRG) June 20013-40
Because the SC4812T uses a single cage design with only 12–MCC slotsavailable, use the MCC24 in place of the MCC8E to provide addedcapacity across all the carriers within the frame. Choosing either theMCC24 or the MCC8E also provides the ability to grow at differentincrements since both, the MCC24 and MCC8E can be inter–mixed inthe cage.
The original MCC8 is not compatible with the SC4812Tfamily due to the new EMAXX and six–sector capabledesign features. Therefore, if a system has a mixture ofSC4812s and some other BTS product, separate channelelement spares are required.
NOTE
SC4812 RF Cabling
There are a maximum of twelve receive antenna input ports and amaximum of six transmit antenna ports.
The BTS requires two MPC cards. The expansion and modem framerequire two EMPC cards.
Use a 4:1 or 2:1 cavity combiner to combine four or two non–adjacentCDMA carriers onto a single TX antenna.
A combiner can be used only when the carriers that need tobe combined are not adjacent (in other words, alternatechannels).
NOTE
Odd channels can be combined on one antenna and even channels onanother. These combiners are installed in the SC4812 frame; a separateframe is not required. Figure 3-8 illustrates the use of the 2:1 and 4:1combiners.
3

BTS Products – other than Japan – continued
June 2001 3-41CDMA SC Products System Resource Guide (CSSRG)
Figure 3-8: Examples of SC4812 Combining Schemes
F4 F8F2 F6SC4812 Exp.
F1
F3 F7
Duplexer
BPBPBP
F1
F1
F1F2 F2
F5
F3
2:1 Combiner
4:1 Combiner
SC4812
SC4812SC4812SC4812F3 F4F1 F2
SC4812
1 Carrier
8 Carrier
2 Carrier 3 Carrier 4 Carrier
BP Bandpass Filter
SC4812 Power Amplifier Capabilities
The SC4812T uses a Trunking Module and a set of four LPA modulesper three–sectors of one carrier to provide 20 watts simultaneously percarrier–sector post duplex (60 watts total for a three–sector, one carrierBTS). Trunked Power is supported on BSS CDMA Release 2.8.1/2.8.3.Like trunked channels, trunking LPAs enables the BTS station to servemore traffic with fewer physical resources. For instance, in thenon–trunked design, a single carrier is typically served by six LPAmodules. A trunked LPA serves the same configuration with fourmodules, thereby improving both power consumption and reliability.The power consumption savings are simply due to the reduction in thenumber of modules. Even when serving little or no traffic, LPA modulesconsume considerable power. Therefore, the elimination of two modulesper carrier reduces the average power consumption of the base stationconsiderably.
Another significant benefit of trunking is operational flexibility. Thenature of CDMA provides that when the surrounding sites/sectors arelightly loaded, any particular sector can carry a load well over its design
3

BTS Products – other than Japan – continued
CDMA SC Products System Resource Guide (CSSRG) June 20013-42
capability. Trunked power enables LPA power to be directed to anysector in nearly any ratio.
Therefore, when one sector of the site needs more power than is typical,it can borrow power instantaneously from the other sectors of the site notexperiencing a peak load. Without this feature, the additional traffic goesunserved. This ability to handle traffic peaks that would otherwise gounserved allows operators to generate more revenue with Motorolainfrastructure than with that of competitors.
The Conventional (Non–Trunked) SC4812 frame cannot be upgraded tothe trunked SC4812T.
Each SC4812T CDMA frame can be equipped with up to two trunkedLPA (T–LPA) shelves, which are also known as cages. Each shelfcontains two trunked LPA Sets. Each SC4812T CDMA frame can beequipped with up to four trunked LPA Sets. Each trunked LPA Setconsists of four LPA modules, two fans, and a trunking module. Atrunked LPA Set provides 60W of TX power (at the top of the frame –post duplexer) shared among three–sector–carriers (in other words,three–sectors of one carrier).
The trunking module dynamically allocates power across sectors as thesubscriber load changes. The variable nature of CDMA transmit powerrequirements means that at any point in time one or more sectors arelikely to be experiencing less than a peak load. Therefore, when anysector needs more power than is typical, it can borrow powerinstantaneously from sectors not experiencing a peak load. A singlesector can have a maximum of 40 Watts available for its use as long asthe other sectors have a very light load of traffic.
SC4812 Operating Frequency
Table 3-13 shows the operating frequencies of this BTS product:
Table 3-13: SC4812 Operating Frequencies
Base Receive (MHz) Base Transmit (MHz)
SC4812T 1850 to 1910 1930 to 1990
SC4812 /T 824.70 to 848.31 869.70 to 893.31
SC4812 Documentation
The following is a list of documentation available from MotorolaTechnical Education and Documentation which provides further detail onthis BTS product.
� SC4812 BTS Hardware Installation
� SC4812 BTS Functional Description
� SC4812 BTS Optimization/ATP
� SC4812 BTS Field Replaceable Unit (FRU) Procedure
� SC4812T BTS Hardware Installation
3

BTS Products – other than Japan – continued
June 2001 3-43CDMA SC Products System Resource Guide (CSSRG)
� SC4812T BTS Optimization/ATP
� SC4812T BTS Field Replaceable Unit (FRU) Procedure
� SC4812T Expansion/Modem Frame Install
� SC4812ET BTS Hardware Installation
� SC4812ET BTS Optimization/ATP
� SC4812ET BTS Field Replaceable Unit (FRU) Procedure
� SC4812ET Battery/Heater Installation.
SC2400/2450
The SC2450 CDMA BTS is a single frame, indoor base station designedto support medium to high–density cell sites. Each CCP cage containsthe control cards, channel processing cards, and transceivers required tosupport one CDMA carrier. One single–tone linear power amplifier(STLPA) shelf is required per CDMA carrier. A two–carrier BTS musttherefore be equipped with two CCP cages and two STLPA shelves. TheSC2450 CDMA BTS supports the 800 MHz CDMA air interface ineither omni transmit/omni receive or three–sector transmit/three–sectorreceive configurations. The SC2450 platform allows for the combinationof two, three, or four SC2450 frames at a single cell site utilizing thesame set of antennas (when properly combined utilizing combiners andduplexers). Expansion allows for the combination of up to eight CDMAcarriers at a single cell site.
Figure 3-9: SC2400
CCP 2 CCP 1
Distribution Shelf
RF Modem Frame w/STLPA
Carrier 1BBX
GLIMCC
Carrier 2BBX
GLIMCC
CCP 2 CCP 1
Distribution Shelf
RF Modem Frame w/ELPA
ELPA Shelf # 3
ELPA Shelf # 2
Carrier 1BBX
GLIMCC
Carrier 2BBX
GLIMCC
ELPA Shelf # 1
STLPA Shelf #1
STLPA Shelf #2
SC2450 CDMA Carrier Support
Each SC2450 CDMA frame supports up to two CDMA RF (CCP) cages,and each CCP cage provides one CDMA carrier in either an omni orthree–sector configuration.
The mixed mode (CDMA and analog) SC2400 frame supports amaximum of one CDMA carrier.
3

BTS Products – other than Japan – continued
CDMA SC Products System Resource Guide (CSSRG) June 20013-44
Table 3-14: CDMA Carrier Support
Number of shelves per BTS modem frame 2
Number of carriers per shelf – Omni 1
Number of carriers per shelf – three–sector 1
Number of carriers per shelf – six–sector N/A
Maximum number of CDMA modem frames 4
SC2450 Channel Element Support
The MCC–8 card contains the circuitry necessary to implement CDMAchannels of any type specified in the IS–95A standard, except the pilotchannel. The supported channel types are the:
� Sync channel
� Paging channel
� Access channel
� Traffic channel.
A single CDMA channel on an MCC– 8 is referred to as a channelelement, and an MCC–8 supports up to eight channel elements.
The MCC channels can be pooled across the sectors within a given CCPcage, but cannot be pooled across cages. In other words, the MCC cardsare dedicated to a cage and carrier frequency.
Table 3-15: Physical Traffic Channels
Physical Traffic Channels per MCC–24 N/A
Physical Traffic Channels per MCC–8 8
Minimum Number of MCC/Shelf 1 per sector+ 1 for
redundancy
Maximum Number of MCC/Shelf 20
Maximum Physical Traffic Channels/Shelf 160
Number of CDMA Shelves in Frame 2
Maximum Physical Traffic Channels/Frame 320
SC2450 RF Cabling
Up to four TX carriers can be combined onto one antenna with a 2:1 or4:1 transmit combiner. The combiner for the SC2450 is external to theframe.
SC2450/SC2400 Power Amplifier Capabilities
The lower section of the SC2450 frame can contain one or two LinearPower Amplifier (LPA) shelves. The top LPA shelf is associated with the
3

BTS Products – other than Japan – continued
June 2001 3-45CDMA SC Products System Resource Guide (CSSRG)
first CDMA carrier, located in the right cage position. The second PAshelf is associated with the second CDMA carrier, located in the leftcage position.
Each sector uses two 12.6 watt Single Tone Linear Power Amplifier(STLPA) modules combined in the Combiner/Filter unit. A soft–failredundancy scheme is used to achieve the desired 20 Watt CDMA carrierpower. The two STLPA modules are placed in adjacent slots in the PAshelf. Each STLPA is independently controlled and monitored. When anSTLPA module fails, it takes itself out of service, and the total carrierpower then drops to 5 Watts (by about 6 dB).
The SC2400 ELPA retains all of the features offered by single channelamplifiers (in other words, output power level control) while adding newcapabilities, such as the elimination of standardized channel spacing.The SC2400 ELPA units are also compatible with mixed modeoperation, such that a customer using both analog and CDMA carriers ina cell site can use an ELPA module to combine and amplify both typesof carriers and transmit on the same antenna.
The lower section of the SC2400 frame can contain up to three ELPAshelves for three–sector configurations (one shelf per sector) or up to twoELPA shelves for omni configurations. In a three–sector configuration,the bottom ELPA shelf is associated with sector 1, the middle ELPAshelf is associated with sector two and the top ELPA shelf is associatedwith sector three.
There are two to four 30W ELPA modules per shelf. Failure of any onemodule does not reduce the performance of the other modules. However,it limits the output power capability of the sector. The number of ELPAmodules in the sector determines the total output power capability for thesector.
SC2450 Operating Frequency
Table 3-16 shows the operating frequencies of this BTS product:
Table 3-16: SC2450 Operating Frequencies
Base Receive (MHz) Base Transmit (MHz)
824.70 to 848.31 869.70 to 893.31
SC2450 Documentation
The following is a list of documentation available from MotorolaTechnical Education and Documentation which provides further detail onthis BTS product.
� BTS Hardware Installation, SC2400 CDMA 800/900 MHz
� BTS Functional Description, SC2400 CDMA 800/900 MHz
� BTS Optimization/ATP, SC2400 CDMA 800/900 MHz
� BTS Field Replaceable Unit (FRU) Guide, SC2400 CDMA 800/900MHz
3
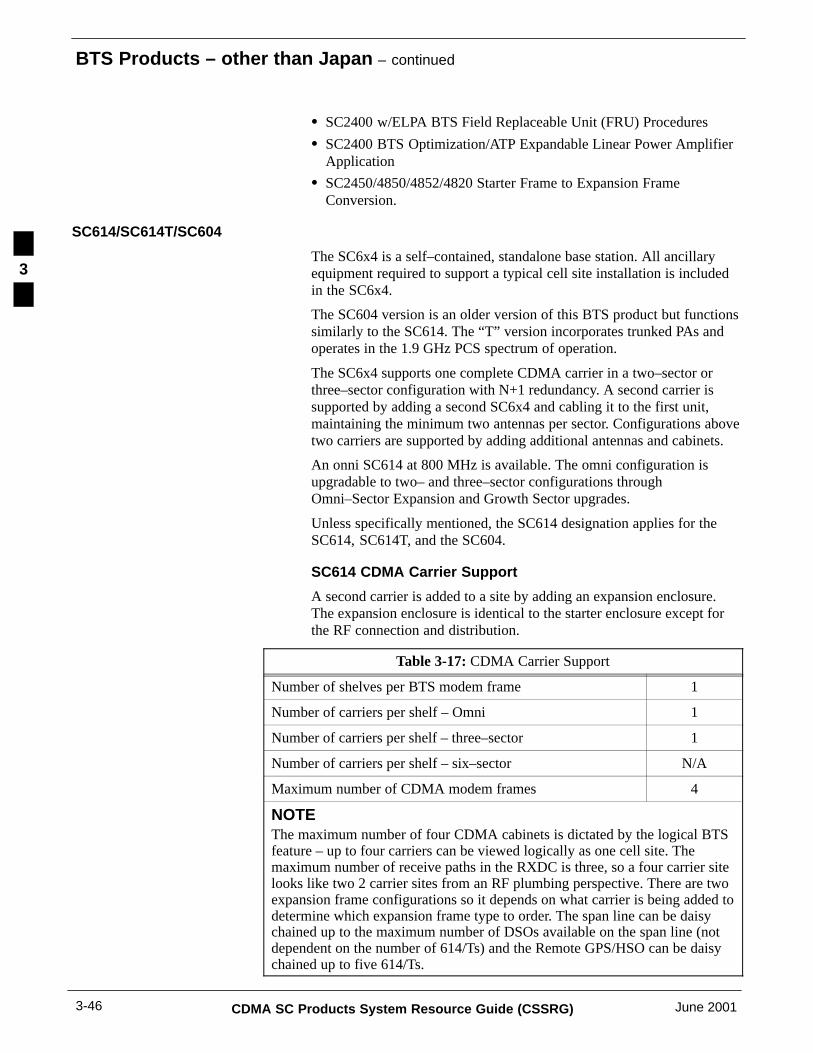
BTS Products – other than Japan – continued
CDMA SC Products System Resource Guide (CSSRG) June 20013-46
� SC2400 w/ELPA BTS Field Replaceable Unit (FRU) Procedures
� SC2400 BTS Optimization/ATP Expandable Linear Power AmplifierApplication
� SC2450/4850/4852/4820 Starter Frame to Expansion FrameConversion.
SC614/SC614T/SC604
The SC6x4 is a self–contained, standalone base station. All ancillaryequipment required to support a typical cell site installation is includedin the SC6x4.
The SC604 version is an older version of this BTS product but functionssimilarly to the SC614. The “T” version incorporates trunked PAs andoperates in the 1.9 GHz PCS spectrum of operation.
The SC6x4 supports one complete CDMA carrier in a two–sector orthree–sector configuration with N+1 redundancy. A second carrier issupported by adding a second SC6x4 and cabling it to the first unit,maintaining the minimum two antennas per sector. Configurations abovetwo carriers are supported by adding additional antennas and cabinets.
An onni SC614 at 800 MHz is available. The omni configuration isupgradable to two– and three–sector configurations throughOmni–Sector Expansion and Growth Sector upgrades.
Unless specifically mentioned, the SC614 designation applies for theSC614, SC614T, and the SC604.
SC614 CDMA Carrier Support
A second carrier is added to a site by adding an expansion enclosure.The expansion enclosure is identical to the starter enclosure except forthe RF connection and distribution.
Table 3-17: CDMA Carrier Support
Number of shelves per BTS modem frame 1
Number of carriers per shelf – Omni 1
Number of carriers per shelf – three–sector 1
Number of carriers per shelf – six–sector N/A
Maximum number of CDMA modem frames 4
NOTEThe maximum number of four CDMA cabinets is dictated by the logical BTSfeature – up to four carriers can be viewed logically as one cell site. Themaximum number of receive paths in the RXDC is three, so a four carrier sitelooks like two 2 carrier sites from an RF plumbing perspective. There are twoexpansion frame configurations so it depends on what carrier is being added todetermine which expansion frame type to order. The span line can be daisychained up to the maximum number of DSOs available on the span line (notdependent on the number of 614/Ts) and the Remote GPS/HSO can be daisychained up to five 614/Ts.
3

BTS Products – other than Japan – continued
June 2001 3-47CDMA SC Products System Resource Guide (CSSRG)
SC614 Channel Element Support
The Motorola Advanced Wireless Interface (MAWI) card is the centralcontroller and data processing module. It integrates many functions ofthe current SC CDMA platforms onto a single field replaceable unit(FRU). There are two sizes of the MAWI card – either a 16 channelelement or a 36 channel element card. It is possible to have a mixture of16 and 36 channel element MAWI cards in the SC614. The SC6x4 iscapable of physically supporting 48 to 144 physical channels.
Table 3-18: Physical Traffic Channels
Physical Traffic Channels per MAWI–36 36
Physical Traffic Channels per MAWI–16 16
Minimum Number of MAWI/Cabinet 1 per sector+ 1 for
redundancy
Maximum Number of MAWI/Cabinet 4
Maximum Physical Traffic Channels/Cabinet 144
Number of CDMA Shelves in Frame 1
Maximum Physical Traffic Channels/Frame 144
SC614 RF Cabling
The SC614 uses a dedicated pair of LPAs for each of the three–sectors.The two LPA modules are phase coupled by means of theSplitter/Combiner (S/C) module, which splits the TRX drive into twoequal components for application to the LPA module inputs andcombines the amplified outputs of the LPA modules for transmission viathe antenna. The use of two LPA modules per sector provides a fail–softcapability.
3

BTS Products – other than Japan – continued
CDMA SC Products System Resource Guide (CSSRG) June 20013-48
Figure 3-10: SC614 RF
Duplexer
SC614(T)
3 Carrier
1 Carrier 2 Carrier
TRXMAWI
SC614(T)
TRX
MAWISC614(T)
TRXMAWI
SC614(T)
TRXMAWI
SC614(T)
TRXMAWI
SC614(T)
TRXMAWI
The SC614T uses four LPA modules in a trunked configuration. Allthree–sectors share the resources of the trunked LPA bank. The trunkingtechnique allows more efficient use of the total available LPA powercapability than conventional approaches using dedicated LPA modulesfor each of the three–sectors. The use of multiple LPA modules in thepower amplifier assembly also prevents total loss of power in the eventof a single point failure. Failure of a single LPA module reduces poweroutput by approximately 1.5 dB across all three–sectors.
Timing information is derived from the GPS satellite signals by meansof a remotely located GPS head, which contains a GPS engine, antenna,and digital interface circuitry. Communication between the Remote GPS(RGPS) head and the BTS is provided by an RS–485 link that allows upto 2000 feet of physical separation between the BTS and the RGPS unit.A single RGPS head can supply timing signals for multiple SC614 /TBTS cabinets connected in a Master/Slave/Slave configuration.
SC614 Power Amplifier Capabilities
The SC614 provides a maximum of 20 Watts of continuous power persector (two LPAs per sector, with each LPA producing 10 Watts).
The SC614T uses the LPA trunking modules to provide 16 wattssimultaneously per carrier–sector post duplex (48 watts total for a
3

BTS Products – other than Japan – continued
June 2001 3-49CDMA SC Products System Resource Guide (CSSRG)
three–sector, one carrier BTS). Trunked Power is supported on BSSCDMA Release 2.8.1/2.8.3. Like trunked channels, trunking LPAsenables the BTS station to serve more traffic with fewer physicalresources. A single sector can have a maximum of 40 Watts available forits use as long as the other sectors have a very light load of traffic.
SC614 Operating Frequency
Table 3-19 shows the operating frequencies of this BTS product:
Table 3-19: SC614 Operating Frequencies
Base Receive (MHz) Base Transmit (MHz)
SC614T 1850 to 1910 1930 to 1990
SC614 824.70 to 848.31 869.70 to 893.31
SC614 Documentation
The following is a list of documentation, available from Motorola, whichprovides further detail on this BTS product:
� SC614/614T BTS Hardware Installation
� SC614/614T BTS Optimization/ATP
� SC614/614T BTS Field Replaceable Unit (FRU) Procedure
� SC614T Second Carrier Instruction Manual.
SC611/SC601
The SC6x1 products support a maximum of four carriers per site (onlyfor one sector; in other words, omni–site). Additional cabinets can belocated at the same physical site location but this additional equipment istreated as a separate BTS entity.
The SC601 version is an older version of this BTS product but functionssimilarly to the SC611.
The SC611 is a self–contained base station for either indoor or outdoorinstallations. It is designed for microcell applications such as infillcoverage, underground and inbuilding applications where space andinstallation flexibility are tantamount. The SC611 supports one CDMAcarrier (omni) configuration and is expandable to four CDMA carriersthrough the addition of SC611 Expansion Frames.
SC611 CDMA Carrier Support
The SC611 supports one complete CDMA carrier in an omni (singlesector) configuration but with no redundancy. A second carrier issupported by adding a second SC611 and cabling it to the first unit,maintaining the minimum two antennas per sector. Configurations abovetwo carriers are supported by adding additional antennas and cabinets.
A second carrier is added to a site by adding an expansion enclosure.The expansion enclosure is identical to the starter enclosure except forthe RF connection and distribution.
3

BTS Products – other than Japan – continued
CDMA SC Products System Resource Guide (CSSRG) June 20013-50
The SC611 Expansion Frame allows the SC611 to be expanded to twocarriers using only two antennas and up to four carriers using fourantennas. The Logical BTS feature for three–digit BTS products allowsup to four SC611 BTS units to be configured as one four–carrier cell siteon BSS CDMA Release 2.9.2. However, softer handoffs won’t besupported between multiple SC611 BTS units in a sectorizeddeployment. The SC611 Expansion Frame supports 800 MHz, 1.7 MHz,and 1.9 GHz frequency bands.
Table 3-20: CDMA Carrier Support
Number of shelves per BTS modem frame 1
Number of carriers per shelf – Omni 1
Number of carriers per shelf – three–sector N/A
Number of carriers per shelf – six–sector N/A
Maximum number of CDMA modem frames 4
NOTEThe maximum number of four CDMA cabinets is dictated by the logical BTSfeature – up to four carriers can be viewed logically as one cell site. There isonly one expansion frame configuration and can be daisy chained together foras many carriers as desired. The span line can be daisy chained up to themaximum number of DSOs available on the span line (not dependent on thenumber of 611s) and the Remote GPS/HSO can be daisy chained up to 10611s.
SC611 Channel Element Support
The MAWI is the central controller and data processing module. Itintegrates many functions of the current SC CDMA platforms onto asingle field replaceable unit. There are two sizes for the MAWI card,either a 16–channel element or a 36–channel element card. The SC611 iscapable of physically supporting 16 or 36 physical channels.
Table 3-21: Physical Traffic Channels
Physical Traffic Channels per MAWI–36 36
Physical Traffic Channels per MAWI–16 16
Minimum Number of MAWI/Cabinet 1
Maximum Number of MAWI/Cabinet 1
Number of CDMA Shelves in Cabinet 1
Maximum Physical Traffic Channels/Cabinet 36
SC611 RF Cabling
The configuration of either one SC611 and one SC611 Expansion Frameor two SC611 Expansion Frames shares receive paths in order tomaintain a minimum of two antennas per two–carrier cell site. Oneantenna is required for each additional SC611 BTS supporting from
3

BTS Products – other than Japan – continued
June 2001 3-51CDMA SC Products System Resource Guide (CSSRG)
three to four carriers. The SC611 Expansion Frames connect to theSC611 Starter Frame similarly as the SC614 configurations.
SC611 Power Amplifier Capabilities
The SC611 provides a maximum of seven Watts of continuous power.
SC611 Operating Frequency
Table 3-22 shows the operating frequencies of this BTS product.
Table 3-22: SC611 Operating Frequencies
Base Receive (MHz) Base Transmit (MHz)
1850 to 1910 1930 to 1990
1750 to 1780 1840 to 1870
824.70 to 848.31 869.70 to 893.31
SC611 Documentation
The following is a list of documentation available from MotorolaTechnical Education and Documentation which provides further detail onthis BTS product.
� SC611 CDMA BTS Hardware Installation
� SC611 CDMA BTS Functional Description
� SC611 (1.9 GHz) CDMA BTS Optimization/ATP
� SC611 (1.7 GHz) CDMA BTS Optimization/ATP
� SC611 (800 MHz) CDMA BTS Optimization/ATP.
SC300
The SC300 is an omni, single carrier product. The SC300 portfolioincludes two Field Replaceable Units (FRUs) with two different poweroutput options. The PicoCell provides up to 200 mW of transmit powerout and the MicroCell provides up to 10 Watts of transmit power out.The PicoCell is ideal for low power applications such as subway,underground, or inbuilding areas.
For higher power applications such as rural or hole filling areas, theMicroCell can be deployed. The MicroCell FRU is similar to thePicoCell FRU, however it includes a power amplifier to increase themaximum transmit power level to 10 Watts and the necessary circuitry tosupport receive diversity.
SC300 CDMA Carrier Support
The SC300 currently supports one complete CDMA carrier in an omni(single sector) configuration with no redundancy. A second carrier can beadded to a site by adding an additional FRU. The SC300 can support upto four CDMA carriers by daisy–chaining four FRUs.
3
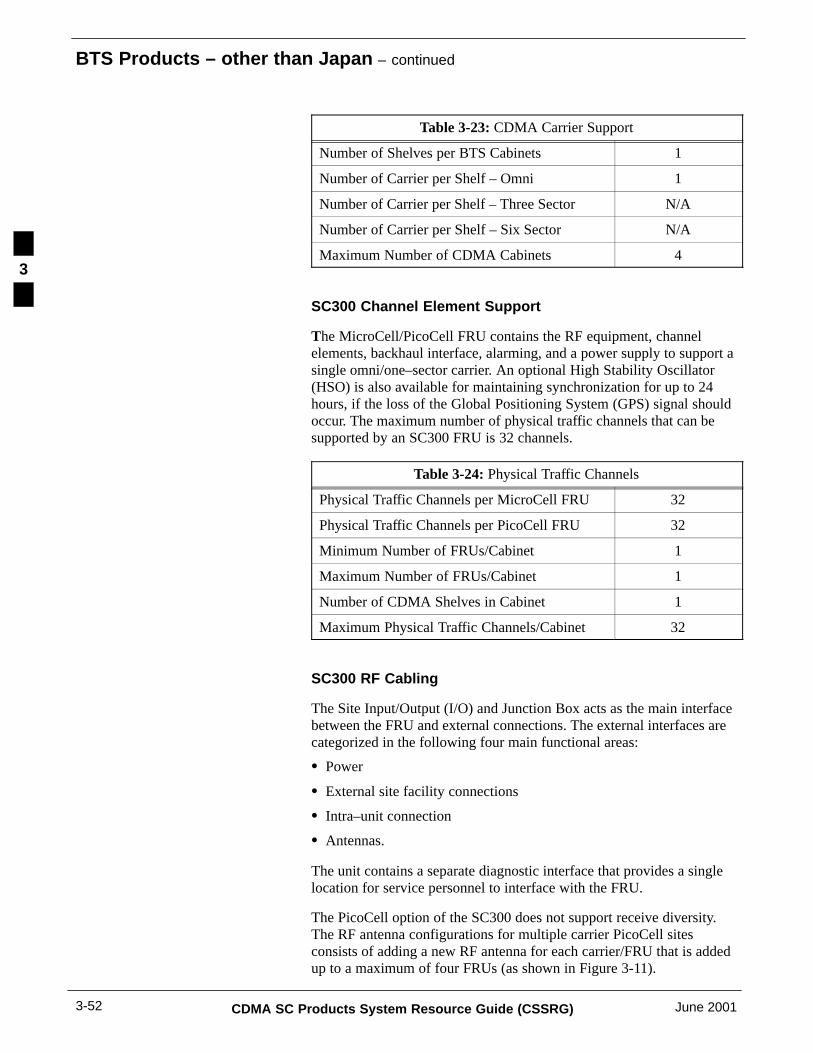
BTS Products – other than Japan – continued
CDMA SC Products System Resource Guide (CSSRG) June 20013-52
Table 3-23: CDMA Carrier Support
Number of Shelves per BTS Cabinets 1
Number of Carrier per Shelf – Omni 1
Number of Carrier per Shelf – Three Sector N/A
Number of Carrier per Shelf – Six Sector N/A
Maximum Number of CDMA Cabinets 4
SC300 Channel Element Support
The MicroCell/PicoCell FRU contains the RF equipment, channelelements, backhaul interface, alarming, and a power supply to support asingle omni/one–sector carrier. An optional High Stability Oscillator(HSO) is also available for maintaining synchronization for up to 24hours, if the loss of the Global Positioning System (GPS) signal shouldoccur. The maximum number of physical traffic channels that can besupported by an SC300 FRU is 32 channels.
Table 3-24: Physical Traffic Channels
Physical Traffic Channels per MicroCell FRU 32
Physical Traffic Channels per PicoCell FRU 32
Minimum Number of FRUs/Cabinet 1
Maximum Number of FRUs/Cabinet 1
Number of CDMA Shelves in Cabinet 1
Maximum Physical Traffic Channels/Cabinet 32
SC300 RF Cabling
The Site Input/Output (I/O) and Junction Box acts as the main interfacebetween the FRU and external connections. The external interfaces arecategorized in the following four main functional areas:
� Power
� External site facility connections
� Intra–unit connection
� Antennas.
The unit contains a separate diagnostic interface that provides a singlelocation for service personnel to interface with the FRU.
The PicoCell option of the SC300 does not support receive diversity.The RF antenna configurations for multiple carrier PicoCell sitesconsists of adding a new RF antenna for each carrier/FRU that is addedup to a maximum of four FRUs (as shown in Figure 3-11).
3

BTS Products – other than Japan – continued
June 2001 3-53CDMA SC Products System Resource Guide (CSSRG)
Figure 3-11: Multiple Carrier PicoCell RF Antenna Configuration
1 Carrier
Tx/Rx
2 Carriers
Tx/Rx
3 Carriers
Tx/Rx
4 Carriers
Tx/Rx
FRUF1
FRUF2
FRUF3
FRUF4
The MicroCell option of the SC300 does support receive diversity. TheRF antenna configurations for one, two, three, and four carrier MicroCellsites are shown in the figures below.
Figure 3-12: One and Two Carrier MicroCell RF Antenna Configurations
T = 50 Ohm Terminator
1 CarrierTx/Rx Rx
FRUF1
T
2 CarriersTx/Rx
Rx
Tx/Rx
T T
FRUF1
FRUF2
Figure 3-13: Three Carrier MicroCell RF Antenna Configuration
T = 50 Ohm Terminator
Tx/Rx Rx
FRUF3
T
3 Carriers
Tx/Rx
Rx
Tx/Rx
T T
FRUF1
FRUF2
3

BTS Products – other than Japan – continued
CDMA SC Products System Resource Guide (CSSRG) June 20013-54
Figure 3-14: Four Carrier MicroCell RF Antenna Configuration
T = 50 Ohm Terminator
4 CarriersTx/Rx
Rx
Tx/Rx
T T
FRUF1
FRUF2
Tx/Rx
Rx
Tx/Rx
T T
FRUF3
FRUF4
SC300 Power Amplifier Capabilities
As stated earlier, the SC300 can be ordered with two different poweroutput options. The PicoCell provides up to 200 mW of transmit powerout and the MicroCell provides up to 10 Watts of transmit power out.
SC300 Operating Frequency
Table 3-25 shows the operating frequencies of this BTS product.
Table 3-25: SC300 Operating Frequencies
Frequency Band Base Receive (MHz) Base Transmit (MHz)
800 MHz 824.70 to 848.31 869.70 to 893.31
1.9 GHz 1850 to 1910 1930 to 1990
SC300 Documentation
The following is a list of documentation that is available from MotorolaTechnical Education and Documentation that provides further detail onthis BTS product:
� SC300 BTS Hardware Installation, ATP, and FRU Procedures
� CDMA LMF Operator’s Guide
� CDMA LMF CLI Reference
� Grounding Guidelines.
Reduction of BTS Offerings
Many of the BTS products mentioned above are to be phased out. Thelatest version BTS, the SC4812T is the replacement product. Refer toTable 3-26 to determine the BTS product to use for new sites as well asexpansion to an existing site.
3

BTS Products – other than Japan – continued
June 2001 3-55CDMA SC Products System Resource Guide (CSSRG)
Table 3-26: BTS Selection
If using this Base Station Use this substitute for newsites
Use this substitute forexpanding sites
SC2450 SC4812T SC4812TX
SC4850/52E SC4812T/ET SC4812TX
SC4812 (non–trunked) SC4812T SC4812TX
SC2400 (CDMA) SC4812T SC4812TX (Separate LPAs)
SC9600 (CDMA) SC4812T SC4812T
SC2400/SC9600 (MixedMode)
SC9600 Analog
AND
SC4812 Modem Frame
SC9600 Analog
OR
SC4812 Modem Frame
SC9600 (Analog) SC9600 Analog SC9600 Analog
OR
SC4812 Modem Frame
3

BTS Products – for Japan
CDMA SC Products System Resource Guide (CSSRG) June 20013-56
Introduction
The BTS products for Japan have many similarities to the BTS productspreviously described. Some differences are:
� Support of the Japan CDMA air interface
� Marinet/LoTACS and HiTACS bands supported
� SC4840 available in six–sector, three–sector, or Omni configurations
� SC2440 available in three–sector or Omni configurations
� SC340 available in an Omni configuration
� Filtering and Combining equipage for:
– JCDMA only
– Co–located JCDMA and Analog
– Co–located JCDMA and PDC
– Co–located JCDMA, PDC and Analog.
SC4840
This product is designed for the Japan market. The SC4840 CDMA BTSis a two–frame, indoor base station designed to support medium tohigh–density cell sites. These frames are the Site Interface Frame (SIF)and the SC4840 Frame. Cable entry and exit is at the top of the frames,and all frames are front accessible. The SIF contains the:
� Cell Site Filters
� Multicouplers
� Duplexers
� Directional Couplers
� RFDS.
The SC4840 Frame houses the control and radio equipment for:
� Time synchronization
� Call processing
� Multi–tone Expandable Linear Power Amplifiers (ELPAs)
� Module Alarm Communication Hub (MACH) cards
� Base station fault management
� The dial–up modem.
The SC4840 CDMA BTS supports the Japan CDMA air interface inomni transmit/omni receive, three–sector transmit/three–sector receive orsix–sector transmit/six–sector receive configurations.
SC4840 CDMA Carrier Support
The SC4840 RFMF and SIF frames can support up to seven carriers in athree–sector or Omni configuration or up to four carriers in a six–sector
3

BTS Products – for Japan – continued
June 2001 3-57CDMA SC Products System Resource Guide (CSSRG)
configuration. Additionally, a six–sector system can support up to sevencarriers by adding a second SC4840 RFMF Frame.
The SC4840 RF Modem Frame supports two multiple carrier CDMAshelves. One spanline is routed to each CCP shelf, so two spanlines aresupported within the frame. The BBX card supports one sector (diversityreceive) and one CDMA carrier. The MCC–24E cards support 24physical traffic channels, the MCC–8E cards support 8 physical trafficchannels.
Table 3-27: CDMA Carrier Support
Number of shelves per BTS modem frame 2
Number of carriers per shelf – Omni 4
Number of carriers per shelf – three–sector 4
Number of carriers per shelf – six–sector 2
Maximum number of CDMA modem frames 4 (see note)
NOTEBasic site equipment is able to support up to four modem frames. The amountof frequency spectrum available may limit the number of CDMA carriers and,therefore, the number of frames needed.
SC4840 Channel Element Support
There are two MCC cards available (MCC–8E and MCC–24E) for theSC4840 Frame. The MCC card contains the circuitry necessary toimplement CDMA channels of any type specified in the ARIBSTD–T53, except the pilot. The MCC–8E contains eight channelelements and the MCC–24E contains 24 channel elements. Each channelelement contains circuitry to provide the CDMA modulation anddemodulation for the supported channel types. These are the:
� Sync channel
� Paging channel
� Access channel
� Traffic channel.
Each overhead group uses two channels:
1. Synchronization
2. Paging and access.
There is one overhead group required per–carrier, per–sector. Amaximum of three overhead groups can be provisioned per MCC card.Traffic channel redundancy is presently supported by equipping N+1MCCs, where N is equal to the number of traffic supporting MCCs asrequired. A minimum of one redundant MCC card is needed per CCPshelf.
A CCP shelf can be populated with up to twelve MCCs, for a total of 24MCC cards in the SC4840 Frame. CCP shelves can contain a mixture of
3

BTS Products – for Japan – continued
CDMA SC Products System Resource Guide (CSSRG) June 20013-58
either MCC version (MCC–8E and /or MCC–24E). Therefore, a CCPshelf, originally configured with only MCC–8Es, can later be expandedwith the MCC–24E to grow capacity.
Channel Elements are shared across carriers and sectors within aCCP–12 cage. Pooling of the MCC resources is the same as SC4812, allchannel elements can be pooled across all carriers within a CCP–12shelf.
Table 3-28: Physical Traffic Channels
Physical Traffic Channels per MCC–24 24
Physical Traffic Channels per MCC–8 8
Minimum Number of MCC/Shelf 1 per sector+ 1 for
redundancy
Maximum Number of MCC/Shelf 12
Maximum Physical Traffic Channels/Shelf 288
Number of CDMA Shelves in Frame 2
Maximum Physical Traffic Channels/Frame 576
SC4840 RF Cabling
The Site Interface Frame (SIF) supports the Marinet, LoTACS, andHiTACS bands and is used with the SC4840 platform. The SIF providesthe transmit and receive RF path functions necessary to interface theSC4840 Frame to the antennas. It also contains RF path diagnosticequipment (RFDS). Up to twelve receive and twelve transmit antennascan be brought to the SIF for distribution to the SC4840 Frame. This issufficient to support omni, three– or six–sector configurations.
There are three ways to add additional SC4840 frames in a BTS usingthe logical BTS function:
� Add HiTACS SC4840 BTS to existing LoTACS SC4840 BTS
� Add LoTACS SC4840 BTS to existing HiTACS SC4840 BTS
� Add a HiTACS expansion SC4840 BTS to existing HiTACS SC4840BTS.
By using the logical BTS feature, up to four Modem Frames can beconnected to a single SIF.
3

BTS Products – for Japan – continued
June 2001 3-59CDMA SC Products System Resource Guide (CSSRG)
Figure 3-15: SC4840
CCP 1 CCP 2
ELPA Shelves
Distribution Shelf
BBX, MCC,
CDMA ChannelProcessor(Double Density)
RF Modem FrameSite Interface Frame
GLI
BBX, MCC,
GLI
LNAs & Site Filters
Triplexers/Duplexers
Hybrid Duplexers
RFDSUp to fourcarriers
Up to fourcarriers
SC4840 Power Amplifier CapabilitiesThe SC4840 Frame supports up to six 2–Up ELPA shelves or up to three4–Up ELPA shelves. A single 2–Up ELPA shelf is loaded with twoELPA modules and a Bandpass filter which provide the necessaryamplification and filtering for the CDMA carriers for a single sector. Asingle 4–Up ELPA shelf is loaded with up to four ELPA modules and aBandpass filter which provide the necessary amplification and filtrationfor the CDMA carriers for a single sector.
Each SC4840 Frame can support either Single Density ELPA modules inthe Marinet and LoTACS band or Single Density ELPA modules in theHiTACS band. Double Density ELPA modules are supported in theHiTACS band only. Double Density ELPA modules can only be usedwith 2–Up ELPA shelves. Single Density and Double Density ELPAmodules cannot be mixed in the same ELPA shelf. Marinet/LoTACSmodules and HiTACS modules can not be mixed in the same frame, norcan 2–Up and 4–Up ELPA shelves be mixed in the same frame.
The maximum allowable average power is 70 watts per sector using twoSD ELPA modules, or 140 watts per sector using four SD ELPAmodules or two DD ELPA modules (measured at the top of the SC4840frame).
SC4840 Operating Frequency
Table 3-29 shows the operating frequencies of this BTS product.
Table 3-29: SC4840 Operating Frequencies
FrequencyBand
Base Receive (MHz) Base Transmit (MHz)
Marinet 887 to 889 832 to 834
LoTACS 898 to 901 843 to 846
HiTACS 915 to 925 860 to 870
3
BTS Products – for Japan – continued
CDMA SC Products System Resource Guide (CSSRG) June 20013-60
The RF Modem frame is the interface between the span lines to/from theCBSC. The ELPA portion of the frame is the interface between the RFModem frame and the SIF. A total of two RFMFs are allowed.
A CSM (GPS) is required for each RFMF.
SC4840 Documentation
The following is a list of documentation available from MotorolaTechnical Education and Documentation which provides further detail onthis BTS product.
� SC4840 BTS Hardware Installation
� SC4840 RF Modem Frame (RFMF) Functional Description
� SC4840 Site Interface Frame (SIF) Functional Description
� SC4840 BTS Optimization/ATP
� SC4840 ELPA Guide
� SC4840 BTS Field Replaceable Unit (FRU) Procedure.
SC2440
The SC2440 CDMA BTS is a single–frame, indoor base stationdesigned to support medium–density cell sites. Cable entry and exit is atthe top of the frame, and the frame is front accessible. The SC2440CDMA BTS Frame contains the:
� Cell Site Filters
� Multicouplers
� Duplexers
� Directional Couplers
� RFDS.
It also houses the control and radio equipment for:
� Time synchronization
� Call processing
� Multi–tone Expandable Linear Power Amplifiers (ELPAs)
� Module Alarm Communication Hub (MACH) cards
� Base station fault management
� The dial–up modem.
The SC2440 CDMA BTS supports the Japan CDMA air interface inomni transmit/omni receive and three–sector transmit/three–sectorreceive.
Each SC2440 Frame can support Single Density ELPA modules in eitherthe LoTACS band or HiTACS band. Double Density ELPA modules aresupported in the HiTACS band only. LoTACS modules and HiTACSmodules cannot be mixed in the same frame. Therefore, the entire ARIBSTD–T53 frequency allocation is not serviced by a single frame.
The capacity of an SC2440 Frame is related to the:
3

BTS Products – for Japan – continued
June 2001 3-61CDMA SC Products System Resource Guide (CSSRG)
� Spanline support of the SC2440 BTS architecture
� Number of CDMA carriers supported by shelf and frame architectures
� Number of CDMA carriers that can be supported by the LoTACSspectrum or the HiTACs spectrum
� Physical traffic channels supported in each frame.
SC2440 CDMA Carrier Support
The SC2440 Frame is designed to support one multiple carrier CDMAshelf. Spanlines are routed to the CCP shelf with a maximum of sixspanlines supported within the frame. The BBX card supports one sector(diversity receive) and one CDMA carrier. The MCC–24E cards support24 physical traffic channels, the MCC–8E cards support eight physicaltraffic channels.
Expanding an omni–configured SC2440 BTS to three–sector coveragerequires the addition of the appropriate filters, ELPA shelves, bandpassfilters, modules and BBX cards in the SC2440 Frame.
Table 3-30: CDMA Carrier Support
Number of shelves per BTS modem frame 1
Number of carriers per shelf – Omni 4
Number of carriers per shelf – three–sector 4
Number of carriers per shelf – six–sector N/A
Maximum number of CDMA modem frames 1
SC2440 Channel Element Support
There are two MCC cards available (MCC–8E and MCC–24E) for theSC2440 Frame. Refer to the SC4840 Channel Element Support sectionfor further description of these channel cards.
Channel Elements are shared across carriers and sectors within aCCP–12 cage. Pooling of the MCC resources is the same as SC4812, allchannel elements can be pooled across all carriers within a CCP–12shelf.
Table 3-31: Physical Traffic Channels
Physical Traffic Channels per MCC–24 24
Physical Traffic Channels per MCC–8 8
Minimum Number of MCC/Shelf 1 per sector+ 1 for
redundancy
Maximum Number of MCC/Shelf 12
Maximum Physical Traffic Channels/Shelf 288
Number of CDMA Shelves in Frame 1
Maximum Physical Traffic Channels/Frame 288
3

BTS Products – for Japan – continued
CDMA SC Products System Resource Guide (CSSRG) June 20013-62
SC2440 RF Cabling
The SC2440 Frame provides the transmit and receive RF path functions,as well as the RF path diagnostic equipment (RFDS). Up to six receiveand three transmit antennas can be brought to the SC2440 Frame. This issufficient to support omni– or three–sector configurations. The SC2440Frame contains the filtering and combining equipment necessary for thefollowing JCDMA systems:
� JCDMA only and co–located JCDMA and PDC
� Sites with CDMA only use the JCDMA/PDC Triplexers
� Sites with co–located JCDMA and PDC use the JCDMA/PDCTriplexers with the externally mounted Hybrid Duplexer.
Figure 3-16: SC2440
CCP 1
ELPA Shelves
LNAs
Distribution Shelf
CDMA ChannelProcessor(Double Density)
RF Modem Frame
BBX, MCC,
GLI
RFDS
Rx FiltersDuplexersTriplexers
Up to four carriers
SC2440 Power Amplifier Capabilities
The SC2440 Frame supports up to three 2–Up ELPA shelves. A single2–Up ELPA shelf is loaded with two ELPA modules and a Bandpassfilter, which provides the necessary amplification and filtering for theCDMA carriers for a single sector. Up to six ELPA modules aresupported per frame.
Each SC2440 Frame can support either Single Density ELPA modules inthe Marinet/LoTACS band or Single Density ELPA modules in theHiTACS band. Double Density ELPA modules are supported in theHiTACS band only. Marinet/LoTACS modules and HiTACS modulescannot be mixed in the same frame. Single Density and Double DensityELPA modules cannot be mixed in the same ELPA shelf.
The maximum allowable average transmitter power output is 50 wattsper sector using two SD ELPA modules or 100 watts per sector usingtwo DD ELPA modules (measured at the top of the SC2440 frame).
SC2440 Operating Frequency
Table 3-32 shows the operating frequencies of this BTS product.
3

BTS Products – for Japan – continued
June 2001 3-63CDMA SC Products System Resource Guide (CSSRG)
Table 3-32: SC2440 Operating Frequencies
FrequencyBand
Base Receive (MHz) Base Transmit (MHz)
Marinet 887 to 889 832 to 834
LoTACS 898 to 901 843 to 846
HiTACS 915 to 925 860 to 870
SC2440 Documentation
The following is a list of documentation available from MotorolaTechnical Education and Documentation which provides further detail onthis BTS product.
� SC2440 BTS Hardware Installation
� SC2440 BTS Optimization/ATP
� SC2440 BTS Field Replaceable Unit (FRU) Procedure.
SC340
The SC340 is an omni single carrier product. The product portfolioincludes two Field Replaceable Units (FRUs) with two different poweroutput options. The PicoCell provides up to 200 mW of transmit powerout and the MicroCell provides up to five Watts of transmit power out.The PicoCell is ideal for low power applications such as subway,underground, or inbuilding areas.
For higher power applications such as rural or hole filling areas, theMicroCell can be deployed. The MicroCell FRU is similar to thePicoCell FRU. However, it includes a power amplifier to increase themaximum transmit power level to five Watts and the necessary circuitryto support receive diversity.
SC340 CDMA Carrier SupportThe SC340 currently supports only one complete CDMA carrier in anomni (single sector) configuration with no redundancy. In the future, asecond carrier can be added to a site by adding an expansion/additionalFRU.
Table 3-33: CDMA Carrier Support
Number of Shelves per BTS Cabinets 1
Number of Carrier per Shelf – Omni 1
Number of Carrier per Shelf – Three Sector N/A
Number of Carrier per Shelf – Six Sector N/A
Maximum Number of CDMA Cabinets 1
NOTEFuture multiple carrier expansions will be available with feature1165D. With this feature, which is targeted for Release 15, up to fourcarriers can be supported by adding expansion/additional SC340FRUs.
3

BTS Products – for Japan – continued
CDMA SC Products System Resource Guide (CSSRG) June 20013-64
SC340 Channel Element Support
The MicroCell/PicoCell FRU contains the RF equipment, channelelements, backhaul interface, alarming, and a power supply to support asingle omni/one–sector carrier. An optional High Stability Oscillator(HSO) is also available for maintaining synchronization for up to 24hours, if the loss of the Global Positioning System (GPS) signal shouldoccur. The maximum number of physical traffic channels that can besupported by an SC340 FRU is 16 channels.
Table 3-34: Physical Traffic Channels
Physical Traffic Channels per MicroCell FRU 16
Physical Traffic Channels per PicoCell FRU 16
Minimum Number of FRUs/Cabinet 1
Maximum Number of FRUs/Cabinet 1
Number of CDMA Shelves in Cabinet 1
Maximum Physical Traffic Channels/Cabinet 16
NOTEFuture channel element expansions are proposed with feature 1165E.With this feature, an SC340 FRU option with 32 physical channelelements will be available.
SC340 RF Cabling
The Site Input/Output (I/O) and Junction Box acts as the main interfacebetween the FRU and external connections. The external interfaces arecategorized in the following four main functional areas:
� Power
� External site facility connections
� Intra–unit connection
� Antennas.
The unit contains a separate diagnostic interface that provides a singlelocation for service personnel to interface with the FRU.
The PicoCell option of the SC340 does not support receive diversity.The RF antenna configurations for multiple carrier PicoCell sitesconsists of adding a new RF antenna for each carrier/FRU that is addedup to a maximum of four FRUs (as shown in Figure 3-17).
3
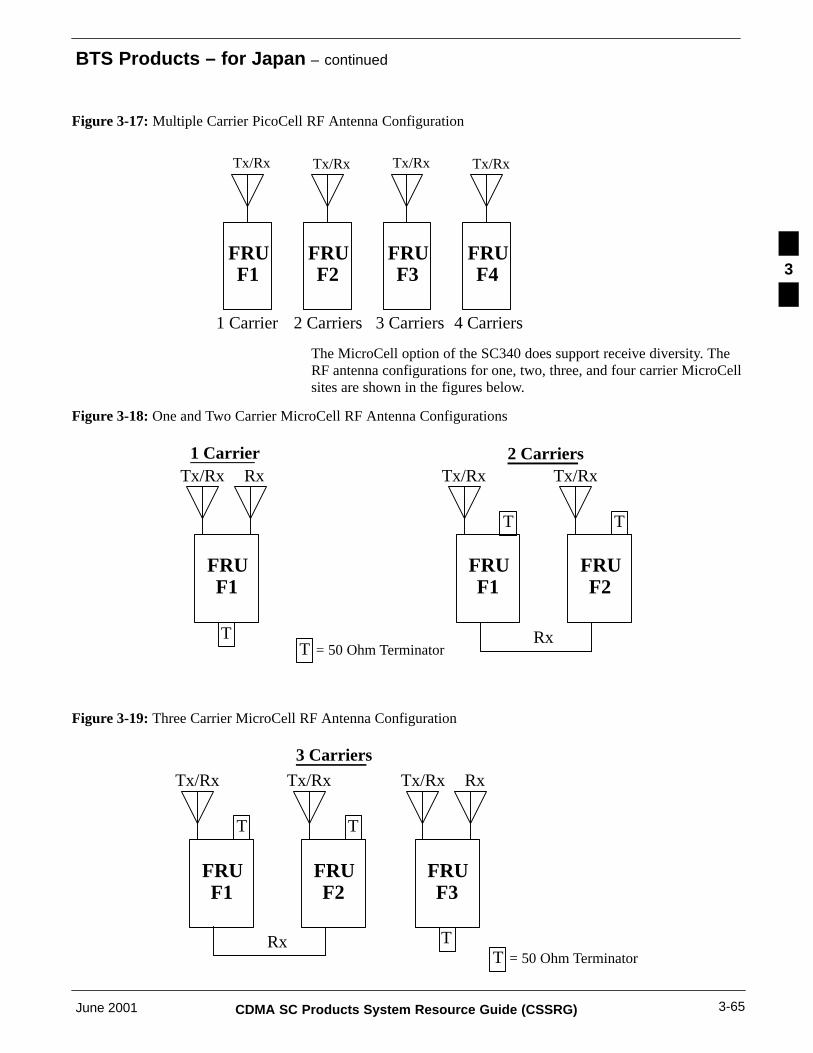
BTS Products – for Japan – continued
June 2001 3-65CDMA SC Products System Resource Guide (CSSRG)
Figure 3-17: Multiple Carrier PicoCell RF Antenna Configuration
1 Carrier
Tx/Rx
2 Carriers
Tx/Rx
3 Carriers
Tx/Rx
4 Carriers
Tx/Rx
FRUF1
FRUF2
FRUF3
FRUF4
The MicroCell option of the SC340 does support receive diversity. TheRF antenna configurations for one, two, three, and four carrier MicroCellsites are shown in the figures below.
Figure 3-18: One and Two Carrier MicroCell RF Antenna Configurations
T = 50 Ohm Terminator
1 CarrierTx/Rx Rx
FRUF1
T
2 CarriersTx/Rx
Rx
Tx/Rx
T T
FRUF1
FRUF2
Figure 3-19: Three Carrier MicroCell RF Antenna Configuration
T = 50 Ohm Terminator
Tx/Rx Rx
FRUF3
T
3 Carriers
Tx/Rx
Rx
Tx/Rx
T T
FRUF1
FRUF2
3

BTS Products – for Japan – continued
CDMA SC Products System Resource Guide (CSSRG) June 20013-66
Figure 3-20: Four Carrier MicroCell RF Antenna Configuration
T = 50 Ohm Terminator
4 CarriersTx/Rx
Rx
Tx/Rx
T T
FRUF1
FRUF2
Tx/Rx
Rx
Tx/Rx
T T
FRUF3
FRUF4
SC340 Power Amplifier Capabilities
As stated earlier, the SC340 can be ordered with two different poweroutput options. The PicoCell provides up to 200 mW of transmit powerout and the MicroCell provides up to five Watts of transmit power out.
SC340 Operating Frequency
Table 3-35 shows the operating frequencies of this BTS product.
Table 3-35: SC340 Operating Frequencies
Frequency Band Base Receive (MHz) Base Transmit (MHz)
LoTACS (see Note) 898 to 901 843 to 846
HiTACS 915 to 925 860 to 870
NOTEFuture features 4108 will allow for LoTACs support
SC340 Documentation
The following is a list of documentation that is available from MotorolaTechnical Education and Documentation that provides further detail onthis BTS product:
� SC340 BTS Hardware Installation, ATP, and FRU Procedures
� CDMA LMF Operator’s Guide
� CDMA LMF CLI Reference
� Grounding Guidelines.
3

Pilot Beacon
June 2001 3-67CDMA SC Products System Resource Guide (CSSRG)
Introduction
The application for Pilot Beacon is in coverage areas where HardHandoff (HHO) is required from a CDMA Carrier to another CDMACarrier on a different frequency or a CDMA Base Transceiver Station(BTS) to an Analog BTS. Motorola’s Pilot Beacon is a transmit–onlyproduct that acts as a trigger mechanism for HHO by generating a pilot,paging, and synchronization signal on the same frequency as the CDMAcarrier currently servicing the mobile subscriber.
The 800 MHz and 1.9 GHz Indoor Pilot Beacons are omni,non–redundant CDMA transmitters providing Pilot, Paging, andSynchronization information for over–the–air interface to a CDMAsubscriber unit. The Pilot Beacon is designed to facilitate hard hand–offs(HHO) between carriers within a CDMA system and/or from a CDMAsystem to an analog/(AMPS/TACS) system.
The indoor unit may be used with the SC9650, SC2450, SC4812, andSC4852 systems, as well as indoor applications of the SC611 and SC614base stations. Multi–sector indoor sites are supported by installing onePilot Beacon box for each sector requiring a Beacon.
The Pilot Beacon may be co–located at a cell site with a BTS or may belocated at a remote site. The Pilot Beacon is designed to support omni–and multi–sectored RF configurations. The Pilot Beacon product canshare the existing cell site antennas via connection to directionalcouplers in each desired RF path of the BTS. The Pilot Beacon productsupports separate antennas connected directly to the Beacon unit.
Pilot Signaling Power
The Pilot Beacon is capable of supplying an output pilot power asindicated in Table 3-36. The output power is scaleable in increments of0.25 dB steps. Table 3-36 lists the powers for the different frequencybands.
Table 3-36: Pilot Beacon Output Power
Frequency Band Maximum
800 MHz 2.5 W
1.9 GHz 2 W
Typical installations consist of a coupler being used to feed the RF signalfrom the pilot beacon into an existing antenna at the site. The loss of thecoupler is typically 10 dB. Therefore the maximum output powerprovided in the preceding table would be decreased by 10 dB.
Number of Pilot Signals
The Pilot Beacon is capable of supporting up to three unique carrierfrequencies per sector (application dependent and BSS CDMA Release2.9.2).
3

Pilot Beacon – continued
CDMA SC Products System Resource Guide (CSSRG) June 20013-68
Table 3-37: Pilot Beacon Operating Frequencies
Base Transmit (MHz)
1930 to 1990
869.70 to 893.31
Pilot Beacon Documentation
The following is a list of documentation available from MotorolaTechnical Education and Documentation which provides further detail onthis product.
� Indoor Pilot Beacon Instruction Manual CDMA 800/1900 MHz
� Outdoor Pilot Beacon Instruction Manual CDMA 1.9 GHz.
3

June 2001 CDMA SC Products System Resource Guide (CSSRG)
Chapter 4: Intelligent Network (IN)
Table of Contents
Intelligent Network (IN) 4-1. . . . . . . . . . . . . . . . . . . . . . . . . . . . . . . . . . . . . . . . . . . Introduction 4-1. . . . . . . . . . . . . . . . . . . . . . . . . . . . . . . . . . . . . . . . . . . . . .
DMX–HLR 4-2. . . . . . . . . . . . . . . . . . . . . . . . . . . . . . . . . . . . . . . . . . . . . . . . . . . . . Introduction 4-2. . . . . . . . . . . . . . . . . . . . . . . . . . . . . . . . . . . . . . . . . . . . . .
Message Register (MR) 4-5. . . . . . . . . . . . . . . . . . . . . . . . . . . . . . . . . . . . . . . . . . . Message Register (MR) 4-5. . . . . . . . . . . . . . . . . . . . . . . . . . . . . . . . . . . . . 4

Table of Contents – continued
CDMA SC Products System Resource Guide (CSSRG) June 2001
Notes
4
Intelligent Network (IN)
June 2001 4-1CDMA SC Products System Resource Guide (CSSRG)
Introduction
The Intelligent Network is made up of many different components.Some of these components are the:
� Distributed Mobile Exchange – Home Location Register (DMX–HLR)
� Message Register (MR).
4

DMX–HLR
CDMA SC Products System Resource Guide (CSSRG) June 20014-2
Introduction
The Home Location Register (HLR) is an Intelligent Network (IN)element that stores, manages, and controls the subscriber database. TheHLR also performs call processing, mobility management, and specialresource data functions therefore interfacing to other IN elements. TheHLR/VLR/SCP functionality is responsible for controlling the servicesand features throughout the network.
The HLR can be acquired in two different versions:
� DMX HLR
� IS41 HLR.
The difference between the DMX HLR and the IS41 HLR is that theDMX HLR is proprietary to Motorola and communicates EMX to EMXonly. The IS41 HLR can communicate between EMXs and with anyother third party switch equipment.
Both versions of the HLR support the following features:
� Management Interface
The HLR offers an efficient, user–friendly subscriber informationmanagement interface.
� Centralizes Service Provisioning
The HLR improves system performance by relieving the switch of itsprovisioning functionality by using single point provisioning. Thisprovides the operator the capability to provision subscribersindividually in one common location. The HLR maintains thepermanent subscriber service profile which allows users to benefitfrom network features and services.
� Fully Redundant Hardware Platform
The HLR resides on a scalable, fault–tolerant platform that can beconfigured in several ways. These configurations includeActive/Standby and Standalone. These configurations maintain anup–to–date HLR database in case of failure or a planned downtime.
The HLR also supports interfaces to third–party intelligent peripherals.This enables cellular operators to increase their system capacity.
The DMX HLR uses the Remote Subscriber Management (RMSI)provisioning interface. It provides a line–driven interface that is suitablefor use by an operator or provisioning system.
Limiting Factors
The limiting factors to the HLRs capacity to perform call processing are:
� The number of CPUs installed
� The amount of main memory per CPU
� The number of communications links between the EMXs and theHLR.
4

DMX–HLR – continued
June 2001 4-3CDMA SC Products System Resource Guide (CSSRG)
Because the Exception Reporting and Alarms Distribution (ERAD)changes from release to release, please check the back of the customerdocumentation manual in order to determine what the ERADs for thesystem mean.
Determining Utilization
Utilization can be determined by executing VIEWSYS and checking thefollowing:
� CPU utilization (press F1)
� Disk I/O rate (press F8)
� Cache hit rate (press F7).
Perform PUP LISTCACHE $DATAn, STAT to check cache memoryutilization.
Because the ERADs change from release to release, please check theback of the customer documentation manual in order to determine whatthe ERADs for the system mean.
Planning Limits
Non–mated pair HLRs should be kept at under 80% utilization.
Mated pair HLRs can use one processor to do call processing while theother is idle. In this case, the active HLR should be kept at under 80%utilization while the other HLR is at 0%.
Refer to the DMX/HLR B1 document for any planning limits.
Symptoms of Resource Overload
Overload can be determined by viewing the IPR–785 messages whichare output from the EMX. Execute VIEWSYS and then check thefollowing:
� CPU Utilization (press F1)
CPU Utilization should be under 80%. The presence of persistentlyhigher CPU rates indicate that the system is undersized.
� Disk I/O Rate (press F8)
The Disk I/O Rate should be one or below in all Call ProcessingCPUs. The presence of higher disk rates indicates insufficient cache.
� Page Fault Rate (press F3)
Page faults should be at zero in all Call Processing CPUs. Thepresence of page faults indicates that memory is oversubscribed.
Because the ERADs change from release to release, please check theback of the customer documentation manual in order to determine whatthe ERADs for the system mean.
Reducing Utilization/Capacity Improvement
The capacity planning for the DMX HLR is determined by theperformance characteristics of the platform, the applications, andparameters that characterize the targeted customer environment.
4

DMX–HLR – continued
CDMA SC Products System Resource Guide (CSSRG) June 20014-4
Link capacity is determined by calculating the total amount of inboundand outbound traffic to the HLR. These results are then used todetermine the minimum number of links required at the HLR.
All HLRs should be sized to measure capacity and hardwarerequirements. This sizing should be done by the HLR Product Group andis based upon information that determines the capacity requirements ofthe market and customer.
The capacity of the HLR is a mathematical model, which may be foundin the B1 document. This model is used to determine configurationinformation based on capacity requirements such as:
� Call mix
� Transaction ratios
� Feature useage
� Configuration options
� Expected subscriber levels
� Expected busy hour call attempts (BHCA).
4

Message Register (MR)
June 2001 4-5CDMA SC Products System Resource Guide (CSSRG)
Message Register (MR)
The Message Register (MR), which supports the IS–637 protocol,provides messaging services to Narrowband Advanced Mobile PhoneService (NAMPS) and Code Division Multiple Access (CDMA) cellularsubscribers. The MR is connected, via a DMX link, to a single EMX2500/5000 gateway that supports Enhanced DMX Messaging.
The Message Register interfaces with Intelligent Peripheral Devices(IPD) that adhere to Cellular Digital Messaging Protocol (CDMP),Telocator Alphanumeric Protocol (TAP), Telocator Network PagingProtocol (TNPP), or Octel Command Language (OCL) specifications.
The MR supports the following features:
� Digital Page
� Custom Text Message
� Voice Mail Notification
� Fax Notification
� Call Completion Service (within a DMX network only)
� Mobile Activity Status (within a DMX network only).
See the Message Register Operations Manual for detailed informationabout these features.
Limiting Factors
Load balancing is the most common limiting factor for the MessageRegister. Load balancing problems can be caused by any of thefollowing:
� Increased subscriber activity
Due to the many variables that must be considered when subscriberactivity increases, contact Motorola before making any changes toyour system.
� Hardware and software configuration
Changes in hardware or software configuration, due to hardware orsoftware failures or rearchitecture, will impact system load balance.This is corrected through performance analysis and tuning.
� Disk utilization
Heavy disk utilization is usually caused by:
– Increased subscriber activity or the hardware and softwareconfiguration
– Poor cache setting
– Excessive memory utilization which can create adverse impacts ondisk utilization.
Correcting the above usually fixes any disk utilization problems.
� Batch Schedules
Schedule batch activities outside of peak activity periods.
4

Message Register (MR) – continued
CDMA SC Products System Resource Guide (CSSRG) June 20014-6
� Transient Processes
Because these processes are usually difficult to identify, they can bethe most common factor for poor load performance. Proper systemperformance analysis will identify the offending process. Tandemtechnical expertise may be required to identify transient processes andto reduce or eliminate their occurrences.
Determining Utilization
This is best addressed through acquired expertise and Tandem training.Some simple Tandem tools, e.g., Peek, Viewsys, and Measure, can beused for snapshot values, but must be used with care and understandingsince their use can have an adverse effect on system performance.
Get expert help from and work with Motorola’s Core SystemEngineering (CSE) group.
Planning Limits
Planning limits for the Message Register are the following:
� 30 pages per second for a subscriber base of 200,000
� 25 pages per second for a subscriber base of 500,000
� 20 pages per second for a subscriber base of 1,000,000.
Symptoms of Resource Overload
The following are usually symptoms of overload:
� Poor response time
� Transactions timeouts
� CPU utilization greater than 60%.
The ERAD subsystem monitors and scrolls system and application errormessages. Support procedures should include the monitoring of allERAD messages. Refer to the Message Register Operation Manual –Alarms and Messages (ERAD) for details.
Reducing Utilization/Capacity Improvement
Any factor which limits system utilization must be uncovered andcorrected. The most useful source for gaining a perspective of systemutilization is through the ongoing monitoring of ERADs. Refer to theERAD manual for information regarding errors and possible correctivemeasures.
4

June 2001 CDMA SC Products System Resource Guide (CSSRG)
Chapter 5: Operations and Maintenance
Table of Contents
Operations and Maintenance 5-1. . . . . . . . . . . . . . . . . . . . . . . . . . . . . . . . . . . . . . . . Introduction 5-1. . . . . . . . . . . . . . . . . . . . . . . . . . . . . . . . . . . . . . . . . . . . . .
Operations and Maintenance Center – Radio (OMC–R) 5-2. . . . . . . . . . . . . . . . . . Introduction 5-2. . . . . . . . . . . . . . . . . . . . . . . . . . . . . . . . . . . . . . . . . . . . . .
SwitchMATE 5-15. . . . . . . . . . . . . . . . . . . . . . . . . . . . . . . . . . . . . . . . . . . . . . . . . . . Introduction 5-15. . . . . . . . . . . . . . . . . . . . . . . . . . . . . . . . . . . . . . . . . . . . . .
Universal Network Operations (UNO) 5-17. . . . . . . . . . . . . . . . . . . . . . . . . . . . . . . . Introduction 5-17. . . . . . . . . . . . . . . . . . . . . . . . . . . . . . . . . . . . . . . . . . . . . .
5

Table of Contents – continued
CDMA SC Products System Resource Guide (CSSRG) June 2001
Notes
5

Operations and Maintenance
June 2001 5-1CDMA SC Products System Resource Guide (CSSRG)
Introduction
Providing Operations and Maintenance support preserves data andcorrects data or network faults when they occur. The following elementsmaintain the SuperCell system as it expands:
� Operations and Maintenance Center – Radio
� SwitchMATE
� UNO.
5
Operations and Maintenance Center – Radio (OMC–R)
CDMA SC Products System Resource Guide (CSSRG) June 20015-2
Introduction
The Operations and Maintenance Center – Radio (OMC–R) interfacesdirectly to the Centralized Base Station Controller (CBSC) and acts as adata collection and mediation device for SuperCell events, statistics, andconfiguration. The OMC–R also supports a command line interface forfault management, configuration management, performancemanagement, and network monitoring functions. In addition, it containsthe Management Information Base (MIB) which is the master of allconfiguration data in the SuperCell system.
The OMC–R provides the following functionality:
� Event/Alarm Management
Event Management logs events for future use. Alarm Managementpresents the operator with a toolset to manage the alarms.
� Performance Management
Performance Management provides for the collection of statistics andcall information. These are placed into a database and logging file andmay be be viewed using tabular or graphical reports.
� Call Detail Log (CDL) Collection
Call Detail Log (CDL) Collection is an important OMC–R functionthat represents a substantial portion of the CPU load on the platform.
� Configuration Management
Configuration Management provides the operator the ability to displayor modify data in the database and to distribute data changes to theinvolved network elements.
� Security Management
Security Management provides password and login access to thesystem.
� Software Load Management
Software Management provides the mechanisms required to downloadsoftware to the network elements.
� Fault Management
Fault Management provides the OMC–R with the support for the CLIcommands necessary to enable or disable devices in the network andto determine their status.
A small number of Tandem Helix PeaceMaker 2 (PM 2) platforms arestill in use, but the PM 2 platform is not considered here. However, twoOMC–R platforms are currently supported:
� Tandem Helix PeaceMaker 3 (PM3)
The Tandem Helix utilizes three processors to provide hardware faulttolerance. A two–out–of–three voting scheme is used to detect andisolate a faulty processor, permitting the remaining two processors tocontinue providing service with reduced fault tolerance.Multiprocessing is not supported since the three processors execute
5

Operations and Maintenance Center – Radio (OMC–R) – continued
June 2001 5-3CDMA SC Products System Resource Guide (CSSRG)
the same code in lock–step. The PeaceMaker 3 processor operates at100 MHz and has 128 Mbytes of RAM.
� Sun E4500
The Sun E4500 is supported in a two processor SymmetricMulti–Processing (SMP) configuration. In the SMP configuration, aprocess may run on either processor. The two processor configurationdoes not provide twice the throughput of a single processor because ofprocess scheduling and control overhead, but more significantly,serialized operations and single–threaded processes are essentiallylimited to a single processor.
The significance of this limitation is that the event manager, which isinvolved in most OMC–R based activities, can never utilize more than50% of the total CPU capacity (100% of one processor) because it issingle–threaded. This is also true of other processes, most notably theMIB process, but the event manager typically utilizes more CPUcapacity than any other OMC–R process. However, the two processorconfiguration provides significantly greater throughput than a singleprocessor configuration.
In the sections that follow, suggested OMC–R limits are presented basedupon an allocation of processor resource that has been foundexperimentally to provide adequate performance. Information isprovided to explain how the suggested limits were derived and to permitthe operator to estimate the impact of modifying one or more of thelimits. The operator may choose either to use the suggested limits or toestablish alternate limits based upon his assessment of the impact givenhis understanding of the way he will be utilizing the OMC–R.Mechanisms for determining the growth potential for the OMC–Rdomain given the limits the operator accepts are then described.
Limiting Factors
The processor capacity on the OMC–R imposes limits on the callprocessing load supported by the CBSCs in the domain of the OMC–R.Processing of CDLs is the single most expensive OMC–R loadcomponent, and limits must be placed on the CDL generation to assureadequate processing capacity. The limit on CDL generation ratetranslates directly to a limit on the number of calls that can be processedby the CBSCs under the OMC–R.
Processor memory also limits the size of the system administeredthrough the OMC–R, but only to the extent that increasing system sizereduces OMC–R performance in terms of response times for CLIcommand execution. Disk space limitations are important only to theextent that the duration that CDL and event logs can be stored is reducedas the size of the OMC–R increases.
For the majority of network configurations, the CDL limits will bedominant. It is unlikely to encounter system size limitations before theCDL limits are reached as the system grows.
The CDL and system size limitations are shown in Table 5-1 for both theTandem Helix PM 3 platform and the Sun E4500 platform. The number
5

Operations and Maintenance Center – Radio (OMC–R) – continued
CDMA SC Products System Resource Guide (CSSRG) June 20015-4
of CBSCs is constrained to eight by software limitations, but the otherlimits specified in the table are based primarily upon empirical data fromthe lab and field as described in the following sections.
The hourly CDL limit is established by limiting the CPU utilization forCDLs to approximately 40% on the Helix and 50% of one processor onthe Sun. An additional 10% of the CPU capacity is allocated to theprocessing of alarms and events on the Helix and 30% of one processoris allocated on the Sun. The remaining CPU capacity is reserved for CLIand script execution, PM data collection and processing, and bursts inCDL and event traffic.
It is important to note the OMC–R can be operated at CDL rates abovethe limits presented in Table 5-1, but the OMC–R response time tooperator CLI commands will increase and may become unacceptable.Similarly, the operator may find the response time to commandsunacceptable at the suggested limits and may elect to size the system sothat a lower CDL load will be presented to the OMC–R. Equationsrequired to approximate the relationship between CLI response time andnon–CLI utilization are provided below.
Table 5-1: OMC–R Capacities
Peacemaker 3 Sun
Maximum CDLs:
� Per hour
� Per day
140,000
1,400,000
700,000
7,000,000
Maximum combined TCHs 20,000 40,000
Maximum BTSs 500 1,000
Maximum Carrier–Sectors 3,900 19,500
Maximum Sectors 2,200 11,000
Maximum CBSCs 8 8
Maximum CLI sessions 16 16
Maximum active CLI sessions 4 16
Maximum alarm/event subscriptions 4 16
The hourly CDL rate may be estimated by adding the mobile originationattempts and mobile termination assignment attempts together. In termsof PM data, this is equivalent to sum(pmc_10_hr.peg_count_1 +pmc_10_hr.peg_count_6) summed for the two half hours during the busyhour and summed for all MMs under the OMC–R. The rate should bedetermined by averaging the bouncing busy hour (BBH) data for the fivebusiest days in a one week period, eliminating any days that areabnormal (for example, holidays, etc.).
The daily CDL rate assumes approximately 10 busy hour equivalents perday and is used to estimate the maximum storage duration for CDL
5

Operations and Maintenance Center – Radio (OMC–R) – continued
June 2001 5-5CDMA SC Products System Resource Guide (CSSRG)
records. With an average of approximately 970 bytes per CDL record,the Tandem Helix OMC–R platform provides storage for 2,000,000 CDLrecords for a nominal period of 32 hours, assuming two pairs of 4G(gigabyte) disk drives are used on the OMC–R and a 2G disk partitionfor CDL storage. The Sun OMC–R platform provides storage for26,000,000 CDL records for a nominal period of 80 hours, assuming fivepairs of 18G (gigabyte) disk drives are used on the OMC–R and a 25Gdisk partition is used for CDL storage.
The number of traffic channels (TCHs) is the total number of equippedTCHs in the system. The number of traffic channels can be determinedusing the following command:
display cbsc–cbsc# siteconf
This command returns one line per BTS under the CBSC. The rightmostentry on the line represents the number of equipped non–inhibitedMaintenance Control Center Channel Elements (MCCCE) at the BTS.This data may be imported into a spreadsheet to facilitate generating atotal traffic channel count.
The number of carrier–sectors is the total number of carriers equipped inall sectors. For example, a BTS with six sectors and two carriers wouldhave 12 carrier–sectors. In an active system, the number ofcarrier–sectors may be determined by executing the following CLIcommand on the OMC–R:
display omcr allstatus | grep –v BBXR | egrep –c “BBX|MAWI”
The number of sectors is the total number of equipped sectors in thesystem. The display cbsc siteconf command used above to obtain acount of traffic channels may also be used to count the number ofsectors, but the method is a bit more involved. For each BTS, thecommand returns the number of traffic channels equipped per sector.This data may be imported to a spreadsheet to facilitate generating asector count.
The maximum number of CLI sessions that can be created is limited bysoftware to 16 for both the Tandem Helix and Sun platforms. An activeCLI session is one that is executing CLI commands or scripts containingCLI commands. The CLI limits were established assuming a targetaverage response time of at most 10 seconds for simple CLI commands.An event subscription represents a CLI session that has events enabled.
Determining Utilization
Two primary utilization factors are of significance on the OMC–Rplatform:
1. The CPU resource required for processing CDLs, alarms, events,PM data, and browse server traffic (all referred to below as events).
2. The CPU resource required to process CLI workload.
The CLI and event processing activities are treated differently becausethe method of assessing their impact differs. The event processing load
5

Operations and Maintenance Center – Radio (OMC–R) – continued
CDMA SC Products System Resource Guide (CSSRG) June 20015-6
can be assessed by estimating the fraction of total CPU resource used, inother words, CPU utilization.
On the other hand, the CLI load typically utilizes all available CPUresource; the less CPU resource available, the longer the execution timeof each CLI. Delays in processing events are generally not important aslong as the desired throughput is maintained with no loss of data. Delaysin processing CLI activity must be kept within limits tolerable to theoperator.
Methods are given below to estimate the CPU utilization for processingevent workloads and to estimate the response times for CLI activities.CLI response times are related to CPU utilization for event workloads,because the CPU resource used to process event workloads is notavailable for CLI processing and thereby increases CLI response times.
Although budgets were established for event processing CPU utilizationand targets were established for CLI response times in the LimitingFactors section to provide meaningful load limits, the operator mayengineer for higher CDL loads at the expense of longer CLI responsetimes or vice versa. The number of active CLI sessions may also bereduced either to improve the CLI response times or to increase the CDLload with no impact to response times. The number of CLIs that can beexecuted in parallel with a given average response time also increases ifthey are executed during a maintenance window when the callprocessing load is low.
As previously mentioned, the recommended CDL and event processinglimits are established to keep the CPU utilization below 50% on theHelix and below 80% of one processor (40% of total CPU resource) onthe Sun for processing these workloads. The CDL component, which isdominant, is limited to 40% utilization on the Helix and 50% of oneprocessor on the Sun.
The CDL and event processing utilization may be estimated using thefollowing equations. Overhead for PM data collection and CDL browseserver is also included.
The Helix PM 3 CPU utilization, excluding CLI execution, may beestimated as follows:
Utilization = CDL * 0.0102 + Alarm * 0.0228 + Auto * 0.0134 + Status * 0.0297 + Manual * 0.0111 + Log * 0.0113 +Subscriptions * 0.00125 * (Alarm + Auto + Status + Manual) + PM + Browse [EQ 5–1]
Where:
CDL is the per second CDL arrival rate
Alarm is the per second alarm arrival rate
Auto is the per second arrival rate of Automatic type events(excluding alarms)
Status is the per second arrival rate of Status type events (excludingManual types)
Manual is the per second arrival rate of Manual type events
Log is the per second arrival rate of Log Only type events
5

Operations and Maintenance Center – Radio (OMC–R) – continued
June 2001 5-7CDMA SC Products System Resource Guide (CSSRG)
Subscription is the number of CLI sessions with events enabled
PM is the CPU utilization for PM data collection, about 0.05
Browse is the CPU utilization for the portable browser(cdl_browse_server), about 0.05.
The recommended utilization resulting from CDL and event traffic is50% on the Helix. The data used to create the above equation, coupledwith the CDL processing budget, have been used to establish arecommended limit of 140,000 CDLs per hour. The steady state Alarmrate is assumed to be 1800 per hour, and the steady state event rate (totalof Auto, Status, Manual, and Log types as defined previously) isassumed to be 3600 per hour. A limit of four subscriptions is alsoassumed.
The Sun E4500 CPU utilization for one processor may be estimated asfollows:
Utilization = CDLs * 0.00272 + Alarm * 0.00674 + Auto * 0.00484 + Status * 0.00796 + Manual * 0.00353 + Log * 0.00342+ Subscriptions * 0.00037 * (Alarm + Auto + Status + Manual) + PM + Browse [EQ 5–2]
Where:
CDL is the per second CDL arrival rate
Alarm is the per second alarm arrival rate
Auto is the per second arrival rate of Automatic type events(excluding alarms)
Status is the per second arrival rate of Status type events (excludingManual types)
Manual is the per second arrival rate of Manual type events
Log is the per second arrival rate of Log Only type events
Subscription is the number of CLI sessions with events enabled
PM is the CPU utilization for PM data collection, about 0.02
Browse is the CPU utilization for use of the portable browser, about0.05.
Since the Sun E4500 utilizes two processors, the fullutilization hard limit for the Sun E4500 equation is 200%.
NOTE
On the Sun, as on the Helix, the utilization is important because itinfluences the CLI response times. On the Sun, the utilization of theevent manager is also important because the event manager issingle–threaded and cannot utilize two processors. Therefore, theutilization of the event manager should never exceed 80% of oneprocessor even with no CLI load. The event manager utilization for oneprocessor can be approximated as follows:
UtilizationEM = CDLs * 0.00231 + Alarm * 0.00527 + Auto * 0.00463 + Status * 0.00385 + Manual * 0.0033 + Log * 0.0032+ Subscriptions * 0.00014 *(Alarm + Auto + Status + Manual) [EQ 5–3]
5

Operations and Maintenance Center – Radio (OMC–R) – continued
CDMA SC Products System Resource Guide (CSSRG) June 20015-8
Where:
CDL is the per second CDL arrival rate
Alarm is the per second alarm arrival rate
Auto is the per second arrival rate of Automatic type events(excluding alarms)
Status is the per second arrival rate of Status type events (excludingManual types)
Manual is the per second arrival rate of Manual type events
Log is the per second arrival rate of Log Only type events
Subscription is the number of CLI sessions with events enabled.
Since the Event manager is single–threaded to use oneprocessor, the full utilization hard limit for the Eventmanager equation is 100%.
NOTE
A budget of 80% CPU utilization of one processor for CDL and eventprocessing leads to a recommended limit of 700,000 CDLs per hour. Thesteady state Alarm rate is assumed to be 36,000 per hour, and the steadystate event rate is assumed to be 72,000 per hour. A limit of 16subscriptions is also assumed. These alarm and event rates are expectedto be well above those experienced in the field.
Typical event arrival rates may be determined through analysis of eventlogs for periods considered typical for a busy hour averaged over a oneweek period. The following UNIX commands may be used to acquirethe desired data:
� To get a total event count
grep –c OMC–R_id/sc/events/event_log_id
� To get a count of alarms
grep –c ALARM: /sc/events/event_log_id
� To get a count of automatic type events
– To get a total automatic event count
grep –c A00 /sc/events/event_log_id
– Subtract the alarm count from the count of total automatic events
� To get a count of Status type events
grep –c STCHG: /sc/events/event_log_id
� To get a count of Manual type events
grep –c M00 /sc/events/event_log_id
� To get a count of Log type events
grep –c L00 /sc/events/event_log_id
5
Operations and Maintenance Center – Radio (OMC–R) – continued
June 2001 5-9CDMA SC Products System Resource Guide (CSSRG)
The influence of CLI response times may be estimated using theequations below. The response times provided by the equations areaverage response times. The 95th percentile may be about twice theaverage, and the worst case could be three to four times higher than theaverage response time.
These equations are approximations that are a best fit forthe data available.
NOTE
Average CLI response times for the Helix PM 3 can be estimated asfollows:
� For CLI commands that do not act on the MIB
RT = (RTNL * CLI0.9) / (1.0 – Utilization(1 + Utilization)) [EQ 5–4]
Where:
RT is the average response time
RTNL is the average response time with no CLI or event traffic
CLI is the number of CLIs being executed in parallel.
Utilization is as described by the equation for the Tandem Helix above.
� For CLI commands that act on the MIB
2 2.2RT = ((RTNL * CLI0.97) / (1.0 – Utilization(1 + Utilization)) * 4.3(TCH/20) * (1 – Utilization ) [EQ 5–5]
Where:
RT is the average response time
RTNL is the average response time with no CLI or event traffic
TCH is the number of traffic channels in thousands
CLI is the number of CLIs being executed in parallel.
Utilization is as described by the equation for the Tandem Helix above.Total number of traffic channels (TCHs) may be determined as describedin the Limiting Factors Section above.
The following are observations:
1. Response time varies nearly linearly with the number of CLIs beingexecuted in parallel. The increase becomes more linear as theutilization increases.
2. Response time of commands acting on the MIB are stronglyinfluenced by MIB size. Going from a small MIB (less than 30% ofthe maximum for TCHs/BTSs/Carrier–Sectors/Sectors) to a largeMIB (greater than 70% of the maximum forTCHs/BTSs/Carrier–Sectors/Sectors) increases response times by afactor of nearly five.
3. For simple display commands, response times of under 10 secondsaverage can be achieved with six concurrent CLIs with no CLI orevent traffic, four CLIs at half rated load, and two CLIs at rated load.
5

Operations and Maintenance Center – Radio (OMC–R) – continued
CDMA SC Products System Resource Guide (CSSRG) June 20015-10
4. With a medium to large MIB, commands that act on the MIBproduce response times on the order of 10 seconds only if limited toone command execution at a time with load levels at half the ratedload. With a large MIB, the ADD BTS command requires about 30seconds on average with no CLI or event traffic.
These equations are intended to give an indication of the impact ofadding CDL/event loads and increasing the MIB size. However, they donot give absolute CLI response times without a knowledge of theresponse time with no CDL/event load and a small MIB (RTNL ). Thefollowing may be used for an approximate reference.
� Example RTNL for non–MIB related commands
bts status 2.3 seconds
cbsc status 2.1 seconds
� Example RTNL for MIB related command
edit sector 4.2 seconds
add bts 6.6 seconds.
These equations are true only for commands that areexecuted within the OMC–R. They do not account forMM, BTS, or XC response times for commands that act onthese network nodes.
NOTE
Average CLI response times on the Sun E4500 can be estimated asfollows:
� For CLI commands that do not act on the MIB
RT = RTNL * CLI 1.02 / ((1.9 – Utilization) * (0.95 – Utilization/2))1.2 [EQ 5–6]
Where:
RT is the average response time
RTNL is the average response time under no–load conditions
CLI is the number of CLIs being executed in parallel.
Utilization is as described by the equation for the Sun above.
This equation is valid only for two or more concurrentCLIs. Because there are two processors available and eachCLI can effectively utilize only one processor, the averageexecution time for one CLI and two CLIs is essentially thesame under no–load conditions.
NOTE
� For CLI commands that act on the MIB
RT = RTNL * CLI * (1.0 – (Utilization – UtilizationEM)) * 5.3(TCH/40) [EQ 5–7]
5

Operations and Maintenance Center – Radio (OMC–R) – continued
June 2001 5-11CDMA SC Products System Resource Guide (CSSRG)
Where:
RT is the average response time
RTNL is the average response time under no–load conditions and asmall MIB
CLI is the number of CLIs being executed in parallel
TCH is the number of traffic channels in thousands.
Utilization is as described by the equation for the Sun above.
Because the execution time of CLIs that act on the MIB is drivenprimarily by the MIB process and the MIB process is single–threaded,these CLIs cannot, in effect, utilize two processors. As a result, the eventmanager load has little impact on the response time of these CLIs, butthe CLIs compete with the non–event manager load for CPU resource.
The following are observations:
1. For commands that do not act on the MIB, the response time isnearly linear with half the number of concurrent CLIs at low loadlevels. As the load level increases, the increase in response timebecomes nearly linear with the increase in concurrent CLIs.
2. For commands that act on the MIB, the response times increasenearly linearly with the number of concurrent CLIs being executed.Load levels have little impact on the response times.
3. For commands that act on the MIB, the response times increase byabout a factor of 5 in going from a small MIB to a large MIB.
4. For simple display commands, response times of under 10 secondsaverage can be achieved with 16 concurrent CLIs at rated load.
5. With a medium to large MIB, commands that act on the MIB willproduce response times on the order of 10 seconds only if limited toabout 6 commands at a time independent of the load levels. With alarge MIB, a single ADD BTS command requires about 10 secondson average independent of the load levels.
The limits on MIB size (BTS, sector, carrier–sector, and traffic channels)and the number of simultaneous CLIs in execution were determinedprimarily from limits established on response times as provided by theseequations.
These equations are intended to give an indication of the impact ofadding CDL/event loads and increasing the MIB size, but they do notgive absolute CLI response times without a knowledge of the responsetime with no CDL/event load and a small MIB (RTNL ). The followingmay be used for an approximate reference.
� Example RTNL for non–MIB related commands
bts status 0.47 seconds
cbsc status 0.44 seconds
� Example RTNL for MIB related command
edit sector 0.5 seconds
add bts 2.0 seconds.
5

Operations and Maintenance Center – Radio (OMC–R) – continued
CDMA SC Products System Resource Guide (CSSRG) June 20015-12
� These equations hold only for commands that areexecuted within the OMC–R. They do not account forMM, BTS, or XC response times for commands that acton these network nodes.
� The CDL limit can be increased at the expense of eventprocessing budget if the actual event loads are found tobe below the steady state rates quoted above. This willnot have much impact on the Helix platform, but it’squite possible the Sun CDL limits may be increased asa tradeoff for unnecessary event capacity.
NOTE
Planning Limits
The planning limits are based primarily on the CPU resource availablefor CDL and event processing and the desired CLI response timeperformance. The CLI response times are, in turn, influenced by theCPU utilized for CDL and event processing, the number of CLIsexecuting concurrently, and the size of the MIB.
As a system grows, more CDLs will be generated, the MIB will increasein size, and the amount of CLI activity will also tend to increase. Theoperator can estimate how much growth capacity is available on anOMC–R by gauging the reserve CPU resource available for eventprocessing, determining the MIB growth potential by comparing thecurrent system size to the accepted limits, and by estimating the increasein CLI activity. The accepted limits may be determined by utilizing thevalues provided in Table 5-1, or the operator may use the utilization andresponse time equations provided above to establish his own limits.
Symptoms of Resource Overload
The primary symptom of overload is excessive response times to CLIcommands, either in scripts or direct entry. If the CDL load is not abovethe recommended limits, poor response times most likely indicate toomany CLIs are being executed concurrently.
Scripts running as cron jobs or scripts executing on remoteplatforms that invoke OMC–R CLIs must be counted whendetermining the number of concurrent CLIs.
NOTE
If excessive CLI activity is initiated, especially during high trafficperiods, the OMC–R internal event queues may overflow causing eventsto be lost. In overload situations, events may also be discarded by theMMs if they can’t be forwarded to the OMC–R before the queuesoverflow. If overloading is suspected, the operator may perform thefollowing checks to determine if events have been lost:
5

Operations and Maintenance Center – Radio (OMC–R) – continued
June 2001 5-13CDMA SC Products System Resource Guide (CSSRG)
1. Login to the OMC–R
2. Enter the command dbapi3. At the dbapi prompt, enter status4. A list similar to the following displays:
0 PID: 637 Name: gcmgr qLen: 0 qMax: 500 qHigh:0 qDrop: 0
1 PID: 594 Name: scemlogd qLen: 0 qMax: 500 qHigh:0 qDrop: 0
2 PID: 595 Name: monitorApi qLen: 0 qMax: 500 qHigh:0 qDrop: 0
3 PID: 597 Name: omcgw qLen: 0 qMax: 250 qHigh:0 qDrop: 0
4 PID: 2398 Name: dbapi qLen: 0 qMax: 500 qHigh:0 qDrop: 0
5 PID: 635 Name: omcfm qLen: 0 qMax: 500 qHigh:0 qDrop: 0
6 PID: 634 Name: slm qLen: 0 qMax: 500 qHigh:0 qDrop: 0
7 PID: 615 Name: mit qLen: 0 qMax: 100 qHigh:0 qDrop: 0
8 PID: 621 Name: omctad qLen: 0 qMax: 500 qHigh:0 qDrop: 0
9 PID: 620 Name: pm_rqst qLen: 0 qMax: 500 qHigh:0 qDrop: 0
10 PID: 636 Name: mmi_ping qLen: 0 qMax: 500 qHigh:0 qDrop: 0
11 PID: 616 Name: TestQueue qLen: 0 qMax: 500 qHigh:0 qDrop: 0
12 PID: 618 Name: sdc qLen: 0 qMax: 1000 qHigh:0 qDrop: 0
13 PID: 617 Name: agent qLen: 0 qMax: 500 qHigh:0 qDrop: 0
14 PID: 598 Name: omcmib qLen: 0 qMax: 5000 qHigh:0 qDrop: 0
15 PID: 1980 Name: scevmgr qLen: 0 qMax: 2400 qHigh:4 qDrop: 0
5. If the scevmgr (event manager) process qDrop count is non–zero, theOMC–R has experienced overload.
6. If the scevmgr qHigh count is within 90% of the qMax for therespective process, the processor has been running near overload.
7. Enter the command clrstat. This resets the counters.
8. Repeat the above procedure for each subtending MM, but look at theqDrop and QHigh data for the omcgw (OMC gateway) process.
9. If the omcgw process qDrop count is non–zero for any MM or theqHigh is within 90% of qMax for the process, the OMC–R is likelyin or near overload.
5

Operations and Maintenance Center – Radio (OMC–R) – continued
CDMA SC Products System Resource Guide (CSSRG) June 20015-14
This should be done on a daily basis, preferably at the same time eachday during a low call traffic period. No action should be undertakenunless the checks indicate an overload for two or more days in a oneweek interval.
Reducing Utilization/Capacity Improvement
Regular utilization of the CLI browser is not recommended. Online CDLbrowsing, in particular, is CPU–intensive and will degrade OMC–Rperformance.
OMC–R performance also degrades if the number of active CLI sessionsor script–initiated sessions exceeds the recommended limit. Suchoverload conditions may be alleviated by assessing the way the OMC–Ris being utilized and making modifications as necessary.
If overload conditions are encountered, it may be necessary to add anOMC–R and redistribute the CBSCs.
See the System Configuration section of the most recent release manualfor additional information concerning this topic.
Operators of Tandem Helix PM 3 systems that have been upgraded fromPM 2 systems should verify their SCSI disk controllers have beenupgraded as well. The SCSI controller version maybe determined byexecuting the following commands in a UNIX shell:
� cfstatus –i scsi0 for controller 0
� cfstatus –i scsi1 for controller 1.
If the response to either of these commands indicates a firmware revisionof 01N, the corresponding controller should be replaced with a SCSI 2controller. The SCSI 2 controllers should return a firmware revision ofA16.
5

SwitchMATE
June 2001 5-15CDMA SC Products System Resource Guide (CSSRG)
Introduction
SwitchMATE is an intelligent message processor connected to the EMX2500/5000 switch. SwitchMATE provides a user interface that gives theuse the ability to view a full picture of the entire system status at onetime and then detect and correct any network faults.
All SwitchMATE and selected EMX commands are available throughmenus and dialog boxes which enables fast and easy command entry.Instead of just one usable console, SwitchMATE users can define otherconsoles and the types of messages to be displayed in each of them.
Limiting Factors
Limiting factors for SwitchMATE are:
� The Cellular Application Terminal (CAT) PC must have at least16MB RAM of memory.
� 128 users can be defined
– Only 16 can be logged on at a time.
� Report and log files take a long time to complete.
� Accumulated SwitchMATE files must be deleted periodically by theCleanup utility.
Determining Utilization
CPU power can be affected by the following:
� Calculations using spreadsheet programs and others
� Computer operations including:
– Scrolling console windows
– Opening and closing windows
– Opening and closing dialog boxes
� The CPU must dedicate about 30% of its power to serial ports.
Planning Limits
The number of CAT instances that can be open at the same time on theMS–Windows desktop depends on the use of resources in each instance.
Symptoms of Resource Overload
The following are some problems that may arise when usingSwitchMATE. Please refer to the Troubleshooting Problems andSolutions section in the SwitchMATE 2500 Operation Manual for acomplete listing of problems and instructions concerning how to resolvethem.
� SwitchMATE does not appear to be getting IPRs or alarm panelupdates.
� SwitchMATE reports, via the SwitchMATE alarm, that the AMA DASlink is bad. However, on the switch, it’s indicated as in–service.
5

SwitchMATE – continued
CDMA SC Products System Resource Guide (CSSRG) June 20015-16
� SwitchMATE reports, via the SwitchMATE alarm, that the TM&MDAS link is bad. However, on the switch, it’s indicated as in–service.
� SwitchMATE reports messages that the switch and CAT version or theSwitchMATE host and switch version do not match.
� Data from the switch get lost before being processed by theSwitchMATE host.
� The usere needs to reboot the CAT but pressing the <Ctrl+Alt+Del>key sequence doesn’t succeed.
� SwitchMATE tries to log into the EMX using an invalid password .
� An MMI command fails with the message LINE ERROR ON LINE,followed by a SwitchMATE alarm.
Also, refer to the SwitchMATE Command Reference manual for adetailed listing of all IPRs and their settings.
Reducing Utilization/Capacity Improvement
� Ensure that network traffic is kept to a minimum.
� The Subscribers functionality is used when a problem arises. Thisfeature, used for both local and roamer subscribers, allows theoperator to see a customer’s currently assigned characteristics andchange them if necessary.
5

Universal Network Operations (UNO)
June 2001 5-17CDMA SC Products System Resource Guide (CSSRG)
Introduction
Universal Network Operations (UNO) is a powerful tool used to manageCode Division Multiple Access (CDMA) and Analog networks. UNOoffers the equivalent functionality previously available with SC–UNO.UNO will be introduced as the SC–UNO replacement when release R8.1is available. However, UNO will be required as a replacement beginningwith release R8.3.
UNO was developed using the Telecommunications ManagementNetwork Q3 (TMN Q3) international standard for telephonymanagement. UNO uses industry–standard software and hardware and isa GUI interface to the entire cellular system.
UNO provides the following capabilities across managed, multi–vendorelements:
� Alarm/Fault Management
� State Management
� Performance Management.
UNO Market Manager
The full–featured version of UNO is known as the UNO MarketManager, UNO–MM, or UNO. This version of UNO manages multipleOMC–Rs, IWUs, EMXs (through SwitchMATE), and other devices.
The UNO Market Manager also supports larger hardware platforms andoffers the customer software feature options that are not available on theUNO–EM.
UNO Element Manager
UNO Element Manager, also known as UNO–EM, is a smaller,limited–feature version of UNO. It’s available for those customers whowish to maintain SC–UNO equivalency.
The UNO–EM will only provide support for a single CDMA OMC–R. Itdoes not offer optional software features.
UNO
Limiting Factors
The limiting factors are:
� The number of CPUs
� RAM
� The hard disk space.
These UNO resources are impacted by the:
� Number of users
� Number of applications being executed
5

Universal Network Operations (UNO) – continued
CDMA SC Products System Resource Guide (CSSRG) June 20015-18
� Number of managed elements
� Event arrival rate
� CDL arrival rate
� Amount of performance statistics transferred.
Determining Utilization
Determining UNO utilization consists of analyzing system utilizationand the network being managed. The current set of tools being usedinclude:
� The UNIX utilities sar and vmstat for assessing CPU and memoryutilization
� The following UNO 2.2.2 utilities:
– uno_me_count
Provides the count of managed elements
– alarms_rate
Provides information on events per second
– count_cdl
Provides information on CDL arrival rate
– count_pm
Provides information on performance statistics being transferred
– run_all.sh
Provides similar data to UNIX utilities and lists top processes.
Planning Limits
The planning limits for UNO are really guidelines and recommendationsand are included in Table 5-2. Key elements of the table are:
� Maximum BTS*Sector*Carrier (this is the only true “hard” limit)
� Steady State CDL /Hour
� UNO Managed Elements.
5

Universal Network Operations (UNO) – continued
June 2001 5-19CDMA SC Products System Resource Guide (CSSRG)
Table 5-2: UNO 2.2 Planning Recommendations
SupportedPlatforms
Processors RAM DiskSpace
Rec. Max.CMIP Agents(OMC–R/SM)
Rec.Max.BTS
Max.BTS*
Sector*Carrier
SteadyState
Events/Sec.
SteadyStateCDL/Hour
UNOManagedElements
Sparc20 2*75 MHz 256MB 12 GB 1(OMC–R only*)
* OnlyUNO–EM
200 2400 1 35,000 17,000
Sun Ultra 2 2*167/200MHz 256MB 12 GB 1(OMC–R only*)
* OnlyUNO–EM
200 2400 2 55,000 24,000
Sun Ultra 2 2*300 MHz 256MB 12 GB 1(OMC–R only*)
* OnlyUNO–EM
200 2400 2 75,000 24,000
Sun Ultra 2 2*167/200MHz 1 GB 20 GB 6 600 7200 2 75,000 30,000
Sun Ultra 2 2*300 MHz 1 GB 20 GB 6 600 7200 2 120,000 50,000
Sun E250 2*300 MHz 1 GB 27 GB 6 600 7200 2 120,000 50,000
Sun E3000 2*250 MHz 1 GB 20 GB 6 600 7200 2 120,000 50,000
Sun E3000 2*250 MHz 1 GB 20 GB 6 600 7200 2 180,000 75,000
Sun E3000 2*250 MHz 2 GB 20 GB 6 600 7200 2 180,000 75,000
Sun E3000 2*250 MHz 2 GB 20 GB 6 600 7200 3 240,000 100,000
Sun E3500 2*336 MHz 1 GB 27 GB 6 600 7200 2 120,000 50,000
Sun E3500 2*336 MHz 1 GB 27 GB 6 600 7200 2.5 180,000 75,000
Sun E3500 2*336 MHz 2 GB 27 GB 6 600 7200 2.5 180,000 75,000
Sun E3500 2*336 MHz 2 GB 27 GB 6 600 7200 3 240,000 100,000
NOTE� OMC–R: Operations and Maintenance – Radio (CDMA)
� SM: SwitchMATE
� Max. Agents equals the total OMC–R and SM combined
� Max. Steady State Event/Second equals the total of all agents
� Max. Call Detail Logs (CDL) Steady State equals the total of all OMC–Rs.
Table 5-2 provides numbers that the UNO development group has testedin hardware configurations that utilize system simulators in order to
5

Universal Network Operations (UNO) – continued
CDMA SC Products System Resource Guide (CSSRG) June 20015-20
verify that the UNO application software operates within acceptableperformance levels.
The values selected for these tests are based on “average” and slightly“above average” system sizes experienced in the CDMA market place.It is possible that these values can be exceeded and that operators wouldstill experience the performance they consider to be acceptable. Asdeployment of the system continues and additional laboratory testing isexecuted, these numbers may be adjusted upward as larger systemconfigurations are verified.
For all of the tests performed, which generated the numbers above, itwas assumed that operators would be utilizing all of the UNO softwarefunctionalities available on each platform, including multiple instancesof some applications like the Alarm Manager. For deployments ofUNO–MM systems where some key applications are not utilized, suchas performance management and performance management thresholding,it is expected that an increase of events per second will rise by a factor oftwo and the number of managed elements will increase by a factor of25%. These estimates are based on statistical analysis of systemperformance and not actual maximum configuration tests.
Symptoms of Resource Overload
Symptoms of system overload are:
� Slow response time to user requests in UNO applications
� Long start up times.
Reducing Utilization/Capacity Improvement
Reducing Utilization and Capacity Improvement depends on the reasonwhy the system is overloaded. If there are too many users orapplications, the basic approach should be reducing the number of usersand open applications. Also, replacing X terminals with workstationsimproves user response time.
If the system is receiving too much data (events, CDL, or statistics),splitting the number of agents across multiple UNO platforms can help.In most cases, the customer will be impacted by user response time dueto the number of users, not the amount of data being received.
5

June 2001 CDMA SC Products System Resource Guide (CSSRG)
Chapter 6: Data Services
Table of Contents
Data Services 6-1. . . . . . . . . . . . . . . . . . . . . . . . . . . . . . . . . . . . . . . . . . . . . . . . . . . Introduction 6-1. . . . . . . . . . . . . . . . . . . . . . . . . . . . . . . . . . . . . . . . . . . . . .
Circuit Data/Inter–working Unit (IWU) 6-2. . . . . . . . . . . . . . . . . . . . . . . . . . . . . . . Introduction 6-2. . . . . . . . . . . . . . . . . . . . . . . . . . . . . . . . . . . . . . . . . . . . . .
6

Table of Contents – continued
CDMA SC Products System Resource Guide (CSSRG) June 2001
Notes
6

Data Services
June 2001 6-1CDMA SC Products System Resource Guide (CSSRG)
Introduction
Data Services consists of the Circuit Data Inter–working Unit product.
6

Circuit Data/Inter–working Unit (IWU)
CDMA SC Products System Resource Guide (CSSRG) June 20016-2
Introduction
In analog systems, it’s a straightforward task to connect communicationsequipment designed for the Public Switched Telephone Network (PSTN)and obtain a reasonable quality of service. For analog cellular systems,specialized modems have been created to handle the demand of sendingdata. CDMA and TDMA technologies require special treatment of datasince voice–band modems cannot be used.
The CDMA Inter–working Unit (IWU) is a device that providesfunctions and services so circuit–mode data originating in a CDMAsystem can interwork with the PSTN. The IWU supports thecircuit–mode data functions compliant with TIA/EIA IS–99. It connectsto the Centralized Base Station Controller (CBSC) by the subset of theL_interface (TIA/EIA IS–658) required to support circuit–mode dataservices. The IWU can be thought of as a combination of a data gatewayand a modem bank. The data gateway supports the standard data networkprotocols and signalling such as Frame Relay (FR) and ISDN to supportthe L–interface and the upper layers of the IS–99 UM protocol stack.These upper layers include AT command application support to emulatelocally connected modems. The connection between the computer andsubscriber unit is RS232 serial data, with no modem required. The serialdata stream is packetized by the TCP/IP software in the phone, and issent to the IWU. The modem is in the Inter–working Unit and is a sharedresource used by all subscribers. The CBSC establishes a connectionfrom the IWU to the PSTN and the modem begins communications.
Limiting Factors
Limiting factors for the IWU are:
� One logical IWU, supporting 20 circuits, per CBSC can beprovisioned
– This requires CBSC release 7.0 and either S2.0, W2.0, or J2.0.
Determining Utilization
The CHANGE CP SUBSCR MMI is used to define the access numberfor data and fax.
The CHANGE/DISPLAY CP TREAT MMI is used to support newCFCs.
Alarm Management
Trouble events notify the Network Management Card (NMC) whichgenerates the alarms that are sent across the Ethernet LAN to the IWUManagement Workstation. The alarms are then logged and can bedisplayed. The following can generate alarms via the NMC:
� Quad Modem Card
� Dual T1 Card
� Fan Tray
� Power Supplies.
6

Circuit Data/Inter–working Unit (IWU) – continued
June 2001 6-3CDMA SC Products System Resource Guide (CSSRG)
Device State Management
The following can be state–managed via a GUI on the IWU ManagementWorkstation:
� Dual T1 Card
� Individual DS0 of a T1 interface
� Quad Modem Card
� Individual Modem of a Quad Modem Card.
The following can be viewed via a GUI on the IWU ManagementWorkstation:
� Dual T1 Card
� Individual DS0 of a T1 interface
� Quad Modem Card
� Individual Modem of a Quad Modem Card
� Power Supplies.
Performance Management
A set of measurements and reports are used to deliver information onIWU and data/fax usage. These statistics are associated with TranscodeChannel Groups.
Three new measurements have been implemented:
1. Transcoder Channel Group Attempts
Transcoder Channel Group Attempts is the number of attemptedtranscoder channel allocations within a particular transcoder channelgroup.
2. Transcoder Channel Group Overflows
Transcoder Channel Group Overflows is the number of failedtranscoder channel allocations within a particular transcode channelgroup.
3. Transcoder Channel Group Usage
Transcoder Channel Group Usage is the total usage of all individualtranscoder channels for this group.
Planning Limits
The detailed rules, calculations, and examples for planning an IWU canbe found in the Feature Equipment Planning Guide (FEPG) and theOrdering Guide.
Symptoms of Resource Overload
Not applicable.
Fault Management
The following describes the impact to the logical IWU service if aparticular board goes out of service:
6

Circuit Data/Inter–working Unit (IWU) – continued
CDMA SC Products System Resource Guide (CSSRG) June 20016-4
� Dual T1 Card
If a Dual T1 Card goes out of service, the logical IWU of which it ispart is also out of service.
� Circuit–Data Gateway Card
If a Circuit–Data Gateway Card goes out of service, the logical IWUof which it is part is also out of service.
� Quad Modem Card
If a Quad Modem Card goes out of service, the logical IWU of whichit is part remains in service if there is no other type of card failure. Thelogical IWU continues to service calls but at a reduced capacity.
� Network Management Controller (NMC)
If an NMC goes out of service, call processing within the IWU shelfwhere the NMC resides is not affected if the NMC fault does notcause a fault in another component of the IWU shelf. No Operationsand Maintenance (O and M) operations can be performed on the IWUshelf and no alarms from the IWU shelf can be sent to the IWUworkstation while the NMC is out of service.
Trouble Isolation and Verfication
The IWU supports running diagnostics on the following FieldReplaceable Units (FRUs):
� Quad Modem Card
� Dual T1 Card.
The FRU must be in the “out of service” state for diagnostics to be runon them but the diagnostics can be initiated manually from the IWUworkstation.
Reducing Utilization/Capacity Improvement
See the System Configuration section of the most recent release manualfor additional information concerning this topic.
6

June 2001 CDMA SC Products System Resource Guide (CSSRG)
Chapter 7: CDMA RF Carrier
Table of Contents
CDMA RF Carrier 7-1. . . . . . . . . . . . . . . . . . . . . . . . . . . . . . . . . . . . . . . . . . . . . . . Introduction 7-1. . . . . . . . . . . . . . . . . . . . . . . . . . . . . . . . . . . . . . . . . . . . . .
RF Carrier Planning 7-2. . . . . . . . . . . . . . . . . . . . . . . . . . . . . . . . . . . . . . . . . . . . . . Introduction 7-2. . . . . . . . . . . . . . . . . . . . . . . . . . . . . . . . . . . . . . . . . . . . . .
RF Carrier Limiting Factors 7-3. . . . . . . . . . . . . . . . . . . . . . . . . . . . . . . . . . . . . . . . Introduction 7-3. . . . . . . . . . . . . . . . . . . . . . . . . . . . . . . . . . . . . . . . . . . . . . Establishing Limits 7-3. . . . . . . . . . . . . . . . . . . . . . . . . . . . . . . . . . . . . . . .
RF Carrier Determining Utilization 7-9. . . . . . . . . . . . . . . . . . . . . . . . . . . . . . . . . . Introduction 7-9. . . . . . . . . . . . . . . . . . . . . . . . . . . . . . . . . . . . . . . . . . . . . . Collect Data 7-9. . . . . . . . . . . . . . . . . . . . . . . . . . . . . . . . . . . . . . . . . . . . . . Determine Present Status 7-10. . . . . . . . . . . . . . . . . . . . . . . . . . . . . . . . . . . .
RF Carrier Planning Limits 7-12. . . . . . . . . . . . . . . . . . . . . . . . . . . . . . . . . . . . . . . . Introduction 7-12. . . . . . . . . . . . . . . . . . . . . . . . . . . . . . . . . . . . . . . . . . . . . . Walsh Code Usage Planning Limit 7-12. . . . . . . . . . . . . . . . . . . . . . . . . . . . Establish a system-level Planning Limit 7-12. . . . . . . . . . . . . . . . . . . . . . . . BTS- and system-level Planning Guidelines 7-13. . . . . . . . . . . . . . . . . . . . . Forecast Utilization 7-13. . . . . . . . . . . . . . . . . . . . . . . . . . . . . . . . . . . . . . . . Identify Bottlenecks 7-15. . . . . . . . . . . . . . . . . . . . . . . . . . . . . . . . . . . . . . . . Evaluate Relief Alternatives 7-16. . . . . . . . . . . . . . . . . . . . . . . . . . . . . . . . . Implement Relief Mechanisms 7-18. . . . . . . . . . . . . . . . . . . . . . . . . . . . . . .
RF Carrier Symptoms of Resource Overload 7-20. . . . . . . . . . . . . . . . . . . . . . . . . . . Introduction 7-20. . . . . . . . . . . . . . . . . . . . . . . . . . . . . . . . . . . . . . . . . . . . . .
RF Carrier Reducing Utilization/Capacity Improvement 7-21. . . . . . . . . . . . . . . . . . Introduction 7-21. . . . . . . . . . . . . . . . . . . . . . . . . . . . . . . . . . . . . . . . . . . . . .
Control Channel 7-32. . . . . . . . . . . . . . . . . . . . . . . . . . . . . . . . . . . . . . . . . . . . . . . . . Introduction 7-32. . . . . . . . . . . . . . . . . . . . . . . . . . . . . . . . . . . . . . . . . . . . . .
Control Channel Limiting Factors 7-33. . . . . . . . . . . . . . . . . . . . . . . . . . . . . . . . . . . Introduction 7-33. . . . . . . . . . . . . . . . . . . . . . . . . . . . . . . . . . . . . . . . . . . . . . Maximum Recommended Utilization 7-43. . . . . . . . . . . . . . . . . . . . . . . . . .
Control Channel Determining Utilization 7-44. . . . . . . . . . . . . . . . . . . . . . . . . . . . . Introduction 7-44. . . . . . . . . . . . . . . . . . . . . . . . . . . . . . . . . . . . . . . . . . . . . . Collect Data 7-44. . . . . . . . . . . . . . . . . . . . . . . . . . . . . . . . . . . . . . . . . . . . . . Determining Paging Channel Utilization 7-47. . . . . . . . . . . . . . . . . . . . . . . Determining Access Channel Utilization 7-68. . . . . . . . . . . . . . . . . . . . . . . Determine Present Status 7-76. . . . . . . . . . . . . . . . . . . . . . . . . . . . . . . . . . . .
Control Channel Planning Limits 7-78. . . . . . . . . . . . . . . . . . . . . . . . . . . . . . . . . . . .
7

Table of Contents – continued
CDMA SC Products System Resource Guide (CSSRG) June 2001
Introduction 7-78. . . . . . . . . . . . . . . . . . . . . . . . . . . . . . . . . . . . . . . . . . . . . . Planning Limit Recommendations 7-78. . . . . . . . . . . . . . . . . . . . . . . . . . . . Forecast Utilization 7-78. . . . . . . . . . . . . . . . . . . . . . . . . . . . . . . . . . . . . . . . Identify Network Elements Exceeding Limits 7-84. . . . . . . . . . . . . . . . . . .
Control Channel Symptoms of Resource Overload 7-85. . . . . . . . . . . . . . . . . . . . . . Introduction 7-85. . . . . . . . . . . . . . . . . . . . . . . . . . . . . . . . . . . . . . . . . . . . . .
Control Channel Reducing Utilization/Capacity Improvement 7-86. . . . . . . . . . . . . Introduction 7-86. . . . . . . . . . . . . . . . . . . . . . . . . . . . . . . . . . . . . . . . . . . . . . Evaluate Relief Alternatives 7-86. . . . . . . . . . . . . . . . . . . . . . . . . . . . . . . . . Data Collection Inputs 7-92. . . . . . . . . . . . . . . . . . . . . . . . . . . . . . . . . . . . . .
7

CDMA RF Carrier
June 2001 7-1CDMA SC Products System Resource Guide (CSSRG)
Introduction
CDMA RF carrier capacity and expansion addresses a number of issuesand includes an analysis of the CDMA control channels. A process isprovided which attempts to predict the time when an additional CDMARF carrier or an additional control channel is required. The approachanalyzes data from Performance Management (PM) reports to forecastBTS-level utilization based upon a service provider–supplied marketingprojection. For RF carrier planning, guidelines are provided on how toestablish RF carrier capacity limits and then how to apply these limits ona BTS- and system/CBSC-level to help a Systems Engineer determinewhen to implement RF carrier capacity relief mechanisms, up to thepoint of adding a new CDMA RF carrier. For control channel planning,guidelines are provided on how to determine the current utilization of thepaging and access control channels on a per-BTS basis, as well as how todetermine future utilization from forecasted growth projections.
7

RF Carrier Planning
CDMA SC Products System Resource Guide (CSSRG) June 20017-2
Introduction
The design of a CDMA system is dependent upon three interrelatedprinciples:
� Coverage
� Capacity
� Quality.
To improve one of the three principles, a compromise of one or both ofthe other principles is needed. The capacity limit associated with theCDMA RF carrier is a soft limit due to trade-offs between coverage,quality, and capacity. As a result, the RF carrier capacity of a CDMAsystem is variable from one site to the next.
The following are guidelines on how to establish limits for the RF carriercapacity based upon PM reports and how to apply these limits inperforming BTS- and system-level planning. The underlyingrequirement, though, is the system needs to be in operation in order togenerate the PM reports used in the analysis.
7

RF Carrier Limiting Factors
June 2001 7-3CDMA SC Products System Resource Guide (CSSRG)
Introduction
RF Carrier Limiting Factors are a combination of several types of limits.This topic describes the limits that the engineer must be aware of as theCDMA system is planned and forecasted for future growth.
Establishing Limits
Due to the dynamic nature of CDMA, many items can influence theErlang capacity of a CDMA carrier. With this in mind, each cell may bedifferent and the Erlang capacity limit obtained in one site may beunreachable in another. The following are some of the items that canimpact the CDMA RF carrier capacity that can be achieved at a site:
� Distribution of traffic
� Speed of traffic
– Mobile
– Pedestrian
– Fixed
� BTS configuration
– Omni
– Two-sector
– Three-sector
– Six-sector
� Propagation characteristics
� Antenna characteristics (front-to-back, horizontal beamwidth)
� Targeted Frame Erasure Rate (1%, 2%, etc.)
� Grade Of Service (GOS)
� CSM or EMAXX chipset being utilized
� TAdd and TDrop settings
� Soft handoff percentage
� Paging channel rate and its power allocation
� Other interference (in other words, Inter–System Interference, or ISI).
Since the true RF carrier capacity may be different for each site, twodifferent approaches are provided with varying degrees ofimplementation complexity. The first approach is to generalize most ofthe items above which affect RF capacity and develop a set of capacitydesign guidelines (Generic Site Capacity Limits) associated with alimited matrix of site configurations and system design. The secondapproach involves creating site–specific capacity limits through theanalysis of Forward Load Detection (FLD) and Reverse Load Detection(RLD) quality metrics to determine a maximum Erlang load capacity ona per-sector basis. Establishing a set of generic site capacity limits is thesimplest approach and is, therefore, the recommended approach.
A hybrid model to the proposed approach is to combine both approachesby establishing a set of generic site capacity limits for a limited matrix of
7

RF Carrier Limiting Factors – continued
CDMA SC Products System Resource Guide (CSSRG) June 20017-4
site configurations. Then, use RLD/FLD results to validate or adjust thelimits according to actual capacity performance being observed from theRLD/FLD field data. In this hybrid approach, the RLD/FLD data foronly those sites showing a high correlation of load to the qualityperformance metrics are used. The resultant capacity limits derived fromthe RLD/FLD analysis for those sites can be averaged together for sitesof the same configuration in order to establish an average capacity limit.The RLD/FLD average capacity limits can then be compared to thegeneric set of limits and adjustments to the generic set of limits can bemade if considered appropriate.
Generic Capacity Limits
At the present time, a convenient measurement parameter of RF capacityutilization does not exist. As a result, a generic set of site capacity limitsis established. These limits are based upon the dominant RF trafficvariable for a BTS, which is Walsh Code usage minutes. New loaddetection measurement parameters are planned for a future softwarerelease. When the new parameters are available, modify the capacitylimits and the capacity planning approach in order to take advantage ofthese new parameters.
To appropriately monitor RF carrier capacity, analyze data on aper-carrier, per-sector basis. Since the Performance Management reportsfrom the CBSC provide Walsh Code usage on a per-carrier, per-sectorbasis, establish an RF carrier capacity limit based upon data from thesereports. There are two capacity limits that need to be established forvarious different BTS/system design configurations:
� Walsh Code Usage Maximum Limit
� Walsh Code Usage Planning Limit.
Walsh Code Usage Maximum Limit
There are three steps involved in establishing a general set of guidelinesfor a Walsh Code Usage Maximum Limit that can be applied to theWalsh Code minutes of usage on a per-sector basis. These steps are:
1. Establish a general set of guidelines
Establish a Maximum Limit of Erlang usage on a per-sector basis.Table 7-1 provides a set of general guidelines for the maximum limitof Erlangs. These have been established through simulations forvarious different BTS/system design configurations. The generalizedsystem simulation parameters used to create these limits providedfor a mobile environment, with a high speed profile, using a full ratepaging channel, and designed for a 95% RF reliability. In addition,the system was designed to be interference limited (in other words,the sites were spaced relatively close together). Another point to bemade is that the system had ideal cell placement (all on grid) andassumed flat terrain.
The values in Table 7-1 reflect maximum capacity designlimitations. Some systems may have traded capacity for coverage (toobtain a larger RF footprint) to reduce the number of sites initially
7

RF Carrier Limiting Factors – continued
June 2001 7-5CDMA SC Products System Resource Guide (CSSRG)
deployed. Adjustments to the values in Table 7-1 can be made ifdifferent system design parameters are assumed. If a system hasbeen designed, per a service provider request, to carry a certainamount of BTS/sector-level of Erlang traffic, such design guidelinescan be used to establish a maximum limit.
Use caution when discussing the type of Erlang traffic beingconsidered (in other words, conversation Erlangs, traffic channelErlangs, or Walsh Code Erlangs). Remember, that traffic channelErlangs are conversation Erlangs with Soft Handoff (SHO) usageadded to them and that Walsh Code Erlangs are conversationErlangs with Soft and Softer Handoff (SSHO) usage added to them.BTS/sector-level Erlang design guidelines which are in the form ofWalsh Code Erlangs are given in Table 7-2.
As an alternate approach, use the Reverse Load Detection/ForwardLoad Detection (RLD/FLD) metrics to develop a generic set ofguidelines (refer to the application note titled Forward and ReverseLink Load Detection Metrics, version 1.0, dated July 2, 1997). IfRLD/FLD metrics are available and there is a significant amount ofsites/sectors which demonstrate sufficient correlation, thenaveraging together the RLD/FLD Erlang projection results toestablish a generic set of guidelines is also a viable option. In theabsence of service provider design guidelines, RLD/FLD results, orany other approved method of measuring the maximum Erlangguideline for a particular system, the following guidelines inTable 7-1 are a reasonable nominal set of values to use on aper-sector, per-carrier basis.
A set of Maximum Limit of Erlangs guidelines is providedbelow, but the values can be adjusted per specific serviceprovider request or design criteria (as required).
NOTE
7

RF Carrier Limiting Factors – continued
CDMA SC Products System Resource Guide (CSSRG) June 20017-6
Table 7-1: Guidelines for Maximum Limit of Conversation Erlangs
Frequency
Vocoder
800 MHz13 kb
800 MHz8 kb
1900MHz13 kb
1900MHz8kb
Omni 8.4 20.6 10.6 26.0 (a)
Three–Sector 6.0 15.5 7.2 18.6 (a)
Six–Sector 5.2 14.2 6.6 18.0 (a)
NOTE(a) Interpolated from the 13kb data.
� Mobile Environment
� 95% RF Reliability
� High Speed Profile
� Full Rate Paging.
The above guidelines do not apply to Wireless Local Loop (WiLL)systems utilizing Fixed Wireless Terminals (FWTs) or to systemswith mixed rate vocoders deployed. These deployed vocoders can be8 kb voice and 13 kb voice or 8kb voice and 13 kb High SpeedPacket Data via IS–95B. For those systems, guidelines need to beestablished either through simulations and/or field data, along withthe service provider design criteria. Refer to the latest version of theCDMA Design Rules for Mobile and Fixed Systems document foradditional information regarding Erlang capacities for differentsystem design configurations.
For systems designed to provide data services, it’s important to use aWalsh Code usage value for RF carrier planning that is a combinedtotal of voice and data usage.
2. Convert conversation Erlangs to Walsh Code Erlangs
The next step is to apply a system-level Soft and Softer Handofffactor (SSHO) which is then multiplied by the Maximum Limit ofErlangs per sector to establish a Walsh Code Erlangs MaximumLimit per sector.
For those situations where a fully loaded SSHO value is not readilyavailable, use a budgetary value of 2.0 for estimating purposes (as isused in the data below). If a system is not under a fully loadedcondition, obtaining a measured value of the SSHO factor from apartially loaded system is not an appropriate value to use, since thenatural trend for a growing system is for the SSHO value to decreaseas the traffic on the system increases. For most mobile applications,apply a budgetary value of 2.0.
7

RF Carrier Limiting Factors – continued
June 2001 7-7CDMA SC Products System Resource Guide (CSSRG)
Table 7-2: Guidelines for Walsh Code Erlangs Maximum Limits
Frequency
Vocoder
800 MHz
13 kb
800 MHz
8 kb
1900
MHz13 kb
1900
MHz8kb
Omni 16.8 41.2 21.2 52.0
Three–Sector 12.0 3.0 14.4 37.2
Six–Sector 10.4 28.4 13.2 36.0
NOTE� SSHO = 2
� Mobile Environment
� 95% RF Reliability
� High Speed Profile
� Full Rate Paging.
3. Convert the Walsh Code Erlangs to Walsh Code usage minutes
Since the typical traffic report provides Walsh Code usage data inminutes for the Bouncing Busy Hour, the measurement period forRF carrier capacity data analysis is 60 minutes. Therefore, the finalstep is to convert the maximum limit of Walsh Code Erlangs persector to a Walsh Code usage maximum limit (in minutes) per sectorby multiplying the Walsh Code Erlang limit by 60 minutes.
Table 7-3: Guidelines for Walsh Code Usage Maximum Limits (in minutes)
Frequency
Vocoder
800 MHz
13 kb
800 MHz
8 kb
1900
MHz13 kb
1900
MHz8kb
Omni 1008 2472 (a) 1272 3120 (a)
Three–Sector 720 1860 864 2232 (a)
Six–Sector 624 1704 792 2160 (a)
NOTE(a) Configuration may be Walsh Code limited to 1970 minutes (see the following note).
� SSHO = 2
� Mobile Environment
� 95% RF Reliability
� High Speed Profile
� Full Rate Paging.
7
RF Carrier Limiting Factors – continued
CDMA SC Products System Resource Guide (CSSRG) June 20017-8
There is a maximum limit of 42 Walsh Codes for trafficchannel usage in Motorola’s current softwareimplementation. With this Walsh Code limitation, themaximum usage that can be achieved is 32.84 Erlangs, or1970.4 usage minutes. This assumes a 2% Erlang Bblocking probablility and adequate traffic channel elementsto support the traffic.
As a result, all of the configurations at 1900 MHz and 8kb,as well as the omni BTS at 800 MHz and 8kb, are limitedby the Walsh Code limit prior to reaching the RF carrierlimit. Keep in mind that the maximum limits suggested inTable 7-3 are general purpose estimates, used for RFcarrier planning purposes. Actual RF carrier limits mayvary from the above values.
NOTE
7

RF Carrier Determining Utilization
June 2001 7-9CDMA SC Products System Resource Guide (CSSRG)
Introduction
In order to determine RF Carrier utilization, the engineer needs to collectdata about how the system is functioning and also determine the presentstatus of the system.
Collect Data
The primary data to collect and monitor is the Walsh Code minutes ofusage data on a per-carrier, per-sector basis. For systems with voice anddata services (circuit or packet data) deployed, it is important to use acombined total of both voice and data Walsh Code usage for RF carrierplanning.
For sectored sites, collecting and analyzing just the busiest sector of theentire site should be adequate. For systems which already have multiplecarriers deployed, the data needs to be collected and analyzed on aper-carrier basis. Since the analysis is being performed on a cellsite/sector-level, the measurement collection interval should be largeenough to identify the Bouncing Busy Hour (BBH) peak traffic periodfor each individual cell.
Because traffic patterns vary from site to site, some outer fringe sites’BBH may occur in the morning busy period during the subscriber’s driveinto work, while other core area sites’ BBH occurs in the afternoon busyperiod during the subscriber’s drive home from work. Additionally, themeasurement collection interval should be large enough to capture theBusy Day Bouncing Busy Hour (BDBBH) for the week for each cell. Ifthe monitored system has a significant drop in subscriber usage as wellas a shift in the traffic pattern for the weekend, only analyze the weekdaydata. Collect the BBH and BDBBH usage data for each cell on anongoing weekly basis, but for the initial baseline measurement, collectand analyze a minimum of four weeks of data.
Also, collect and monitor peformance statistics on a per-carrier,per-sector basis (if possible, BBH performance data for each site isdesired). The performance statistics consist of a dropped call rate and anaccess failure (or success) rate (including originations and terminations).Use these statistics to validate the performance of a particular cell orsector as it approaches or exceeds the generic planning or maximumlimit.
As a result, the typical data collection process stores total BBH WalshCode usage data (for voice and data) and performance statistics on anongoing weekly basis. It also stores the BBH time of day for eachsector/cell in the system. This is data for Monday through Friday,assuming weekend data can be disregarded.
Although the frequency of performing a full analysis depends upon therate of growth for the monitored system, the minimum recommendationis to perform a full one to two year projection analysis on a semi-annualbasis. However, a quarterly full analysis is preferred. In either case,
7

RF Carrier Determining Utilization – continued
CDMA SC Products System Resource Guide (CSSRG) June 20017-10
perform a weekly review of BDBBH usage data to keep track of anycurrent sites exceeding the maximum limits.
Determine Present Status
Validating the integrity of the data collected is one of the first things todo when determining the present status of the system. Investigate andeliminate partial data or anomalous data from the analysis. If the datarepresents an abnormal traffic period which should not be considered aspart of the normal traffic environment, the abnormal data will not beuseful for future traffic forecast estimates.
Once the data is validated, analyze the four week average of BDBBHdata for each sector (on a per-carrier basis for systems with multiplecarriers). Identify any sectors which exceed either of the Walsh CodeUsage Planning or Maximum Limits. If one or more sectors exceed theWalsh Code Usage Planning or Maximum Limit, monitor the BBHperformance statistics trend for those cells/sectors. Determine if there isan increase in performance degradation occurring with elevated BBHWalsh Code usage. At this point, an evaluation review of the planningand maximum limits may be necessary. This determines if adjustmentsneed to be made to either of the limits to better reflect the desiredperformance, capacity, or service provider–desired results.
Regardless of the performance statistics results, start investigating thecapacity management options for those cells/sectors exceeding thelimits. Determine if a capacity management plan is required. Theobjective of capacity management planning is to implement capacityrelief mechanisms before a performance degradation occurs. Therefore,performance degradation should not be a requirement for determining orimplementing a capacity management plan. Use performancedegradation to increase the priority of implementing capacity reliefoptions to those cells/sectors exhibiting the performance degradation.Those sites which exceed the maximum limit but do not reflect anyperformance degradation should be next on the priority list forimplementing capacity management/relief options.
Establish the planning limit and the maximum limit into categoryregions which represent a stoplight level of urgency. Apply these limitsto the BDBBH Walsh Code usage data and analyze the data on a weeklybasis. The green region represents a low-level of urgency with the BTSWalsh Code usage ranging from low usage up to the planning limit. Theyellow region represents a moderate-level of urgency with the BTSWalsh Code usage ranging from the planning limit to the maximumlimit. Finally, the red region represents a high-level of urgency with theBTS Walsh Code usage being greater than the maximum limit.Monitoring the Walsh Code usage data in this fashion can be used tosimplify the notification of potential problem areas.
The appropriate capacity relief management plan to choose on aBTS-level can depend upon many different factors, such as the:
� Service provider inputs and requests
� Cost of implementation
7

RF Carrier Determining Utilization – continued
June 2001 7-11CDMA SC Products System Resource Guide (CSSRG)
� Market size
� Terrain
� Site footprint
� Desired in-building penetration
� Site acquisition availability
� Design of the system
� Rate of market growth
� Number and location of the sites/sectors which exceed the planning ormaximum limit.
The system designer chooses among the appropriate capacitymanagement options to create a capacity management plan that best fitsthe particular situation. A summary of the capacity management/reliefoptions are listed below. Also, refer to the RF Capacity ManagementOptions section for more details on the options stated below.
� Re-optimize the area
– Re-adjust pilot powers to distribute traffic to under utilized sites
– Re-orient azimuth and/or downtilt antennas to distribute traffic tounder utilized sites
– Modify parameters to distribute traffic to under utilized sites or toreduce power requirements
� Modify the existing site
– Sectorize
– Add PA modules (if applicable)
– Implement Walsh Code limiting
– Add additional channel element cards
� Add a new site
– Implement a micro-cell
– Implement a macro-cell.
7
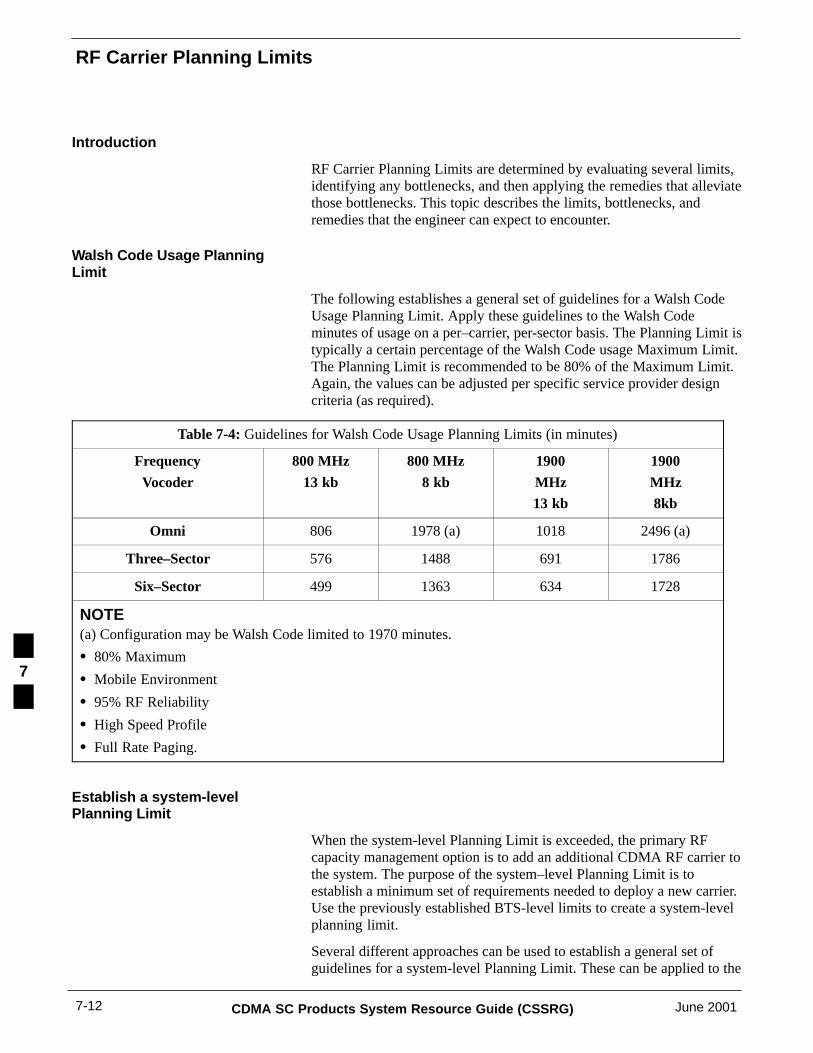
RF Carrier Planning Limits
CDMA SC Products System Resource Guide (CSSRG) June 20017-12
Introduction
RF Carrier Planning Limits are determined by evaluating several limits,identifying any bottlenecks, and then applying the remedies that alleviatethose bottlenecks. This topic describes the limits, bottlenecks, andremedies that the engineer can expect to encounter.
Walsh Code Usage PlanningLimit
The following establishes a general set of guidelines for a Walsh CodeUsage Planning Limit. Apply these guidelines to the Walsh Codeminutes of usage on a per–carrier, per-sector basis. The Planning Limit istypically a certain percentage of the Walsh Code usage Maximum Limit.The Planning Limit is recommended to be 80% of the Maximum Limit.Again, the values can be adjusted per specific service provider designcriteria (as required).
Table 7-4: Guidelines for Walsh Code Usage Planning Limits (in minutes)
Frequency
Vocoder
800 MHz
13 kb
800 MHz
8 kb
1900
MHz13 kb
1900
MHz8kb
Omni 806 1978 (a) 1018 2496 (a)
Three–Sector 576 1488 691 1786
Six–Sector 499 1363 634 1728
NOTE(a) Configuration may be Walsh Code limited to 1970 minutes.
� 80% Maximum
� Mobile Environment
� 95% RF Reliability
� High Speed Profile
� Full Rate Paging.
Establish a system-levelPlanning Limit
When the system-level Planning Limit is exceeded, the primary RFcapacity management option is to add an additional CDMA RF carrier tothe system. The purpose of the system–level Planning Limit is toestablish a minimum set of requirements needed to deploy a new carrier.Use the previously established BTS-level limits to create a system-levelplanning limit.
Several different approaches can be used to establish a general set ofguidelines for a system-level Planning Limit. These can be applied to the
7

RF Carrier Planning Limits – continued
June 2001 7-13CDMA SC Products System Resource Guide (CSSRG)
number of sectors or sites, which exceed one or both of the BTS-levelWalsh Code limits.
Some of the options are listed below. The system-level Planning Limitcan be established from one or more of these options. Again, the valuescan be adjusted per specific service provider design criteria (as required).
� 10-15% of the sectors or sites of a CBSC or a multiple CBSC areawhich exceed the Walsh Code Usage Maximum Limit.
� 20-25% of the sectors or sites of a CBSC or a multiple CBSC areawhich exceed the Walsh Code Usage Planning Limit.
� A minimum cluster of seven sites (one core and six surrounding sites)with at least one sector in each site which exceed the Walsh CodeUsage Planning Limit.
Discuss the system-level Planning Limit with the service provider andtry to establish a mutually feasible limit which allows plenty of time toperform capacity management on a system-level magnitude.
BTS- and system-levelPlanning Guidelines
The Systems Engineer can do the following to create a set of guidelinesused to perform RF carrier capacity management planning on a BTS-and system-level:
� Forecast Utilization
� Identify Bottlenecks
� Evaluate Relief Alternatives
� Implement Relief Mechanisms.
These steps utilize strategies to perform capacity management planning,along with the site- and system-level limits established in theEstablishing Limits section. They also allow some flexibility to adjustsome of the recommendations to optimize the approach to a particularservice provider’s desire. With a CDMA system, RF carrier capacitymanagement planning and monitoring is required to be performed on anongoing basis.
Perform and analyze the following steps individually, on a per-carrierbasis, for those systems with multiple carriers already deployed. Analyzeeach carrier like its own separate system. The analysis should typicallyforecast out in time up to one to two years from the present date andshould be repeated on a periodic basis. The frequency of the planningand monitoring exercise depends upon how fast the system usage grows.The more frequent the monitoring, the sooner a plan can be formulatedand implemented to resolve any capacity management issues before itcauses severe performance degradation.
Forecast Utilization
Several different strategies can be used to forecast RF link utilization.Each of them has different merits. The marketing departments of cellular
7

RF Carrier Planning Limits – continued
CDMA SC Products System Resource Guide (CSSRG) June 20017-14
operators typically project future growth through subscriber projections,which are then used as the baseline parameter to gauge future systemutilization. Ultimately, for RF carrier planning, what is required is aforecasted estimate of total Walsh Code usage minutes (for voice anddata) on a per-carrier, per-cell/sector basis. If the service provider’smarketing department provides the Systems Engineer with subscriberprojections for an RF carrier growth analysis, then the followingprocedure can be used to forecast Walsh Code usage minutes on aper-cell/sector basis. Table 7-5 shows an example of a spreadsheet whichcan be easily created to perform the following forecast of Walsh Codeusage minutes.
Table 7-5: Example Spreadsheet to Forecast WC Usage
A B C D E F G H I J K L M
BTSID
Week 1BDBBHWC Min
Week 2BDBBHWC Min
Week 3BDBBHWC Min
Week 4BDBBHWC Min
AVG STD CurrentSubs
AVG WCUsage
per Sub
AVG + 3 STDWC Usage
per Sub
FutureSubs
AVGWCMin
Future
AVG + 3STD
WC MinFuture
1 1092 957 1012 982 1011 59 50000 0.02022 0.02373 75000 1516 1780
2 536 490 524 447 499 40 50000 0.00999 0.01238 75000 749 928
3 704 709 743 779 734 35 50000 0.01468 0.01676 75000 1101 1257
4 340 325 374 380 355 27 50000 0.00710 0.00869 75000 532 651
5 605 633 634 577 612 27 50000 0.01225 0.01387 75000 918 1040
1. Collect the Busy Day Bouncing Busy Hour (BDBBH) Walsh Codeusage minute data for four weeks worth of current data (four datapoints per sector, one per week), for each cell/sector in the system ona per-carrier basis. Alternatively, one data point per week, per carrier,per site, using the busiest sector of the site can also be used (in otherwords, trending just the busiest sector of a site instead of all sectorsis adequate). See columns B thru E.
2. Baseline the system by calculating the average BDBBH Walsh Codeusage minutes from the four weeks worth of current data for eachcell/sector in the system [in other words, AVERAGE(B1:E1)]. Seecolumn F.
3. Calculate the standard deviation (one-sigma) for the averageBDBBH Walsh Code usage minutes for each cell/sector in thesystem [in other words, in MS Excel STDEV(B1:E1)]. See columnG.
4. Obtain the average number of subscribers using the systemassociated with the four weeks of data being analyzed. See columnH.
5. Calculate the Average BDBBH WC usage per subscriber on aper-cell/sector basis [in other words, F1/H1]. See column I.
6. Calculate the Average BDBBH WC usage + three-sigma persubscriber on a per-cell/sector basis [in other words,(F1+(3*G1))/H1]. See column J.
7

RF Carrier Planning Limits – continued
June 2001 7-15CDMA SC Products System Resource Guide (CSSRG)
7. Obtain the projected subscriber growth for the system. See columnK.
8. Calculate the projected Average BDBBH WC usage on aper-cell/sector basis [in other words, K1*I1]. See column L.
9. Calculate the projected 3-sigma Average BDBBH WC usage on aper-cell/sector basis [in other words, K1*J1]. See column M.
If the service provider’s marketing department provides the SystemsEngineer with something other than subscriber projections,modifications to the approach above can project a linear relationshipaccording to the service provider–supplied projection parameter. If theservice provider requires a non-linear growth projection, modificationsto the above approach depend upon the specified non-linear growthprojection requirements. For example, the service provider may specify avariable subscriber growth rate along with a variable usage rate. Theserates may be based upon seasonal changes and/or marketing promotions.In either case, the desired outcome is to project an average BDBBHWalsh Code usage and a three-sigma average BDBBH Walsh Code usage(in minutes) for each cell/sector on a per-carrier basis.
Make adjustments to the process of forecasting utilization when judgedappropriate. For instance, if a larger statistical data sample is desired,more than four BBH data points can be used for the calculation of themonthly average and the standard deviation. Using additional datacaptured during lesser busy days of the week reduces the overall averageand provides a less conservative prediction. Also, a differentmultiplication factor other than three can be used for the standarddeviation multiplier. Using a lower multiplier (X) for the X-sigmaaverage calculation provides a less conservative prediction. Severaladjustments to the process, as specified above, can be made dependingupon how conservative the engineer wishes to be. These adjustments are:
� Non–Linear Growth
� Larger Data Samples
� X–sigma instead of Three–sigma.
The example in Table 7-5 projects Walsh Code utilization based upon asubscriber estimate for a future date. If subscriber growth estimates areprovided on a monthly basis, then columns K, L, and M can be repeatedfor each month where a subscriber growth estimate is provided. Use amonthly analysis to more accurately estimate when a particular cell orsector will exceed the planning or maximum limit. This type of detailedanalysis can be helpful in determining whether a BTS-level or asystem-level capacity relief mechanism should be implemented.
Identify Bottlenecks
Once the Walsh Code usage has been forecasted on a per-cell/sector,per-carrier basis, it is time to again identify, on a BTS-level, any sectorswhich exceed either of the Walsh Code Usage Planning or MaximumLimits. On a system/CBSC-level, analyze the data to determine if thesystem-level Planning Limit has been exceeded. Establish the planning
7
RF Carrier Planning Limits – continued
CDMA SC Products System Resource Guide (CSSRG) June 20017-16
limit and the maximum limit into category regions which represent astoplight level of urgency which is applied to the forecasted Walsh Codeusage data (for both average and three–sigma values) and analyzed. Thegreen region represents a low-level of urgency with the BTS Walsh Codeusage ranging from low usage up to the planning limit. The yellowregion represents a moderate-level of urgency with the BTS Walsh Codeusage ranging from the planning limit to the maximum limit. Finally, thered region represents a high-level of urgency with the BTS Walsh Codeusage being greater than the maximum limit.
Evaluate Relief Alternatives
Decide whether to add more CDMA sites, add another CDMA carrier, orsome other option listed in the RF Capacity Management Optionssection. By adding additional CDMA sites to offload high traffic CDMAsites, capacity is gained in an incremental stage. For a mixed-modeanalog/CDMA system, this scenario is more likely done when theCDMA system is not a 1:1 ratio with the analog sites. When anadditional carrier is implemented system-wide, the capacity of thesystem increases overnight by the capacity offered by the new carrier.For instance, if a second carrier is added throughout the system, the RFcarrier capacity of the system could double overnight, depending uponthe number of channel elements equipped on the second carrier. Thismight not be ideal since spectrum may need to be cleared and it is amajor expense to install the additional carrier equipment at every site.
Plot the Walsh Code usage data in a red/yellow/green stoplight fashiononto a system/CBSC-level BTS location map. Analyze this map toidentify isolated cells and/or determine areas which have exceeded thesystem-level Planning Limit. These areas are candidates for adding anew CDMA carrier. Create two separate plots using:
� Projected average Walsh Code usage data
� Projected average plus three-sigma Walsh Code usage data.
A set of Walsh Code usage location maps as described above should becreated for each carrier deployed in the system. For evaluation purposes,create a set of Walsh Code usage location maps for a series of key datesin the future (in other words, 6, 12, 18, and 24 months out in time). Ifthe map creation can be simplified through automation, perform a morethorough evaluation by creating a set of Walsh Code usage maps for ahigher frequency of future dates (in other words, on a quarterly ormonthly basis). The amount of dates analyzed (or maps created) dependsupon the level of detail desired.
In general, use the average forecasted Walsh Code usage data to identifyisolated cells which require capacity management options. Use theaverage three-sigma forecasted Walsh Code usage data to identifyregion(s) which require an additional carrier (in other words, areas whichexceed the system–level Planning Limit).
Isolated cells or sectors with average forecasted data which exceed theplanning or maximum limits are candidates for capacity managementoptions mentioned in the Determine Present Status section and expanded
7

RF Carrier Planning Limits – continued
June 2001 7-17CDMA SC Products System Resource Guide (CSSRG)
upon in the RF Capacity Management Options section. If the isolatedsectors which exceed the Walsh Code limits are scattered throughout aCBSC boundary or a multiple CBSC boundary, adding a localizedadditional carrier to cover the entire affected region may be the bestchoice.
If most of the sectors which exceed the Walsh Code limits are localizedto one or two large regions within a CBSC boundary or a multipleCBSC boundary, adding a localized additional carrier to the affectedregions is probably the best choice. Perform this type of analysis forboth the average and three-sigma forecasted Walsh Code usage data.Analyze results from both sets of data to identify BTSs in a logicalregion or regions which are target candidates for a new carrier. Region(s)identified by using the average data can be considered the minimumregion to deploy a new carrier. Region(s) identified by using thethree-sigma data, while considered a more conservative result, can alsobe considered as a recommended region to deploy a new carrier. Sincethe effort of planning, deploying, and optimizing a new carrier issignificant, employ a more conservative approach and use thethree-sigma data to determine the new carrier region(s).
If the system is setup for a 13kb vocoder rate and if a significantpercentage of subscribers already deployed in the system are EVRCcompatible, implementing a system-wide 8kb EVRC deployment maybe an alternate choice to delay the deployment of an additional carrier. Itis difficult to determine the benefit impact of deploying EVRC as asystem-level capacity management option since the number of EVRCusers, their traffic patterns, and usage patterns are all variables whichimpact the overall EVRC capacity benefit. If 100% of the subscribers inthe system are EVRC–compatible, the benefit can be determined bycomparing the 13kb to 8kb Walsh Code capacity limits in theEstablishing Limits section for the particular BTS/system configuration.
If it’s decided to add an additional carrier (either in a localized area orubiquitous), the next decision to make is how to add the supportingCBSC infrastructure required to support the additional capacity providedby the new carrier. There are basically three approaches to expandingCBSC capacity to support a new carrier added to a system (refer toCentralized Base Station Controller (CBSC) chapter for moreinformation):
� Implement the new RF carrier within the existing CBSC infrastructureor layer to expand the RF carrier capacity. Add additional CBSCsthrough CBSC splitting at a later date to expand the infrastructure’scall processing capacity.
� Implement the new RF carrier within the existing CBSC infrastructureor layer to expand the RF carrier capacity. Upgrade the CBSC(s) to ahigher capacity model (if possible).
� Implement the new RF carrier with a Layered CBSC Overlayapproach (see the Centralized Base Station Controller (CBSC) chapterfor more details on this approach). This expands the RF carriercapacity and the associated CBSC infrastructure’s call processingcapacity at the same time.
7

RF Carrier Planning Limits – continued
CDMA SC Products System Resource Guide (CSSRG) June 20017-18
From an engineering perspective, add both the RF carrier capacity alongwith the supporting CBSC infrastructure capacity at the same time byusing the Layered CBSC Overlay approach. This typically depends uponthe maximum carrier capacity per frame for the BTS productpredominantly deployed in the system. Adding a new carrier with theLayered CBSC Overlay approach requires a new BTS frame to beinstalled at each and every site which requires the new carrier.
From a cost of deployment perspective, it may make more sense tomaximize the number of RF carriers per frame for the particular BTSproduct line. Do this by installing additional hardware into the existingBTS frame to add the new carrier to the existing CBSC layer. This doesnot mean maximizing the total number of carriers a BTS product linecan support, but maximizing the total number of carriers that the BTSproduct line can support in one frame. If it has been determined thatadditional frames are required for most of the BTSs in order to add thenew carrier, implement the new carrier (new frames) with the LayeredCBSC Overlay approach.
In summary, the recommended solution is to add RF carriers onto asingle CBSC layer to maximize the carrier capacity of the particular BTSproduct line predominately deployed in the region. Then, implement aLayered CBSC Overlay approach for the next carrier beyond the BTSproduct line single frame maximum carrier capacity.
The appropriate capacity management plan to choose on a BTS- orsystem-level depends upon many different factors, such as the:
� Service provider inputs and requests
� Cost of implementation
� Market size
� Terrain
� Site footprint
� Desired in-building penetration
� Site acquisition availability
� Design of the system
� Rate of market growth
� Number and location of the sites/sectors which exceed the planning ormaximum limit.
It is up to the Systems Engineer to choose among the appropriatecapacity management options to create a capacity management plan thatbest fits the particular situation.
Implement Relief Mechanisms
Establish schedules and contingencies for the relief mechanisms. Genericguidelines for implementing relief mechanisms are as follows:
� If relief includes enhancing elements, determine availability of newequipment.
� For any relief mechanism, determine length of time needed toimplement change.
7

RF Carrier Planning Limits – continued
June 2001 7-19CDMA SC Products System Resource Guide (CSSRG)
� Identify dates for scheduling the changes.
� Create a method of procedure.
� Identify backup plans for schedule changes.
� Make changes according to the schedule.
Making any change to the network requires re-evaluationof the processes previously established. Therefore, makechanges to the process concurrently with changes in thephysical network.
NOTE
7

RF Carrier Symptoms of Resource Overload
CDMA SC Products System Resource Guide (CSSRG) June 20017-20
Introduction
As a cell site approaches its maximum RF carrier capacity, severaldifferent symptoms help to identify an overload condition. Thefollowing symptoms are a sample of those indicating an RF linkoverload condition:
� LPA/PA equipment overload in the transmit link
� The Ec/Io of the carrier degrades
� Interference/noise rise in the reverse link
� Blocking due to Walsh Code limitations
� Excess analog overflow redirections (assuming the system has analogoverflow capability)
� High Frame Error Rate (FER) Rate on the forward and reverse link(cell/sector basis)
� The coverage area gets smaller causing coverage holes
� May see an increase in dropped call, handoff failure, and/or accessfailure rates.
As the traffic level of a site increases closer to its capacity limit, theresulting performance may vary from site to site. Typically, theperformance of the site just gradually degrades. In sites that are wayoutside the core, the statistics may get steadily worse as the trafficincreases. In some sites close to the freeways, the statistics may getbetter when the site is loaded up with more traffic. In general,degradation in quality is gradual and not a step function.
7

RF Carrier Reducing Utilization/Capacity Improvement
June 2001 7-21CDMA SC Products System Resource Guide (CSSRG)
Introduction
The engineer can reduce RF Carrier utilization and improve systemcapacity by developing an RF capacity management plan to address allof the issues identified in the RF Carrier Planning Limits section.
The appropriate capacity management plan to choose on a BTS- orsystem-level depends upon many different factors. This section providesmore detail on the various different capacity management optionsavailable and some of the logic for determining when to choose aparticular option. It is up to the Systems Engineer to choose among theappropriate capacity management options available to create an overallcapacity management plan that best fits the particular market andsituation.
Optimization
For isolated situations requiring immediate attention, utilizingoptimization techniques for capacity management relief is a viableoption. This is because it is relatively easy and quick to implementoptimization parameter changes. Since the capacity benefit is toodifficult to estimate, this type of capacity relief is typically applied toresolving a present status situation. It is not usually part of a forecastedcapacity management plan. It can be implemented on a permanent basisor it may also be used as a temporary capacity relief mechanism until alonger term option can be implemented.
Because coverage, capacity, and quality are all inter-related functions ofa CDMA system, to increase capacity, the engineer must decreasecoverage or quality. Since reducing quality is typically not a desiredoption, the optimization techniques provided focus on reducing coveragefor the area of concern. The primary objectives in using optimizationtechniques for capacity relief is to optimize and reduce the overall powerrequirements (to decrease the overall interference level if possible)and/or to reduce the coverage area for the area of concern. For areaswhich have multiple pilots causing some degree of pilot pollution, theoptimization process includes a power reduction for some of theundesired sources of pilot pollution interference.
Reducing power levels and/or the coverage area could havea negative impact on system performance. A cautiousapproach should be employed when implementing capacityrelief optimization techniques in order to ensure adequatesystem performance.
NOTE
7

RF Carrier Reducing Utilization/Capacity Improvement – continued
CDMA SC Products System Resource Guide (CSSRG) June 20017-22
Power Control Parameter Adjustments
If the system, or area of concern, appears to be forward link limited,forward link power control optimization may provide some capacityrelief. In an attempt to reduce the overall forward power requirements fora particular area, the optimization engineer may try adjusting the TargetFER parameter within the SECGEN command (starting with Release 7).The Target FER can be changed by the customer in order to get a highercapacity while trading off average forward FER. The values for theTarget FER parameter range from FER_A to FER_D. A value of FER_Aprovides the most aggressive quality parameters which produce a loweraverage FER. A value of FER_D provides parameters designed tooptimize capacity while still providing an acceptable average FER. Theregions that benefit the most from Target FER changes are those withhigh traffic load and/or high multi-pilot interference. These regionsexperience less degradation during loaded conditions and are able tohandle more capacity before they experience degradation in RF losssystem performance.
Even though the Target FER parameters are service provider changeableparameters, implement adjustments to these parameters cautiously inorder to ensure adequate system performance. Adjustments to the TargetFER parameters are normally considered a short term capacity reliefoption. However, if after making the Target FER adjustments, a serviceprovider determines (through field testing and/or performance metrics)that the voice quality and system performance is acceptable, this optionmay be considered as a long term solution.
If the system, or area of concern, appears to be reverse link limited, theoptimization engineer may adjust the reverse power control (BTSRPCand MSRPC) parameters in a direction which lowers the overall powertransmitted to the base station. The BTSRPC and MSRPC parametersare not recommended as service provider changeable parameters.Adjusting the reverse link power control parameters in an attempt toincrease the reverse link capacity is not recommended. A Target FERfeature for the reverse link is required, but currently does not exist.
Coverage Area Adjustments
If the particular area of concern has one sector carrying a higher amountof traffic (when compared to other sectors in the same area), it may bepossible to shift some of the traffic from a busy sector to some other lessbusy sector(s). Make adjustments to the coverage area to reducecoverage or shift traffic through one or a combination of both of thefollowing approaches:
� Pilot Power Adjustments
� Antenna Adjustments.
If there is an adequate overlap in coverage, reducing the Site InterfaceFrame (SIF) pilot power for the high–traffic sector may be all that isrequired. For other situations, it may take a combination of SIF pilotpower adjustments as well as antenna adjustments (orientation and/ordowntilt) for multiple sectors in order to achieve the desired results. In
7

RF Carrier Reducing Utilization/Capacity Improvement – continued
June 2001 7-23CDMA SC Products System Resource Guide (CSSRG)
either case, monitor the system performance of the area for anysignificant degradation after making any coverage area optimizationadjustments.
Modify Existing Site
RF carrier capacity management options on a BTS-level can take variousdifferent forms:
� Expanding actual RF carrier capacity through sectorization or adding anew carrier
� Enabling the RF carrier capacity or safeguarding the BTS through theaddition of PA capacity (this is only an option for some of the BTSproducts, not all).
� Restricting RF capacity through the use of Walsh Code limiting.
The addition of traffic channel elements to a BTS is notconsidered in this section of RF carrier capacity planning.
Adding traffic channel elements falls under the category ofgeneral traffic engineering principles and guidelines, andshould not have an impact on actual RF carrier capacity ofthe BTS.
NOTE
See the Base Transceiver Station (BTS) chapter for more details onadding traffic channels.
Sectorization
Increasing the sectorization of the site is one way of expanding the RFcarrier capacity of an existing site (if it is supported by the particularBTS product line). Expansion takes the form of converting an omni siteto a three-sectored site. Or, converting a three-sectored site to asix-sectored site. The capacity benefit for this type of option can beestimated by calculating the differences in generic capacity limits fromone configuration to the other. For example, an omni site at 800 MHzwith an 8kb vocoder is estimated to carry 20.6 Erlangs while athree-sector site under the same conditions is estimated to carry 15.5Erlangs per sector or 46.5 Erlangs per site. In this example, the BTS canmore than double its Erlang capacity by converting the site from anomni– to a three-sector configuration (assuming the traffic is distributedequally to each sector).
Since the capacity benefit for sectorization can be estimated, this type ofcapacity relief can be applied towards a forecasted capacity managementplan. The maximum benefit typically occurs when the traffic is equallydistributed to each sector of the site.
7

RF Carrier Reducing Utilization/Capacity Improvement – continued
CDMA SC Products System Resource Guide (CSSRG) June 20017-24
For sites with a high concentration of subscribers in asmall localized area (hot spot), sectorization may notprovide the optimal capacity relief benefit. For hot spotareas, a micro-cell application may be the optimal choice(see the Add a New Site section).
NOTE
Although there is still some planning and preparation required tosectorize a site, this type of capacity relief can also be applied towardsresolving a present status situation as well, if sectorization hardware isreadily available.
Add PA Capacity
Some BTS product lines have an expandable PA which can be sized fordifferent power requirement applications. For most applications undernormal conditions, the designed power output capacity of the PA shouldbe adequate to handle the maximum limit loading requirements for theCDMA carrier. For those sectors operating at or above the maximumWalsh Code usage limit, analyze the BTS PA power requirements anddetermine if additional PA power capacity is required (if it is possible forthe particular BTS product).
The additional analysis takes the form of making field measurements ofthe actual output power requirements or analyzing forward powerrequirements from simulation results, such as those provided by theNetPlan CDMA simulation tool. Refer to the CDMA RF Planning Guideand to the CDMA RF System Design Procedure for more information onsimulating the PA power requirements.
If the results of either analysis show the site is operating close to themaximum rated output power capacity for the particular BTS product,implement additional PA capacity (if possible). If the performance of thePA’s coverage area allows a power reduction, adjust the SIF_Pilot_Powerparameter to reduce the overall PA output power requirements. This is analternate method of providing PA capacity relief.
Prior to the LPA Overload Protection feature, this type of capacitymanagement option is typically not applied until after the PAs for aparticular sector have already exceeded their maximum power limit,triggered a high power alarm, and then taken themselves out of service.
With the introduction of Phase 1 of the LPA Overload Protection feature(FR 1225A), single tone LPAs for the four digit BTS product line nolonger require manual intervention to bring the LPAs back in servicewhen a high power alarm occurs. Phase 1 of this feature provides autorecovery for an overload condition and then calculates a threshold levelused to prevent the forward transmit power from reaching a level thatoverdrives the impacted LPAs again. Phase 2 of this feature (FR 1225B)supports all BTS product lines and also provides user–specified callblocking criteria and adjustable RF power thresholds. For systems usinga software release supporting the LPA Overload Protection feature,
7
RF Carrier Reducing Utilization/Capacity Improvement – continued
June 2001 7-25CDMA SC Products System Resource Guide (CSSRG)
adding PA capacity is still option (if possible), but it becomes less of apriority when compared to those systems without the feature.
Consider adding PA capacity as a temporary safeguardmeasure since the site is already operating at the maximumlimit. Plan other capacity relief mechanisms for any sitenear or exceeding the maximum limit. This type ofcapacity management option is typically applied towardsresolving a present status situation.
NOTE
Walsh Code Limiting
The designed power output capacity of the PA should be adequate tohandle the maximum limit loading requirements for the CDMA carrier,for most applications under normal conditions.
With the introduction of the LPA Overload Protection feature, WalshCode limiting is no longer necessary in order to protect the LPA from anoverload condition. For LPAs without the Overload Protection feature,Walsh Code limiting can be implemented to restrict the maximumnumber of simultaneous users of a site/sector which can limit the powerrequirements of an LPA.
For those sectors operating near or above the maximum Walsh Codeusage limit and where the BTS product line does not have an expandablePA or the LPA Overload Protection feature, analyze the BTS PA powerrequirements and determine if Walsh Code limiting needs to beimplemented.
Additional analysis takes the form of making field measurements of theactual output power requirements or of analyzing forward powerrequirements from simulation results, as provided by the NetPlanCDMA simulation tool. Refer to the CDMA RF Planning Guide and tothe CDMA RF System Design Procedure for more information onsimulating the PA power requirements.
If the results of either analysis show that the site is operating close to themaximum rated output power capacity for the particular BTS product,then implement Walsh Code limiting. This type of capacity managementoption is typically not applied until after the PAs for a particular sectorhave already exceeded their maximum power limit, triggered a highpower alarm, and then taken themselves out of service.
Consider this option as a temporary safeguard measure.Also plan other capacity relief mechanisms for this site.This type of capacity management option is typicallyapplied towards resolving a present status situation.
NOTE
7

RF Carrier Reducing Utilization/Capacity Improvement – continued
CDMA SC Products System Resource Guide (CSSRG) June 20017-26
This option limits the capacity of the site. Therefore, it blocks fromservice any traffic growth beyond the Walsh Code limit setting.
Adding a New Carrier to a BTS
To add carriers to an existing BTS requires the installation of additionalequipment. Depending upon the BTS product and software available,this could take the form of a new:
� CCP shelf and associated cards (BBXs, MCCs, etc.)
� BTS frame and CCP shelf and associated cards
� SC6xx cabinet
� BBX cards and associated cabling for the double density CCP-12cages.
Refer to the Base Transceiver Station (BTS) chapter to determine thenumber of carriers that can be supported by the specific BTS product.
Various RF cabling is required to connect the receive and transmitsignals to the appropriate location. There are different requirementswhich depend upon whether or not the carrier being added is within thesame RF frame or in a new RF frame.
It may be necessary to provide a new span line connection to the newshelf and/or frame in order to implement a new carrier. In some cases, itmay be possible to utilize the existing span by using a groomingfunction to provide the span connectivity to the new shelf/frame. Theappropriate span configuration depends upon the span interfacerequirements for the particular BTS product used and the number of timeslots required to support all of the channel elements for all of the carrierssupported.
New hardware requires RF calibration. Therefore, a service outage isrecommended. Once the physical changes are complete, make updates tothe OMC-R/CBSC database and download software and data to the newmodules.
Add a New Site
The following provides information about adding a new site as acapacity relief option. The two basic options provided are to:
� Cell split by adding a new macro-site to the area
� Add one or multiple micro-site(s) to the area.
Cell split by adding a new macro–site to the area
Use the cell split option to offload the coverage area of two or moreexisting cells/sectors. Use this option in forecasted growth plans byestimating the percentage of capacity relief the new cell site provideswhen it is implemented. The growth plan takes into account the amountof capacity relief provided by a new site. This allows the plan tocontinue into the future until the next site/sector exceeds the planning ormaximum limit. Figure 7-1 shows a typical example where a cell split isused to offload three high traffic sectors within a network.
7

RF Carrier Reducing Utilization/Capacity Improvement – continued
June 2001 7-27CDMA SC Products System Resource Guide (CSSRG)
Figure 7-1: Cell Split Example
HighTrafficSectors:
NewCell D
Before After
1
23
1
23
1
23
Cell A Cell B
Cell C
Cell A Cell B
Cell C
A-2B-3C-1
1
23
1
23
1
23
Isolated high traffic sites/sectors are the typical areas to apply a cell splitcapacity relief option. The implementation of a cell splitting option alsoimproves the RF coverage in the area of the new cell site. This addedbenefit may influence the usage of the cell splitting option. For example,in the early stages of a system initially designed for in-vehicle coverage,the cell splitting option may be the predominant option chosen. This isto migrate the system into providing desired in-building coverage. Someof the coverage–related benefits are listed below:
� Improve an existing marginal coverage area
� Improve general in-building coverage
� Improve coverage/capacity for a high profile business district.
Typically, a large cluster grouping of several high traffic sites/sectorsrequiring capacity relief are more suitable for adding an additionalcarrier.
Add one or multiple micro-site(s) to the area
Use the micro-site(s) for the following areas which are within thecoverage area of an existing macro-site:
� Hot spot
� In-building
� Terrain-limited
� Tunnel/subway/parking garage/under ground coverage areas.
The micro-cell option, when applied towards capacity relief, is typicallyused to offload the coverage area of one existing cell/sector of thesystem. Use this option in forecasted growth plans by estimating thepercentage of capacity relief the new micro-cell provides whenimplemented in the future. Therefore, the growth plan takes into accountthe amount of capacity relief a new micro-site provides. This allows theplan to continue with the growth plan into the future until the nextsite/sector exceeds the planning or maximum limit. In order toaccomplish this, generic planning and maximum Walsh Code usagelimits need to be established for a micro-cell configuration.
7

RF Carrier Reducing Utilization/Capacity Improvement – continued
CDMA SC Products System Resource Guide (CSSRG) June 20017-28
Figure 7-2 shows a typical example where a micro-cell is used to offloadtwo high traffic areas within an existing macro-cell coverage area.
Figure 7-2: Micro–Cell Example
HighTrafficAreas
Before After
Macro-Cell A Macro-Cell A
Micro-Cell B
Micro-Cell C
Implementing a CDMA micro-cell is different thanimplementing an analog micro-cell. Typically in analog,implementing a micro-cell provides fixed BTS hardwaredeployment for that particular location with a fixed amountof capacity.
In CDMA, adding capacity by implementing an additionalCDMA carrier to an area (which has micro-cells deployed),requires additional micro-cell carrier hardware to beinstalled to support the additional carrier capacity.
NOTE
Site planning for a CDMA micro-cell needs to take into account thecarrier growth potential and the hardware associated with supporting amultiple carrier micro-cell configuration. Investigate the multiple carriermicro-site configuration limitations prior to deploying a micro-cell in anarea which most likely requires multiple carrier service. The capacity ofthe micro-cell depends upon the RF signal from the macro-cell. Themicro-cell may “see” the macro-cell as interference and therefore limitthe capacity potential of the micro-cell.
Deploy a New Carrier
If a network continues to grow its subscriber population, the RF capacityof the network dictates the need to add a new RF carrier to the network.Depending upon the size of the network and if there are isolated sectorsexceeding the Walsh Code limits scattered throughout the entirenetwork, adding a ubiquitous carrier which covers the entire networkmay be the best choice (see Figure 7-3).
7

RF Carrier Reducing Utilization/Capacity Improvement – continued
June 2001 7-29CDMA SC Products System Resource Guide (CSSRG)
Figure 7-3: Ubiquitous Carrier Example
Sites Above WC LimitSites Below WC Limit
RF Carrier Analysis
Proposed Sites with New Carrier
Ubiquitous Carrier Deployment
If most of the sectors from an RF carrier analysis exceeding the WalshCode limit are grouped together to one or two large regions within aCBSC boundary or a multiple CBSC/System boundary, adding a newnon-ubiquitous carrier to the affected regions is probably the best choice(see Figure 7-4).
Figure 7-4: Non–Ubiquitous Carrier Example #1
Sites Above WC LimitSites Below WC Limit
RF Carrier Analysis
Proposed Sites with New Carrier
Non-Ubiquitous Carrier Deployment
If there are isolated sectors exceeding the limit scattered throughout aCBSC boundary or a multiple CBSC/System boundary, but not spanningthe entire network, these sectors are also candidates for a newnon-ubiquitous carrier to be implemented to the affected region (seeFigure 7-5).
7

RF Carrier Reducing Utilization/Capacity Improvement – continued
CDMA SC Products System Resource Guide (CSSRG) June 20017-30
Figure 7-5: Non–Ubiquitous Carrier Example #2
Sites Above WC LimitSites Below WC Limit
RF Carrier Analysis
Proposed Sites with New Carrier
Non-Ubiquitous Carrier Deployment
The SC4812 BTS product allows for the channel elementsto be shared across multiple carriers (up to four).
NOTE
Since the effort of planning, installing, optimizing, and deploying a newcarrier is significant, employ a more conservative approach whenestablishing the new carrier region(s). From an engineering perspective,it is recommended to build out a new carrier deployment to a largerconservative area than actually needed before it is needed. It’s better toallow the system to grow gracefully into a new carrier region, rather thancontinuously expanding the new carrier region to keep up with agrowing demand.
Implementing a Non-Ubiquitous Carrier
Implementing a non-ubiquitous carrier requires the non-ubiquitousmultiple carrier region to be surrounded by a transition zone (seeFigure 7-6). This creates an added level of complexity to the systemdesign through the requirement of a transition zone border design andmanagement. Transition zones are required to perform a hard handofffrom one carrier frequency to another in order to transition from anon-ubiquitous multiple carrier region to a ubiquitous multiple/singlecarrier region. Subscribers leaving the non-ubiquitous region need totransition to the ubiquitous region to maintain the call going to the fringeof the system. The back-to-back transition sites labeled 1, 2, and 3shown in Figure 7-6 provide an example of how not to design atransition border. For most applications, those three sites would be betteroff being designed as fully–equipped multiple carrier sites rather thantransition sites.
7

RF Carrier Reducing Utilization/Capacity Improvement – continued
June 2001 7-31CDMA SC Products System Resource Guide (CSSRG)
Figure 7-6: Transition Zone
Multiple Carrier
Transition Carrier
Ubiquitous Carrier
12
3
There are currently two methods used to transition from one carrier toanother. The transition from a multiple carrier region to a ubiquitouscarrier region can be performed with:
� Mobile Assisted HandOffs (MAHO) using pilot beacon hardware
� Database Assisted HandOffs (DAHO) using additional sector-carrierhardware.
Both approaches require additional hardware to be installed at eachtransition site, although all of the sectors of the transition sites may notneed to be equipped. For both approaches, perform a propagation studyin order to verify that the non-ubiquitous carrier is completelysurrounded by coverage from the designated sectors of the transitionsites.
The hard handoff performance of the MAHO with pilot beacon approachis slightly better than that of the DAHO approach. In general, theMAHO with pilot beacon approach is best suited for multiple carrierseams/hard handoff borders which have a high probability of not movingin the future. This is because the beacon hardware associated with thetransition sites needs to be relocated along the new border. For multiplecarrier seams/hard handoff borders which do have a high probability ofmoving in the future, the DAHO approach is probably the best choice.This is because the sector-carrier hardware used for the DAHO transitionsites easily converts to a regular traffic carrier.
Refer to the latest version of the Cellular Application Note, titledMultiple Carrier Support, for more details on how to deploy anadditional carrier using the DAHO or MAHO with pilot beaconapproach.
7

Control Channel
CDMA SC Products System Resource Guide (CSSRG) June 20017-32
Introduction
Control channel performance directly affects overall system performancebecause no calls are set up in the system without first utilizing thecontrol channels. Two major aspects of systems performance which areimpacted are:
� System Capacity
– Too little control channel capacity can limit system capacity
– Too many control channels can generate interference to the trafficchannels and thereby reduce system capacity.
� Call Setup Completion Rate
– Poor control channel quality and long delay may cause call setupfailures, uncompetitive call setup times, and excessive amounts ofpaging and registrations.
The following shows how to predict the load of each Paging and AccessChannel. The load placed on the paging and access channels varies basedon subscriber additions, re-configuration to the paging and registrationboundaries, or both.
7
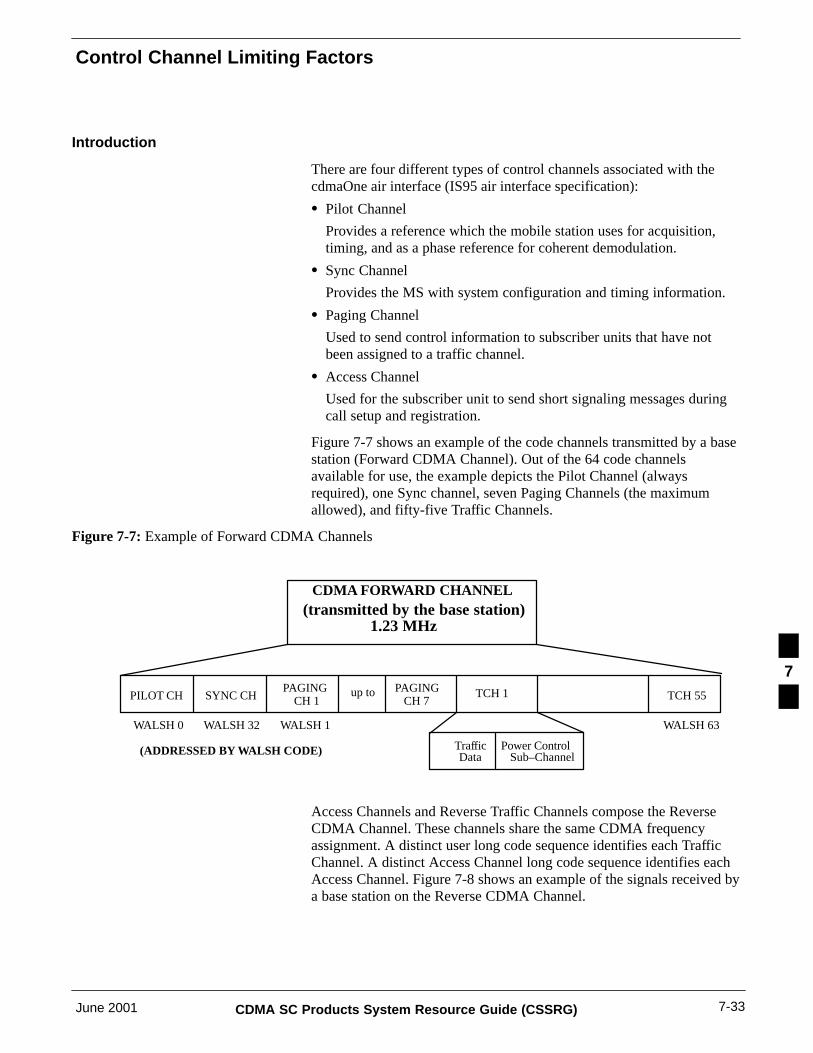
Control Channel Limiting Factors
June 2001 7-33CDMA SC Products System Resource Guide (CSSRG)
Introduction
There are four different types of control channels associated with thecdmaOne air interface (IS95 air interface specification):
� Pilot Channel
Provides a reference which the mobile station uses for acquisition,timing, and as a phase reference for coherent demodulation.
� Sync Channel
Provides the MS with system configuration and timing information.
� Paging Channel
Used to send control information to subscriber units that have notbeen assigned to a traffic channel.
� Access Channel
Used for the subscriber unit to send short signaling messages duringcall setup and registration.
Figure 7-7 shows an example of the code channels transmitted by a basestation (Forward CDMA Channel). Out of the 64 code channelsavailable for use, the example depicts the Pilot Channel (alwaysrequired), one Sync channel, seven Paging Channels (the maximumallowed), and fifty-five Traffic Channels.
Figure 7-7: Example of Forward CDMA Channels
PILOT CH SYNC CHPAGING
CH 1PAGING
CH 7TCH 1 TCH 55
WALSH 0 WALSH 63
1.23 MHz
Traffic Power Control (ADDRESSED BY WALSH CODE)
up to
(transmitted by the base station)CDMA FORWARD CHANNEL
WALSH 32 WALSH 1
Data Sub–Channel
Access Channels and Reverse Traffic Channels compose the ReverseCDMA Channel. These channels share the same CDMA frequencyassignment. A distinct user long code sequence identifies each TrafficChannel. A distinct Access Channel long code sequence identifies eachAccess Channel. Figure 7-8 shows an example of the signals received bya base station on the Reverse CDMA Channel.
7
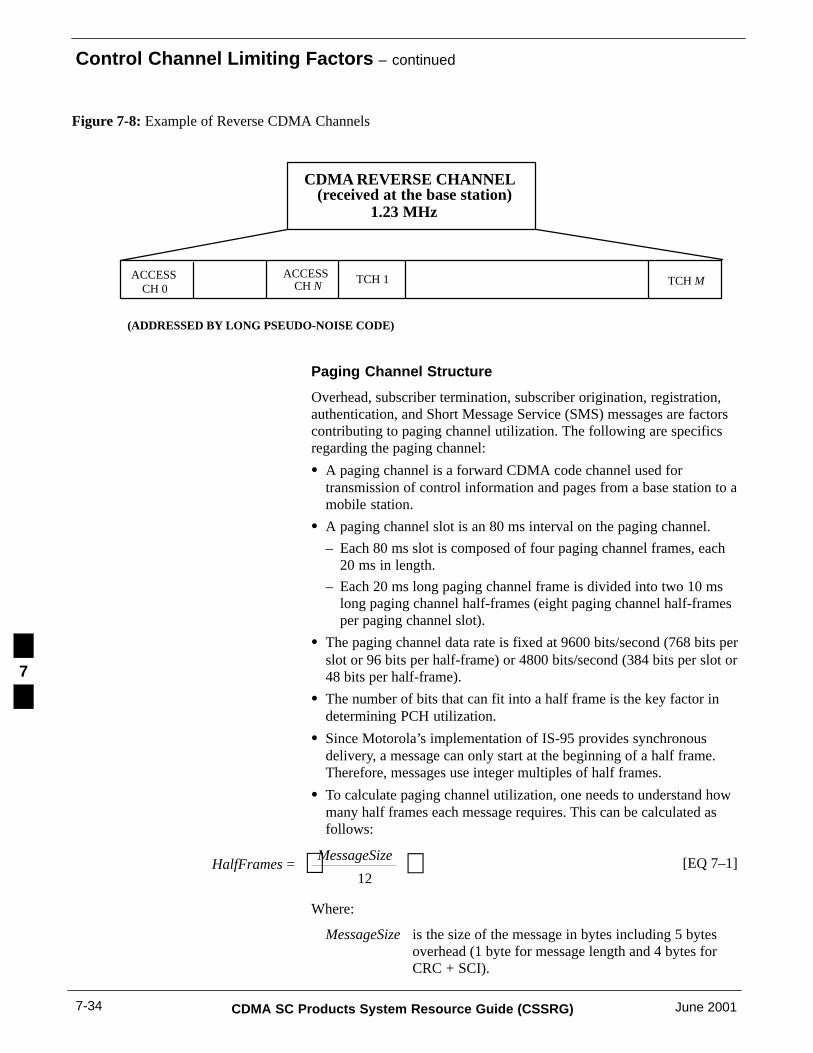
Control Channel Limiting Factors – continued
CDMA SC Products System Resource Guide (CSSRG) June 20017-34
Figure 7-8: Example of Reverse CDMA Channels
ACCESS ACCESSCH N
TCH 1 TCH M
CDMA REVERSE CHANNEL
1.23 MHz
CH 0
(ADDRESSED BY LONG PSEUDO-NOISE CODE)
(received at the base station)
Paging Channel Structure
Overhead, subscriber termination, subscriber origination, registration,authentication, and Short Message Service (SMS) messages are factorscontributing to paging channel utilization. The following are specificsregarding the paging channel:
� A paging channel is a forward CDMA code channel used fortransmission of control information and pages from a base station to amobile station.
� A paging channel slot is an 80 ms interval on the paging channel.
– Each 80 ms slot is composed of four paging channel frames, each20 ms in length.
– Each 20 ms long paging channel frame is divided into two 10 mslong paging channel half-frames (eight paging channel half-framesper paging channel slot).
� The paging channel data rate is fixed at 9600 bits/second (768 bits perslot or 96 bits per half-frame) or 4800 bits/second (384 bits per slot or48 bits per half-frame).
� The number of bits that can fit into a half frame is the key factor indetermining PCH utilization.
� Since Motorola’s implementation of IS-95 provides synchronousdelivery, a message can only start at the beginning of a half frame.Therefore, messages use integer multiples of half frames.
� To calculate paging channel utilization, one needs to understand howmany half frames each message requires. This can be calculated asfollows:
HalfFrames =MessageSize
12 [EQ 7–1]
Where:
MessageSize is the size of the message in bytes including 5 bytesoverhead (1 byte for message length and 4 bytes forCRC + SCI).
7

Control Channel Limiting Factors – continued
June 2001 7-35CDMA SC Products System Resource Guide (CSSRG)
12 is the number of bytes per half-frame at 9600 baud(96 bits divided by 8 bits per byte).
The symbol � � means to round up the number to thenearest integer.
NOTE
Paging Channel Messaging and Traffic Flow
Table 7-6 depicts five events that take place on the paging channel.
Table 7-6: Paging Message Type Events
BTS MS Paging Message Types Number of Half–Frames(9600 bps)
Overhead Message
––––––> Systems Parameters Message 3
––––––> Access Parameters Message 2
––––––> Neighbor List Message 3a
––––––> CDMA Channel List Message 1b
––––––> Extended Systems Parameters Message 2
––––––> Global Service Redirect Message 2c
––––––> Null Message 1
Mobile Terminated (L to M) Message
––––––> General Page (multiple sectors) 2
<–––––– Page Response
––––––> Base Station ACK Order 2
––––––> Channel Assignment Message 2
Mobile Originated (M to L) Message
<–––––– Origination Message
––––––> Base Station ACK Order 2
––––––> Channel Assignment Message 2
Registration Message
<–––––– Registration Message
––––––> Base Station ACK Order 2
. . . continued on next page
7

Control Channel Limiting Factors – continued
CDMA SC Products System Resource Guide (CSSRG) June 20017-36
Table 7-6: Paging Message Type Events
BTS Number of Half–Frames(9600 bps)
Paging Message TypesMS
––––––> Registration Accept Order 2
SMS/ADDS Page Message
––––––> Data Burst Message (multiple sectors) 2–15d
<–––––– Mobile Station ACK Order
––––––> Base Station ACK Order 2
Feature Notification
––––––> Feature Notification 2
<–––––– Feature Notification ACK Order
––––––> Base Station ACK Order 2
Shared Secret Data (SSD) Update
––––––> SSD Update 2
<–––––– Base Station Challenge Order
––––––> Base Station ACK Order 2
––––––> BS Challenge Confirmation Order 2
<–––––– SSD Update Confirm/Reject Order
––––––> Base Station ACK Order 2
Unique Challenge
––––––> Authentication Challenge 2
<–––––– Authentication Challenge Response
––––––> Base Station ACK Order 2
Note� a The number of half-frames is dependent on the number of neighbors. Three half-frames
accommodate 17 neighbors.
� b The number of half-frames is dependent on the number of carriers. One half-frame accommodatesthree carriers, two half-frames are necessary if there are 8 carriers.
� c The number of half-frames is dependent on the number of carriers. Two half-frames accommodateless than six carriers, an additional half-frame is required with six or more carriers.
� d The number of half-frames is dependent on the number of characters being sent. Twelve half-framesaccommodate 120 characters.
7

Control Channel Limiting Factors – continued
June 2001 7-37CDMA SC Products System Resource Guide (CSSRG)
Depending upon the paging mode and mobile programming, all or aspecific slot may be monitored by the mobile. Two types of pagingmodes may be implemented:
� Non-slotted
� Slotted.
Non-Slotted Mode
Paging and control messages for a mobile station operating in thenon-slotted mode can be received in any of the Paging Channel slots.Therefore, the non-slotted mode of operation requires the mobile stationto monitor all slots (2048 slots). While this provides the facility for thesystem to send paging messages on any slot at any time, it also requiresthe mobile expend more energy in this process, which causes shorterbattery life. The response time for a mobile operating in non-slottedmode is the equivalent to the sum of the two-way propagation delay andthe required processing time at both the mobile and CBSC.
Slotted Mode
The paging channel protocol provides for scheduling the transmission ofmessages for a specific mobile station in certain assigned slots. Supportof this feature is optional and may be enabled by each mobile station. Amobile station that monitors the paging channel only during certainassigned slots is referred to as operating in the slotted mode. During theslots in which the paging channel is not being monitored, the mobilestation can stop or reduce its processing in order to conserve battery life.This is one advantage of operating in slotted mode. The trade-off for thispower conservation is potential page delays and processing overhead dueto the fact that the mobile and mobility manager (MM) are required towait for the assigned slot cycle to send/receive a page.
If the system operates in slotted paging mode, the subscriber unit isrequired to be programmed with a preferred slot cycle index. The largerthe slot cycle index (SCI), the longer the potential delay. Table 7-7indicates the mobile’s activity per SCI setting. Currently only SCI valuesof 0 through 3 are supported for call processing due to the maximumallowable EMX timer setting of 15 seconds for the Repage Time-outValue.
Table 7-7: Slot Cycle Index Time
Slot Cycle Index Slot Cycle Period Duration (secs) Slots per Cycle
SCI=0 1 1.28 16
SCI=1 2 2.56 32
SCI=2 4 5.12 64
SCI=3 8 10.28 128
SCI=4 16 20.48 256
. . . continued on next page
7

Control Channel Limiting Factors – continued
CDMA SC Products System Resource Guide (CSSRG) June 20017-38
Table 7-7: Slot Cycle Index Time
Slot Cycle Index Slots per CycleDuration (secs)Slot Cycle Period
SCI=5 32 40.96 512
SCI=6 64 81.92 1024
SCI=7 128 163.84 2048
The IS-95 specification defines a slot cycle index of 0 to 7, hence themaximum number of paging channel slots is specified as follows:
Paging Channel Slots = 2 (maxium slot cycle index) * 16 slots per cycle = 2 7 * 16 = 2048
A mobile station operating in slotted mode generally monitors thepaging channel for one or two slots per slot cycle. The mobile canspecify its preferred slot cycle using the SCI. The “preferred” slot cycleindex is a number that a CDMA mobile, in slotted mode, reports everytime it originates a call, responds to a page, or registers with the system.It is assigned on a per-mobile basis and may differ frommobile-to-mobile. The slot cycle index used by the subscriber unit is thesmaller of the preferred slot cycle index of the mobile and the maximumslot cycle index allowed by the BTS (as communicated in the SystemParameters Message).
The Paging Channel is divided into 80 ms slots. The slots are groupedinto cycles of 2048 slots (163.84 seconds) which are referred to asmaximum slot cycles. A mobile station operating in the slotted modemonitors the paging channel using a slot cycle with a length that is asubmultiple of the maximum slot cycle length (see Table 7-7).Figure 7-9 shows an example for a slot cycle length of 1.28 seconds andwhere the mobile station’s slot cycle begins with slot 6. The mobilestation begins monitoring the paging channel at the start of slot 6. Thenext slot in which the mobile station must begin monitoring the pagingchannel is 16 slots later (in other words, slot 22).7

Control Channel Limiting Factors – continued
June 2001 7-39CDMA SC Products System Resource Guide (CSSRG)
Figure 7-9: Slotted Mode Structure Example
2047 0 1 2 3 4 5 6 7 14 15 16
1.28 seconds
System Time
Paging Channel Slots
Mobile Stationin Non-Active
State
Mobile Stationin Non-Active
State
80 ms
Reacquisition ofCDMA System
Mobile Station’s AssignedPaging Channel Slot
The mobile uses a hash function to select the page slot between 0 to2047.
Slotted Mode requires the mobile to monitor a dedicated paging slotwithin a preferred slot cycle (every 1.28 seconds with an SCI = 0). Themobile is programmed with a preferred slot cycle (the number of cyclesbetween scans of paging channel) using the Slot Cycle Index (SCI) field.This SCI field is stored in the subscriber record. The SCI is assigned ona per mobile basis, therefore multiple SCIs may be in use within aparticular system.
Access Channel Structure
The access channel differs from the paging channel in that all accesschannel messages are the same size and are referred to as an accesschannel slot. Each slot is made up of a number of frames. A frame is 20ms in duration. The number of frames that defines the slot size is equalto 4 + PamSz + MaxCapSz, where the PamSz (Preamble Size) typicallyis one to two frames and MaxCapSz (Maximum Capsule Size) is threeframes. PamSz is directly related to the cell radius of the cell as shownby Table 7-8.
Table 7-8: Cell Radius to PamSz (up to 60 km maximum)
Motorola Chipset
Cell Radius (kilometers) PamSz (frames)
0.0 – 3.9 0
4.0 – 7.9 1
8.0 – 13.9 2
14.0 – 18.9 3
. . . continued on next page
7

Control Channel Limiting Factors – continued
CDMA SC Products System Resource Guide (CSSRG) June 20017-40
Table 7-8: Cell Radius to PamSz (up to 60 km maximum)
Cell Radius (kilometers) PamSz (frames)
19.0 – 24.9 4
25.0 – 29.9 5
30.0 – 33.9 6
34.0 – 39.9 7
40.0 – 44.9 8
45.0 – 50.9 9
51.0 – 55.9 10
56.0 – 59.9 11
A longer preamble is required for mobiles that are farther away from thecell. This gives the base station a better chance of acquiring the mobilemessage. Events on the access channel are associated with the eventsthat take place on the paging channel:
� The access channel is a reverse CDMA channel used by mobilestations for communicating to the base station.
� Use the access channel for short signaling message exchanges, suchas, call originations, responses to pages, and registrations.
� The access channel is a slotted random access channel.
� The access channel data rate is fixed at a rate of 4800 bps.
� Each access probe sequence can consist of several probes. If noacknowledgment is received by the subscriber from the BTS, anotheraccess probe is transmitted after an additional backoff delay. Eachsubsequent access probe within the access probe sequence has anincrease in power. If a response is not obtained within the accessprobe sequence, another access probe sequence is transmitted after atime delay and the process continues.
Figure 7-10 shows the minimum and maximum number of frames thatcan exist in one access channel slot.
7

Control Channel Limiting Factors – continued
June 2001 7-41CDMA SC Products System Resource Guide (CSSRG)
Figure 7-10: Access Channel Slot
SystemTime
One Access Channel Slot
Access ChannelPreamble
(Modulation Symbol 0)
Access ChannelMessage Capsule
Access Channel Frame(20 ms)
1 + PamSz(1 to 16 frames)
3 + MaxCapSz(3 to 10 frames)
4 + PamSz + MaxCapSz(8 to 26 frames)
AccessProbe
Access ChannelSlot and Frame
Boundary
ÉÉÉÉÉÉÉÉÉÉÉÉÉÉÉÉÉÉÉÉÉÉÉÉÉÉÉÉÉÉÉÉÉÉÉÉÉÉÉÉÉÉÉÉ
Actual Access Probe Transmission
PN Randomization Delay = RN chips = RN * 0.8138 us
For the access channel, determine the frame size from the size of thepreamble and the message capsule. As IS-95 describes, preamble is 1 +PamSz and the message capsule is 3 + MaxCapSz. However, if theMaxCapSz is set to six on the CBSC, then the IS-95 MaxCapSz wouldbe equivalent to three. PamSz is derived from the cell radius parameter.If the converted value of PamSz from the CBSC is two (derived from thecell radius value), then the IS-95 PamSz would be equivalent to one.
Table 7-9 describes some of the main events carried on the accesschannel.
Table 7-9: Access Message Type Events
BTS MS Access Message Types Slots
Mobile Terminated (L to M) Message
––––––> General Page (multiple sectors)
<–––––– Page Response 1
––––––> Base Station ACK Order
––––––> Channel Assignment Message
. . . continued on next page
7

Control Channel Limiting Factors – continued
CDMA SC Products System Resource Guide (CSSRG) June 20017-42
Table 7-9: Access Message Type Events
BTS SlotsAccess Message TypesMS
Mobile Originated (M to L) Message
<–––––– Origination Message 1
––––––> Base Station ACK Order
––––––> Channel Assignment Message
Registration Message
<–––––– Registration Message 1
––––––> Base Station ACK Order
––––––> Registration Accept Order
SMS/ADDS Page Message
––––––> Data Burst Message (multiple sectors)
<–––––– Mobile Station ACK Order 1
––––––> Base Station ACK Order
Feature Notification
––––––> Feature Notification
<–––––– Feature Notification ACK Order 1
––––––> Base Station ACK Order
Shared Secret Data (SSD) Update
––––––> SSD Update
<–––––– Base Station Challenge Order 1
––––––> Base Station ACK Order
––––––> BS Challenge Confirmation Order
<–––––– SSD Update Confirm/Reject Order 1
––––––> Base Station ACK Order
Unique Challenge
––––––> Authentication Challenge
<–––––– Authentication Challenge Response 1
––––––> Base Station ACK Order
7

Control Channel Limiting Factors – continued
June 2001 7-43CDMA SC Products System Resource Guide (CSSRG)
Maximum RecommendedUtilization
Paging Channel
The limiting factor for the paging channel is channel utilization. Thisutilization is based upon the total number of half–frames transmitted (toall of the subscribers on a per–sector/carrier basis) divided by themaximum number of half–frames available for a particular time periodof interest. The maximum utilization recommended for the pagingchannel is 70%. This maximum utilization is an average utilizationcalculated from data from a 30 minute time period.
Access Channel
The limiting factor for the access channel is channel utilization. Thisutilization is based upon the total number of slots transmitted (from allof the subscribers on a per–sector/carrier basis) divided by the maximumnumber of slots available for a particular time period of interest. Sincethe access channel is less efficient than the paging channel (primarilydue to blocking and collisions), the maximum utilization recommendedfor the access channel utilization is 40%. This maximum utilization is anaverage utilization calculated from data from a 30 minute time period.
7

Control Channel Determining Utilization
CDMA SC Products System Resource Guide (CSSRG) June 20017-44
Introduction
In order to determine Control Channel utilization, the engineer needs tocollect data about how the system is functioning and also determine thepresent status of the system.
Collect Data
Collect the necessary data to be used for monitoring the controlchannels.
Identifying Data and Traffic Variables
To monitor the paging and access channel utilization, use a set of SQLscripts designed to estimate paging and access channel utilization on aper-sector basis from existing Performance Management (pmC) trafficpeg counts. The SQL scripts were developed by a SuperCell SystemPerformance group to provide paging and access channel link utilizationestimates directly related to measured traffic intensity. These scripts usethe Application Processor (AP), SC–UNO, or UNO platforms to accessthe Performance Management peg counts through the Relational DataBase Management System (RDBMS) database. The scripts also apply asoftware release–dependent set of work load model algorithms toestimate the utilization for individual call processing events. ForMotorola Systems Engineers, the release–dependent scripts can be foundat the SuperCell System performance group’s internal Motorola webpage (currently found at the following URL):
http://scwww.cig.mot.com/people/platform/ArchPerf/performance/
Look under the Estimating Device Utilization -- AP SQL Scripts link inthe Tools section. For more information on the setup and usage of thesescripts refer to the above web page. Service providers can contact theiraccount team Systems Engineer for copies of the SQL scripts and formore information. Starting with Release 15, these scripts will comepackaged with the UNO software product.
Measurement Intervals
Collect data to determine the Daily Busy Period and Busy Day (at least).It is important to collect measurements for all traffic variables that loadthe paging and access channels and to collect enough time periodsthroughout the day to ensure subsequent capture of the busy period.
The minimum recommendation is to monitor the paging and accesschannel link utilization on a per-carrier, per-sector basis for each BTS inthe system on a monthly basis. Collect busy hour data for the busy dayof the month for the CBSC/system being analyzed. For systems whichare growing at a rapid rate, or ones that have deployed features whichmay add significant loading to the paging or access channel (in otherwords, short messaging service), executing the SQL scripts on abi-weekly basis for the busy hour, busy day of the week is preferred.
If a design change is made to a CBSC/system affecting the paging oraccess channel performance, execute the SQL scripts for the affected
7

Control Channel Determining Utilization – continued
June 2001 7-45CDMA SC Products System Resource Guide (CSSRG)
area before and after the change. If there are a few sites exhibiting ahigher than normal amount of utilization than the rest of the sites in theCBSC/system (or if there are a few sites that are close to or exceedingthe maximum recommended paging or access channel utilization limits),determine if the utilization reported is valid. The following are someitems to check:
� Is there an issue with the system design?
� Is the database for these sites accurate?
� Is the SQL script functioning properly?
If the utilization has been validated, the engineer should monitor andtrend those higher than normal sites on a weekly basis until a capacityrelief mechanism or design change can be implemented. For thissituation, it may be necessary to customize the SQL script setup in orderto collect the data for just those selected sites of interest.
In networks where busy periods are known, collect data to monitor thetraffic patterns and, most likely, overload situations. Changes detected intraffic patterns indicate potential for uncharacteristic loading; in thiscase, a new baseline may need to be established.
Paging and Access Channel Monitoring at OMC-R
Use the PCH_UTIL SQL script to monitor the utilization of the pagingchannel (PCH) on a per-carrier, per-sector basis. This SQL scriptcalculates the total utilization percentage for the paging channel. Themaximum recommended utilization percentage for the paging channel is70%. The script also breaks down the total utilization into severaldifferent components of individual utilization percentages for certain callmodel terms. Use these percentages to analyze the contribution of eachcall model component to the overall utilization of the paging channel.
Use the ACC_UTIL SQL script to monitor the utilization of the accesschannel (ACC) on a per-carrier, per-sector basis. This SQL scriptcalculates the total utilization percentage for the access channel. Sincethe random access behavior of the access channel causes blocking andcollisions to occur, the maximum recommended utilization percentagefor the access channel is limited to 40%. Similar to the paging script,this script also breaks down the total utilization into several differentcomponents of individual utilization percentages for certain call modelterms.
Both of these SQL scripts generate large amounts of data.They create approximately 30 lines of data for each sectorof each BTS in the system. As a result of the large outputfiles, it is recommended to post-process the data tocondense the output file to a smaller size for easier analysisand storage purposes.
NOTE
Invoking either script results in output consisting of a series oftwo-column tables. Each sector under the user–specified CBSC has its
7

Control Channel Determining Utilization – continued
CDMA SC Products System Resource Guide (CSSRG) June 20017-46
own table. The first column of each table contains the ACC or PCHutilization call model terms which contribute to the messaging on theACC or PCH. The second column contains the calculated values of theseterms (the utilization values are given as a percentage).
The following shows a command line typed by a user and the resultingoutput with only the one sector’s worth of output for both theACC_UTIL and PCH_Util scripts.
ACC_UTIL 2 5 03/12/99 18:00 <–––– Entered by user omcnum 2 cbscnum 5 date 03/12/99 period 18:00 accs 3 bts 18 sector 2 att 5238.00000000000 moa 114.000000000000 mta 5124.00000000000 cc 200.000000000000 moc 111.000000000000 mtc 89.0000000000000 cf 5038.00000000000 mof 3.00000000000000 mtf 5035.00000000000 reg 263.000000000000 adds_page_ack 193.000000000000 ssd_upd_pch_ack 75.0000000000000 uniq_chlg_pch_ack 85.0000000000000 moc_util 1.11000000000000 mof_util 0.03000000000000 mtc_util 0.89000000000000 mtf_util 0.00000000000000 reg_util 2.63000000000000 adds_page_ack_util 1.93000000000000 upd_pch_ack_util 0.75000000000000 chlg_pch_ack_util 0.85000000000000 total_util 8.19000000000000
PCH_UTIL 2 5 03/12/99 18:00 9600 1,2,3,4 <–––– Entered by user omcnum 2 cbscnum 5 date 03/12/99 period 18:00 baud 9600 carrlist 3 bts 18 sector 2 carrier 3 moc 111 mof 3 mtc 89 page 5124.00000000000 reg 263 mwn_pch 412.000000000000 adds_page 1933.00000000000
7

Control Channel Determining Utilization – continued
June 2001 7-47CDMA SC Products System Resource Guide (CSSRG)
upd_pch 70.0000000000000 upd_pch_ack 75 chlg_pch 86.0000000000000 moc_util 0.24666666666667 mof_util 0.00666666666667 mtc_util 0.19777777777778 page_util 1.42333333333333 reg_util 0.58444444444444 mwn_pch_util 0.91555555555556 adds_page_util 4.29555555555556 upd_pch_util 0.15555555555556 upd_pch_ack_util 0.16666666666667 chlg_pch_util 0.19111111111111 base_util 10.16 total_util 18.3433333333333
Depending upon the version of the script, the base_utilvalue may be 17.02 versus the 10.16 shown above. Thetotal_util will be adjusted accordingly.
The base utilization calculation in some older versions ofthe PCH_Util script includes a null General Page message.That null General Page message is only present if there isno useful General Page message. Therefore, it is notconsidered part of the PCH Overhead (Base) Utilization.These PCH_Util scripts generate a base_util value of17.02%. This value adds a level a conservatism to thePCH_Util total utilization calculation.
NOTE
Determining Paging ChannelUtilization
Paging Channel Workload Model
Events such as page failures, page successes, SMS, etc. have at least onemessage in the message flow that broadcasts to all BTSs either in thepaging area or the CBSC (depending on whether broadcast or locationarea paging is turned on in the CBSC).
The following expression, made up of N different classes of signalingtraffic, gives the utilization of the paging channel under various trafficrates and mixes. This equation can be considered as the PCH WorkloadModel:
U = A1 * S1 + A2 * S2 + ... + AN * SN + Overhead [EQ 7–2]
Where:
Ai refers to the Arrival Rate (number of occurrences) for acertain class or grouping of signaling traffic (forexample, mobile originations).
7

Control Channel Determining Utilization – continued
CDMA SC Products System Resource Guide (CSSRG) June 20017-48
Si refers to the Resource Demand that Ai places on thepaging channel link.
Overhead refers to any Resource Demand that does not scale as afunction of call processing Arrival Rates.
The Arrival Rates are available from the Performance Management (PM)peg counts. Determine the Resource Demands by which messages arepresent in each of the classes of signaling traffic, their sizes in units ofhalf frames, and the baud rate (refer to Table 7-10).
This equation highlights the PCH Workload Model and how it may beused to estimate PCH utilization for any arbitrary traffic rate and mix.The PCH Workload Model is the basis of the PCH_Util script. Thefollowing sections highlight what the PCH_Util script does or what isrequired to do in the absence of the script.
Table 7-10 details the messages and message sizes per scenario todetermine the resource requirement for each scenario and the PMequation used to determine the Arrival Rate. The PerformanceManagement (PM) report peg counts are given in the form of “table#.peg_count#” (for example, 10.1 refers to table 10, peg count 1).
Refer to the Performance Analysis, SC Product Family - CDMA manualavailable from Technical Education and Documentation for furtherinformation about PM reports.
Table 7-10: Paging Channel Workload Model Scenario
Scenario Message
Number ofHalf-Frames(9600 bps)
PCH_Util ScriptName PM Report
Data
Overhead � System Parameter Msg
� Access Parameter Msg
� Neighbor List Msg
� CDMA Channel List Msg
� Extended Sys.ParametersMsg
� Global Services RedirectMsg
3
2
3
1
2
2
base_util
Base Station Ack Order 2 moc 10.3
Mobile OriginatedCompletions
Channel AssignmentMessage
2
Base Station Ack Order 2 mof 10.1 – 10.3
Mobile OriginatedFailures
Channel AssignmentMessage
2
. . . continued on next page
7
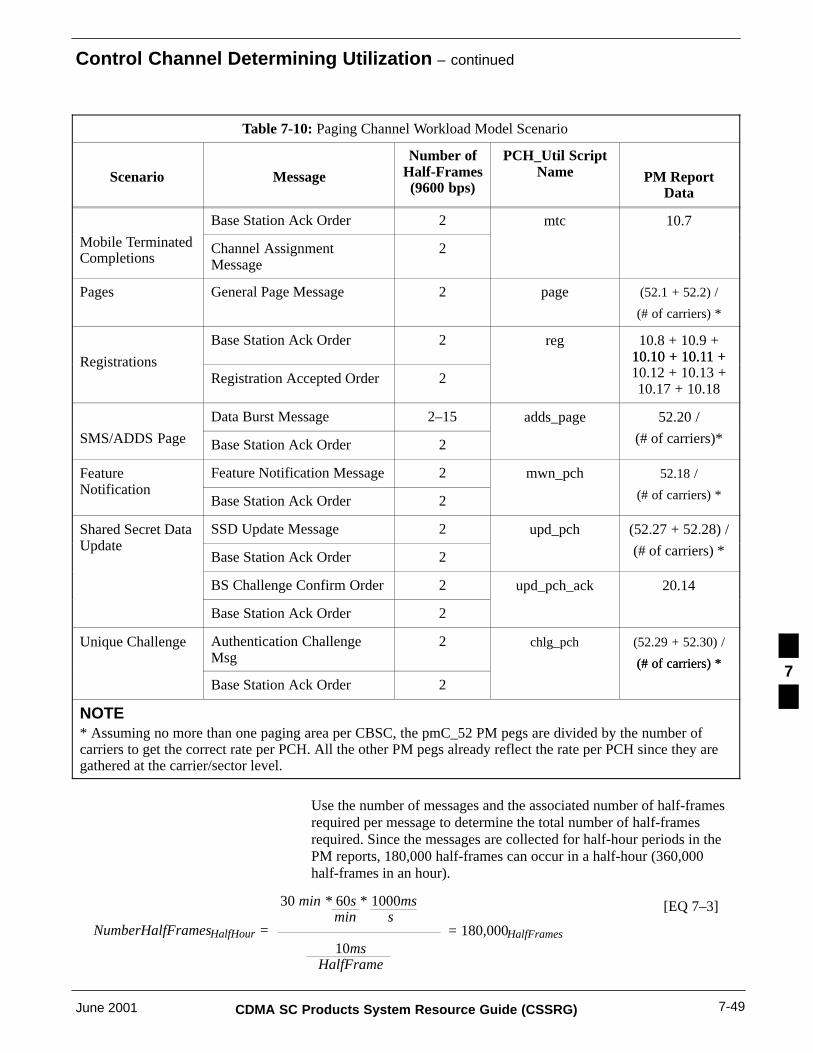
Control Channel Determining Utilization – continued
June 2001 7-49CDMA SC Products System Resource Guide (CSSRG)
Table 7-10: Paging Channel Workload Model Scenario
Scenario PM ReportData
PCH_Util ScriptName
Number ofHalf-Frames(9600 bps)
Message
Base Station Ack Order 2 mtc 10.7
Mobile TerminatedCompletions
Channel AssignmentMessage
2
Pages General Page Message 2 page (52.1 + 52.2) /
(# of carriers) *
Base Station Ack Order 2 reg 10.8 + 10.9 +10.10 + 10.11 +Registrations
Registration Accepted Order 2
10.10 + 10.11 +10.12 + 10.13 +10.17 + 10.18
Data Burst Message 2–15 adds_page 52.20 /
SMS/ADDS Page Base Station Ack Order 2 (# of carriers)*
Feature Feature Notification Message 2 mwn_pch 52.18 /Notification
Base Station Ack Order 2 (# of carriers) *
Shared Secret Data SSD Update Message 2 upd_pch (52.27 + 52.28) /Update
Base Station Ack Order 2 (# of carriers) *
BS Challenge Confirm Order 2 upd_pch_ack 20.14
Base Station Ack Order 2
Unique Challenge Authentication ChallengeMsg
2 chlg_pch (52.29 + 52.30) /
(# of carriers) *
Base Station Ack Order 2
(# of carriers) *
NOTE* Assuming no more than one paging area per CBSC, the pmC_52 PM pegs are divided by the number ofcarriers to get the correct rate per PCH. All the other PM pegs already reflect the rate per PCH since they aregathered at the carrier/sector level.
Use the number of messages and the associated number of half-framesrequired per message to determine the total number of half-framesrequired. Since the messages are collected for half-hour periods in thePM reports, 180,000 half-frames can occur in a half-hour (360,000half-frames in an hour).
NumberHalfFramesHalfHour =
30 min * 60s * 1000ms min s
[EQ 7–3]
10msHalfFrame
= 180,000HalfFrames
7

Control Channel Determining Utilization – continued
CDMA SC Products System Resource Guide (CSSRG) June 20017-50
Determine the impact on paging channel utilization (expressed as apercentage) in a half-hour for each signaling scenario with the followingequation.
PCHUtili =HalfFramesScenario
[EQ 7–4] Ai *
180,000* 100
PCHUtili =HalfFramesScenario [EQ 7–5]
Ai *1800
Where:
Ai refers to the Arrival Rate (number of occurrenceswithin a half-hour period) for a certain class orgrouping of signaling traffic as shown by the PMReport Data calculation provided in Table 7-10.
HalfFramesScenario refers to the number of half-frames eachoccurrence of Ai requires.
The total paging channel utilization is the sum of the various call modelcomponents described above. (Refer to Table 7-10 for the number ofhalf-frames required for each scenario.)
PCHUtilTotal = moc * (4 / 1800) + [EQ 7–6] mof * (4 / 1800) +mtc * (4 / 1800) +(page / #_carrier) * (2 / 1800) +reg * (4 / 1800) +(mwn_pch / #_carriers) * (4 / 1800) +(adds_page / #_carriers) * (4a / 1800) +(upd_pch / #_carriers) * (4 / 1800) +upd_pch_ack * (4 / 1800) +(chlg_pch / #_carriers) * (4 / 1800) +Overhead
The adds_page can vary from 4–17 half frames. Thisminimum value of four can be adjusted higher with ameasured average value.
NOTE
It’s possible to sum moc, mof, mtc, reg, and upd_pch_ack then multiplyby 4/1800 to simplify the calculation for arriving at PCHUtilTotal .However, by doing this, the engineer loses valuable insight intounderstanding the impact of each of the scenarios on the paging channel.Therefore, calculate the impact on the paging channel for each scenarioindividually. Then, add the individual components together to obtain thetotal paging channel utilization. As new features are deployed in thesystem, new messages could be added to the paging channel. If so,
7

Control Channel Determining Utilization – continued
June 2001 7-51CDMA SC Products System Resource Guide (CSSRG)
arrival rates and resource demands for these new features need to beadded to the equation.
There are 100 half-frames transmitted per second. If a systemexperiences a peak of 25 pages per second, the paging channel is 50%utilized just for the general paging messages alone:
25pages/s * 2halfframe/page
100halfframe/s* 100 = 50%
The PCH_Util script processes data for a given half-hourperiod. Data could be collected for two half-hour periodscomprising the busy hour and then combined in an externalprocess/spreadsheet. Combining the data from the twohalf-hour periods tends to smooth out the peaks of the data.
NOTE
Overhead
The overhead (base) workload sent over the paging channel (PCH)consists of the Overhead Messages that are sent at least once every 1.28seconds (1800/1.28 = 1406.25 overhead message groups in a half-hour).
Table 7-6 shows the Overhead Messages and the number of half framesassociated with each of these messages. Excluding the Null Message, theoverhead messages comprise of a total of 13 half-frames.
The overhead (Base Paging Channel) utilization resulting from thesemessages (workload) is calculated as follows:
Overhead = 11800 s
13 half–frames
1800= 10.16%
1.28 s
Another derivation of the calculation is as follows:
Overhead = 13 half–frames * 10 ms/half–frame
1.28 s * 1000 ms/s= 10.16%* 100
Therefore, 10.16% of the PCH capacity is unavailable for other work.
7

Control Channel Determining Utilization – continued
CDMA SC Products System Resource Guide (CSSRG) June 20017-52
The base utilization calculation in some older versions ofthe PCH_Util script includes a null General Page message.That null General Page message is only present if there isno useful General Page message. Therefore, it is notconsidered part of the PCH Overhead (Base) Utilization.These PCH_Util scripts generate a base_util value of17.02%. This value adds a level a conservatism to thePCH_Util total utilization calculation.
NOTE
Mobile Origination Completions (PCH_Util Script:moc)
The contribution of originations to the paging channel load is a factor inthe PCH Workload Model. There are two forms of originations to beaccounted for:
� Those which are completed
� Those which fail.
The origination information can be found in the pmC_10 tables of thePerformance Management statistics.
Table 7-11: pmC_10 Records, General Data
pmC_10 Date Start Interval End Interval OMC MM
record_num record_date Start_of_int end_of_int OMC_id MM_id
10 3/12/99 18:00 18:30 2 5
10 3/12/99 18:30 19:00 2 5
Table 7-12: pmC_10 Records, Origination Data
BTS Sector Carrier Orig Attempt Orig AssignAttempt
Orig AssignComplete
subj_id_1 subj_id_2 subj_id_3 peg_count_1 peg_count_2 peg_count_3
18 1 1 34 34 33
18 1 2 28 28 28
18 1 3 26 26 25
18 1 4 35 35 34
18 2 1 102 100 95
18 2 2 83 83 80
18 2 3 114 113 111
. . . continued on next page
7

Control Channel Determining Utilization – continued
June 2001 7-53CDMA SC Products System Resource Guide (CSSRG)
Table 7-12: pmC_10 Records, Origination Data
subj_id_1 peg_count_3peg_count_2peg_count_1subj_id_3subj_id_2
18 2 4 113 113 107
18 3 1 85 84 80
18 3 2 119 119 116
18 3 3 79 79 78
18 3 4 101 101 100
18 1 1 35 35 34
18 1 2 30 30 30
18 1 3 28 28 27
18 1 4 32 32 30
18 2 1 100 101 97
18 2 2 82 82 82
18 2 3 110 110 110
18 2 4 114 114 109
18 3 1 84 84 80
18 3 2 120 119 117
18 3 3 80 80 79
18 3 4 102 101 101
The first half of the data corresponds to the first half-hour(18:00 to 18:30). The second half of the data correspondsto the second half-hour (18:30 to 19:00).
NOTE
From Table 7-12, a paging channel on BTS-18 sector two, carrier three isimpacted by 111 origination assignment completions (peg_count_3) inthe busy half-hour, or 111 + 110 = 221 in the busy hour.
Using Table 7-10, the number of half-frames on the paging channelattributed to origination assignment completions are:
� Two half-frames for the Base Station Ack Order
� Two half-frames for the Channel Assignment Message.
Therefore, the number of half-frames required on BTS-18 sector two,carrier three for the half-hour is:
7

Control Channel Determining Utilization – continued
CDMA SC Products System Resource Guide (CSSRG) June 20017-54
Base Station Ack Order: 111 * 2 = 222
Channel Assignment Msg.: 111 * 2 = 222
444 half-frames
The percentage of the paging channel utilized for mobile originatedcompletions is then:
PCHUtilmoc =(2 + 2) [EQ 7–7]
111*1800
= 0.247%
Mobile Originated Failures (PCH_Util Script: mof)
From Table 7-12, a paging channel on BTS-18 sector two, carrier three isimpacted by 114 - 111 = 3 origination failures (peg_count_1 -peg_count_3) in this half-hour, which is also the value for the busy hour.
Similar to mobile origination completions, this shows that twohalf-frames are required for the Base Station Ack Order and twohalf-frames for the Channel Assignment Message. Therefore, the totalnumber of half-frames required for origination failures on BTS-18 sectortwo,carrier three is 3 * 2 + 3 * 2 = 12 for the half-hour or the hour.
The percentage of the paging channel utilized for mobile originatedfailures is:
PCHUtilmof =(2 + 2) [EQ 7–8]
3*1800
= 0.007%
Pages (PCH_Util Script: page)
Retrieve the total number of pages (success and failures) from theperformance management statistics (pmC_52 and pmC_70 from theOMC-R). The pmC_52 tables record the number of pages handled by theCBSC. The pmC_70 tables record the number of pages handled by eachlocation area defined under that CBSC, if broadcast paging is turned offin the CBSC. Below are examples of portions of the pmC_52 andpmC_70 tables.
Table 7-13: pmC_52 Records
pmC_52 Date StartInterval
EndInterval
OMC MM SlottedPage
UnslottedPage
record_num record_date Start_of_int end_of_int OMC_id MM_id peg_count_1
peg_count_2
52 3/12/99 18:00 18:30 2 5 5124 0
52 3/12/99 18:30 19:00 2 5 4821 0
7

Control Channel Determining Utilization – continued
June 2001 7-55CDMA SC Products System Resource Guide (CSSRG)
Table 7-14: pmC_70 Records
pmC_70 Date StartInterval
EndInterval
OMC MM LocationAreaCode
Pages Page Acks
record_num
record_date
start_of_int
end_of_int
OMC_id MM_id subj_id_1
peg_count_1
peg_count_2
70 3/12/99 18:00 18:30 5 3 9 1019 117
70 3/12/99 18:00 18:30 5 3 8 5555 250
70 3/12/99 18:00 18:30 5 3 7 5296 247
70 3/12/99 18:00 18:30 5 3 1 20508 3092
70 3/12/99 18:30 19:00 5 3 9 915 80
70 3/12/99 18:30 19:00 5 3 8 5462 229
70 3/12/99 18:30 19:00 5 3 7 5283 266
70 3/12/99 18:30 19:00 5 3 1 20235 2976
NOTEThese tables do not distinguish between original pages, re-pages, or neighbor re-pages.
Define broadcast paging in the PAGEPARMS parameter of the CBSCdatabase. If broadcast paging is enabled, information will be found in thepmC_52 tables. If broadcast paging in disabled, information will befound in both the pmC_52 and pmC_70 tables.
The PCH_Util script assumes broadcast paging andtherefore collects paging data only from the pmC_52 table.
NOTE
Assuming broadcast paging, in the above example, each sector of a BTSunder OMC-2 MM-5 carries 5,124 pages in the busy half-hour or 5,124+ 4,821 = 9,945 pages in the hour (see Table 7-13). Determine thenumber of pages each paging channel carries by dividing the number ofpages by the number of active paging channels in that sector. Determinewhich carriers in the sector have paging channels. The number of pagingchannels on each carrier can be seen in the CHANCONF of the CBSCdatabase.
In the future, it may be possible to put more than onepaging channel on a carrier. However, current CBSCreleases only supports one paging/access channel percarrier.
NOTE
7

Control Channel Determining Utilization – continued
CDMA SC Products System Resource Guide (CSSRG) June 20017-56
For each of these carriers with paging channels, verify that theCHANNELLIST lists the other carriers with paging channels in thesector. This forms the CDMA Channel List message that the mobile usesto determine how many carriers with paging channels are in the sector. Ifthe BTS has a single carrier in the sector with a single paging channel,the paging channel carries 5,124 pages in a half-hour. If the site has fourcarriers, each with a paging channel, then each paging channel carries5,124 / 4 = 1,281 pages in the half-hour.
Using Table 7-10, the number of half-frames on the paging channelattributed to pages are two half-frames for the General Page Message.
Therefore, the total number of half-frames required on BTS-18 sectortwo, carrier three for the half-hour (assuming broadcast paging) is 1,281* 2 = 2,562.
The percentage of the paging channel utilized for paging is:
PCHUtilpage =5124
4 [EQ 7–9]
= 1.423%*
(2)
1800
The symbol � � means to round up the number to thenearest integer.
NOTE
For Location Area Paging, determine which paging areas are associatedwith each BTS. This can be seen in the LOCAREAS record of thedatabase. It lists the location areas associated with each BTS. This tableis derived from the SECGEN table of the database. The SECGEN tableallows location areas to be defined on the carrier-level, but the softwaredoes not currently support using this data. The FEP at the CBSCreceives a page from the EMX and strips out the location areainformation before sending it to the appropriate BTSs. This has twoaffects:1. The BTS sends the page to all sectors. If a page for paging area one
(PA1) is sent, and the BTS defined sector one as PA1 and sectorstwo and three as paging area two (PA2), the page is sent to allsectors since there is no location information at this level.
2. The sectors at this BTS are required to handle pages for both PA1and PA2.
Paging Area One (LAC 1) shows 20,508 pages in a half-hour and 20,508+ 20,235 = 40,743 pages in its busy hour which need to be supported byeach sector of every cell in this paging area. If a BTS within this pagingarea has four carriers in a sector and there is a paging channel on eachcarrier, each paging channel carries approximately 5,127 pages in thehalf-hour and 10,186 pages in an hour.
Mobile Terminated Completions (PCH_Util Script: mtc)
The total number of pages has been determined so far. The next step is todetermine the number of page responses that occur for mobile terminated
7

Control Channel Determining Utilization – continued
June 2001 7-57CDMA SC Products System Resource Guide (CSSRG)
completed calls in order to calculate the number of BaseAcknowledgments (Ack) and Channel Assignment messages required.This information is found in the pmC_10 tables of the PerformanceManagement statistics. Inapplicable columns are not shown for brevity.
Table 7-15: pmC_10 Records, General Data
pmC_10 Date Start Interval End Interval OMC MM
record_num record_date Start_of_int end_of_int OMC_id MM_id
10 3/12/99 18:00 18:30 2 5
10 3/12/99 18:30 19:00 2 5
Table 7-16: pmC_10 Records, Termination Data
BTS Sector Carrier TermAttemptSlotted
TermAttempt
Non–slotted
Term AssignAttempt
Term AssignComplete
subj_id_1 subj_id_2 subj_id_3 peg_count_4 peg_count_5 peg_count_6 peg_count_7
18 1 1 16 0 16 16
18 1 2 20 0 20 20
18 1 3 18 0 18 17
18 1 4 28 0 28 28
18 2 1 62 0 62 60
18 2 2 62 0 59 59
18 2 3 89 0 89 89
18 2 4 90 0 86 85
18 3 1 60 0 59 58
18 3 2 65 0 63 63
18 3 3 60 0 59 59
18 3 4 47 0 47 47
18 1 1 17 0 17 17
18 1 2 22 0 22 22
18 1 3 19 0 19 19
18 1 4 26 0 26 26
. . . continued on next page
7

Control Channel Determining Utilization – continued
CDMA SC Products System Resource Guide (CSSRG) June 20017-58
Table 7-16: pmC_10 Records, Termination Data
subj_id_1 peg_count_7peg_count_6peg_count_5peg_count_4subj_id_3subj_id_2
18 2 1 62 0 62 60
18 2 2 61 0 59 59
18 2 3 92 0 91 91
18 2 4 89 0 87 87
18 3 1 60 0 59 58
18 3 2 66 0 64 63
18 3 3 58 0 58 58
18 3 4 50 0 50 50
Using Table 7-16, a paging channel on BTS-18 sector two, carrier threeis impacted by 89 completed mobile assignments (peg_count_7) in thebusy half-hour or 89 + 91 = 180 (if an hour is analyzed).
Using Table 7-10, the number of half-frames on the paging channelattributed to termination assignment completions are the:
� Two half-frames for the Base Station Ack Order
� Two half-frames for the Channel Assignment Message.
Therefore, the total number of half-frames required on BTS-18 sectortwo, carrier three for the half-hour is:
Base Station Ack Order: 89 * 2 = 178
Channel Assignment Msg.: 89 * 2 = 178
356 half-frames
The percentage of the paging channel utilized for mobile terminatedcompletions is:
PCHUtilmtc =(2 + 2)
[EQ 7–10]
89*1800
= 0.198%
Registrations (PCH_Util Script: reg)
Registration information is also located in the pmC_10 tables of thePerformance Management reports. Table 7-17 shows the additional pegcounts associated with the registration data.
7

Control Channel Determining Utilization – continued
June 2001 7-59CDMA SC Products System Resource Guide (CSSRG)
Table 7-17: pmC_10 Records, Registration Data
BTS Sector Carrier Powerup RegSlotted
Powerup Regnon–
slotted
ParamChange
Regslotted
ParamChange
Regnon–
slotted
Misc.Reg
Slotted
Misc.Regnon–
slotted
PowerDownReg
Slotted
PowerDownRegnon–
slotted
subj_id_1
subj_id_2
subj_id_3
peg_count_8
peg_count_9
peg_count_10
peg_count_11
peg_count_12
peg_count_13
peg_count_17
peg_count_18
18 1 1 12 0 0 0 43 0 0 0
18 1 2 10 0 0 0 24 0 0 0
18 1 3 15 0 0 0 30 0 0 0
18 1 4 6 0 0 0 43 0 0 0
18 2 1 23 0 0 0 202 1 0 0
18 2 2 31 0 0 0 153 0 0 0
18 2 3 29 0 0 0 234 0 0 0
18 2 4 20 0 0 0 159 0 0 0
18 3 1 11 0 0 0 194 1 0 0
18 3 2 27 0 0 0 147 0 0 0
18 3 3 15 0 0 0 164 0 0 0
18 3 4 34 0 0 0 201 0 0 0
18 1 1 15 0 0 0 44 0 0 0
18 1 2 14 0 0 0 26 0 0 0
18 1 3 13 0 0 0 32 0 0 0
18 1 4 8 0 0 0 42 0 0 0
18 2 1 25 0 0 0 200 1 0 0
18 2 2 33 0 0 0 160 0 0 0
18 2 3 28 0 0 0 240 0 0 0
18 2 4 23 0 0 0 150 0 0 0
18 3 1 14 0 0 0 190 1 0 0
18 3 2 30 0 0 0 137 0 0 0
. . . continued on next page
7

Control Channel Determining Utilization – continued
CDMA SC Products System Resource Guide (CSSRG) June 20017-60
Table 7-17: pmC_10 Records, Registration Data
subj_id_1
peg_count_18
peg_count_17
peg_count_13
peg_count_12
peg_count_11
peg_count_10
peg_count_9
peg_count_8
subj_id_3
subj_id_2
18 3 3 15 0 0 0 159 0 0 0
18 3 4 35 0 0 0 213 0 0 0
From this table, a paging channel on BTS-18 sector two, carrier threehas 29 + 234 = 263 registrations (peg_count_8 + peg_count_9 +peg_count_10 + peg_count_11 + peg_count_12 + peg_count_13 +peg_count_17 + peg_count_18) in the half-hour and 29 + 234 + 28 +240 = 531 registrations in the hour.
Using Table 7-10, the number of half-frames on the paging channel thatcan be attributed to registrations are the:
� Two half-frames for the Base Station Ack Order
� Two half-frames for the Registration Accepted Order.
Therefore, the total number of half-frames required on BTS-18 sectortwo, carrier three for the half-hour to support the registrations is:
Base Station Ack Order: 263 * 2 = 526
Registration Accepted Order: 263 * 2 = 526
1,052 half-frames
The percentage of the paging channel utilized for registrations is:
PCHUtilreg =(2 + 2) [EQ 7–11]
263 *1800
= 0.584%
SMS – Prior to R9
SMS messages are very similar to pages in that they are broadcast to allBTSs either in the paging area or to all BTS under the CBSC, dependingon the configuration of the CBSC paging scheme.
Prior to CDMA BSS Release 9, there were no peg counts recorded bythe CBSC for the SMS messages. For these systems, the proposedapproach to estimating the contribution of SMS to the paging load is todistribute the total number of SMS messages (information from theMessage Register) according to the traffic distribution.
For example, assume that the total number of SMS messages sent fromthe Message Register (MR) during the busy hour is 2,500. Thedistribution of these to the different paging areas is as follows:
∑ PLA + ∑ PB
PS [EQ 7–12]
* SMS = SMSL
7
Control Channel Determining Utilization – continued
June 2001 7-61CDMA SC Products System Resource Guide (CSSRG)
Where:
PS corresponds to pages to the specific location (or CBSC) ofinterest
PLA corresponds to pages to all location areas
PB corresponds to pages to CBSCs with broadcast “on”
SMS corresponds to the total number of SMS messages sent
SMSL corresponds to SMS messages sent to the specific location ofinterest.
In the following example, if the paging area containing BTS-18 has40,743 pages and the sum of all the paging areas is 400,000 pages, thispaging area handles 10.19% of the SMS messages, or 255 SMSmessages in the busy hour.
400,000 + 0
40,743* 2,500 � 255
Since SMS message delivery is similar to page delivery, each sector inthe paging area handles up to 255 SMS messages. Since BTS-18 isassumed to be a four–carrier site (each having a paging channel), 255SMS messages are divided by four to get 64 SMS messages per carrier.The paging channel for BTS-18 sector two, carrier three handles 64 SMSmessages in the busy hour. The number of SMS responses to this carrieralso needs to be estimated. If the number of SMS messages is small, theacknowledgments to each sector is also small and is insignificant in thecontribution to the overall paging channel load. If the number of SMSmessages are substantial, use the same procedure for distributing theSMS responses that’s used for the messages. The distribution should usethe page acknowledgments to this carrier compared to all pageacknowledgments to all carriers as the weighting factor. The worst caseassumption is that all SMS messages are received and acknowledged.
∑ PAcks
PAcksS [EQ 7–13]
* SMS = SMSAcksS
Where:
PAcksS corresponds to page acks received that are associated withthe specific paging channel
PAcks corresponds to page acks to the system
SMS corresponds to the total number of SMS messages sent
SMSAcksS corresponds to SMS messages sent to the specific locationof interest.
Assuming that the number of busy hour page acks for BTS-18 sectortwo, carrier three was 89 + 92 = 181 and the total number of acks for thesystem was 240,000, then the SMS acks on this paging channel is 1.88.
240,000
181* 2,500 � 1.88
7

Control Channel Determining Utilization – continued
CDMA SC Products System Resource Guide (CSSRG) June 20017-62
Based on this example, the paging channel on BTS-18 sector two, carrierthree carries 64 SMS messages and two SMS acknowledgments. Thenumber of half-frames each message uses are 12 and 2 respectively.Therefore, the total number of half-frames required in an hour is 772(386 for the half-hour).
SMS 64 * 12 = 768
SMS Acks 2 * 2 = 4
772 half-frames in an hour
(386 half-frames in a half-hour)
The percentage of the paging channel utilized for SMS in a half-hour is:
PCHUtilSMS = = 0.213%*
(12)
1800
[EQ 7–14] 255
4
/ 2
PCHUtilSMSAcks = = 0.001%*
(2)
1800
[EQ 7–15] 8
4
/ 2
The symbol � � means to round up the number to thenearest integer.
NOTE
SMS/ADDS Page – Post R9 (PCH_Util Script: adds_page)
Starting with CDMA BSS Release 9, the Short Message Service (SMS)feature is now considered part of an Application Data Delivery Service(ADDS) feature. In addition to delivering data on the paging channel(similar to the SMS feature), this feature also allows data delivery tooccur on the traffic channel. As far as the paging channel is concerned,the ADDS Page messages can be considered the same as SMS messagesand are the only ADDS messages which impact the paging channel.
The ADDS Page information is located in the pmC_52 tables of thePerformance Management reports. Table 7-18 shows the peg countassociated with the ADDS Page feature.
Table 7-18: pmC_52 Record for ADDS Page
pmC_52 Date Start Interval End Interval OMC MM ADDS Page
record_num record_date start_of_int end_of_int OMC_id MM_id peg_count_20
52 3/12/99 18:00 18:30 2 5 7730
52 3/12/99 18:30 19:00 2 5 6592
7

Control Channel Determining Utilization – continued
June 2001 7-63CDMA SC Products System Resource Guide (CSSRG)
The ADDS Page is very similar to normal pages, where the informationin the Pages section would apply to this section as well. Therefore, theinformation on broadcast paging and location area paging in the Pagessection also applies here and therefore will not be repeated.
The ADDS Page message can vary from 2–15 half frames. There is alsotwo half frames sent on the paging channel for the base stationacknowledgement. Therefore the total range is 4–17 half frames. ThePCH_Util script uses the minimum value of four half frames.
Using Table 7-18 (assuming broadcast paging), a paging channel onBTS–18 sector two, carrier three for the half–hour is impacted by 7730 /4 = 1933 ADDS Page messages (assuming a four carrier system).Therefore, the percentage of the paging channel utilized for ADDS pagesis:
PCHUtiladds_page =
(2 + 2) 7730
1800
[EQ 7–16]= 4.296%*
4
The symbol � � means to round up the number to thenearest integer.
NOTE
If a measured average value of half frames sent for a particular system isknown, then the minimum value that the PCH_Util script uses can beadjusted to the meassured value. For example, if the measured averagevalue of half frames sent is seven half frames, the following calculationcan be made instead.
PCHUtiladds_page =
[EQ 7–17]= 9.665% (7 + 2) 7730
1800*
4
The symbol � � means to round up the number to thenearest integer.
NOTE
Message Waiting Notification Feature
Motorola offers a method of voice mail notification called MessageRetrieval Service, which only works within a Distributed MobileExchange (DMX) network. Starting with CDMA BSS Release 9, theMessage Waiting Notification (MWN) feature is available, whichprovides a voice mail notification method that will work for IS–41networks. The MWN messages can be delivered to the subscribers on thetraffic channel or paging channel. For traffic channel delivery, a Flashwith Information message is delivered to the subscriber. For paging
7

Control Channel Determining Utilization – continued
CDMA SC Products System Resource Guide (CSSRG) June 20017-64
channel delivery, a Feature Notification message is delivered to thesubscriber. For a control channel analysis, the Feature Notificationdelivery method is the only one that needs to be considered.
Feature Notification (PCH_UTIL Script: mwn_pch)
Feature Notification information is located in the pmC_52 tables of thePerformance Management reports. Table 7-19 shows the additional pegcounts associated with the Feature Notification messages.
Table 7-19: pmC_52 Record for Feature Notification
pmC_52 Date Start Interval End Interval OMC MM FeatureNotification
record_num record_date start_of_int end_of_int OMC_id MM_id peg_count_18
52 3/12/99 18:00 18:30 2 5 1648
52 3/12/99 18:30 19:00 2 5 1579
Referring back to Table 7–10, the Feature Notification and Base StationAck messages each require two half frames for a total of four halfframes. Using Table 7-19 (assuming broadcast paging), a paging channelon BTS–18 sector two, carrier three for the half–hour is impacted by1648 / 4 = 412 Feature Notification messages (assuming a four carriersystem). Therefore, the percentage of the paging channel utilized forFeature Notification is:
PCHUtilmwn_pch =
[EQ 7–18]= 0.916% (2 + 2) 1648
1800*
4
The symbol � � means to round up the number to thenearest integer.
NOTE
Authentication Feature
The Authentication Feature provides fraud protection to systemoperators. Authentication provides the ability to perform both UniqueChallenge and Shared Secret Data (SSD) Update operations on theCDMA traffic or control channels. Starting with CDMA BSS Release 9,new peg counts are provided to monitor the Authentication Featuremessaging on the control channels. There are two groups ofAuthentication messaging that impact the paging channel:
� Shared Secret Data Update
� Unique Challenge.
7

Control Channel Determining Utilization – continued
June 2001 7-65CDMA SC Products System Resource Guide (CSSRG)
Shared Secret Data Update (PCH_UTIL Script: upd_pch,upd_pch_ack)
There are two parts to an SSD update activity:
1. SSD Update Request (PCH_UTIL Script: upd_pch)
2. Base Station Challenge Response (PCH_UTIL Script:upd_pch_ack).
For the first part, the SSD Update Request information is located in thepmC_52 tables of the Performance Management reports. Table 7-20shows the additional peg counts associated with the SSD Updatemessages.
Table 7-20: pmC_52 Records for Shared Secret Data Update
pmC_52 Date StartInterval
End Interval OMC MM Slotted SSDUpdateRequest
Non–slotted
SSDUpdate
record_num record_date start_of_int end_of_int OMC_id MM_id peg_count_27
peg_count_28
52 3/12/99 18:00 18:30 2 5 280 0
52 3/12/99 18:30 19:00 2 5 257 0
Referring back to Table 7–10, the SSD Update and Base Station Ackmessages each require two half frames for a total of four half frames.Using Table 7-20 (assuming broadcast paging), a paging channel onBTS–18 sector two, carrier three for the half–hour is impacted by (280 +0) / 4 = 70 SSD Update messages (assuming a four carrier system).Therefore, the percentage of the paging channel utilized for SSD Updateis:
PCHUtilupd_pch = [EQ 7–19]= 0.156% (2 + 2) 280 + 0
1800*
4
The symbol � � means to round up the number to thenearest integer.
NOTE
For the second part of an SSD Update activity, the Base StationChallenge Response information is located in the pmC_20 tables of thePerformance Management reports. The pmC_20 report provides a breakdown of the data on a per–carrier basis. Table 7-21 shows the additionalpeg count associated with the Base Station Challenge message (the SSDUpdate Ack peg count is used to track the number of Base StationChallenges).
7

Control Channel Determining Utilization – continued
CDMA SC Products System Resource Guide (CSSRG) June 20017-66
Table 7-21: pmC_20 Records for Base Station Challenge
pmC_20 Date StartInterval
EndInterval
OMC MM BTS Id Sector Id Carrier SSDUpdate
Ack
record_num record_date start_of_int end_of_int OMC_id MM_id subj_id_1 subj_id_2 subj_id_
4
peg_count_
14
20 3/12/99 18:00 18:30 2 5 18 2 3 75
20 3/12/99 18:30 19:00 2 5 18 2 3 72
Referring back to Table 7–10, the Base Station Challenge and BaseStation Ack messages each require two half frames for a total of fourhalf frames. Using Table 7-21, a paging channel on BTS–18 sector two,carrier three for the half–hour is impacted by 75 SSD Update Ackmessages. Therefore, the percentage of the paging channel utilized forBase Station Challenges is:
PCHUtilupd_pch_ack = 75 [EQ 7–20]= 0.167% (2 + 2)
1800*
Unique Challenge (PCH_UTIL Script: chlg_pch)
The Unique Challenge information is located in the pmC_52 tables ofthe Performance Management reports. Table 7-22 shows the additionalpeg counts associated with the Unique Challenge messages.
Table 7-22: pmC_52 Records for Unique Challenge
pmC_52 Date StartInterval
End Interval OMC MM SlottedAuthen–ticationRequest
Non–slotted
Authen–ticationRequest
record_num record_date start_of_int end_of_int OMC_id MM_id peg_count_27
peg_count_28
52 3/12/99 18:00 18:30 2 5 344 0
52 3/12/99 18:30 19:00 2 5 329 0
Referring back to Table 7–10, the Unique Challenge and Base StationAck messages each require two half frames for a total of four halfframes. Using Table 7-22 (assuming broadcast paging), a paging channelon BTS–18 sector two, carrier three for the half–hour is impacted by(344 + 0) / 4 = 86 Unique Challenge messages (assuming a four carriersystem). Therefore, the percentage of the paging channel utilized forUnique Challenge is:
PCHUtilchlg_pch = [EQ 7–21]= 0.191% (2 + 2) 344 + 0
1800*
4
7

Control Channel Determining Utilization – continued
June 2001 7-67CDMA SC Products System Resource Guide (CSSRG)
The symbol � � means to round up the number to thenearest integer.
NOTE
Total Paging Channel Utilization
The total paging channel utilization is the sum of the various call modelcomponents described above, as illustrated in Table 7-23.
Table 7-23: Paging Channel Utilization
A B C D E
Scenario Half–framesper Scenario
Msgs perScenario
(half–hour)
Carriers Half-framesRequired
(Half-hour)
PCH Utilized
Overhead 13 1,800/1.28 – 18,282 10.16%
OriginationCompletions (moc)
4 111 – 444 0.25%
Origination Failures(mof)
4 3 – 12 0.01%
Pages 2 5,124 4 2,562 1.42%
TerminationCompletions (mtc)
4 89 – 356 0.20%
Registrations (reg) 4 263 – 1,052 0.58%
SMS/ADDS Page(adds_page)
9* 7,730 4 17,397 9.67%
Feature Notification(mwn_pch)
4 1,648 4 1,648 0.92%
SSD Update(upd_pch)
4 280 4 280 0.16%
Base StationChallenge
(upd_pch_ack)
4 75 – 300 0.17%
Unique Challenge(chlg_pch)
4 344 4 344 0.19%
Total 42,677 23.71%
NOTE* An adjusted value of seven half frames for data plus two for the ack is used.
7

Control Channel Determining Utilization – continued
CDMA SC Products System Resource Guide (CSSRG) June 20017-68
Where:
D = A * (B / C)[If there is no carrier listed in column C, C can be removed from the equation.]
E = [(A / 180,000) * (B / C)] * 100
= (D / 180,000) * 100
The “Carriers” column corresponds to the number ofpaging channels. Assume that each carrier has one pagingchannel. In a future release, it may be possible to havemore than one paging channel per carrier.
The maximum recommended aggregate utilizationpercentage for the paging channel is 70%.
NOTE
Determining Access ChannelUtilization
Access Channel Workload Model
The Access Channel (ACC) Workload Model is the basis of theACC_Util script. The following sections highlight what actions thescript performs and what the engineer is required to do in the absence ofthe script.
Calculate the number of access channel slots occurring in a specifiedtime duration to determine access channel utilization. Determine thenumber of slots occurring in a half-hour interval from the followingrelationship:
NumberSlotsHalfHour =
30 min * 60s * 1000ms min s
[EQ 7–22]
framesslot
[(1 + PamSz) + (3+ MaxCapSz)] 20msframe*
The previous equations shows that the size of each slot, in terms offrames, is dependent on the cell radius of the cell (PamSz is a function ofthe cell radius) where the access channel is located.
For example, a cell radius of 13 km has a PamSz of two frames (seeTable 7-8 ). If the MaxCapSz is set at three, the slot size is 9 frames (180ms). The number of slots occurring in a half-hour duration, in this case,is 10,000 (20,000 slots in an hour).
Using Equation [EQ 7–22], the total number of access channel slots perhour and per half–hour for the full range of PamSz frames is shown inTable 7-24 (assuming MaxCapSz is set to the default level of three).
7

Control Channel Determining Utilization – continued
June 2001 7-69CDMA SC Products System Resource Guide (CSSRG)
Table 7-24: Access Channel Slots per Hour/Half–hour versus PamSz
Slots per Hour Slots per half hour PamSz (frames)
25,714 12,857 0
22,500 11,250 1
20,000 10,000 2
18,000 9,000 3
16,363 8,181 4
15,000 7,500 5
13,846 6,923 6
12,857 6,428 7
12,000 6,000 8
11,250 5,625 9
10588 5,294 10
10,000 5,000 11
NOTEMaxCapSz = 3
The ACC_Util script assumes the sum of (1 + PamSz + 3 + MaxCapSz)is 12. The number of slots occurring in a half-hour, based on thisassumption, is 7,500.
If MaxCapSz is set to 6 in the CBSC, the IS-95 MaxCapSz is equivalentto three. Display MaxCapSz from the CBSC with one of the followingcommands:
display carrier–bts#–sector#–carrier# pachgen
display sector–bts#–sector# pachgen
display bts–bts# pachgen
The value displayed from the CBSC would be substituted for the 3 +MaxCapSz sum shown in Equation 7–22.
PamSz is derived from the cell radius parameter. If the displayed valueof the cell radius from the CBSC results in a PamSz of two, then theIS-95 PamSz would be equivalent to 1. The cell radius can be displayedfrom the CBSC with one of the following commands:
display carrier–bts#–sector#–carrier# secgen
display sector–bts#–sector# secgen
display bts–bts# secgen
From the cell radius, determine the PamSz by using the conversionprovided in Table 7-8. This converted value is substituted for the 1 +PamSz sum shown in Equation [EQ 7–22].
7

Control Channel Determining Utilization – continued
CDMA SC Products System Resource Guide (CSSRG) June 20017-70
A particular mobile may send a probe sent at the same time anothermobile sends its probe. In this case, the base station decodes:
1. One of the probes
2. Neither of these probes.
These phenomena are classified as blocking and collisions, respectively.If all mobiles were perfectly synchronized and could schedule eachother’s access attempts, the total number of accesses the base stationcould process would be 10,000 messages (with PamSz = 2 andMaxCapSz = 3) in a half-hour. Since blocking and collisions occur, thislimit is a theoretical upper bound that will never be reached. Traffic loadis the actual number of messages (probes) sent to the cell and throughputis the number of messages the cell decodes. For example, the results of astudy show that a traffic load of 0.3 msg/slot yields a throughput of 0.2msg/slot.
As the traffic load increases, the throughput peaks at apoint and then begins to decrease. This is because of theincreased occurrences of collisions. The peak is generallybetween 0.4 and 0.5 msg/slot in throughput.
NOTE
The messages occurring on the access channel can be obtained fromPerformance Management records. These messages are the throughputmessages. The basic calculation for determining the utilization is to sumall of the different access messages occurring in a specified time period(half-hour or one-hour period) and compare it to the theoretical upperbound:
ACCUtil =
∑ AccessMessagesHalfHour [EQ 7–23]
1 msgslot
* 100NumberSlotsHalfHour
In the previous example, 10,000 slots occurred in a half-hour period(with PamSz = 2 and MaxCapSz = 3). If one msg/slot is considered100% utilized, the engineer expects the peak throughput to occur whenthe utilization, as calculated above, reaches 40% to 50%.
The ACC_Util script assumes the number of slots in a half-hour to be7,500. So, if the sum of the PamSz and MaxCapSz parameters (asobtained from the CBSC) is less than 12 for a cell, the ACC_Util scriptwill overestimate the access channel utilization.
Each individual event needs to be addressed to formulate the ACCWorkload Model. This is illustrated in Table 7-25.
7

Control Channel Determining Utilization – continued
June 2001 7-71CDMA SC Products System Resource Guide (CSSRG)
Table 7-25: Access Channel Workload Model Scenarios
Scenario Message ACC_UtilScript Name
PM Report Data
Mobile OriginatedCompletions
Origination Message moc 10.3
Mobile Originated Failures Origination Message mof 10.1 – 10.3
Mobile TerminatedCompletions
Page Response mtc 10.7
Registrations Registration Message reg 10.8 + 10.9 + 10.10 +10.11 + 10.12 + 10.13 +
10.17 + 10.18
SMS/ADDS Page Mobile Station Ack Order adds_page_ack 10.19
Base Station Challenge SSD Update Conf/Rej Order upd_pch_ack 20.14
Unique Challenge Authentication Challenge chlg_pch_ack 20.15
Feature Notification Feature Notification Ack N/A* N/A*
NOTE* There is currently no peg counts available to track the Feature Notification acknowledgements.
Originations (ACC_Util Script: moc and mof)
As with the originations on the paging channel, the two originationscenarios that impact the access channel are:
� Mobile origination completions (peg_count_3)
� Mobile origination failures (peg_count_1 - peg_count_3).
Obtain the number of mobile origination completions and originationfailures quantities from the pmC_10 table for each carrier (refer toTable 7-12). The number of messages is the same as required for thepaging channel calculation.
For this portion of the ACC workload, the number of originationcompletion messages that BTS-18 sector two, carrier three received is111 for the half-hour. In addition, there are 114 - 111 = 3 originationfailures.
The percentage of the access channel utilized for originations is:
ACCUtilmoc = [EQ 7–24]
* 100111
10000= 1.11%
ACCUtilmof = [EQ 7–25]
* 1003
10000= 0.03%
Terminations (ACC_Util Script: mtc)
The number of termination messages impacting the ACC workload is thesame as the number of mobile terminated completions on the PCH. The
7

Control Channel Determining Utilization – continued
CDMA SC Products System Resource Guide (CSSRG) June 20017-72
number of page response messages for mobile–terminated completionscan be obtained from peg_count_7 of the pmC_10 table for each carrier(refer to Table 7-16).
For this portion of the ACC workload, the number of page responsemessages received by BTS-18 sector two, carrier three received is 89 forthe half-hour (refer to the Pages (PCH–Util Script:page section).
The percentage of the access channel utilized for terminations is:
ACCUtilmtc = [EQ 7–26]
* 10089
10000= 0.89%
Registration (ACC_Util Script: reg)
The number of registrations messages impacting the ACC and the PCHare the same. Obtain the number of registration messages frompeg_count_8 + peg_count_9 + peg_count_10 + peg_count_11 +peg_count_12 + peg_count_13 + peg_count_17 + peg_count_18 of thepmC_10 table for each carrier.
A paging channel on BTS-18 sector two, carrier three has 263 (29 + 234)registration messages in the half-hour.
The percentage of the access channel utilized for registrations is:
ACCUtilreg = [EQ 7–27]
* 100263
10000= 2.63%
SMS – Prior to R9
Calculations from the paging channel on SMS are used again for theaccess channel. Refer to Equation [EQ 7–13] .
The number of page acks for BTS-18 sector two, carrier three in the busyhour was 181 (89 + 92). If the total number of acks for the system was240,000 acks, the SMS acks at this paging channel is 1.88 responses(181/240,000 * 2500) in an hour or 0.94 responses in a half-hour.
The percentage of the access channel used for SMS is:
ACCUtilSMS = [EQ 7–28]
* 1001
10000= 0.01%
SMS/ADDS Page – Post R9 (ACC_Util Script:adds_page_ack)
The number of SMS or ADDS Page Response messages impacting theACC workload is obtained from peg_count_19 from the pmC_10 tablefor each carrier (refer to Table 7-26).
7

Control Channel Determining Utilization – continued
June 2001 7-73CDMA SC Products System Resource Guide (CSSRG)
Table 7-26: pmC_10 Records for ADDS Page Ack
pmC_10 Date StartInterval
EndInterval
OMC MM BTS Id Sector Id Carrier ADDSPage Ack –
ACH
record_num record_date start_of_int end_of_int OMC_id MM_id subj_id_1 subj_id_2 subj_id_
3
peg_count_
19
10 3/12/99 18:00 18:30 2 5 18 2 3 193
10 3/12/99 18:30 19:00 2 5 18 2 3 164
For this portion of the ACC workload, the number of ADDS PageResponse messages received by BTS–18 sector two, carrier threereceived is 193 for the half–hour.
The percentage of the access channel utilized for ADDS Page Responsesis:
ACCUtiladds_page_ack = * 100 [EQ 7–29]= 1.93%193
10000
Base Station Challenge (ACC_Util Script: upd_pch_ack)
The number of SSD Update Order messages impacting the ACCworkload is the same as the number of SSD Update Ack (upd_pch_ack)messages impacting the PCH. The number of SSD Update Ack messagesis obtained from peg_count_14 from the pmC_20 table for each carrier(refer to Table 7-21).
For this portion of the ACC workload, the number of SSD Update Ordermessages received by BTS–18, sector two, carrier three received is 75for the half–hour.
The percentage of the access channel utilized for SSD Update Orders is:
ACCUtilupd_pch_ack = * 100 [EQ 7–30]= 0.75%75
10000
Unique Challenge (ACC_Util Script: chlg_page_ack)
The number of Authentication Challenge Response messages fromUnique Challenges, which impact the ACC workload is obtained frompeg_count_15 from the pmC_20 table for each carrier (refer toTable 7-27).
Table 7-27: pmC_20 Records for Authentication Acknowledgements
pmC_20 Date StartInterval
EndInterval
OMC MM BTS Id Sector Id Carrier Authen.Acks
record_num record_date start_of_int end_of_int OMC_id MM_id subj_id_1 subj_id_2 subj_id_
4
peg_count_
15
20 3/12/99 18:00 18:30 2 5 18 2 3 85
20 3/12/99 18:30 19:00 2 5 18 2 3 83
7
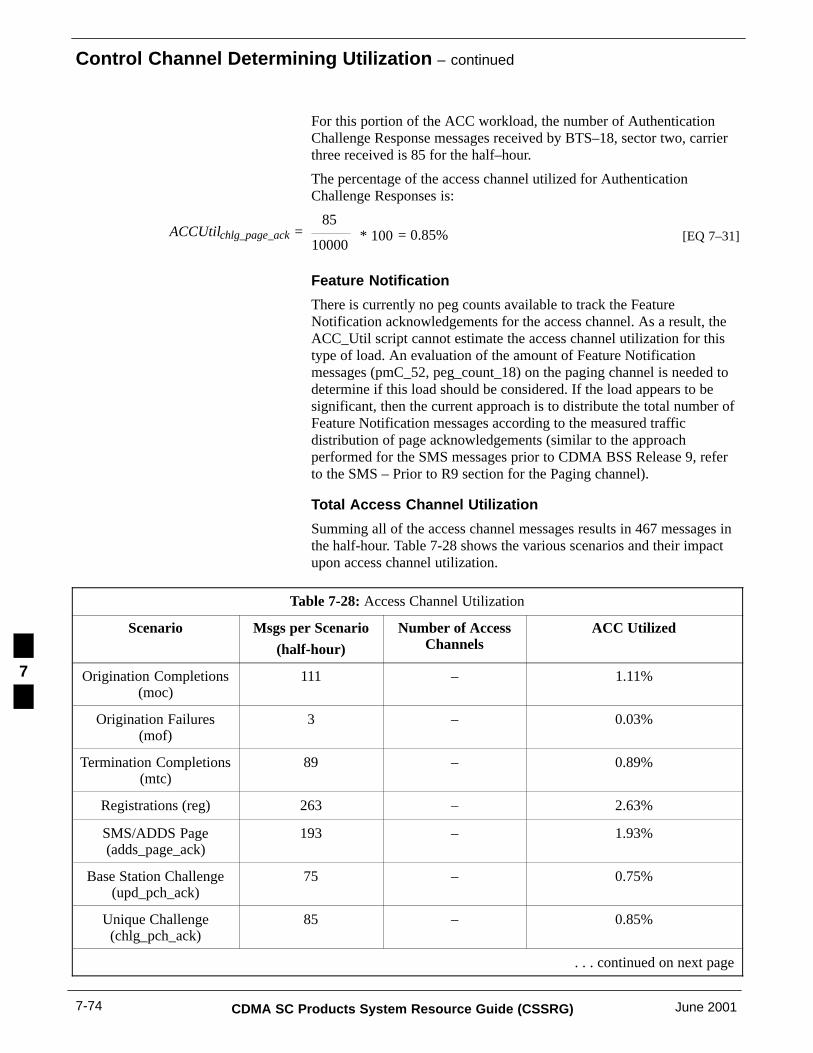
Control Channel Determining Utilization – continued
CDMA SC Products System Resource Guide (CSSRG) June 20017-74
For this portion of the ACC workload, the number of AuthenticationChallenge Response messages received by BTS–18, sector two, carrierthree received is 85 for the half–hour.
The percentage of the access channel utilized for AuthenticationChallenge Responses is:
ACCUtilchlg_page_ack =
* 100 [EQ 7–31]= 0.85%85
10000
Feature Notification
There is currently no peg counts available to track the FeatureNotification acknowledgements for the access channel. As a result, theACC_Util script cannot estimate the access channel utilization for thistype of load. An evaluation of the amount of Feature Notificationmessages (pmC_52, peg_count_18) on the paging channel is needed todetermine if this load should be considered. If the load appears to besignificant, then the current approach is to distribute the total number ofFeature Notification messages according to the measured trafficdistribution of page acknowledgements (similar to the approachperformed for the SMS messages prior to CDMA BSS Release 9, referto the SMS – Prior to R9 section for the Paging channel).
Total Access Channel Utilization
Summing all of the access channel messages results in 467 messages inthe half-hour. Table 7-28 shows the various scenarios and their impactupon access channel utilization.
Table 7-28: Access Channel Utilization
Scenario Msgs per Scenario
(half-hour)
Number of AccessChannels
ACC Utilized
Origination Completions(moc)
111 – 1.11%
Origination Failures(mof)
3 – 0.03%
Termination Completions(mtc)
89 – 0.89%
Registrations (reg) 263 – 2.63%
SMS/ADDS Page(adds_page_ack)
193 – 1.93%
Base Station Challenge(upd_pch_ack)
75 – 0.75%
Unique Challenge(chlg_pch_ack)
85 – 0.85%
. . . continued on next page
7

Control Channel Determining Utilization – continued
June 2001 7-75CDMA SC Products System Resource Guide (CSSRG)
Table 7-28: Access Channel Utilization
Scenario ACC UtilizedNumber of AccessChannels
Msgs per Scenario
(half-hour)
Feature Notification – – –
Total 819 – 8.19%
This example assumes:
PamSz = 2
MaxCapSz = 3
Then:
From Equation [EQ 7–22], NumberSlotsHalfHour = 10,000
From Equation [EQ 7–23] AccUtil = AccMsgs/100
Assume each carrier has one access channel. In a futurerelease, it may be possible to have more than one accesschannel per carrier.
Typically, the largest contributor to the utilization of theaccess channel involves registrations. Access channels witha utilization of 40% are considered to be at the maximumlevel.
NOTE
Paging and Access Channel Monitoring at MSC
Paging Load Indicator (PLI) is a purchasable feature on theEMX2500/5000. It allows the operator to evaluate the performance of thepaging facility by gathering statistics on the number of different types ofpages and page acknowledgments. The Report EMX Page MMIcommand is as follows:
REPORT EMX PAGE (Requires the PLI feature)
This MMI enables the operator to obtain an online display of the EMXPLI statistics. The PLI statistics included under this MMI are:
� Originating Page Attempts
� Non-Originating Page Attempts
� Page Acks
� Repage Acks
� Late Page Acks
� CCS Pages and Repages
� CCS Page and Repage Acks
� Search Requests
7

Control Channel Determining Utilization – continued
CDMA SC Products System Resource Guide (CSSRG) June 20017-76
� Search Successes.
The Report Paging Area MMI command is as follows:
REPORT PAGING AREA
If the paging load indicator feature has not been purchased, the outputdisplays the following data according to paging area:
� Total Pages
� Number of Successful Pages
� Number of Successful Repages.
If the Paging Load Indicator feature has been purchased, the pages arebroken down into further detail:
� LKA Pages
� LKA Repages
� LKA Page Acks
� LKA Repage Acks
� CCS Pages
� CCS Repages
� CCS Page Acks
� CCS Repage Acks
� Two Word Pages
� Neighbor Pages
� Neighbor Repages
� Neighbor Page Acks
� Neighbor Repage Acks
� Unsolicited Page Acks
� Unsolicited Page Acks - No Neighbor
� Unsolicited Page Acks - Successful and High Water Mark of pages.
Determine Present Status
For each time measurement period, record data points comparing thepaging and access channel utilization versus call model parameters. Ifusing a spreadsheet, create a column for each call model scenario and thecalculated utilization. The rows represent the set of values for eachmeasurement period of a given BTS-sector-carrier.
In determining the present status, validate data to ensure its integrity.Investigate partial data or anomalous data and eliminate it from theanalysis. Remove any data that represents an abnormal traffic period notconsidered part of the normal traffic environment.
The next item to consider is establishing the control channel utilizationplanning and maximum limits (see the following section on PlanningLimits). Use these limits to define category regions to represent a
7

Control Channel Determining Utilization – continued
June 2001 7-77CDMA SC Products System Resource Guide (CSSRG)
stoplight level of urgency. The green region represents a low-level ofurgency, where the control channel utilization ranges from a low level upto the planning limit. The yellow region represents a moderate-level ofurgency with the control channel utilization, ranging from the planninglimit to the maximum limit. Finally, the red region represents ahigh-level of urgency with the control channel utilization being greaterthan the maximum limit. Apply these category regions to the BouncingDay Bouncing Busy Hour (BDBBH) utilization data and analyze it on aweekly basis. Monitoring the control channel utilization data in thisfashion can simplify the notification of potential problem areas.
After the data has been validated, analyze the four week average ofBDBBH data for each sector (on a per-carrier basis for systems withmultiple carriers) to identify any sectors exceeding any of the controlchannel planning or maximum limits. If one or more sectors exceed thecontrol channel planning or maximum limits, monitor the BBHperformance statistics trend for those cells/sectors to determine if there isan increase in performance degradation occurring as a result of elevatedBBH control channel usage. It is at this point where an evaluation reviewof the planning and maximum limits may be necessary. The reviewdetermines if adjustments need to be made to either of these limits tobetter reflect the desired performance, capacity, or service providerdesired results.
Regardless of the performance statistics results, investigate options forthose cells/sectors exceeding the limits and determine if a controlchannel management plan is required. The objective of control channelmanagement planning is to implement relief mechanisms before aperformance degradation actually occurs. Therefore, the existence ofperformance degradation should not be a prerequisite for determining orimplementing an control channel management plan. Use the existence ofperformance degradation to increase the priority of implementing therelief options to those cells/sectors exhibiting the performancedegradation. If the analysis of the present status contains severalsites/sectors which exceed the maximum limit but do not reflect anyperformance degradation, those sites should be next on the priority listfor implementing relief options.
Choosing the appropriate relief plan, with respect to a BTS sector-carrierlevel, depends upon many different factors. Some factors include:
� Service provider inputs and requests
� Cost of implementation
� Market size
� Terrain
� The design of the system
� Rate of market growth
� The number and location of the sites/sectors which exceed theplanning or maximum limit.
It is up to the system designer to effectively choose control channelmanagement options to create a relief plan that best fits the particularsituation.
7
Control Channel Planning Limits
CDMA SC Products System Resource Guide (CSSRG) June 20017-78
Introduction
Control Channel Planning Limits are determined by evaluating severallimits, identifying any bottlenecks, and then applying the remedies thatalleviate those bottlenecks. This topic describes the limits, bottlenecks,and remedies that the engineer can expect to encounter.
Planning LimitRecommendations
A paging channel utilization of 70% is considered to be a typicalmaximum level with 55% representing the planning limit (equivalent toapproximately 80% of maximum level). A typical maximum accesschannel utilization is 40% with 30% representing the access channelutilization planning limit.
Forecast Utilization
There are several different strategies used to forecast control channelutilization. Each of them has different merits. The marketingdepartments of cellular operators typically project future growth throughsubscriber projections. Use these projections as the baseline parameter togauge future system utilization. Ultimately, for control channel planning,a forecasted number of messages is required. This is the number ofmessages to be transmitted over the control channels on aper-cell/sector/carrier basis. If the service provider’s marketingdepartment provides the Systems Engineer with subscriber projections,the following procedure can be used to forecast control channelutilization on a per-cell/sector/carrier basis.
To forecast the paging and access channel utilization, the engineershould not sum all of the messages together to generate one totalutilization value for each sector-carrier. If such summing is done, theengineer loses the insight as to which component has the most impactupon utilization. In performing any relief measures, focus on thescenario with the best chance of relieving the situation.
Another purpose of keeping the items separate is to determine the impactof making a change to a system parameter. For instance, consider asituation where registrations occur every hour. What is the impact ifregistrations are made every fifteen minutes instead? In the later case, theengineer inflates the hour registration data four times over the formercase and then determines its impact upon the total paging channelutilization. With this in mind, a spreadsheet can be created to keep trackof the information and to also aid in a forecast for the future.
Collect the following data:
� BTS id, Sector, Carrier
� Number of Mobile Originated Completions (pmC10 peg count 3)
� Number of Mobile Originated Failures (difference of pmC10 pegcount 1 and 3)
7

Control Channel Planning Limits – continued
June 2001 7-79CDMA SC Products System Resource Guide (CSSRG)
� Number of Mobile Terminated Completions (pmC10 peg count 7)
� Number of Pages (the sum of pmC52 peg counts 1 and 2)
� Number of Registrations (the sum of pmC10 peg counts 8, 9, 10, 11,12, 13, 17 and 18)
� Number of SMS/ADDS Page Messages (pmC52 peg count 20)
� Number of Feature Notification Messages (pmC52 peg count 18)
� Number of SSD Update Messages (the sum of pmC52 peg counts 27and 28)
� Number of BS Challenge Confirm Orders (pmC20 peg count 14)
� Number of Authentication Challenge Messages (the sum of pmC52peg counts 29 and 30)
� Number of ADDS Page Mobile Station Ack Orders (pmC10 peg count19)
� Number of Authentication Challenge Responses (pmC20 peg count15).
Compute the following data:
� Paging channel utilization for mobile originated completions
� Paging channel utilization for mobile originated failures
� Paging channel utilization for mobile terminated completions
� Paging channel utilization for pages
� Paging channel utilization for registrations
� Paging channel utilization for SMS/ADDS Pages
� Paging channel utilization for Feature Notifications
� Paging channel utilization for SSD Updates
� Paging channel utilization for Base Station Challenges
� Paging channel utilization for Unique Challenges
� Total paging channel utilization
� Access channel utilization for mobile originated completions
� Access channel utilization for mobile originated failures
� Access channel utilization for mobile terminated completions
� Access channel utilization for registrations
� Access channel utilization for SMS/ADDS Pages
� Access channel utilization for Base Station Challenges
� Access channel utilization for Unique Challenges
� Access channel utilization for Feature Notifications (if significant)
� Total access channel utilization.
To project an increase to the level of paging or access channel utilizationdue to an increase in the number of subscribers, scale the data (exceptthe amount due to the paging channel overhead) by the ratio of projectedsubs for the system to the current subs for the system:
7

Control Channel Planning Limits – continued
CDMA SC Products System Resource Guide (CSSRG) June 20017-80
GrowthFactor(GF) = [EQ 7–32]
ProjectedSubs
CurrentSubs
ProjectedValue = [EQ 7–33]
GF * CurrentValue
Assume:
Current number of subscribers: 420,000
Projected number of subscribers: 700,000
Current number of pages: 5,124
Then:
GF = 700,000
420,000= 1.666666
ProjectedNumberOfPages = 1.6667 * 5,124 = 8,557
If subscriber growth estimates are provided on a monthly basis, repeatthe calculations for each month where a subscriber growth estimate isprovided. Using a monthly analysis, perform an estimate of when aparticular cell or sector will exceed the planning or maximum limit.
To understand how the simple growth of the subscriber base affects thepaging channel, each of the events, listed in Table 7-23, (exceptoverhead messaging) needs to be scaled up, as shown in Table 7-29.
Table 7-29: Projected Paging Channel Utilization
A B C D E F
Scenario
Half–framesper Scenario
Msgs perScenario
(half–hour)
GrowthFactor of
1.67
Carriers Half-framesRequired
(Half-hour)
PCHUtilized
Overhead 13 1800/1.28 1800/1.28 a – 18,282 10.16%
OriginationCompletions (moc)
4 111 186 – 744 0.41%
Origination Failures(mof)
4 3 5 – 20 0.01%
Pages 2 5,124 8,557 4 4,280 2.38%
TerminationCompletions (mtc)
4 89 149 – 596 0.33%
Registrations (reg) 4 263 439 – 1,756 0.98%
SMS/ADDS Page(adds_page)
9 7,730 12,909 4 29,052 16.14%
Feature Notification(mwn_pch)
4 1,648 2,752 4 2,752 1.53%
. . . continued on next page
7

Control Channel Planning Limits – continued
June 2001 7-81CDMA SC Products System Resource Guide (CSSRG)
Table 7-29: Projected Paging Channel Utilization
Scenario
PCHUtilized
Half-framesRequired
(Half-hour)
CarriersGrowthFactor of
1.67
Msgs perScenario
(half–hour)
Half–framesper Scenario
SSD Update(upd_pch)
4 280 468 4 468 0.26%
Base StationChallenge
(upd_pch_ack)
4 75 125 – 500 0.28%
Unique Challenge(chlg_pch)
4 344 574 4 574 0.32%
Total 59,024 32.79%
NOTEa. The amount of overhead messages does not change due to an increase in the number of subscribers.
Where:
C = B * 1.67
E = A * (C / D)
F = [(A / 180,000) * (C / D)] * 100
= (E / 180,000) * 100
For a quick calculation for the total paging channel utilization, theengineer can scale the paging channel utilization directly and not scalethe number of half-frames. The paging channel utilization for theoverhead messages (10.16%) is not to be increased though. Use thefollowing equation to project a new total paging channel utilizationbased on a projected subscriber growth:
(CurrentUtilization–Overhead) [EQ 7–34]
ProjectedSubs
CurrentSubs* + Overhead = ProjectedUtilization
To understand how the simple growth of the subscriber base affects theaccess channel, each of the events, listed in Table 7-28, needs to bescaled up (as shown in Table 7-30).
7

Control Channel Planning Limits – continued
CDMA SC Products System Resource Guide (CSSRG) June 20017-82
Table 7-30: Projected Access Channel Utilization
A B C D
Scenario
Msgs perScenario
(half-hour)
Growth Factor of1.67
Number ofAccess
Channels
ACC Utilized
OriginationCompletions (moc)
111 186 – 1.86%
Origination Failures(mof)
3 5 – 0.05%
TerminationCompletions (mtc)
89 149 – 1.49%
Registrations (reg) 263 439 – 4.39%
SMS/ADDS Page(adds_page_ack)
193 322 – 3.22%
Base StationChallenge
(upd_pch_ack)
75 125 – 1.25%
Unique Challenge(chlg_pch)
85 142 – 1.42%
Feature Notification – – – –
Total 819 1,368 – 13.68%
This example assumes:
PamSz = 2
MaxCapSz = 3
Then:
From Equation [EQ 7–22]: NumberSlotsHalfHour = 10,000
From Equation [EQ 7–23]: AccUtil = AccMsgs/100
D = (A * 1.67) / 100
D = B / 100
Assume each carrier has one access channel. In a futurerelease, it may be possible to have more than one accesschannel per carrier.
NOTE
For a quick calculation for the total access channel utilization, theengineer can scale the access channel utilization directly and not scalethe number of messages. Use the following equation to project a new
7

Control Channel Planning Limits – continued
June 2001 7-83CDMA SC Products System Resource Guide (CSSRG)
total access channel utilization based on a projected subscriber growth:
(CurrentUtilization) [EQ 7–35]
ProjectedSubs
CurrentSubs* = ProjectedUtilization
For the messages per scenario used for the paging and access channelutilization calculations, use a four week average of the Busy DayBouncing Busy Hour (BDBBH) data for each sector/carrier. From thisdata, calculate the standard deviation (one–sigma) for this four weekaverage. Using the one–sigma result, calculate an average plusthree–sigma value for the messages per scenario data. The growth factoris then applied to both an average value and a three–sigma averagevalue. The desired result is to forecast an average utilization and athree–sigma average utilization based upon the BDBBH data.
Use a graph showing the estimated utilization versus the growth oftraffic for the average and upper three–sigma curve, including thebaseline traffic values and the maximum specified limit, as a visual aidto identify when the paging and access channels will run out of capacity.
If the service provider’s marketing department provides the SystemsEngineer with something other than subscriber projections, makemodifications to the above approach to project a linear relationshipaccording to the service provider–supplied projection parameter. If theservice provider requires a non-linear growth projection, modificationsto the above approach are dependent upon the specified non-lineargrowth projection requirements. For example, the service provider mayspecify a variable subscriber growth rate along with a change to howoften registrations occur. In either case, the desired outcome is to projectan average BDBBH paging and access channel utilization and athree-sigma average BDBBH paging and access channel utilization foreach cell/sector on a per-carrier basis.
Make adjustments to the forecasting utilization process when judgedappropriate. For instance, if a larger statistical data sample is desired,more than four BBH data points can be used for the calculation of themonthly average and the standard deviation. Using additional datacaptured during less busy days of the week reduces the overall averageand provides a less conservative prediction. Also, use a differentmultiplication factor other than three for the standard deviationmultiplier. Using a lower multiplier (X) for the X-sigma averagecalculation also provides a less conservative prediction. Make severaladjustments to the above process, depending upon the level ofconservatism desired.
It is not only the increase in the number of subscribers that can have animpact upon the paging and access channel utilization. Various changesto the system can impact the number of messages carried by the pagingand access channels. The following examples of changes to the systemrequire the engineer to consider the impact to the control channels:
� Addition of a CBSC (if each CBSC has its own paging zone)
� Addition of a carrier
7

Control Channel Planning Limits – continued
CDMA SC Products System Resource Guide (CSSRG) June 20017-84
� Reparenting a cell from one CBSC to a different CBSC
� Change in when registrations occur
� Change to where pages are sent and if repages are sent
� Change to SMS that impacts the number of messages sent or length ofmessage
� Change to the average number of completions per user.
Identify Network ElementsExceeding Limits
Once the ACH and PCH utilization has been forecasted on aper-cell/sector, per-carrier basis, it is time to again identify (on aBTS-level) any sectors exceeding either of the control channel planningor maximum limits. Establish the planning limit and the maximum limitinto category regions which represent a stoplight level of urgency. Applythis to the forecasted control channel utilization data (for both averageand three-sigma values) and analyze it. The green region represents alow-level of urgency, with the control channel utilization ranging fromlow utilization up to the planning limit. The yellow region represents amoderate-level of urgency, with the control channel utilization rangingfrom the planning limit to the maximum limit. Finally, the red regionrepresents a high-level of urgency, with the control channel utilizationbeing greater than the maximum limit.
The recommendation is to plan on implementing a control channelcapacity relief mechanism before it is projected to reach the planninglimit using the average utilization projection or the maximum limit usingthe three–sigma average utilization projection (whichever one isprojected to occur first).
7

Control Channel Symptoms of Resource Overload
June 2001 7-85CDMA SC Products System Resource Guide (CSSRG)
Introduction
As a cell site approaches its maximum paging or access channel capacitylimit, the primary symptom of resource overload is a degradation inaccess performance. There are two sources of data where access failureperformance can be measured:
� Performance Management (PM) peg counts
� Call Failure Class (CFC) peg counts from Call Detail Logs (CDLs).
Ideally, it is recommended to separately monitor and trend theorigination and termination failure performance on aper–BTS/sector/carrier level during the busy hour of each cell site.
Performance Management (PM) peg counts
For the PM peg counts, the following origination and termination failurerates can be calculated using data from the pmC_10 table.
Orig Fail % = [(10.1 – 10.3) / 10.1] * 100
Term Fail % = [(10.4 + 10.5 – 10.7) / (10.4 + 10.5)] * 100
Where:
10.1 is Origination Attempts
10.3 is Origination Assignment Completes
10.4 is Termination Attempts – Slotted
10.5 is Termination Attempts – Non–slotted
10.7 is Termination Assignment Completes.
The performance calculations above should be recorded and trended on adaily basis. An analysis of the busy hour for each cell site is preferred,but an analysis of a full days worth of data can be performed as well. Adegradation in the origination failure rate and/or the terminnation failurerate may be an indication of an overload condition of the paging and/oraccess channel.
Call Failure Class (CFC) peg counts
For the CFC peg counts from the Call Detail Logs, the primary CFCs tomonitor are as follows:
� CFC 5 – No TCH Preamble Detected
� CFC 9 – No Valid Speech from MS During Call Setup
� CFC 13 – CP Timeout Awaiting Service Option Ack.
The PM peg count data is preferred over the CFC data, because it iseasier to post process the PM peg count data to achieve the desiredorigination and termination failure performance data on aper–BTS/sector/carrier level.
7

Control Channel Reducing Utilization/Capacity Improvement
CDMA SC Products System Resource Guide (CSSRG) June 20017-86
Introduction
The engineer can reduce Control Channel utilization and improve systemcapacity by developing a Control Channel capacity management plan toaddress all of the issues identified in the Control Channel PlanningLimits section.
Evaluate Relief Alternatives
Some reasons why the paging or access channels may have reached theirlimits include:
� Suboptimal traffic distribution across network elements
� Higher-than-expected traffic intensities for certain traffic componentsthan were originally expected
� Non-optimum configuration of the network with respect to paging andregistration boundaries
� Faulty equipment or inappropriate parameter settings.
Example relief measures include the:
� Addition of paging/access channels through additional carriers (oreventually multiple paging/access channels on a single carrier)
� Re-definition of paging area boundaries
� Re-definition of registration zones
� Implementation of zone–based paging (if the system currently has abroadcast paging scheme implemented).
Prior to implementing any relief measures, the system designer shouldbe knowledgeable with respect to the characteristics of the system. Thesecharacteristics ultimately have an impact upon the paging and accesschannels.
Determine System Characteristics
To properly evaluate the various relief alternatives that might be feasible,the System Engineer needs to analyze various system characteristics thataffect the paging or access channel utilization. The purpose of thisanalysis is to characterize the performance and configuration design ofthe system to identify a non–optimum configuration. To characterize theperformance, break down the total utilization into smaller componentsand analyze the individual events that utilize the channel (similar to apareto analysis).
If an individual event (for example, registrations) is dominating theutilization of either the paging or access channel, focus on identifying anon–optimum configuration which may contribute to the load of thedominant event. If a non–optimum configuration is identified,implement a relief alternative targeted at reducing the dominant event.To further analyze the system, characterize the following:
� Page Success Rate
7
Control Channel Reducing Utilization/Capacity Improvement – continued
June 2001 7-87CDMA SC Products System Resource Guide (CSSRG)
� Re–Page Success Rate
� Neighbor Page Success Rate
� Special Paging Zones.
The following sections provide some additional insight at characterizingthe above.
Page Success Rate
The page success rate corresponds to the ratio of the acknowledgmentsof the original pages to the number of original pages. Original pages aresent to the last known paging area where the mobile successfullyregistered. Unacknowledged pages indicate mobiles that:
� Are in bad coverage areas within the paging area
� Are turned off (if power-down de-registration is not available)
� Have left the paging area and unsuccessfully registered.
Additionally, if a neighboring paging area has the same registration zoneas the current paging area, the mobiles may move into the neighborwithout registering. Therefore, some of the unacknowledged pages to thecurrent paging area can be attributed to a registration zone that does notmatch the Paging Area Location.
Re-Page Success Rate
The re-page success rate corresponds to the number of re-pageacknowledgments to the number of re-pages. Re-page is a feature of theEMX. Here, the Max Slot Cycle Index needs to be verified as non-zero.If the Max Slot Cycle Index is 0, the BTS uses the QREPEAT found inBTS PACHGEN.
Neighbor Page Success Rate
The neighbor page success rate corresponds to the number of neighborpage acknowledgments to the number of neighbor pages. Thisinformation helps to determine the number of mobiles in the wrongpaging area. The number of mobiles saved by this feature needs to becompared to the amount of excess pages required to implement thefeature. If only 1% of the mobiles are saved but the paging load goesfrom 40% to 80%, re-paging neighbors may cause more problems than itfixes.
Special Paging Zones
Details concerning any special paging zones that currently exist in thesystem should be understood. These special paging zones could be in thesystem due to subways/trains, registration boundaries, or pockets ofsingle carrier sites surrounded by multi-carrier sites.
Paging and Access Channel Capacity Management Options
The effects of adding carriers and the changing of paging areaboundaries on the events utilizing the paging channel are two reliefmeasures to be considered.
7

Control Channel Reducing Utilization/Capacity Improvement – continued
CDMA SC Products System Resource Guide (CSSRG) June 20017-88
Paging channel utilization problems may appear for only a few sites in apaging area or for an entire paging area. This depends on how even thecarriers (paging channels) are distributed across the paging area. If, forexample, there is a one carrier (one paging channel) site in a paging areaand the rest of the sites in that paging area are all four carrier (fourpaging channels), the one carrier site has a load approximately four timesthat of all the others.
The means to reduce a paging channel load are to:
1. Increase the number of paging channels for that sector.
2. Reduce the size of the paging area that the site is located (reducenumber of pages).
3. Reduce the number of unnecessary pages to that paging area.
4. Reduce the number of registrations for that sector.
5. Reduce the number of SMS messages or the size of these messages.
Increasing the number of paging channels for that sector has the greatesteffect when going from one to two paging channels. This increases theavailable resources 100%. When going from four to five pagingchannels, the increase is only 25%.
Reducing the size of the paging area where the site is located will createmore paging area boundaries. Placing a paging area boundary wheremany mobiles frequently cross back and forth will have adverse affectson the access channel.
Reducing the number of unnecessary pages to that paging area can beachieved by looking at the EMX re-page statistics and evaluatingwhether or not it is performing optimally. If the EMX is contributing30% of the pages to a neighbor paging area but only receives a handfulof acknowledgments for those pages, this neighbor page setting iscausing more problems than it is solving and, therefore, should beredefined.
Access channel utilization problems may appear for only a few sites in apaging area or for an entire paging area. This depends on how even thecarriers (access channels) are distributed across the paging area. If, forexample, there is a one carrier (one access channel) site in a paging areaand the rest of the sites in that paging area are all four carrier (fouraccess channels), then the one carrier site will have a load approximatelyfour times that of all the others.
The means to reduce the access channel load are to:
� Increase the number of access channels for that sector
� Reduce the number of registrations for that sector
� Reduce the number of pages for that sector
� Increase the sectorization for the site.
Again, examine the control channels (paging and access) in terms of theevents that utilize the channel, keeping in mind the means to reducingthe load.
7

Control Channel Reducing Utilization/Capacity Improvement – continued
June 2001 7-89CDMA SC Products System Resource Guide (CSSRG)
Carrier Addition
Address the addition of carriers, and subsequently a paging and accesschannel, by using the same method mentioned previously.
For example, the section Pages: (PCH–Util Script: page) showedBTS-18 having 5,124 pages in a half-hour. The BTS has four carriers inthe sector and therefore each paging channel carries 1,281 pages. If anadditional carrier is added to this site, the sector now has an additionalcarrier with a paging channel. Each paging channel now carries 1,025pages.
From Table 7-16, a paging channel on BTS-18 sector two, carrier three isimpacted by 91 completed mobile assignments (peg_count_7) in thebusy half-hour. The other three carriers have mobile–completedassignment values of 60, 59, and 87. The total of all four carriers is 297.Assuming nothing else changes except for adding an additional carrierand that the completed mobile assignments are distributed equally acrossthe five carriers, each carrier has 60 completed mobile assignments.
The four–carrier data does not show an equal distributionof completions and therefore the engineer can multiplyeach of the four carrier’s value by 4/5. The fifth carrier isthen the difference between 297 and the sum of theadjusted carriers’ value.
NOTE
297 – 4 =5
91 + 60 + 87+ 5945
45
45
297 – [73 + 48 + 47 + 70] = 59
The total number of half-frames required on BTS-18 sector two, carrierthree for the half-hour is:
Base Station Ack Order 60 * 2 = 120
Channel Assignment Msg. 60 * 2 = 120
General Page Msg. 1,025 * 2 = 2,050
2,290 half-frames
Therefore, the utilization of the paging channel for terminations is now1.27%. That is down from 1.62% using four carriers.
This example only demonstrates one scenario for the paging channel. Byadding an additional carrier, the mobile origination completions andfailures, registrations and SMS messages are also impacted in the sameway. This holds true for both the paging and access channels.
7

Control Channel Reducing Utilization/Capacity Improvement – continued
CDMA SC Products System Resource Guide (CSSRG) June 20017-90
Paging Area Re-Definitions
Changing the paging area boundary involves predicting the paging loadfor the redefined paging area(s) or CBSC. Therefore, the characteristicsof each of the existing paging areas must be understood. Thesecharacteristics include:
� Page success rate
� Re-page success rate
� Neighbor page success rate.
The EMX paging configuration as well as the CBSC’s pagingconfiguration must also be defined. The predicted paging load can thenbe used in determining the paging channel utilization.
Determining the number of registrations between two sectors, that havenever been boundary sectors in the past, is difficult. The difficulty comesfrom the fact that the mobiles are in the idle state. Within a paging area,if an idle mobile travels from one site to another, the system does notkeep track of this.
Special Paging Zones
Subways, registration boundaries, and pockets of single carrier sitessurrounded by multi-carrier sites may be candidates for special pagingzones. Special paging areas are established to either reduce the numberof pages sent to that area or to establish overlap between registrationzones.
One special type of a paging zone is an imbedded paging area. The intentof this paging zone is to reduce the number of pages sent to these areas.These areas typically have single carrier sites surrounded by multi-carriersites. Currently, there is only one paging channel per carrier. All siteswithin a particular paging area are required to send the same number ofpages. The multiple-carrier sites have the advantage of multiple pagingchannels (there is a paging channel for each carrier frequency). Thepages are distributed among the multiple carriers by means of a hashingalgorithm. When a one carrier site is in a paging area containing siteswith, for example, four carriers, the one–carrier site has four times thepaging load of the four–carrier sites (assuming each carrier has a separatepaging channel).
One approach to alleviate the paging load on these single carrier sites isto establish a special paging area within the main paging area. Thesesites have a different Location Area Code (LAC) but the sameregistration zone as the main paging area. The EMX is then configuredfor Re-page Your Neighbor, specifying this special paging area as aneighbor to the main paging area. This configuration reduces the numberof pages sent to this area to the number of unacknowledged pages sent tothe main paging area. The idea is that this will be a significantly smallernumber. The drawback to this configuration is that since the mobilescoming from the main paging area do not register when entering thisspecial paging area, they would not receive the initial page whichtherefore increases the setup time for mobile terminated calls.
7
Control Channel Reducing Utilization/Capacity Improvement – continued
June 2001 7-91CDMA SC Products System Resource Guide (CSSRG)
Another special paging zone scenario that can be established is to insurethat a mobile on the registration boundary receives the page. A mobilehas a zone list and a zone timer it uses to keep track of the zones that itis in and has been in. Total zones, sent in the Systems ParametersMessage, represent the number of zones a mobile keeps in memory. Thezone list represents the actual zones the mobile keeps in memory. Zonesare uniquely identified by a combination of the SID, NID, and zonenumber. The zone timer is the amount of time the mobile keeps the otherzones (the zones not currently in) before removing them. Theseparameters keep a mobile from “ping-ponging” back and forth betweenregistration zones. A mobile will not re-register if the zone is in its zonelist and the zone timer has not expired. This keeps the registrations lowerbut increases the chance that the mobile is in the wrong paging areawhen the page is sent.
One method to get around this is to use the Re-page Your Neighborfeature. By putting the other paging area in the neighbor list of the EMX,the second page is sent to the other paging area and the calls arecompleted. However, if the paging areas have a large number ofunacknowledged pages, each paging area contributes a substantialnumber of pages to the other and increases the paging load.
Another situation that may exist is when trains or subways crossregistration boundaries that have a different call model than that of otherboundary locations. All of the users on a train cross the registrationboundary at specific times (train schedule). This puts the access channelinto an overload condition while the train is crossing the boundary.Having a boundary between subway stations reduces the number ofmobiles that ping-pong back and forth between paging areas.
Registration Re-Definitions
Registrations can be triggered with the occurrence of various events. Forinstance, the system may be set up where a subscriber unit registersevery 15 minutes while it is turned on. As a means to reduce the pagingand access channel load, it may be possible to change the registrationtime to be every 30 or 60 minutes. The following example lists variousitems that can be changed to alter how often registrations will take place:
� Register based on time
� Register on originations
� Register on terminations
� Register on power up (turn on phone).
Changes to how often registrations occur may only be a temporaryalternative until a more permanent solution can be implemented. Forinstance, for longer durations between each registration, it’s possible forthe system to lose the subscriber (in other words, the system thinks it’sin a paging area in which it no longer resides).
Broadcast to Zone–Based Paging
If the system currently has a broadcast paging scheme implemented,converting the broadcast scheme into a zone–based scheme becomes a
7

Control Channel Reducing Utilization/Capacity Improvement – continued
CDMA SC Products System Resource Guide (CSSRG) June 20017-92
practical option. For systems that are not heavily loaded, a broadcastpaging scheme can be an effective scheme from a performancestandpoint. If a subscriber is registered in a broadcast paging system, thechances of a subscriber receiving a page are maximized, since pages arebroadcast to every base station in the system.
In a zone–based system, there can be scenarios where a subscriber maybe paged in one zone, but located in another. As the subscriber andpaging load increases over a long period of time, converting to azone–based paging scheme may be unavoidable.
The borders for the paging and registration zones for a zone–basedpaging scheme must be designed carefully. Sites along apaging/registration zone border typically exhibit a higher paging/accesschannel utilization due to being on the border of two zones. As a result,the border sites must be strategically selected to be able to handle thisincrease of traffic due to the border effects. As mentioned earlier, theusage of special paging zones may be necessary for some systems.
Ultimately, the design of a particular zone–based paging system shouldattempt to optimize the performance of the following:
� Page Success Rate
� Re–Page Success Rate
� Neighbor Page Success Rate.
A zone–based paging system should also attempt to optimize the pagingand access channel utilization. Perform a re–analysis of the pagingsystem after converting to a zone–based paging scheme. Additionaloptimization may be necessary after the conversion has been performed.
Increase Sectorization
The typical sectorization conversions are as follows:
� Omni to 3–sector
� Omni to 6–sector
� 3–sector to 6–sector.
Since there are several types of paging messages broadcast to all of thesectors of a site, increasing the sectorization most likely will not have asignificant capacity relief impact to the paging channel. However,increasing the sectorization can have a significant impact on the accesschannel. Since the planning and maximum limits for the access channelare significantly less than that of the paging channel, it is possible thatthe access channel may need capacity relief before the paging channel. Ifthis is the case, increasing the sectorization may provide the neededcapacity relief for the access channel.
Data Collection Inputs
Performance Management information needs to be collected in order tomonitor the paging and access channels. The other information will berequired when relief alternatives need to be investigated.
7
Control Channel Reducing Utilization/Capacity Improvement – continued
June 2001 7-93CDMA SC Products System Resource Guide (CSSRG)
Retrieve Performance Management Reports
CBSC and BTS:
� pmC_10_hr
� pmC_20_hr
� pmC_52_hr
� pmC_70_hr.
EMX:
� REPORT PAGING AREA (specific – requires PLI feature)
� REPORT SYSTEM LOAD
� REPORT EMX PAGE
� REPORT IMDREG STATS.
Retrieve Database Configurations
CBSC and BTS:
� DISPLAY CBSC CBSCGEN
� DISPLAY CBSC PAGPARMS
� DISPLAY CBSC REGPARMS
� DISPLAY CBSC REGTYPE
� DISPLAY CBSC ALLSTATUS
� DISPLAY CBSC LOCAREAS
� DISPLAY CBSC AUTHENTIC
� DISPLAY CBSC LOCATION
� DISPLAY BTS CHANCONF
� DISPLAY BTS CHANNELLIST
� DISPLAY BTS SECGEN
� DISPLAY BTS PACHGEN
� DISPLAY BTS SECTOP
� DISPLAY SCH DIRECT.
EMX:
� DISP CP ROAMPKG
� DISP BSS BSSRTE
� DISP CP PAGMOD (Defines Broadcast or Directed Paging)
� DISP MOB DGLOBL (Timers)
� DISP BSS TIMER (Timers)
� DISP CELNET NPAGE (Re–page neighbor definitions).
Other Information
� Site numbering scheme to MM numbering Scheme
7

Control Channel Reducing Utilization/Capacity Improvement – continued
CDMA SC Products System Resource Guide (CSSRG) June 20017-94
� Site names
� Latitude and longitude
� Subscriber base
� BTS type (SC9600, etc.).
7

June 2001 CDMA SC Products System Resource Guide (CSSRG)
Appendix A: CDMA Call Flow
Appendix Content
CDMA Call Flow A-1. . . . . . . . . . . . . . . . . . . . . . . . . . . . . . . . . . . . . . . . . . . . . . . . Mobile–to–Land Set Up A-1. . . . . . . . . . . . . . . . . . . . . . . . . . . . . . . . . . . . Land–to–Mobile Call Processing A-5. . . . . . . . . . . . . . . . . . . . . . . . . . . . . Handoff in a Land–to–Mobile Call A-9. . . . . . . . . . . . . . . . . . . . . . . . . . . .
A

Table of Contents – continued
CDMA SC Products System Resource Guide (CSSRG) June 2001
Notes
A

Appendix A – CDMA Call Flow
June 2001 A-1CDMA SC Products System Resource Guide (CSSRG)
Mobile–to–Land Set Up
Figure A-1: Validation and Terrestrial Circuit Assignment
PSTN
BTS BTS BTS
MMXC
OMC–RMSC
MS
CBSC
LEGENDBSS: Base Station SystemBTS: RF Base Transceiver StationCBSC: Centralized Base Station ControllerMM: Mobility ManagerMS: Mobile StationMSC: Mobile Services Switching Center OMC–R: Operations & Maintenance Center RadioPSTN: Public Switched Telephone NetworkXC: Transcoder
BSS
1
3, 5
2, 4
1. The Mobile Station (MS) sends the Origination message and dialeddigits on the access channel through the BTS and the Transcoder(XC) to the Mobility Manager (MM).
2. The MM routes the registration data to the Mobile ServicesSwitching Center (MSC) through the XC.
3. The MSC sends the Origination message through the XC to the MM.
4. The MM routes the dialed digits to the MSC through the XC.
5. The MSC sends the terrestrial circuit assignment through the XC tothe MM.
A

Appendix A – CDMA Call Flow – continued
CDMA SC Products System Resource Guide (CSSRG) June 2001A-2
Figure A-2: Circuit Assignments
PSTN
BTS BTS BTS
MMXC
OMC–RMSC
MS
BSS
CBSC
LEGENDBSS: Base Station SystemBTS: RF Base Transceiver StationCBSC: Centralized Base Station ControllerMM: Mobility ManagerMS: Mobile StationMSC: Mobile Services Switching Center OMC–R: Operations & Maintenance Center RadioPSTN: Public Switched Telephone NetworkXC: Transcoder
6, 7
6. The MM assigns the circuits and BTS channel element.
– Circuit –– The Kiloport Switch (KSW) connections correspond toTranscoder (XC) circuit mapped to the terrestrial circuit allocatedby the MSC and the T–1 sub–timeslot associated with the trafficchannel MCC allocated by the MM.
– BTS channel element –– Walsh code assignment and long codeassignment.
7. The MM sends the Mobile Channel Assignment message throughthe XC to the BTS.
A

Appendix A – CDMA Call Flow – continued
June 2001 A-3CDMA SC Products System Resource Guide (CSSRG)
Figure A-3: Traffic Channel Assignment
PSTN
BTS BTS BTS
MMXC
OMC–RMSC
MS
BSS
CBSC
LEGENDBSS: Base Station SystemBTS: RF Base Transceiver StationCBSC: Centralized Base Station ControllerMM: Mobility ManagerMS: Mobile StationMSC: Mobile Services Switching Center OMC–R: Operations & Maintenance Center RadioPSTN: Public Switched Telephone NetworkXC: Transcoder
10
9
8
8. The Base Station System (BTS) sends the Traffic Assignmentmessage on the paging channel.
9. The Mobile Station receives the message and begins to transmit withthe Preamble message spread with its long code.
10. The BTS waits for the mobile signal to be of sufficient strength atthe rake receiver and routes the preamble data to the XC.
A

Appendix A – CDMA Call Flow – continued
CDMA SC Products System Resource Guide (CSSRG) June 2001A-4
Figure A-4: Ringback and Conversation
PSTN
BTS BTS BTS
MMXC
OMC–RMSC
MS
BSS
CBSC
LEGENDBSS: Base Station SystemBTS: RF Base Transceiver StationCBSC: Centralized Base Station ControllerMM: Mobility ManagerMS: Mobile StationMSC: Mobile Services Switching Center OMC–R: Operations & Maintenance Center RadioPSTN: Public Switched Telephone NetworkXC: Transcoder
11
12, 18
13
1415, 19
16
17
11. The XC acknowledges the receipt of the preamble to the MM.
12. The MM alerts the MSC through the XC.
13. The MSC directs the MM to send/generate the ringback message.
14. The MM routes the message to the BTS though the XC.
15. The BTS transmits the message on the traffic channel.
16. The mobile generates the ringback.
17. The MSC sends the offhook to the MM through the XC.
18. The MM sends the connection acknowledge to the MSC through theXC.
19. The call is completed through the XC.
A

Appendix A – CDMA Call Flow – continued
June 2001 A-5CDMA SC Products System Resource Guide (CSSRG)
Land–to–Mobile CallProcessing
Figure A-5: Paging and Control Messages though the Subsystems
PSTN
BTS BTS BTS
MMXC
OMC–RMSC
MS
BSS
CBSC
LEGENDBSS: Base Station SystemBTS: RF Base Transceiver StationCBSC: Centralized Base Station ControllerMM: Mobility ManagerMS: Mobile StationMSC: Mobile Services Switching Center OMC–R: Operations & Maintenance Center RadioPSTN: Public Switched Telephone NetworkXC: Transcoder
1
3
4
2
33
2, 5
1. The PSTN sends an incoming call to the MSC.2. The MSC determines if the mobile is valid.
– The MSC identifies the mobile and the cell in which the mobile isto be paged. The MSC sends the message to the MM of the BSSin which the MS is located.
3. The MS is paged in all of the cells under control of the CBSC bysending one page message to each BTS.
4. The BTS sends the page out on each paging channel equipped andmonitors access for a response.
5. The BTS sends the page acknowledgment to the MM through theXC.
A

Appendix A – CDMA Call Flow – continued
CDMA SC Products System Resource Guide (CSSRG) June 2001A-6
Figure A-6: Validation and Circuit Assignment
PSTN
BTS BTS BTS
MMXC
OMC–RMSC
MS
BSS
CBSC
LEGENDBSS: Base Station SystemBTS: RF Base Transceiver StationCBSC: Centralized Base Station ControllerMM: Mobility ManagerMS: Mobile StationMSC: Mobile Services Switching Center OMC–R: Operations & Maintenance Center RadioPSTN: Public Switched Telephone NetworkXC: Transcoder
11
6, 7
8
9, 10, 12
6. The MM verifies the requested service option is supported.
7. The MM sends all validation information to the MSC along with thecircuit assignment request through the XC.
8. The MSC performs the validation and sends the circuit assignmentto the MM.
9. The MM assigns the circuits and BTS channel element.
– Circuit –– The Kiloport Switch (KSW) connections correspond tothe Transcoder (XC) circuit mapped to the terrestrial circuitallocated by the MSC and the T–1 sub time–slot associated withthe traffic channel MCC allocated by the MM.
– BTS channel element –– Walsh code assignment and long codeassignment.
A

Appendix A – CDMA Call Flow – continued
June 2001 A-7CDMA SC Products System Resource Guide (CSSRG)
10. The MM sends the Channel Assignment message and sendspreamble data.
11. The data is detected through to the XC.
12. The MM informs the MSC of the channel assignment.
– The MSC waits for the MM to indicate the MS is being alerted.
A

Appendix A – CDMA Call Flow – continued
CDMA SC Products System Resource Guide (CSSRG) June 2001A-8
Figure A-7: Alerting and Connection
PSTN
BTS BTS BTS
MMXC
OMC–RMSC
MS
BSS
CBSC
LEGENDBSS: Base Station SystemBTS: RF Base Transceiver StationCBSC: Centralized Base Station ControllerMM: Mobility ManagerMS: Mobile StationMSC: Mobile Services Switching Center OMC–R: Operations & Maintenance Center RadioPSTN: Public Switched Telephone NetworkXC: Transcoder
13
15
14
13. The MM sends the Alert message through the XC for the MS to alertthe subscriber and the MS generates the ringback to the subscriber.
14. When the MS subscriber answers the call, the MS sends a connectmessage to the MM which forwards it to the MSC.
15. The MSC indicates to the land party that the subscriber has answeredand connects to the PSTN.
A

Appendix A – CDMA Call Flow – continued
June 2001 A-9CDMA SC Products System Resource Guide (CSSRG)
Handoff in a Land–to–MobileCall
Figure A-8: Pilot Channel Assignment
PSTN
BTS BTS BTS
MMXC
OMC–RMSC
MS
BSS
CBSC
LEGENDBSS: Base Station SystemBTS: RF Base Transceiver StationCBSC: Centralized Base Station ControllerMM: Mobility ManagerMS: Mobile StationMSC: Mobile Services Switching Center OMC–R: Operations & Maintenance Center RadioPSTN: Public Switched Telephone NetworkXC: Transcoder
2
1
1. The pilot channel measurement is reported from the mobile to theMM when the measured pilot strength exceeds T_Add parameter.
� The T_Add parameter is a threshold which adds a pilotto the active candidate list.
� The T_Drop threshold measurements drops a pilot fromthe active set of PNs for handoff.
NOTE
2. The measurement is sent to the BTS on the reverse channel and isforwarded to the MM through the XC.
A

Appendix A – CDMA Call Flow – continued
CDMA SC Products System Resource Guide (CSSRG) June 2001A-10
Figure A-9: Channel Assignment
PSTN
BTS BTS BTS
MMXC
OMC–RMSC
MS
BSS
CBSC
LEGENDBSS: Base Station SystemBTS: RF Base Transceiver StationCBSC: Centralized Base Station ControllerMM: Mobility ManagerMS: Mobile StationMSC: Mobile Services Switching Center OMC–R: Operations & Maintenance Center RadioPSTN: Public Switched Telephone NetworkXC: Transcoder
43
7
6
3. The MM recognizes the add in the adjacent sector, assigns the Walshcode in the target sector, and sends the Handoff Direction message tothe XC.
4. The XC sends the Handoff Channel Assigned message, including thepower control loop threshold and forward channel gain.
5. The MCC sets up the channel element to operate in the new sector.
6. The BTS messages the XC with a forward channel transmissionindication.
7. The BTS transmits on both forward links.
A
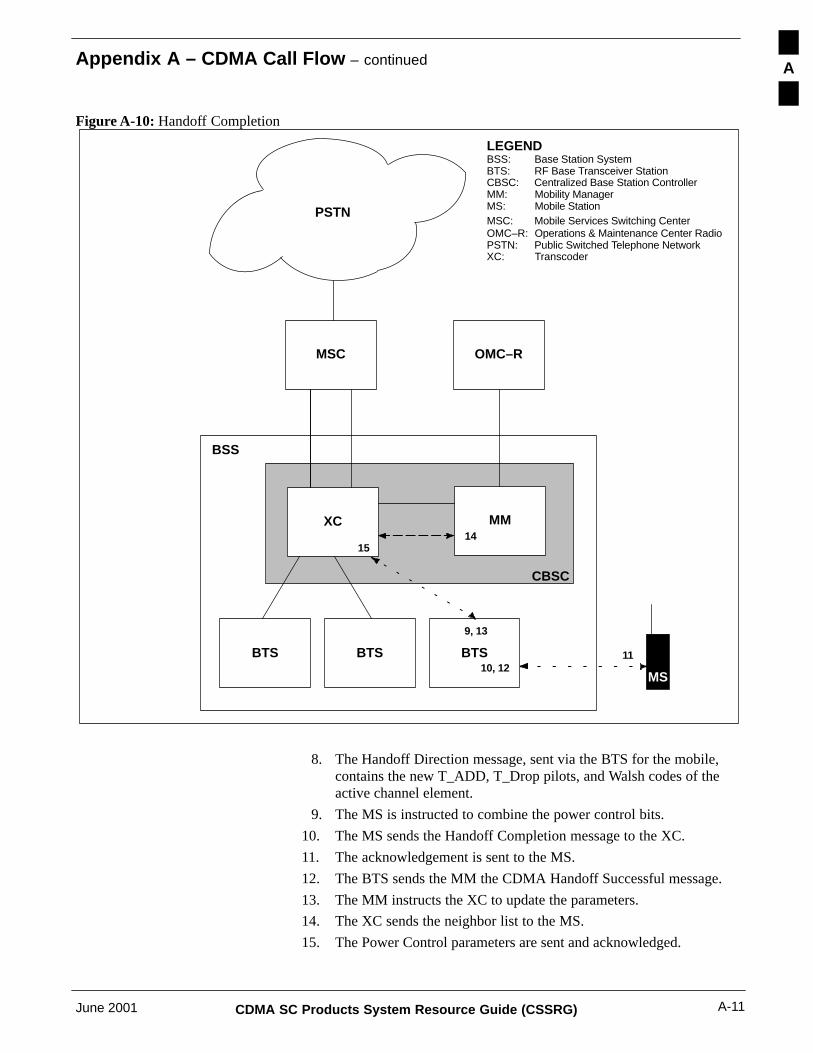
Appendix A – CDMA Call Flow – continued
June 2001 A-11CDMA SC Products System Resource Guide (CSSRG)
Figure A-10: Handoff Completion
PSTN
BTS BTS BTS
MMXC
OMC–RMSC
MS
BSS
CBSC
LEGENDBSS: Base Station SystemBTS: RF Base Transceiver StationCBSC: Centralized Base Station ControllerMM: Mobility ManagerMS: Mobile StationMSC: Mobile Services Switching Center OMC–R: Operations & Maintenance Center RadioPSTN: Public Switched Telephone NetworkXC: Transcoder
9, 13
14
10, 1211
15
8. The Handoff Direction message, sent via the BTS for the mobile,contains the new T_ADD, T_Drop pilots, and Walsh codes of theactive channel element.
9. The MS is instructed to combine the power control bits.
10. The MS sends the Handoff Completion message to the XC.
11. The acknowledgement is sent to the MS.
12. The BTS sends the MM the CDMA Handoff Successful message.
13. The MM instructs the XC to update the parameters.
14. The XC sends the neighbor list to the MS.
15. The Power Control parameters are sent and acknowledged.
A

Appendix A – CDMA Call Flow – continued
CDMA SC Products System Resource Guide (CSSRG) June 2001A-12
Notes
A
June 2001 CDMA SC Products System Resource Guide (CSSRG)
Appendix B: Erlang B Tables
Appendix Content
Erlang B Tables B-1. . . . . . . . . . . . . . . . . . . . . . . . . . . . . . . . . . . . . . . . . . . . . . . . . . Blocking Erlangs using the Erlang B Model B-1. . . . . . . . . . . . . . . . . . . . . Erlang B Table for T1/E1 Spans B-13. . . . . . . . . . . . . . . . . . . . . . . . . . . . . .
B
Table of Contents – continued
CDMA SC Products System Resource Guide (CSSRG) June 2001
Notes
B

Appendix B – Erlang B Tables
June 2001 B-1CDMA SC Products System Resource Guide (CSSRG)
Blocking Erlangs using theErlang B Model
Table B-1: Erlangs per Blocking
Channels
N 0.1% 0.15% 0.2% 0.3% 0.5% 1.0% 1.5% 2.0% 3.0% 5.0%
1 0.00 0.00 0.00 0.00 0.01 0.01 0.02 0.02 0.03 0.05
2 0.05 0.06 0.07 0.08 0.11 0.15 0.19 0.22 0.28 0.38
3 0.19 0.22 0.25 0.29 0.35 0.46 0.54 0.60 0.72 0.90
4 0.44 0.49 0.54 0.60 0.70 0.87 0.99 1.09 1.26 1.52
5 0.76 0.84 0.90 0.99 1.13 1.36 1.52 1.66 1.88 2.22
6 1.15 1.25 1.33 1.45 1.62 1.91 2.11 2.28 2.54 2.96
7 1.58 1.70 1.80 1.95 2.16 2.50 2.74 2.94 3.25 3.74
8 2.05 2.20 2.31 2.48 2.73 3.13 3.40 3.63 3.99 4.54
9 2.56 2.73 2.85 3.05 3.33 3.78 4.09 4.34 4.75 5.37
10 3.09 3.28 3.43 3.65 3.96 4.46 4.81 5.08 5.53 6.22
11 3.65 3.86 4.02 4.27 4.61 5.16 5.54 5.84 6.33 7.08
12 4.23 4.46 4.64 4.90 5.28 5.88 6.29 6.61 7.14 7.95
13 4.83 5.08 5.27 5.56 5.96 6.61 7.05 7.40 7.97 8.83
14 5.45 5.71 5.92 6.23 6.66 7.35 7.82 8.20 8.80 9.73
15 6.08 6.36 6.58 6.91 7.38 8.11 8.61 9.01 9.65 10.63
16 6.72 7.03 7.26 7.61 8.10 8.88 9.41 9.83 10.51 11.54
17 7.38 7.70 7.95 8.32 8.83 9.65 10.21 10.66 11.37 12.46
18 8.05 8.39 8.64 9.03 9.58 10.44 11.02 11.49 12.24 13.39
19 8.72 9.08 9.35 9.76 10.33 11.23 11.84 12.33 13.11 14.31
20 9.41 9.79 10.07 10.50 11.09 12.03 12.67 13.18 14.00 15.25
21 10.11 10.50 10.79 11.24 11.86 12.84 13.51 14.04 14.89 16.19
22 10.81 11.22 11.53 11.99 12.63 13.65 14.35 14.90 15.78 17.13
23 11.52 11.95 12.26 12.75 13.42 14.47 15.19 15.76 16.68 18.08
24 12.24 12.68 13.01 13.51 14.20 15.30 16.04 16.63 17.58 19.03
25 12.97 13.42 13.76 14.28 15.00 16.12 16.89 17.50 18.48 19.99
26 13.70 14.17 14.52 15.05 15.79 16.96 17.75 18.38 19.39 20.94
27 14.44 14.92 15.29 15.83 16.60 17.80 18.62 19.26 20.31 21.90
28 15.18 15.68 16.05 16.62 17.41 18.64 19.48 20.15 21.22 22.87
29 15.93 16.44 16.83 17.41 18.22 19.49 20.35 21.04 22.14 23.83
... continued on next page
B

Appendix B – Erlang B Tables – continued
CDMA SC Products System Resource Guide (CSSRG) June 2001B-2
Channels
N 5.0%3.0%2.0%1.5%1.0%0.5%0.3%0.2%0.15%0.1%
30 16.68 17.21 17.61 18.20 19.03 20.34 21.23 21.93 23.06 24.80
31 17.44 17.98 18.39 19.00 19.85 21.19 22.10 22.83 23.99 25.77
32 18.20 18.76 19.18 19.80 20.68 22.05 22.98 23.72 24.91 26.75
33 18.97 19.54 19.97 20.61 21.50 22.91 23.87 24.63 25.84 27.72
34 19.74 20.32 20.76 21.42 22.34 23.77 24.75 25.53 26.78 28.70
35 20.52 21.11 21.56 22.23 23.17 24.64 25.64 26.43 27.71 29.68
36 21.30 21.90 22.36 23.05 24.01 25.51 26.53 27.34 28.65 30.66
37 22.08 22.70 23.17 23.87 24.85 26.38 27.42 28.25 29.59 31.64
38 22.86 23.50 23.97 24.69 25.69 27.25 28.32 29.17 30.53 32.62
39 23.65 24.30 24.78 25.52 26.53 28.13 29.22 30.08 31.47 33.61
40 24.44 25.10 25.60 26.35 27.38 29.01 30.12 31.00 32.41 34.60
41 25.24 25.91 26.42 27.18 28.23 29.89 31.02 31.92 33.36 35.58
42 26.04 26.72 27.23 28.01 29.08 30.77 31.92 32.84 34.30 36.57
43 26.84 27.53 28.06 28.85 29.94 31.66 32.83 33.76 35.25 37.56
44 27.64 28.35 28.88 29.68 30.80 32.54 33.73 34.68 36.20 38.56
45 28.45 29.17 29.71 30.52 31.66 33.43 34.64 35.61 37.16 39.55
46 29.25 29.99 30.54 31.37 32.52 34.32 35.55 36.53 38.11 40.54
47 30.07 30.81 31.37 32.21 33.38 35.21 36.47 37.46 39.06 41.54
48 30.88 31.63 32.20 33.06 34.25 36.11 37.38 38.39 40.02 42.54
49 31.69 32.46 33.04 33.91 35.11 37.00 38.30 39.32 40.97 43.53
50 32.51 33.29 33.88 34.76 35.98 37.90 39.21 40.26 41.93 44.53
51 33.33 34.12 34.72 35.61 36.85 38.80 40.13 41.19 42.89 45.53
52 34.15 34.95 35.56 36.47 37.72 39.70 41.05 42.12 43.85 46.53
53 34.98 35.79 36.40 37.32 38.60 40.60 41.97 43.06 44.81 47.53
54 35.80 36.63 37.25 38.18 39.47 41.50 42.89 44.00 45.78 48.54
55 36.63 37.46 38.09 39.04 40.35 42.41 43.82 44.94 46.74 49.54
56 37.46 38.31 38.94 39.90 41.23 43.31 44.74 45.88 47.70 50.54
57 38.29 39.15 39.79 40.76 42.11 44.22 45.67 46.82 48.67 51.55
58 39.12 39.99 40.64 41.63 42.99 45.13 46.59 47.76 49.63 52.55
59 39.96 40.84 41.50 42.49 43.87 46.04 47.52 48.70 50.60 53.56
60 40.79 41.68 42.35 43.36 44.76 46.95 48.45 49.64 51.57 54.57
61 41.63 42.53 43.21 44.23 45.64 47.86 49.38 50.59 52.54 55.57
... continued on next page
B

Appendix B – Erlang B Tables – continued
June 2001 B-3CDMA SC Products System Resource Guide (CSSRG)
Channels
N 5.0%3.0%2.0%1.5%1.0%0.5%0.3%0.2%0.15%0.1%
62 42.47 43.38 44.07 45.10 46.53 48.77 50.31 51.53 53.51 56.58
63 43.31 44.23 44.93 45.97 47.42 49.69 51.24 52.48 54.48 57.59
64 44.16 45.09 45.79 46.84 48.30 50.60 52.17 53.43 55.45 58.60
65 45.00 45.94 46.65 47.72 49.19 51.52 53.11 54.38 56.42 59.61
66 45.84 46.80 47.51 48.59 50.09 52.44 54.04 55.33 57.39 60.62
67 46.69 47.65 48.38 49.47 50.98 53.35 54.98 56.27 58.37 61.63
68 47.54 48.51 49.24 50.34 51.87 54.27 55.92 57.23 59.34 62.64
69 48.39 49.37 50.11 51.22 52.77 55.19 56.85 58.18 60.32 63.65
70 49.24 50.23 50.98 52.10 53.66 56.11 57.79 59.13 61.29 64.67
71 50.09 51.09 51.85 52.98 54.56 57.03 58.73 60.08 62.27 65.68
72 50.94 51.96 52.72 53.87 55.46 57.96 59.67 61.04 63.24 66.69
73 51.80 52.82 53.59 54.75 56.35 58.88 60.61 61.99 64.22 67.71
74 52.65 53.69 54.46 55.63 57.25 59.80 61.55 62.94 65.20 68.72
75 53.51 54.55 55.34 56.52 58.15 60.73 62.49 63.90 66.18 69.74
76 54.37 55.42 56.21 57.40 59.05 61.65 63.43 64.86 67.16 70.75
77 55.23 56.29 57.09 58.29 59.96 62.58 64.38 65.81 68.14 71.77
78 56.09 57.16 57.96 59.18 60.86 63.51 65.32 66.77 69.12 72.79
79 56.95 58.03 58.84 60.07 61.76 64.43 66.27 67.73 70.10 73.80
80 57.81 58.90 59.72 60.95 62.67 65.36 67.21 68.69 71.08 74.82
81 58.67 59.77 60.60 61.85 63.57 66.29 68.16 69.65 72.06 75.84
82 59.54 60.65 61.48 62.74 64.48 67.22 69.10 70.61 73.04 76.86
83 60.40 61.52 62.36 63.63 65.39 68.15 70.05 71.57 74.02 77.87
84 61.27 62.40 63.24 64.52 66.29 69.08 71.00 72.53 75.01 78.89
85 62.14 63.27 64.13 65.42 67.20 70.02 71.95 73.49 75.99 79.91
86 63.00 64.15 65.01 66.31 68.11 70.95 72.90 74.45 76.97 80.93
87 63.87 65.03 65.90 67.21 69.02 71.88 73.84 75.42 77.96 81.95
88 64.74 65.91 66.78 68.10 69.93 72.81 74.79 76.38 78.94 82.97
89 65.61 66.79 67.67 69.00 70.84 73.75 75.75 77.34 79.93 83.99
90 66.48 67.67 68.56 69.90 71.76 74.68 76.70 78.31 80.91 85.01
91 67.36 68.55 69.44 70.79 72.67 75.62 77.65 79.27 81.90 86.04
92 68.23 69.43 70.33 71.69 73.58 76.56 78.60 80.24 82.89 87.06
93 69.10 70.31 71.22 72.59 74.50 77.49 79.55 81.20 83.87 88.08
... continued on next page
B
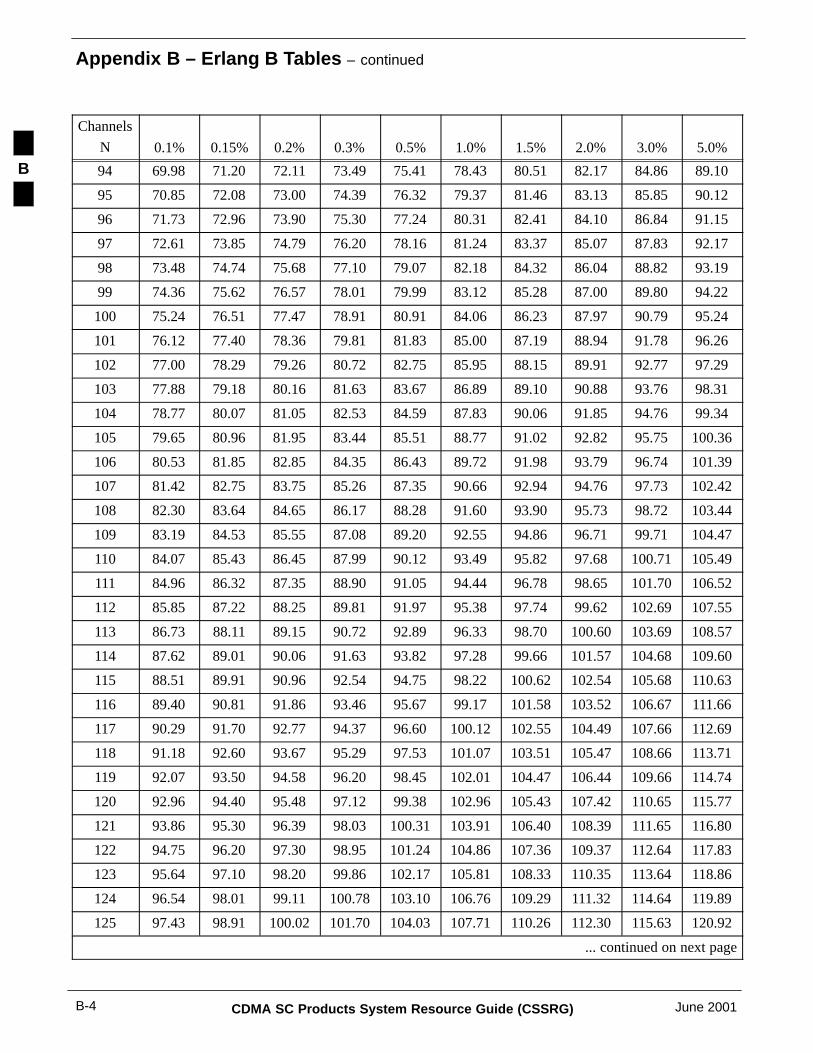
Appendix B – Erlang B Tables – continued
CDMA SC Products System Resource Guide (CSSRG) June 2001B-4
Channels
N 5.0%3.0%2.0%1.5%1.0%0.5%0.3%0.2%0.15%0.1%
94 69.98 71.20 72.11 73.49 75.41 78.43 80.51 82.17 84.86 89.10
95 70.85 72.08 73.00 74.39 76.32 79.37 81.46 83.13 85.85 90.12
96 71.73 72.96 73.90 75.30 77.24 80.31 82.41 84.10 86.84 91.15
97 72.61 73.85 74.79 76.20 78.16 81.24 83.37 85.07 87.83 92.17
98 73.48 74.74 75.68 77.10 79.07 82.18 84.32 86.04 88.82 93.19
99 74.36 75.62 76.57 78.01 79.99 83.12 85.28 87.00 89.80 94.22
100 75.24 76.51 77.47 78.91 80.91 84.06 86.23 87.97 90.79 95.24
101 76.12 77.40 78.36 79.81 81.83 85.00 87.19 88.94 91.78 96.26
102 77.00 78.29 79.26 80.72 82.75 85.95 88.15 89.91 92.77 97.29
103 77.88 79.18 80.16 81.63 83.67 86.89 89.10 90.88 93.76 98.31
104 78.77 80.07 81.05 82.53 84.59 87.83 90.06 91.85 94.76 99.34
105 79.65 80.96 81.95 83.44 85.51 88.77 91.02 92.82 95.75 100.36
106 80.53 81.85 82.85 84.35 86.43 89.72 91.98 93.79 96.74 101.39
107 81.42 82.75 83.75 85.26 87.35 90.66 92.94 94.76 97.73 102.42
108 82.30 83.64 84.65 86.17 88.28 91.60 93.90 95.73 98.72 103.44
109 83.19 84.53 85.55 87.08 89.20 92.55 94.86 96.71 99.71 104.47
110 84.07 85.43 86.45 87.99 90.12 93.49 95.82 97.68 100.71 105.49
111 84.96 86.32 87.35 88.90 91.05 94.44 96.78 98.65 101.70 106.52
112 85.85 87.22 88.25 89.81 91.97 95.38 97.74 99.62 102.69 107.55
113 86.73 88.11 89.15 90.72 92.89 96.33 98.70 100.60 103.69 108.57
114 87.62 89.01 90.06 91.63 93.82 97.28 99.66 101.57 104.68 109.60
115 88.51 89.91 90.96 92.54 94.75 98.22 100.62 102.54 105.68 110.63
116 89.40 90.81 91.86 93.46 95.67 99.17 101.58 103.52 106.67 111.66
117 90.29 91.70 92.77 94.37 96.60 100.12 102.55 104.49 107.66 112.69
118 91.18 92.60 93.67 95.29 97.53 101.07 103.51 105.47 108.66 113.71
119 92.07 93.50 94.58 96.20 98.45 102.01 104.47 106.44 109.66 114.74
120 92.96 94.40 95.48 97.12 99.38 102.96 105.43 107.42 110.65 115.77
121 93.86 95.30 96.39 98.03 100.31 103.91 106.40 108.39 111.65 116.80
122 94.75 96.20 97.30 98.95 101.24 104.86 107.36 109.37 112.64 117.83
123 95.64 97.10 98.20 99.86 102.17 105.81 108.33 110.35 113.64 118.86
124 96.54 98.01 99.11 100.78 103.10 106.76 109.29 111.32 114.64 119.89
125 97.43 98.91 100.02 101.70 104.03 107.71 110.26 112.30 115.63 120.92
... continued on next page
B

Appendix B – Erlang B Tables – continued
June 2001 B-5CDMA SC Products System Resource Guide (CSSRG)
Channels
N 5.0%3.0%2.0%1.5%1.0%0.5%0.3%0.2%0.15%0.1%
126 98.33 99.81 100.93 102.62 104.96 108.66 111.22 113.28 116.63 121.95
127 99.22 100.71 101.84 103.53 105.89 109.61 112.19 114.25 117.63 122.98
128 100.12 101.62 102.75 104.45 106.82 110.57 113.15 115.23 118.62 124.01
129 101.01 102.52 103.66 105.37 107.75 111.52 114.12 116.21 119.62 125.04
130 101.91 103.43 104.57 106.29 108.68 112.47 115.09 117.19 120.62 126.07
131 102.81 104.33 105.48 107.21 109.62 113.42 116.05 118.17 121.62 127.10
132 103.71 105.24 106.39 108.13 110.55 114.38 117.02 119.15 122.62 128.13
133 104.60 106.14 107.30 109.05 111.48 115.33 117.99 120.12 123.61 129.16
134 105.50 107.05 108.22 109.97 112.42 116.28 118.95 121.10 124.61 130.19
135 106.40 107.96 109.13 110.89 113.35 117.24 119.92 122.08 125.61 131.22
136 107.30 108.86 110.04 111.82 114.28 118.19 120.89 123.06 126.61 132.25
137 108.20 109.77 110.95 112.74 115.22 119.14 121.86 124.04 127.61 133.28
138 109.10 110.68 111.87 113.66 116.15 120.10 122.83 125.02 128.61 134.32
139 110.00 111.59 112.78 114.58 117.09 121.05 123.80 126.00 129.61 135.35
140 110.90 112.50 113.70 115.51 118.02 122.01 124.77 126.98 130.61 136.38
141 111.81 113.41 114.61 116.43 118.96 122.96 125.74 127.97 131.61 137.41
142 112.71 114.32 115.53 117.35 119.90 123.92 126.70 128.95 132.61 138.44
143 113.61 115.23 116.44 118.28 120.83 124.88 127.67 129.93 133.61 139.48
144 114.51 116.14 117.36 119.20 121.77 125.83 128.64 130.91 134.61 140.51
145 115.42 117.05 118.28 120.13 122.71 126.79 129.62 131.89 135.61 141.54
146 116.32 117.96 119.19 121.05 123.64 127.75 130.59 132.87 136.61 142.57
147 117.23 118.87 120.11 121.98 124.58 128.70 131.56 133.86 137.61 143.61
148 118.13 119.78 121.03 122.91 125.52 129.66 132.53 134.84 138.61 144.64
149 119.04 120.69 121.95 123.83 126.46 130.62 133.50 135.82 139.62 145.67
150 119.94 121.61 122.86 124.76 127.40 131.58 134.47 136.80 140.62 146.71
151 120.85 122.52 123.78 125.69 128.33 132.53 135.44 137.79 141.62 147.74
152 121.75 123.43 124.70 126.61 129.27 133.49 136.41 138.77 142.62 148.77
153 122.66 124.35 125.62 127.54 130.21 134.45 137.39 139.75 143.62 149.81
154 123.57 125.26 126.54 128.47 131.15 135.41 138.36 140.74 144.63 150.84
155 124.47 126.18 127.46 129.40 132.09 136.37 139.33 141.72 145.63 151.87
156 125.38 127.09 128.38 130.33 133.03 137.33 140.30 142.70 146.63 152.91
157 126.29 128.01 129.30 131.25 133.97 138.29 141.28 143.69 147.63 153.94
... continued on next page
B

Appendix B – Erlang B Tables – continued
CDMA SC Products System Resource Guide (CSSRG) June 2001B-6
Channels
N 5.0%3.0%2.0%1.5%1.0%0.5%0.3%0.2%0.15%0.1%
158 127.20 128.92 130.22 132.18 134.91 139.25 142.25 144.67 148.64 154.98
159 128.11 129.84 131.14 133.11 135.86 140.21 143.22 145.66 149.64 156.01
160 129.01 130.75 132.07 134.04 136.80 141.17 144.20 146.64 150.64 157.05
161 129.92 131.67 132.99 134.97 137.74 142.13 145.17 147.63 151.65 158.08
162 130.83 132.59 133.91 135.90 138.68 143.09 146.15 148.61 152.65 159.12
163 131.74 133.50 134.83 136.83 139.62 144.05 147.12 149.60 153.66 160.15
164 132.65 134.42 135.75 137.77 140.57 145.01 148.09 150.58 154.66 161.19
165 133.56 135.34 136.68 138.70 141.51 145.97 149.07 151.57 155.66 162.22
166 134.48 136.26 137.60 139.63 142.45 146.93 150.04 152.55 156.67 163.26
167 135.39 137.18 138.52 140.56 143.39 147.89 151.02 153.54 157.67 164.29
168 136.30 138.09 139.45 141.49 144.34 148.86 151.99 154.53 158.68 165.33
169 137.21 139.01 140.37 142.42 145.28 149.82 152.97 155.51 159.68 166.36
170 138.12 139.93 141.30 143.36 146.23 150.78 153.94 156.50 160.69 167.40
171 139.04 140.85 142.22 144.29 147.17 151.74 154.92 157.48 161.69 168.43
172 139.95 141.77 143.15 145.22 148.11 152.71 155.90 158.47 162.70 169.47
173 140.86 142.69 144.07 146.16 149.06 153.67 156.87 159.46 163.70 170.50
174 141.77 143.61 145.00 147.09 150.00 154.63 157.85 160.44 164.71 171.54
175 142.69 144.53 145.92 148.02 150.95 155.60 158.82 161.43 165.71 172.58
176 143.60 145.45 146.85 148.96 151.89 156.56 159.80 162.42 166.72 173.61
177 144.52 146.38 147.78 149.89 152.84 157.52 160.78 163.41 167.72 174.65
178 145.43 147.30 148.70 150.83 153.79 158.49 161.75 164.39 168.73 175.69
179 146.35 148.22 149.63 151.76 154.73 159.45 162.73 165.38 169.73 176.72
180 147.26 149.14 150.56 152.70 155.68 160.42 163.71 166.37 170.74 177.76
181 148.18 150.06 151.49 153.63 156.62 161.38 164.69 167.36 171.75 178.79
182 149.09 150.99 152.41 154.57 157.57 162.34 165.66 168.35 172.75 179.83
183 150.01 151.91 153.34 155.50 158.52 163.31 166.64 169.33 173.76 180.87
184 150.93 152.83 154.27 156.44 159.46 164.27 167.62 170.32 174.77 181.91
185 151.84 153.76 155.20 157.38 160.41 165.24 168.60 171.31 175.77 182.94
186 152.76 154.68 156.13 158.31 161.36 166.21 169.58 172.30 176.78 183.98
187 153.68 155.60 157.06 159.25 162.31 167.17 170.55 173.29 177.79 185.02
188 154.59 156.53 157.99 160.19 163.25 168.14 171.53 174.28 178.79 186.05
189 155.51 157.45 158.91 161.12 164.20 169.10 172.51 175.27 179.80 187.09
... continued on next page
B

Appendix B – Erlang B Tables – continued
June 2001 B-7CDMA SC Products System Resource Guide (CSSRG)
Channels
N 5.0%3.0%2.0%1.5%1.0%0.5%0.3%0.2%0.15%0.1%
190 156.43 158.38 159.84 162.06 165.15 170.07 173.49 176.26 180.81 188.13
191 157.35 159.30 160.77 163.00 166.10 171.03 174.47 177.25 181.81 189.17
192 158.27 160.23 161.70 163.94 167.05 172.00 175.45 178.24 182.82 190.20
193 159.19 161.15 162.64 164.87 168.00 172.97 176.43 179.23 183.83 191.24
194 160.10 162.08 163.57 165.81 168.95 173.93 177.41 180.22 184.84 192.28
195 161.02 163.00 164.50 166.75 169.90 174.90 178.39 181.21 185.85 193.32
196 161.94 163.93 165.43 167.69 170.85 175.87 179.37 182.20 186.85 194.35
197 162.86 164.86 166.36 168.63 171.79 176.84 180.35 183.19 187.86 195.39
198 163.78 165.78 167.29 169.57 172.74 177.80 181.33 184.18 188.87 196.43
199 164.70 166.71 168.22 170.51 173.69 178.77 182.31 185.17 189.88 197.47
200 165.62 167.64 169.15 171.45 174.64 179.74 183.29 186.16 190.89 198.51
201 166.54 168.56 170.09 172.39 175.60 180.71 184.27 187.15 191.89 199.55
202 167.47 169.49 171.02 173.33 176.55 181.67 185.25 188.14 192.90 200.58
203 168.39 170.42 171.95 174.27 177.50 182.64 186.23 189.13 193.91 201.62
204 169.31 171.35 172.88 175.21 178.45 183.61 187.21 190.12 194.92 202.66
205 170.23 172.27 173.82 176.15 179.40 184.58 188.19 191.11 195.93 203.70
206 171.15 173.20 174.75 177.09 180.35 185.55 189.17 192.10 196.94 204.74
207 172.07 174.13 175.68 178.03 181.30 186.52 190.15 193.10 197.95 205.78
208 173.00 175.06 176.62 178.97 182.25 187.48 191.13 194.09 198.96 206.82
209 173.92 175.99 177.55 179.91 183.21 188.45 192.11 195.08 199.97 207.85
210 174.84 176.92 178.49 180.85 184.16 189.42 193.10 196.07 200.97 208.89
211 175.77 177.85 179.42 181.80 185.11 190.39 194.08 197.06 201.98 209.93
212 176.69 178.78 180.36 182.74 186.06 191.36 195.06 198.06 202.99 210.97
213 177.61 179.71 181.29 183.68 187.01 192.33 196.04 199.05 204.00 212.01
214 178.54 180.64 182.22 184.62 187.97 193.30 197.02 200.04 205.01 213.05
215 179.46 181.57 183.16 185.56 188.92 194.27 198.01 201.03 206.02 214.09
216 180.38 182.50 184.10 186.51 189.87 195.24 198.99 202.02 207.03 215.13
217 181.31 183.43 185.03 187.45 190.83 196.21 199.97 203.02 208.04 216.17
218 182.23 184.36 185.97 188.39 191.78 197.18 200.95 204.01 209.05 217.21
219 183.16 185.29 186.90 189.34 192.73 198.15 201.93 205.00 210.06 218.25
220 184.08 186.22 187.84 190.28 193.69 199.12 202.92 206.00 211.07 219.29
221 185.01 187.15 188.77 191.22 194.64 200.09 203.90 206.99 212.08 220.33
... continued on next page
B

Appendix B – Erlang B Tables – continued
CDMA SC Products System Resource Guide (CSSRG) June 2001B-8
Channels
N 5.0%3.0%2.0%1.5%1.0%0.5%0.3%0.2%0.15%0.1%
222 185.93 188.09 189.71 192.17 195.59 201.06 204.88 207.98 213.09 221.37
223 186.86 189.02 190.65 193.11 196.55 202.04 205.87 208.97 214.10 222.41
224 187.78 189.95 191.58 194.05 197.50 203.01 206.85 209.97 215.11 223.45
225 188.71 190.88 192.52 195.00 198.46 203.98 207.83 210.96 216.12 224.48
226 189.64 191.81 193.46 195.94 199.41 204.95 208.82 211.95 217.14 225.52
227 190.56 192.75 194.40 196.89 200.37 205.92 209.80 212.95 218.15 226.56
228 191.49 193.68 195.33 197.83 201.32 206.89 210.78 213.94 219.16 227.60
229 192.42 194.61 196.27 198.78 202.28 207.86 211.77 214.94 220.17 228.65
230 193.34 195.55 197.21 199.72 203.23 208.84 212.75 215.93 221.18 229.69
231 194.27 196.48 198.15 200.67 204.19 209.81 213.74 216.92 222.19 230.73
232 195.20 197.41 199.09 201.61 205.14 210.78 214.72 217.92 223.20 231.77
233 196.13 198.35 200.02 202.56 206.10 211.75 215.70 218.91 224.21 232.81
234 197.05 199.28 200.96 203.50 207.05 212.72 216.69 219.91 225.22 233.85
235 197.98 200.21 201.90 204.45 208.01 213.70 217.67 220.90 226.23 234.89
236 198.91 201.15 202.84 205.40 208.97 214.67 218.66 221.90 227.25 235.93
237 199.84 202.08 203.78 206.34 209.92 215.64 219.64 222.89 228.26 236.97
238 200.77 203.02 204.72 207.29 210.88 216.61 220.63 223.88 229.27 238.01
239 201.69 203.95 205.66 208.23 211.83 217.59 221.61 224.88 230.28 239.05
240 202.62 204.89 206.60 209.18 212.79 218.56 222.60 225.87 231.29 240.09
241 203.55 205.82 207.54 210.13 213.75 219.53 223.58 226.87 232.30 241.13
242 204.48 206.76 208.48 211.07 214.70 220.51 224.57 227.86 233.32 242.17
243 205.41 207.69 209.42 212.02 215.66 221.48 225.55 228.86 234.33 243.21
244 206.34 208.63 210.36 212.97 216.62 222.45 226.54 229.85 235.34 244.25
245 207.27 209.56 211.30 213.92 217.58 223.43 227.52 230.85 236.35 245.29
246 208.20 210.50 212.24 214.86 218.53 224.40 228.51 231.84 237.36 246.34
247 209.13 211.44 213.18 215.81 219.49 225.37 229.49 232.84 238.38 247.38
248 210.06 212.37 214.12 216.76 220.45 226.35 230.48 233.84 239.39 248.42
249 210.99 213.31 215.06 217.71 221.41 227.32 231.46 234.83 240.40 249.46
250 211.92 214.25 216.00 218.65 222.36 228.30 232.45 235.83 241.41 250.50
251 212.85 215.18 216.94 219.60 223.32 229.27 233.44 236.82 242.43 251.54
252 213.78 216.12 217.88 220.55 224.28 230.25 234.42 237.82 243.44 252.58
253 214.72 217.06 218.83 221.50 225.24 231.22 235.41 238.81 244.45 253.62
... continued on next page
B

Appendix B – Erlang B Tables – continued
June 2001 B-9CDMA SC Products System Resource Guide (CSSRG)
Channels
N 5.0%3.0%2.0%1.5%1.0%0.5%0.3%0.2%0.15%0.1%
254 215.65 217.99 219.77 222.45 226.20 232.19 236.39 239.81 245.47 254.67
255 216.58 218.93 220.71 223.40 227.16 233.17 237.38 240.81 246.48 255.71
256 217.51 219.87 221.65 224.35 228.11 234.14 238.37 241.80 247.49 256.75
257 218.44 220.81 222.59 225.30 229.07 235.12 239.35 242.80 248.50 257.79
258 219.37 221.74 223.54 226.24 230.03 236.09 240.34 243.80 249.52 258.83
259 220.31 222.68 224.48 227.19 230.99 237.07 241.33 244.79 250.53 259.87
260 221.24 223.62 225.42 228.14 231.95 238.04 242.31 245.79 251.54 260.91
261 222.17 224.56 226.36 229.09 232.91 239.02 243.30 246.78 252.56 261.96
262 223.10 225.50 227.31 230.04 233.87 239.99 244.29 247.78 253.57 263.00
263 224.04 226.44 228.25 230.99 234.83 240.97 245.27 248.78 254.58 264.04
264 224.97 227.37 229.19 231.94 235.79 241.95 246.26 249.77 255.60 265.08
265 225.90 228.31 230.14 232.89 236.75 242.92 247.25 250.77 256.61 266.12
266 226.83 229.25 231.08 233.84 237.71 243.90 248.24 251.77 257.62 267.17
267 227.77 230.19 232.02 234.79 238.67 244.87 249.22 252.77 258.64 268.21
268 228.70 231.13 232.97 235.74 239.63 245.85 250.21 253.76 259.65 269.25
269 229.64 232.07 233.91 236.69 240.59 246.82 251.20 254.76 260.66 270.29
270 230.57 233.01 234.86 237.64 241.55 247.80 252.19 255.76 261.68 271.33
271 231.50 233.95 235.80 238.60 242.51 248.78 253.17 256.75 262.69 272.38
272 232.44 234.89 236.74 239.55 243.47 249.75 254.16 257.75 263.71 273.42
273 233.37 235.83 237.69 240.50 244.43 250.73 255.15 258.75 264.72 274.46
274 234.31 236.77 238.63 241.45 245.39 251.71 256.14 259.75 265.73 275.50
275 235.24 237.71 239.58 242.40 246.35 252.68 257.13 260.74 266.75 276.55
276 236.17 238.65 240.52 243.35 247.31 253.66 258.11 261.74 267.76 277.59
277 237.11 239.59 241.47 244.30 248.27 254.64 259.10 262.74 268.78 278.63
278 238.04 240.53 242.41 245.26 249.24 255.61 260.09 263.74 269.79 279.67
279 238.98 241.47 243.36 246.21 250.20 256.59 261.08 264.74 270.80 280.72
280 239.92 242.41 244.30 247.16 251.16 257.57 262.07 265.73 271.82 281.76
281 240.85 243.35 245.25 248.11 252.12 258.54 263.06 266.73 272.83 282.80
282 241.79 244.30 246.19 249.06 253.08 259.52 264.04 267.73 273.85 283.84
283 242.72 245.24 247.14 250.02 254.04 260.50 265.03 268.73 274.86 284.89
284 243.66 246.18 248.09 250.97 255.00 261.48 266.02 269.73 275.88 285.93
285 244.59 247.12 249.03 251.92 255.97 262.45 267.01 270.72 276.89 286.97
... continued on next page
B
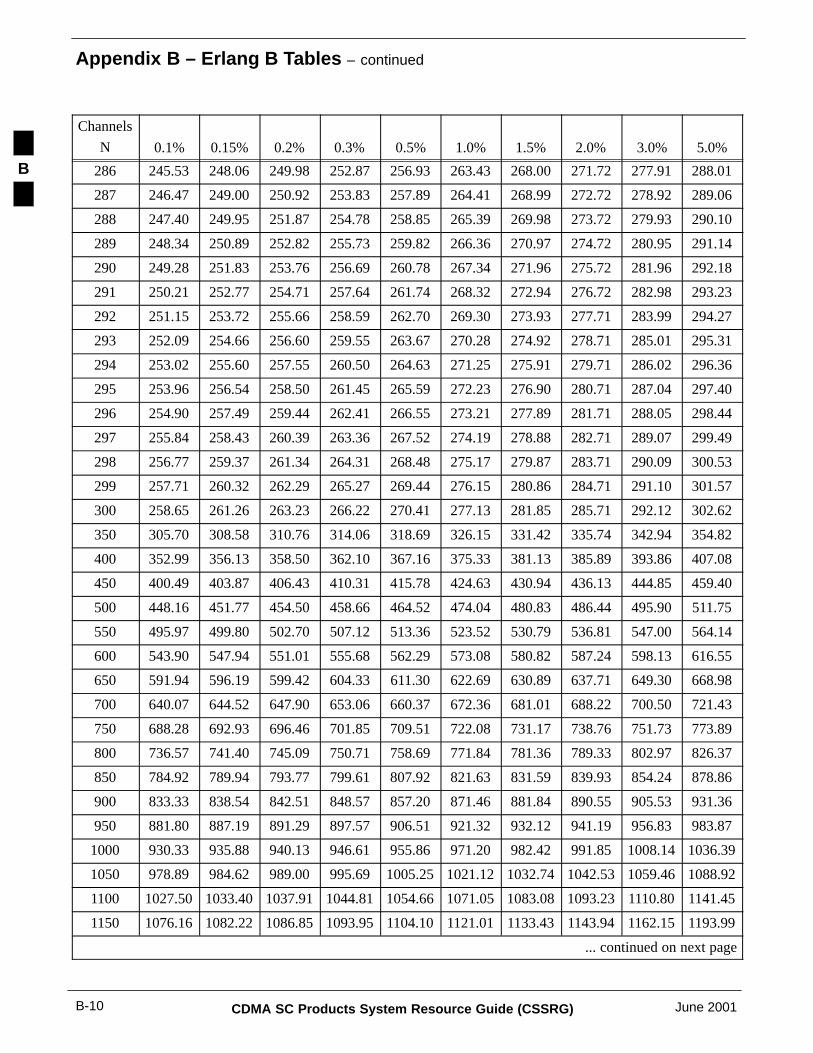
Appendix B – Erlang B Tables – continued
CDMA SC Products System Resource Guide (CSSRG) June 2001B-10
Channels
N 5.0%3.0%2.0%1.5%1.0%0.5%0.3%0.2%0.15%0.1%
286 245.53 248.06 249.98 252.87 256.93 263.43 268.00 271.72 277.91 288.01
287 246.47 249.00 250.92 253.83 257.89 264.41 268.99 272.72 278.92 289.06
288 247.40 249.95 251.87 254.78 258.85 265.39 269.98 273.72 279.93 290.10
289 248.34 250.89 252.82 255.73 259.82 266.36 270.97 274.72 280.95 291.14
290 249.28 251.83 253.76 256.69 260.78 267.34 271.96 275.72 281.96 292.18
291 250.21 252.77 254.71 257.64 261.74 268.32 272.94 276.72 282.98 293.23
292 251.15 253.72 255.66 258.59 262.70 269.30 273.93 277.71 283.99 294.27
293 252.09 254.66 256.60 259.55 263.67 270.28 274.92 278.71 285.01 295.31
294 253.02 255.60 257.55 260.50 264.63 271.25 275.91 279.71 286.02 296.36
295 253.96 256.54 258.50 261.45 265.59 272.23 276.90 280.71 287.04 297.40
296 254.90 257.49 259.44 262.41 266.55 273.21 277.89 281.71 288.05 298.44
297 255.84 258.43 260.39 263.36 267.52 274.19 278.88 282.71 289.07 299.49
298 256.77 259.37 261.34 264.31 268.48 275.17 279.87 283.71 290.09 300.53
299 257.71 260.32 262.29 265.27 269.44 276.15 280.86 284.71 291.10 301.57
300 258.65 261.26 263.23 266.22 270.41 277.13 281.85 285.71 292.12 302.62
350 305.70 308.58 310.76 314.06 318.69 326.15 331.42 335.74 342.94 354.82
400 352.99 356.13 358.50 362.10 367.16 375.33 381.13 385.89 393.86 407.08
450 400.49 403.87 406.43 410.31 415.78 424.63 430.94 436.13 444.85 459.40
500 448.16 451.77 454.50 458.66 464.52 474.04 480.83 486.44 495.90 511.75
550 495.97 499.80 502.70 507.12 513.36 523.52 530.79 536.81 547.00 564.14
600 543.90 547.94 551.01 555.68 562.29 573.08 580.82 587.24 598.13 616.55
650 591.94 596.19 599.42 604.33 611.30 622.69 630.89 637.71 649.30 668.98
700 640.07 644.52 647.90 653.06 660.37 672.36 681.01 688.22 700.50 721.43
750 688.28 692.93 696.46 701.85 709.51 722.08 731.17 738.76 751.73 773.89
800 736.57 741.40 745.09 750.71 758.69 771.84 781.36 789.33 802.97 826.37
850 784.92 789.94 793.77 799.61 807.92 821.63 831.59 839.93 854.24 878.86
900 833.33 838.54 842.51 848.57 857.20 871.46 881.84 890.55 905.53 931.36
950 881.80 887.19 891.29 897.57 906.51 921.32 932.12 941.19 956.83 983.87
1000 930.33 935.88 940.13 946.61 955.86 971.20 982.42 991.85 1008.14 1036.39
1050 978.89 984.62 989.00 995.69 1005.25 1021.12 1032.74 1042.53 1059.46 1088.92
1100 1027.50 1033.40 1037.91 1044.81 1054.66 1071.05 1083.08 1093.23 1110.80 1141.45
1150 1076.16 1082.22 1086.85 1093.95 1104.10 1121.01 1133.43 1143.94 1162.15 1193.99
... continued on next page
B

Appendix B – Erlang B Tables – continued
June 2001 B-11CDMA SC Products System Resource Guide (CSSRG)
Channels
N 5.0%3.0%2.0%1.5%1.0%0.5%0.3%0.2%0.15%0.1%
1200 1124.85 1131.07 1135.83 1143.13 1153.57 1170.98 1183.81 1194.66 1213.51 1246.53
1250 1173.57 1179.96 1184.84 1192.33 1203.06 1220.98 1234.19 1245.39 1264.87 1299.08
1300 1222.33 1228.87 1233.88 1241.56 1252.57 1270.99 1284.59 1296.14 1316.25 1351.63
1350 1271.12 1277.82 1282.95 1290.81 1302.10 1321.02 1335.01 1346.89 1367.63 1404.19
1400 1319.93 1326.79 1332.04 1340.09 1351.66 1371.06 1385.43 1397.66 1419.02 1456.75
1450 1368.78 1375.79 1381.15 1389.39 1401.23 1421.12 1435.87 1448.44 1470.42 1509.31
1500 1417.65 1424.81 1430.29 1438.71 1450.82 1471.19 1486.32 1499.22 1521.82 1561.88
1550 1466.55 1473.85 1479.45 1488.05 1500.43 1521.27 1536.78 1550.01 1573.22 1614.45
1600 1515.47 1522.91 1528.62 1537.40 1550.05 1571.36 1587.24 1600.81 1624.64 1667.02
1650 1564.41 1572.00 1577.82 1586.78 1599.69 1621.47 1637.72 1651.62 1676.05 1719.59
1700 1613.37 1621.10 1627.04 1636.17 1649.34 1671.58 1688.20 1702.43 1727.48 1772.17
1750 1662.35 1670.23 1676.27 1685.58 1699.00 1721.71 1738.70 1753.25 1778.90 1824.75
1800 1711.35 1719.37 1725.52 1735.00 1748.68 1771.84 1789.20 1804.08 1830.33 1877.33
1850 1760.37 1768.53 1774.79 1784.43 1798.37 1821.99 1839.70 1854.91 1881.77 1929.92
1900 1809.41 1817.70 1824.07 1833.88 1848.07 1872.14 1890.22 1905.75 1933.21 1982.50
1950 1858.46 1866.89 1873.36 1883.34 1897.78 1922.30 1940.74 1956.59 1984.65 2035.09
2000 1907.54 1916.10 1922.67 1932.82 1947.50 1972.47 1991.26 2007.44 2036.09 2087.68
2050 1956.62 1965.31 1972.00 1982.31 1997.24 2022.65 2041.79 2058.29 2087.54 2140.27
2100 2005.72 2014.55 2021.33 2031.81 2046.98 2072.83 2092.33 2109.15 2138.99 2192.86
2150 2054.84 2063.79 2070.68 2081.31 2096.73 2123.02 2142.87 2160.01 2190.44 2245.46
2200 2103.97 2113.05 2120.04 2130.84 2146.49 2173.22 2193.42 2210.87 2241.90 2298.05
2250 2153.11 2162.32 2169.41 2180.37 2196.26 2223.42 2243.97 2261.74 2293.36 2350.65
2300 2202.27 2211.61 2218.79 2229.91 2246.04 2273.63 2294.53 2312.61 2344.82 2403.24
2350 2251.43 2260.90 2268.19 2279.46 2295.82 2323.84 2345.09 2363.49 2396.28 2455.84
2400 2300.61 2310.21 2317.59 2329.02 2345.62 2374.06 2395.66 2414.37 2447.75 2508.44
2450 2349.80 2359.52 2367.00 2378.58 2395.42 2424.29 2446.23 2465.25 2499.22 2561.04
2500 2399.01 2408.85 2416.43 2428.16 2445.23 2474.52 2496.80 2516.14 2550.69 2613.64
2550 2448.22 2458.18 2465.86 2477.75 2495.04 2524.76 2547.38 2567.02 2602.16 2666.25
2600 2497.44 2507.53 2515.30 2527.34 2544.87 2575.00 2597.96 2617.92 2653.63 2718.85
2650 2546.68 2556.88 2564.75 2576.94 2594.69 2625.24 2648.55 2668.81 2705.11 2771.45
2700 2595.92 2606.25 2614.21 2626.55 2644.53 2675.49 2699.14 2719.71 2756.59 2824.06
2750 2645.18 2655.62 2663.68 2676.16 2694.37 2725.75 2749.73 2770.61 2808.07 2876.66
... continued on next page
B

Appendix B – Erlang B Tables – continued
CDMA SC Products System Resource Guide (CSSRG) June 2001B-12
Channels
N 5.0%3.0%2.0%1.5%1.0%0.5%0.3%0.2%0.15%0.1%
2800 2694.44 2705.00 2713.15 2725.79 2744.22 2776.01 2800.32 2821.51 2859.55 2929.27
2850 2743.71 2754.39 2762.63 2775.42 2794.07 2826.27 2850.92 2872.41 2911.03 2981.87
2900 2792.99 2803.79 2812.12 2825.05 2843.93 2876.54 2901.52 2923.32 2962.51 3034.48
2950 2842.28 2853.20 2861.62 2874.69 2893.79 2926.81 2952.13 2974.23 3014.00 3087.09
3000 2891.58 2902.61 2911.12 2924.34 2943.66 2977.08 3002.73 3025.14 3065.48 3139.70
3050 2940.88 2952.03 2960.64 2974.00 2993.54 3027.36 3053.34 3076.05 3116.97 3192.31
3100 2990.20 3001.46 3010.15 3023.66 3043.41 3077.64 3103.95 3126.97 3168.46 3244.92
3150 3039.52 3050.89 3059.68 3073.33 3093.30 3127.93 3154.57 3177.89 3219.95 3297.53
3200 3088.85 3100.33 3109.21 3123.00 3143.19 3178.22 3205.19 3228.81 3271.44 3350.14
3250 3138.18 3149.78 3158.75 3172.68 3193.08 3228.51 3255.81 3279.73 3322.93 3402.75
3300 3187.53 3199.24 3208.29 3222.36 3242.98 3278.80 3306.43 3330.65 3374.43 3455.36
3350 3236.88 3248.70 3257.84 3272.05 3292.88 3329.10 3357.05 3381.57 3425.92 3507.98
3400 3286.23 3298.17 3307.39 3321.74 3342.79 3379.40 3407.68 3432.50 3477.42 3560.59
3450 3335.60 3347.64 3356.95 3371.44 3392.70 3429.70 3458.31 3483.43 3528.91 3613.20
3500 3384.97 3397.12 3406.52 3421.15 3442.61 3480.01 3508.94 3534.36 3580.41 3665.82
3550 3434.34 3446.60 3456.09 3470.86 3492.53 3530.32 3559.57 3585.29 3631.91 3718.43
3600 3483.73 3496.09 3505.67 3520.57 3542.45 3580.63 3610.21 3636.22 3683.41 3771.04
3650 3533.12 3545.59 3555.25 3570.29 3592.38 3630.94 3660.84 3687.15 3734.91 3823.66
3700 3582.51 3595.09 3604.83 3620.01 3642.31 3681.26 3711.48 3738.09 3786.41 3876.27
3750 3631.91 3644.60 3654.43 3669.73 3692.24 3731.58 3762.12 3789.03 3837.91 3928.89
3800 3681.32 3694.11 3704.02 3719.47 3742.18 3781.90 3812.76 3839.96 3889.42 3981.51
3850 3730.73 3743.63 3753.62 3769.20 3792.12 3832.23 3863.41 3890.90 3940.92 4034.12
3900 3780.14 3793.15 3803.23 3818.94 3842.06 3882.55 3914.05 3941.84 3992.42 4086.74
3950 3829.57 3842.68 3852.84 3868.68 3892.01 3932.88 3964.70 3992.79 4043.93 4139.36
4000 3878.99 3892.21 3902.45 3918.43 3941.96 3983.21 4015.35 4043.73 4095.44 4191.97
B

Appendix B – Erlang B Tables – continued
June 2001 B-13CDMA SC Products System Resource Guide (CSSRG)
Erlang B Table for T1/E1 Spans
Table B-2: Erlang B Spans
Spans
T1
Circuits
T1 Erlangs
at 0.1%
T1 Erlangs
at 0.2%
T1 Erlangs
at 0.3%
E1
Circuits
E1 Erlangs
at 0.1%
E1 Erlangs
at 0.2%
E1 Erlangs
at 0.3%
1 24 12.24 13.01 13.51 30 16.68 17.61 18.20
2 48 30.88 32.20 33.06 60 40.79 42.35 43.36
3 72 50.94 52.72 53.87 90 66.48 68.56 69.90
4 96 71.73 73.90 75.30 120 92.96 95.48 97.12
5 120 92.96 95.48 97.12 150 119.94 122.86 124.76
6 144 114.51 117.36 119.20 180 147.26 150.56 152.70
7 168 136.30 139.45 141.49 210 174.84 178.49 180.85
8 192 158.27 161.70 163.94 240 202.62 206.60 209.18
9 216 180.38 184.10 186.51 270 230.57 234.86 237.64
10 240 202.62 206.60 209.18 300 258.65 263.23 266.22
11 264 224.97 229.19 231.94 330 286.84 291.72 294.90
12 288 247.40 251.87 254.78 360 315.14 320.29 323.65
13 312 269.91 274.62 277.68 390 343.52 348.94 352.48
14 336 292.50 297.43 300.64 420 371.97 377.65 381.37
15 360 315.14 320.29 323.65 450 400.49 406.43 410.31
16 384 337.83 343.20 346.71 480 429.08 435.26 439.30
17 408 360.58 366.16 369.80 510 457.71 464.13 468.34
18 432 383.37 389.15 392.94 540 486.40 493.05 497.42
19 456 406.21 412.19 416.10 570 515.13 522.01 526.54
20 480 429.08 435.26 439.30 600 543.90 551.01 555.68
21 504 451.98 458.35 462.53 630 572.71 580.04 584.86
22 528 474.92 481.48 485.78 660 601.55 609.11 614.07
23 552 497.88 504.63 509.06 690 630.43 638.20 643.31
24 576 520.88 527.81 532.36 720 659.34 667.32 672.57
25 600 543.90 551.01 555.68 750 688.28 696.46 701.85
26 624 566.94 574.24 579.03 780 717.24 725.63 731.16
27 648 590.01 597.48 602.39 810 746.23 754.82 760.48
28 672 613.10 620.74 625.77 840 775.24 784.03 789.83
29 696 636.21 644.02 649.16 870 804.28 813.26 819.19
30 720 659.34 667.32 672.57 900 833.33 842.51 848.57
... continued on next page
B

Appendix B – Erlang B Tables – continued
CDMA SC Products System Resource Guide (CSSRG) June 2001B-14
E1
Circuits
E1 Erlangs
at 0.3%
E1 Erlangs
at 0.2%
E1 Erlangs
at 0.1%Spans
T1 Erlangs
at 0.3%
T1 Erlangs
at 0.2%
T1 Erlangs
at 0.1%
T1
Circuits
31 744 682.49 690.63 695.99 930 862.41 871.77 877.97
32 768 705.65 713.96 719.43 960 891.50 901.06 907.38
33 792 728.83 737.30 742.89 990 920.62 930.36 936.80
34 816 752.03 760.66 766.35 1020 949.75 959.67 966.24
35 840 775.24 784.03 789.83 1050 978.89 989.00 995.69
36 864 798.47 807.41 813.32 1080 1008.06 1018.34 1025.16
37 888 821.71 830.81 836.82 1110 1037.23 1047.69 1054.63
38 912 844.96 854.21 860.33 1140 1066.42 1077.06 1084.12
39 936 868.23 877.63 883.85 1170 1095.63 1106.44 1113.62
40 960 891.50 901.06 907.38 1200 1124.85 1135.83 1143.13
41 984 914.79 924.50 930.91 1230 1154.08 1165.24 1172.65
42 1008 938.09 947.94 954.46 1260 1183.32 1194.65 1202.17
43 1032 961.40 971.40 978.02 1290 1212.57 1224.07 1231.71
44 1056 984.72 994.87 1001.58 1320 1241.84 1253.50 1261.26
45 1080 1008.06 1018.34 1025.16 1350 1271.12 1282.95 1290.81
46 1104 1031.40 1041.82 1048.74 1380 1300.40 1312.40 1320.38
47 1128 1054.75 1065.31 1072.32 1410 1329.70 1341.86 1349.95
48 1152 1078.10 1088.81 1095.92 1440 1359.01 1371.33 1379.53
49 1176 1101.47 1112.32 1119.52 1470 1388.33 1400.80 1409.12
50 1200 1124.85 1135.83 1143.13 1500 1417.65 1430.29 1438.71
51 1224 1148.23 1159.35 1166.74 1530 1446.99 1459.78 1468.31
52 1248 1171.62 1182.88 1190.36 1560 1476.33 1489.28 1497.92
53 1272 1195.02 1206.42 1213.99 1590 1505.68 1518.79 1527.53
54 1296 1218.43 1229.96 1237.62 1620 1535.04 1548.30 1557.15
55 1320 1241.84 1253.50 1261.26 1650 1564.41 1577.82 1586.78
56 1344 1265.26 1277.06 1284.90 1680 1593.78 1607.35 1616.41
57 1368 1288.69 1300.62 1308.55 1710 1623.16 1636.88 1646.05
58 1392 1312.12 1324.18 1332.21 1740 1652.55 1666.42 1675.69
59 1416 1335.56 1347.75 1355.86 1770 1681.95 1695.97 1705.34
60 1440 1359.01 1371.33 1379.53 1800 1711.35 1725.52 1735.00
61 1464 1382.46 1394.91 1403.20 1830 1740.76 1755.08 1764.66
62 1488 1405.92 1418.49 1426.87 1860 1770.18 1784.64 1794.32
... continued on next page
B

Appendix B – Erlang B Tables – continued
June 2001 B-15CDMA SC Products System Resource Guide (CSSRG)
E1
Circuits
E1 Erlangs
at 0.3%
E1 Erlangs
at 0.2%
E1 Erlangs
at 0.1%Spans
T1 Erlangs
at 0.3%
T1 Erlangs
at 0.2%
T1 Erlangs
at 0.1%
T1
Circuits
63 1512 1429.38 1442.08 1450.55 1890 1799.60 1814.21 1823.99
64 1536 1452.85 1465.68 1474.23 1920 1829.03 1843.78 1853.67
65 1560 1476.33 1489.28 1497.92 1950 1858.46 1873.36 1883.34
66 1584 1499.81 1512.88 1521.61 1980 1887.91 1902.95 1913.03
67 1608 1523.29 1536.49 1545.30 2010 1917.35 1932.54 1942.72
68 1632 1546.79 1560.11 1569.00 2040 1946.80 1962.13 1972.41
69 1656 1570.28 1583.73 1592.70 2070 1976.26 1991.73 2002.10
70 1680 1593.78 1607.35 1616.41 2100 2005.72 2021.33 2031.81
71 1704 1617.29 1630.98 1640.12 2130 2035.19 2050.94 2061.51
72 1728 1640.80 1654.61 1663.84 2160 2064.66 2080.55 2091.22
73 1752 1664.31 1678.24 1687.55 2190 2094.14 2110.17 2120.93
74 1776 1687.83 1701.88 1711.27 2220 2123.62 2139.79 2150.65
75 1800 1711.35 1725.52 1735.00 2250 2153.11 2169.41 2180.37
76 1824 1734.88 1749.17 1758.72 2280 2182.60 2199.04 2210.09
77 1848 1758.41 1772.82 1782.46 2310 2212.10 2228.67 2239.82
78 1872 1781.95 1796.47 1806.19 2340 2241.60 2258.31 2269.55
79 1896 1805.49 1820.12 1829.93 2370 2271.10 2287.95 2299.28
80 1920 1829.03 1843.78 1853.67 2400 2300.61 2317.59 2329.02
81 1944 1852.58 1867.45 1877.41 2430 2330.13 2347.24 2358.76
82 1968 1876.13 1891.11 1901.15 2460 2359.64 2376.89 2388.50
83 1992 1899.68 1914.78 1924.90 2490 2389.17 2406.54 2418.24
84 2016 1923.24 1938.45 1948.65 2520 2418.69 2436.20 2447.99
85 2040 1946.80 1962.13 1972.41 2550 2448.22 2465.86 2477.75
86 2064 1970.37 1985.81 1996.17 2580 2477.75 2495.52 2507.50
87 2088 1993.94 2009.49 2019.92 2610 2507.29 2525.19 2537.26
88 2112 2017.51 2033.17 2043.69 2640 2536.83 2554.86 2567.02
89 2136 2041.08 2056.86 2067.45 2670 2566.37 2584.53 2596.78
90 2160 2064.66 2080.55 2091.22 2700 2595.92 2614.21 2626.55
91 2184 2088.24 2104.24 2114.99 2730 2625.47 2643.89 2656.32
92 2208 2111.83 2127.94 2138.76 2760 2655.03 2673.57 2686.09
93 2232 2135.42 2151.64 2162.53 2790 2684.59 2703.26 2715.86
94 2256 2159.01 2175.34 2186.31 2820 2714.15 2732.94 2745.64
... continued on next page
B

Appendix B – Erlang B Tables – continued
CDMA SC Products System Resource Guide (CSSRG) June 2001B-16
E1
Circuits
E1 Erlangs
at 0.3%
E1 Erlangs
at 0.2%
E1 Erlangs
at 0.1%Spans
T1 Erlangs
at 0.3%
T1 Erlangs
at 0.2%
T1 Erlangs
at 0.1%
T1
Circuits
95 2280 2182.60 2199.04 2210.09 2850 2743.71 2762.63 2775.42
96 2304 2206.20 2222.74 2233.87 2880 2773.28 2792.33 2805.20
97 2328 2229.80 2246.45 2257.65 2910 2802.85 2822.02 2834.98
98 2352 2253.40 2270.16 2281.44 2940 2832.42 2851.72 2864.77
99 2376 2277.00 2293.88 2305.23 2970 2862.00 2881.42 2894.55
100 2400 2300.61 2317.59 2329.02 3000 2891.58 2911.12 2924.34
B

June 2001 CDMA SC Products System Resource Guide (CSSRG)
Appendix C: Erlang C Tables
Appendix Content
Erlang C Tables C-1. . . . . . . . . . . . . . . . . . . . . . . . . . . . . . . . . . . . . . . . . . . . . . . . . . Blocking Erlangs using the Erlang C Model C-1. . . . . . . . . . . . . . . . . . . . . Erlang C Table for T1/E1 Spans C-13. . . . . . . . . . . . . . . . . . . . . . . . . . . . . .
C

Table of Contents – continued
CDMA SC Products System Resource Guide (CSSRG) June 2001
Notes
C

Appendix C – Erlang C Tables
June 2001 C-1CDMA SC Products System Resource Guide (CSSRG)
Blocking Erlangs using theErlang C Model
Table C-1: Erlangs per Blocking
Channels
N 0.1% 0.15% 0.2% 0.3% 0.5% 1.0% 1.5% 2.0% 3.0% 5.0%
1 0.00 0.00 0.00 0.00 0.00 0.01 0.01 0.02 0.03 0.05
2 0.05 0.06 0.06 0.08 0.10 0.15 0.18 0.21 0.26 0.34
3 0.19 0.22 0.24 0.28 0.33 0.43 0.50 0.55 0.65 0.79
4 0.43 0.48 0.51 0.58 0.66 0.81 0.91 0.99 1.12 1.32
5 0.73 0.80 0.86 0.94 1.07 1.26 1.39 1.50 1.66 1.91
6 1.10 1.19 1.26 1.37 1.52 1.76 1.92 2.05 2.24 2.53
7 1.51 1.62 1.71 1.83 2.01 2.30 2.49 2.63 2.86 3.19
8 1.96 2.09 2.19 2.34 2.54 2.87 3.08 3.25 3.50 3.87
9 2.44 2.58 2.70 2.87 3.10 3.46 3.70 3.88 4.17 4.57
10 2.94 3.11 3.23 3.42 3.68 4.08 4.34 4.54 4.85 5.29
11 3.47 3.65 3.79 4.00 4.28 4.71 5.00 5.21 5.55 6.02
12 4.02 4.22 4.37 4.59 4.90 5.36 5.67 5.90 6.26 6.76
13 4.58 4.80 4.96 5.20 5.53 6.03 6.35 6.60 6.98 7.51
14 5.17 5.40 5.57 5.82 6.17 6.71 7.05 7.31 7.71 8.27
15 5.76 6.01 6.19 6.46 6.83 7.39 7.76 8.04 8.46 9.04
16 6.37 6.63 6.82 7.11 7.50 8.09 8.48 8.77 9.21 9.82
17 6.99 7.26 7.47 7.77 8.18 8.80 9.20 9.51 9.97 10.61
18 7.62 7.91 8.12 8.44 8.87 9.52 9.94 10.25 10.73 11.40
19 8.26 8.56 8.79 9.12 9.57 10.24 10.68 11.01 11.50 12.20
20 8.91 9.23 9.46 9.81 10.27 10.97 11.42 11.77 12.28 13.00
21 9.57 9.90 10.14 10.50 10.98 11.71 12.18 12.53 13.07 13.81
22 10.24 10.58 10.83 11.20 11.70 12.46 12.94 13.30 13.85 14.62
23 10.91 11.26 11.52 11.91 12.43 13.21 13.70 14.08 14.65 15.43
24 11.59 11.96 12.22 12.62 13.16 13.96 14.47 14.86 15.45 16.25
25 12.28 12.65 12.93 13.34 13.90 14.72 15.25 15.65 16.25 17.08
26 12.97 13.36 13.65 14.07 14.64 15.49 16.03 16.44 17.05 17.91
27 13.67 14.07 14.36 14.80 15.38 16.26 16.81 17.23 17.86 18.74
28 14.38 14.79 15.09 15.53 16.14 17.03 17.60 18.03 18.68 19.57
29 15.09 15.51 15.82 16.28 16.89 17.81 18.39 18.83 19.49 20.41
... continued on next page
C

Appendix C – Erlang C Tables – continued
CDMA SC Products System Resource Guide (CSSRG) June 2001C-2
Channels
N 5.0%3.0%2.0%1.5%1.0%0.5%0.3%0.2%0.15%0.1%
30 15.80 16.23 16.55 17.02 17.65 18.59 19.19 19.64 20.31 21.25
31 16.52 16.96 17.29 17.77 18.41 19.37 19.99 20.45 21.14 22.09
32 17.25 17.70 18.03 18.52 19.18 20.16 20.79 21.26 21.96 22.93
33 17.97 18.43 18.78 19.28 19.95 20.95 21.59 22.07 22.79 23.78
34 18.71 19.18 19.52 20.04 20.73 21.75 22.40 22.89 23.62 24.63
35 19.44 19.92 20.28 20.80 21.51 22.55 23.21 23.71 24.45 25.48
36 20.18 20.67 21.03 21.57 22.29 23.35 24.02 24.53 25.29 26.33
37 20.92 21.42 21.79 22.34 23.07 24.15 24.84 25.35 26.13 27.19
38 21.67 22.18 22.56 23.11 23.86 24.96 25.66 26.18 26.97 28.05
39 22.42 22.94 23.32 23.89 24.65 25.77 26.48 27.01 27.81 28.91
40 23.17 23.70 24.09 24.67 25.44 26.58 27.30 27.84 28.66 29.77
41 23.93 24.47 24.87 25.45 26.23 27.39 28.12 28.68 29.50 30.63
42 24.69 25.24 25.64 26.24 27.03 28.21 28.95 29.51 30.35 31.50
43 25.45 26.01 26.42 27.02 27.83 29.02 29.78 30.35 31.20 32.36
44 26.22 26.78 27.20 27.81 28.63 29.84 30.61 31.19 32.05 33.23
45 26.98 27.56 27.98 28.60 29.44 30.67 31.45 32.03 32.90 34.10
46 27.75 28.33 28.77 29.40 30.24 31.49 32.28 32.87 33.76 34.97
47 28.52 29.12 29.55 30.19 31.05 32.32 33.12 33.72 34.62 35.84
48 29.30 29.90 30.34 30.99 31.86 33.14 33.96 34.56 35.47 36.72
49 30.08 30.68 31.13 31.79 32.67 33.97 34.80 35.41 36.33 37.59
50 30.86 31.47 31.93 32.60 33.49 34.80 35.64 36.26 37.19 38.47
51 31.64 32.26 32.72 33.40 34.31 35.64 36.48 37.11 38.06 39.35
52 32.42 33.05 33.52 34.21 35.12 36.47 37.33 37.97 38.92 40.22
53 33.21 33.85 34.32 35.02 35.94 37.31 38.17 38.82 39.78 41.10
54 33.99 34.64 35.12 35.83 36.76 38.15 39.02 39.67 40.65 41.99
55 34.78 35.44 35.93 36.64 37.59 38.98 39.87 40.53 41.52 42.87
56 35.57 36.24 36.73 37.45 38.41 39.83 40.72 41.39 42.39 43.75
57 36.37 37.04 37.54 38.27 39.24 40.67 41.57 42.25 43.26 44.63
58 37.16 37.84 38.35 39.08 40.07 41.51 42.42 43.11 44.13 45.52
59 37.96 38.65 39.16 39.90 40.90 42.36 43.28 43.97 45.00 46.41
60 38.76 39.45 39.97 40.72 41.73 43.20 44.13 44.83 45.87 47.29
61 39.56 40.26 40.78 41.54 42.56 44.05 44.99 45.70 46.75 48.18
... continued on next page
C

Appendix C – Erlang C Tables – continued
June 2001 C-3CDMA SC Products System Resource Guide (CSSRG)
Channels
N 5.0%3.0%2.0%1.5%1.0%0.5%0.3%0.2%0.15%0.1%
62 40.36 41.07 41.60 42.37 43.39 44.90 45.85 46.56 47.62 49.07
63 41.16 41.88 42.41 43.19 44.23 45.75 46.71 47.43 48.50 49.96
64 41.97 42.69 43.23 44.02 45.06 46.60 47.57 48.29 49.38 50.85
65 42.77 43.51 44.05 44.84 45.90 47.45 48.43 49.16 50.25 51.74
66 43.58 44.32 44.87 45.67 46.74 48.30 49.29 50.03 51.13 52.63
67 44.39 45.14 45.69 46.50 47.58 49.16 50.16 50.90 52.01 53.53
68 45.20 45.96 46.52 47.33 48.42 50.01 51.02 51.77 52.89 54.42
69 46.01 46.78 47.34 48.16 49.26 50.87 51.89 52.65 53.78 55.32
70 46.83 47.60 48.17 49.00 50.10 51.73 52.75 53.52 54.66 56.21
71 47.64 48.42 48.99 49.83 50.95 52.59 53.62 54.39 55.54 57.11
72 48.46 49.24 49.82 50.67 51.79 53.45 54.49 55.27 56.43 58.01
73 49.28 50.07 50.65 51.50 52.64 54.31 55.36 56.14 57.31 58.90
74 50.10 50.89 51.48 52.34 53.49 55.17 56.23 57.02 58.20 59.80
75 50.91 51.72 52.31 53.18 54.34 56.03 57.10 57.90 59.08 60.70
76 51.74 52.55 53.15 54.02 55.19 56.89 57.97 58.77 59.97 61.60
77 52.56 53.38 53.98 54.86 56.04 57.76 58.84 59.65 60.86 62.50
78 53.38 54.21 54.81 55.70 56.89 58.62 59.72 60.53 61.75 63.40
79 54.21 55.04 55.65 56.55 57.74 59.49 60.59 61.41 62.64 64.30
80 55.03 55.87 56.49 57.39 58.59 60.36 61.47 62.30 63.53 65.21
81 55.86 56.70 57.33 58.24 59.45 61.22 62.34 63.18 64.42 66.11
82 56.69 57.54 58.17 59.08 60.30 62.09 63.22 64.06 65.31 67.01
83 57.51 58.37 59.01 59.93 61.16 62.96 64.10 64.94 66.20 67.92
84 58.34 59.21 59.85 60.78 62.02 63.83 64.97 65.83 67.10 68.82
85 59.18 60.05 60.69 61.63 62.88 64.70 65.85 66.71 67.99 69.73
86 60.01 60.89 61.53 62.48 63.73 65.57 66.73 67.60 68.88 70.63
87 60.84 61.72 62.37 63.33 64.59 66.45 67.61 68.48 69.78 71.54
88 61.67 62.56 63.22 64.18 65.45 67.32 68.49 69.37 70.67 72.45
89 62.51 63.41 64.07 65.03 66.32 68.19 69.38 70.26 71.57 73.35
90 63.34 64.25 64.91 65.88 67.18 69.07 70.26 71.15 72.47 74.26
91 64.18 65.09 65.76 66.74 68.04 69.94 71.14 72.04 73.36 75.17
92 65.02 65.93 66.61 67.59 68.90 70.82 72.02 72.92 74.26 76.08
93 65.86 66.78 67.46 68.45 69.77 71.70 72.91 73.81 75.16 76.99
... continued on next page
C

Appendix C – Erlang C Tables – continued
CDMA SC Products System Resource Guide (CSSRG) June 2001C-4
Channels
N 5.0%3.0%2.0%1.5%1.0%0.5%0.3%0.2%0.15%0.1%
94 66.70 67.62 68.31 69.30 70.63 72.57 73.79 74.70 76.06 77.90
95 67.54 68.47 69.16 70.16 71.50 73.45 74.68 75.60 76.96 78.81
96 68.38 69.32 70.01 71.02 72.36 74.33 75.57 76.49 77.86 79.72
97 69.22 70.16 70.86 71.88 73.23 75.21 76.45 77.38 78.76 80.63
98 70.06 71.01 71.71 72.74 74.10 76.09 77.34 78.27 79.66 81.54
99 70.90 71.86 72.57 73.60 74.97 76.97 78.23 79.17 80.56 82.46
100 71.75 72.71 73.42 74.46 75.84 77.85 79.12 80.06 81.46 83.37
101 72.59 73.56 74.28 75.32 76.71 78.73 80.00 80.95 82.37 84.28
102 73.44 74.41 75.13 76.18 77.58 79.61 80.89 81.85 83.27 85.20
103 74.28 75.27 75.99 77.04 78.45 80.50 81.78 82.74 84.17 86.11
104 75.13 76.12 76.85 77.91 79.32 81.38 82.67 83.64 85.08 87.02
105 75.98 76.97 77.70 78.77 80.19 82.26 83.57 84.54 85.98 87.94
106 76.83 77.83 78.56 79.64 81.06 83.15 84.46 85.43 86.88 88.85
107 77.68 78.68 79.42 80.50 81.94 84.03 85.35 86.33 87.79 89.77
108 78.53 79.54 80.28 81.37 82.81 84.92 86.24 87.23 88.70 90.69
109 79.38 80.39 81.14 82.23 83.68 85.80 87.13 88.13 89.60 91.60
110 80.23 81.25 82.00 83.10 84.56 86.69 88.03 89.03 90.51 92.52
111 81.08 82.11 82.86 83.97 85.44 87.58 88.92 89.93 91.41 93.44
112 81.93 82.97 83.73 84.84 86.31 88.46 89.82 90.83 92.32 94.35
113 82.79 83.83 84.59 85.71 87.19 89.35 90.71 91.73 93.23 95.27
114 83.64 84.69 85.45 86.58 88.07 90.24 91.61 92.63 94.14 96.19
115 84.49 85.55 86.32 87.45 88.94 91.13 92.50 93.53 95.05 97.11
116 85.35 86.41 87.18 88.32 89.82 92.02 93.40 94.43 95.96 98.03
117 86.21 87.27 88.05 89.19 90.70 92.91 94.30 95.33 96.87 98.95
118 87.06 88.13 88.91 90.06 91.58 93.80 95.19 96.23 97.78 99.87
119 87.92 88.99 89.78 90.93 92.46 94.69 96.09 97.14 98.69 100.79
120 88.78 89.86 90.65 91.81 93.34 95.58 96.99 98.04 99.60 101.71
121 89.64 90.72 91.51 92.68 94.22 96.47 97.89 98.94 100.51 102.63
122 90.49 91.58 92.38 93.55 95.10 97.37 98.79 99.85 101.42 103.55
123 91.35 92.45 93.25 94.43 95.99 98.26 99.69 100.75 102.33 104.47
124 92.21 93.31 94.12 95.30 96.87 99.15 100.59 101.66 103.24 105.39
125 93.07 94.18 94.99 96.18 97.75 100.05 101.49 102.56 104.15 106.31
... continued on next page
C

Appendix C – Erlang C Tables – continued
June 2001 C-5CDMA SC Products System Resource Guide (CSSRG)
Channels
N 5.0%3.0%2.0%1.5%1.0%0.5%0.3%0.2%0.15%0.1%
126 93.94 95.05 95.86 97.05 98.63 100.94 102.39 103.47 105.07 107.24
127 94.80 95.91 96.73 97.93 99.52 101.83 103.29 104.37 105.98 108.16
128 95.66 96.78 97.60 98.81 100.40 102.73 104.19 105.28 106.89 109.08
129 96.52 97.65 98.48 99.68 101.29 103.62 105.09 106.18 107.81 110.00
130 97.38 98.52 99.35 100.56 102.17 104.52 105.99 107.09 108.72 110.93
131 98.25 99.39 100.22 101.44 103.06 105.42 106.90 108.00 109.64 111.85
132 99.11 100.25 101.09 102.32 103.94 106.31 107.80 108.91 110.55 112.78
133 99.98 101.12 101.97 103.20 104.83 107.21 108.70 109.81 111.46 113.70
134 100.84 102.00 102.84 104.08 105.72 108.11 109.61 110.72 112.38 114.63
135 101.71 102.87 103.72 104.96 106.60 109.00 110.51 111.63 113.30 115.55
136 102.58 103.74 104.59 105.84 107.49 109.90 111.41 112.54 114.21 116.48
137 103.44 104.61 105.47 106.72 108.38 110.80 112.32 113.45 115.13 117.40
138 104.31 105.48 106.34 107.60 109.27 111.70 113.22 114.36 116.04 118.33
139 105.18 106.35 107.22 108.48 110.16 112.60 114.13 115.27 116.96 119.25
140 106.05 107.23 108.10 109.37 111.05 113.50 115.04 116.18 117.88 120.18
141 106.91 108.10 108.97 110.25 111.94 114.40 115.94 117.09 118.80 121.11
142 107.78 108.98 109.85 111.13 112.83 115.30 116.85 118.00 119.71 122.03
143 108.65 109.85 110.73 112.02 113.72 116.20 117.75 118.91 120.63 122.96
144 109.52 110.73 111.61 112.90 114.61 117.10 118.66 119.83 121.55 123.89
145 110.39 111.60 112.49 113.78 115.50 118.00 119.57 120.74 122.47 124.81
146 111.26 112.48 113.37 114.67 116.39 118.90 120.48 121.65 123.39 125.74
147 112.14 113.35 114.25 115.55 117.28 119.80 121.39 122.56 124.31 126.67
148 113.01 114.23 115.13 116.44 118.18 120.71 122.29 123.47 125.23 127.60
149 113.88 115.11 116.01 117.32 119.07 121.61 123.20 124.39 126.15 128.53
150 114.75 115.98 116.89 118.21 119.96 122.51 124.11 125.30 127.07 129.46
151 115.63 116.86 117.77 119.10 120.85 123.41 125.02 126.22 127.99 130.39
152 116.50 117.74 118.65 119.98 121.75 124.32 125.93 127.13 128.91 131.31
153 117.37 118.62 119.54 120.87 122.64 125.22 126.84 128.04 129.83 132.24
154 118.25 119.50 120.42 121.76 123.54 126.13 127.75 128.96 130.75 133.17
155 119.12 120.38 121.30 122.65 124.43 127.03 128.66 129.87 131.67 134.10
156 120.00 121.26 122.18 123.54 125.33 127.94 129.57 130.79 132.59 135.03
157 120.87 122.14 123.07 124.43 126.22 128.84 130.48 131.70 133.51 135.96
... continued on next page
C

Appendix C – Erlang C Tables – continued
CDMA SC Products System Resource Guide (CSSRG) June 2001C-6
Channels
N 5.0%3.0%2.0%1.5%1.0%0.5%0.3%0.2%0.15%0.1%
158 121.75 123.02 123.95 125.31 127.12 129.75 131.39 132.62 134.44 136.90
159 122.63 123.90 124.84 126.20 128.02 130.65 132.30 133.53 135.36 137.83
160 123.50 124.78 125.72 127.09 128.91 131.56 133.22 134.45 136.28 138.76
161 124.38 125.66 126.61 127.98 129.81 132.46 134.13 135.37 137.20 139.69
162 125.26 126.55 127.49 128.88 130.71 133.37 135.04 136.28 138.13 140.62
163 126.13 127.43 128.38 129.77 131.60 134.28 135.95 137.20 139.05 141.55
164 127.01 128.31 129.27 130.66 132.50 135.18 136.87 138.12 139.97 142.48
165 127.89 129.20 130.15 131.55 133.40 136.09 137.78 139.04 140.90 143.42
166 128.77 130.08 131.04 132.44 134.30 137.00 138.69 139.95 141.82 144.35
167 129.65 130.96 131.93 133.33 135.20 137.91 139.61 140.87 142.75 145.28
168 130.53 131.85 132.81 134.23 136.10 138.82 140.52 141.79 143.67 146.21
169 131.41 132.73 133.70 135.12 136.99 139.72 141.44 142.71 144.59 147.15
170 132.29 133.62 134.59 136.01 137.89 140.63 142.35 143.63 145.52 148.08
171 133.17 134.50 135.48 136.91 138.79 141.54 143.26 144.55 146.44 149.01
172 134.05 135.39 136.37 137.80 139.69 142.45 144.18 145.46 147.37 149.95
173 134.93 136.27 137.26 138.69 140.59 143.36 145.09 146.38 148.30 150.88
174 135.82 137.16 138.15 139.59 141.50 144.27 146.01 147.30 149.22 151.81
175 136.70 138.05 139.04 140.48 142.40 145.18 146.93 148.22 150.15 152.75
176 137.58 138.93 139.93 141.38 143.30 146.09 147.84 149.14 151.07 153.68
177 138.46 139.82 140.82 142.27 144.20 147.00 148.76 150.06 152.00 154.62
178 139.35 140.71 141.71 143.17 145.10 147.91 149.67 150.98 152.93 155.55
179 140.23 141.60 142.60 144.07 146.00 148.82 150.59 151.91 153.85 156.49
180 141.11 142.49 143.49 144.96 146.91 149.74 151.51 152.83 154.78 157.42
181 142.00 143.37 144.38 145.86 147.81 150.65 152.43 153.75 155.71 158.36
182 142.88 144.26 145.28 146.75 148.71 151.56 153.34 154.67 156.63 159.29
183 143.77 145.15 146.17 147.65 149.61 152.47 154.26 155.59 157.56 160.23
184 144.65 146.04 147.06 148.55 150.52 153.38 155.18 156.51 158.49 161.16
185 145.54 146.93 147.95 149.45 151.42 154.30 156.10 157.43 159.42 162.10
186 146.42 147.82 148.85 150.34 152.33 155.21 157.01 158.36 160.35 163.04
187 147.31 148.71 149.74 151.24 153.23 156.12 157.93 159.28 161.27 163.97
188 148.20 149.60 150.63 152.14 154.13 157.03 158.85 160.20 162.20 164.91
189 149.08 150.49 151.53 153.04 155.04 157.95 159.77 161.13 163.13 165.84
... continued on next page
C

Appendix C – Erlang C Tables – continued
June 2001 C-7CDMA SC Products System Resource Guide (CSSRG)
Channels
N 5.0%3.0%2.0%1.5%1.0%0.5%0.3%0.2%0.15%0.1%
190 149.97 151.38 152.42 153.94 155.94 158.86 160.69 162.05 164.06 166.78
191 150.86 152.28 153.32 154.84 156.85 159.78 161.61 162.97 164.99 167.72
192 151.74 153.17 154.21 155.74 157.76 160.69 162.53 163.89 165.92 168.66
193 152.63 154.06 155.11 156.64 158.66 161.60 163.45 164.82 166.85 169.59
194 153.52 154.95 156.00 157.54 159.57 162.52 164.37 165.74 167.78 170.53
195 154.41 155.85 156.90 158.44 160.47 163.43 165.29 166.67 168.71 171.47
196 155.30 156.74 157.80 159.34 161.38 164.35 166.21 167.59 169.64 172.41
197 156.19 157.63 158.69 160.24 162.29 165.26 167.13 168.52 170.57 173.34
198 157.07 158.52 159.59 161.14 163.19 166.18 168.05 169.44 171.50 174.28
199 157.96 159.42 160.49 162.04 164.10 167.10 168.97 170.37 172.43 175.22
200 158.85 160.31 161.38 162.94 165.01 168.01 169.89 171.29 173.36 176.16
201 159.74 161.21 162.28 163.85 165.92 168.93 170.81 172.22 174.29 177.10
202 160.63 162.10 163.18 164.75 166.82 169.84 171.74 173.14 175.22 178.04
203 161.53 163.00 164.08 165.65 167.73 170.76 172.66 174.07 176.15 178.97
204 162.42 163.89 164.97 166.55 168.64 171.68 173.58 174.99 177.08 179.91
205 163.31 164.79 165.87 167.46 169.55 172.59 174.50 175.92 178.02 180.85
206 164.20 165.68 166.77 168.36 170.46 173.51 175.42 176.84 178.95 181.79
207 165.09 166.58 167.67 169.26 171.37 174.43 176.35 177.77 179.88 182.73
208 165.98 167.47 168.57 170.16 172.28 175.35 177.27 178.70 180.81 183.67
209 166.87 168.37 169.47 171.07 173.19 176.26 178.19 179.62 181.74 184.61
210 167.77 169.27 170.37 171.97 174.10 177.18 179.11 180.55 182.68 185.55
211 168.66 170.16 171.27 172.88 175.01 178.10 180.04 181.48 183.61 186.49
212 169.55 171.06 172.17 173.78 175.92 179.02 180.96 182.40 184.54 187.43
213 170.45 171.96 173.07 174.69 176.83 179.94 181.89 183.33 185.48 188.37
214 171.34 172.86 173.97 175.59 177.74 180.86 182.81 184.26 186.41 189.31
215 172.23 173.75 174.87 176.50 178.65 181.77 183.73 185.19 187.34 190.25
216 173.13 174.65 175.77 177.40 179.56 182.69 184.66 186.12 188.27 191.19
217 174.02 175.55 176.67 178.31 180.47 183.61 185.58 187.04 189.21 192.13
218 174.92 176.45 177.57 179.21 181.38 184.53 186.51 187.97 190.14 193.07
219 175.81 177.35 178.47 180.12 182.29 185.45 187.43 188.90 191.08 194.02
220 176.70 178.25 179.38 181.02 183.20 186.37 188.36 189.83 192.01 194.96
221 177.60 179.15 180.28 181.93 184.12 187.29 189.28 190.76 192.94 195.90
... continued on next page
C

Appendix C – Erlang C Tables – continued
CDMA SC Products System Resource Guide (CSSRG) June 2001C-8
Channels
N 5.0%3.0%2.0%1.5%1.0%0.5%0.3%0.2%0.15%0.1%
222 178.50 180.04 181.18 182.84 185.03 188.21 190.21 191.69 193.88 196.84
223 179.39 180.94 182.08 183.74 185.94 189.13 191.13 192.62 194.81 197.78
224 180.29 181.84 182.99 184.65 186.85 190.05 192.06 193.54 195.75 198.72
225 181.18 182.74 183.89 185.56 187.77 190.97 192.98 194.47 196.68 199.67
226 182.08 183.64 184.79 186.47 188.68 191.90 193.91 195.40 197.62 200.61
227 182.98 184.54 185.70 187.37 189.59 192.82 194.83 196.33 198.55 201.55
228 183.87 185.45 186.60 188.28 190.51 193.74 195.76 197.26 199.49 202.49
229 184.77 186.35 187.50 189.19 191.42 194.66 196.69 198.19 200.42 203.43
230 185.67 187.25 188.41 190.10 192.33 195.58 197.61 199.12 201.36 204.38
231 186.56 188.15 189.31 191.01 193.25 196.50 198.54 200.05 202.29 205.32
232 187.46 189.05 190.22 191.91 194.16 197.42 199.47 200.98 203.23 206.26
233 188.36 189.95 191.12 192.82 195.08 198.35 200.39 201.91 204.17 207.21
234 189.26 190.85 192.03 193.73 195.99 199.27 201.32 202.85 205.10 208.15
235 190.16 191.76 192.93 194.64 196.90 200.19 202.25 203.78 206.04 209.09
236 191.05 192.66 193.84 195.55 197.82 201.11 203.18 204.71 206.97 210.03
237 191.95 193.56 194.74 196.46 198.73 202.04 204.10 205.64 207.91 210.98
238 192.85 194.46 195.65 197.37 199.65 202.96 205.03 206.57 208.85 211.92
239 193.75 195.37 196.55 198.28 200.56 203.88 205.96 207.50 209.78 212.87
240 194.65 196.27 197.46 199.19 201.48 204.81 206.89 208.43 210.72 213.81
241 195.55 197.17 198.36 200.10 202.40 205.73 207.82 209.36 211.66 214.75
242 196.45 198.08 199.27 201.01 203.31 206.65 208.74 210.30 212.59 215.70
243 197.35 198.98 200.18 201.92 204.23 207.58 209.67 211.23 213.53 216.64
244 198.25 199.89 201.08 202.83 205.14 208.50 210.60 212.16 214.47 217.59
245 199.15 200.79 201.99 203.74 206.06 209.42 211.53 213.09 215.41 218.53
246 200.05 201.69 202.90 204.66 206.98 210.35 212.46 214.03 216.34 219.47
247 200.95 202.60 203.81 205.57 207.89 211.27 213.39 214.96 217.28 220.42
248 201.85 203.50 204.71 206.48 208.81 212.20 214.32 215.89 218.22 221.36
249 202.76 204.41 205.62 207.39 209.73 213.12 215.25 216.82 219.16 222.31
250 203.66 205.31 206.53 208.30 210.65 214.05 216.18 217.76 220.10 223.25
251 204.56 206.22 207.44 209.21 211.56 214.97 217.11 218.69 221.03 224.20
252 205.46 207.13 208.35 210.13 212.48 215.90 218.04 219.62 221.97 225.14
253 206.36 208.03 209.25 211.04 213.40 216.82 218.97 220.56 222.91 226.09
... continued on next page
C

Appendix C – Erlang C Tables – continued
June 2001 C-9CDMA SC Products System Resource Guide (CSSRG)
Channels
N 5.0%3.0%2.0%1.5%1.0%0.5%0.3%0.2%0.15%0.1%
254 207.26 208.94 210.16 211.95 214.32 217.75 219.90 221.49 223.85 227.03
255 208.17 209.84 211.07 212.87 215.23 218.67 220.83 222.42 224.79 227.98
256 209.07 210.75 211.98 213.78 216.15 219.60 221.76 223.36 225.73 228.93
257 209.97 211.66 212.89 214.69 217.07 220.53 222.69 224.29 226.67 229.87
258 210.87 212.56 213.80 215.60 217.99 221.45 223.62 225.22 227.60 230.82
259 211.78 213.47 214.71 216.52 218.91 222.38 224.55 226.16 228.54 231.76
260 212.68 214.38 215.62 217.43 219.83 223.30 225.48 227.09 229.48 232.71
261 213.58 215.28 216.53 218.35 220.75 224.23 226.41 228.03 230.42 233.65
262 214.49 216.19 217.44 219.26 221.66 225.16 227.34 228.96 231.36 234.60
263 215.39 217.10 218.35 220.17 222.58 226.08 228.27 229.90 232.30 235.55
264 216.30 218.01 219.26 221.09 223.50 227.01 229.20 230.83 233.24 236.49
265 217.20 218.91 220.17 222.00 224.42 227.94 230.13 231.77 234.18 237.44
266 218.11 219.82 221.08 222.92 225.34 228.86 231.07 232.70 235.12 238.39
267 219.01 220.73 221.99 223.83 226.26 229.79 232.00 233.64 236.06 239.33
268 219.91 221.64 222.90 224.75 227.18 230.72 232.93 234.57 237.00 240.28
269 220.82 222.55 223.82 225.66 228.10 231.65 233.86 235.51 237.94 241.23
270 221.72 223.46 224.73 226.58 229.02 232.57 234.79 236.44 238.88 242.17
271 222.63 224.37 225.64 227.49 229.94 233.50 235.73 237.38 239.82 243.12
272 223.54 225.28 226.55 228.41 230.86 234.43 236.66 238.31 240.76 244.07
273 224.44 226.18 227.46 229.32 231.79 235.36 237.59 239.25 241.70 245.02
274 225.35 227.09 228.37 230.24 232.71 236.29 238.52 240.19 242.64 245.96
275 226.25 228.00 229.29 231.16 233.63 237.21 239.46 241.12 243.59 246.91
276 227.16 228.91 230.20 232.07 234.55 238.14 240.39 242.06 244.53 247.86
277 228.07 229.82 231.11 232.99 235.47 239.07 241.32 242.99 245.47 248.81
278 228.97 230.73 232.02 233.91 236.39 240.00 242.26 243.93 246.41 249.75
279 229.88 231.64 232.94 234.82 237.31 240.93 243.19 244.87 247.35 250.70
280 230.79 232.55 233.85 235.74 238.24 241.86 244.12 245.80 248.29 251.65
281 231.69 233.46 234.76 236.66 239.16 242.79 245.06 246.74 249.23 252.60
282 232.60 234.38 235.68 237.57 240.08 243.72 245.99 247.68 250.18 253.55
283 233.51 235.29 236.59 238.49 241.00 244.65 246.92 248.62 251.12 254.49
284 234.42 236.20 237.50 239.41 241.92 245.58 247.86 249.55 252.06 255.44
285 235.32 237.11 238.42 240.33 242.85 246.50 248.79 250.49 253.00 256.39
... continued on next page
C
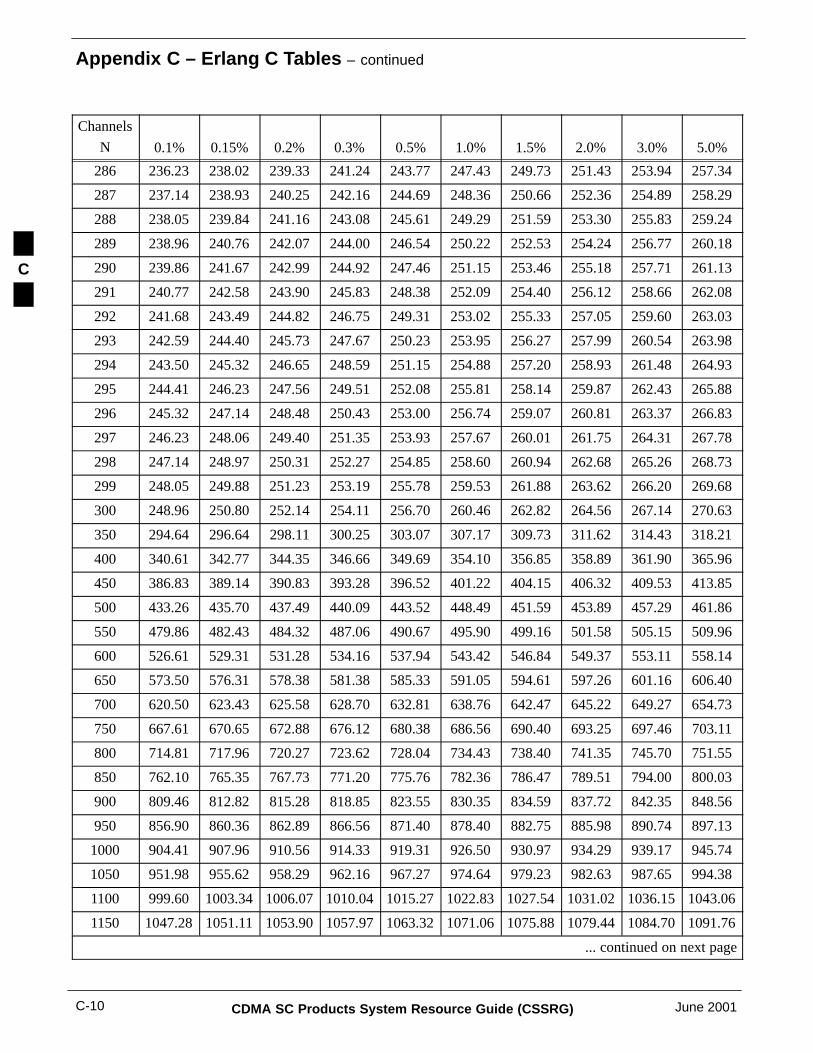
Appendix C – Erlang C Tables – continued
CDMA SC Products System Resource Guide (CSSRG) June 2001C-10
Channels
N 5.0%3.0%2.0%1.5%1.0%0.5%0.3%0.2%0.15%0.1%
286 236.23 238.02 239.33 241.24 243.77 247.43 249.73 251.43 253.94 257.34
287 237.14 238.93 240.25 242.16 244.69 248.36 250.66 252.36 254.89 258.29
288 238.05 239.84 241.16 243.08 245.61 249.29 251.59 253.30 255.83 259.24
289 238.96 240.76 242.07 244.00 246.54 250.22 252.53 254.24 256.77 260.18
290 239.86 241.67 242.99 244.92 247.46 251.15 253.46 255.18 257.71 261.13
291 240.77 242.58 243.90 245.83 248.38 252.09 254.40 256.12 258.66 262.08
292 241.68 243.49 244.82 246.75 249.31 253.02 255.33 257.05 259.60 263.03
293 242.59 244.40 245.73 247.67 250.23 253.95 256.27 257.99 260.54 263.98
294 243.50 245.32 246.65 248.59 251.15 254.88 257.20 258.93 261.48 264.93
295 244.41 246.23 247.56 249.51 252.08 255.81 258.14 259.87 262.43 265.88
296 245.32 247.14 248.48 250.43 253.00 256.74 259.07 260.81 263.37 266.83
297 246.23 248.06 249.40 251.35 253.93 257.67 260.01 261.75 264.31 267.78
298 247.14 248.97 250.31 252.27 254.85 258.60 260.94 262.68 265.26 268.73
299 248.05 249.88 251.23 253.19 255.78 259.53 261.88 263.62 266.20 269.68
300 248.96 250.80 252.14 254.11 256.70 260.46 262.82 264.56 267.14 270.63
350 294.64 296.64 298.11 300.25 303.07 307.17 309.73 311.62 314.43 318.21
400 340.61 342.77 344.35 346.66 349.69 354.10 356.85 358.89 361.90 365.96
450 386.83 389.14 390.83 393.28 396.52 401.22 404.15 406.32 409.53 413.85
500 433.26 435.70 437.49 440.09 443.52 448.49 451.59 453.89 457.29 461.86
550 479.86 482.43 484.32 487.06 490.67 495.90 499.16 501.58 505.15 509.96
600 526.61 529.31 531.28 534.16 537.94 543.42 546.84 549.37 553.11 558.14
650 573.50 576.31 578.38 581.38 585.33 591.05 594.61 597.26 601.16 606.40
700 620.50 623.43 625.58 628.70 632.81 638.76 642.47 645.22 649.27 654.73
750 667.61 670.65 672.88 676.12 680.38 686.56 690.40 693.25 697.46 703.11
800 714.81 717.96 720.27 723.62 728.04 734.43 738.40 741.35 745.70 751.55
850 762.10 765.35 767.73 771.20 775.76 782.36 786.47 789.51 794.00 800.03
900 809.46 812.82 815.28 818.85 823.55 830.35 834.59 837.72 842.35 848.56
950 856.90 860.36 862.89 866.56 871.40 878.40 882.75 885.98 890.74 897.13
1000 904.41 907.96 910.56 914.33 919.31 926.50 930.97 934.29 939.17 945.74
1050 951.98 955.62 958.29 962.16 967.27 974.64 979.23 982.63 987.65 994.38
1100 999.60 1003.34 1006.07 1010.04 1015.27 1022.83 1027.54 1031.02 1036.15 1043.06
1150 1047.28 1051.11 1053.90 1057.97 1063.32 1071.06 1075.88 1079.44 1084.70 1091.76
... continued on next page
C

Appendix C – Erlang C Tables – continued
June 2001 C-11CDMA SC Products System Resource Guide (CSSRG)
Channels
N 5.0%3.0%2.0%1.5%1.0%0.5%0.3%0.2%0.15%0.1%
1200 1095.01 1098.92 1101.78 1105.94 1111.42 1119.33 1124.25 1127.90 1133.27 1140.49
1250 1142.78 1146.78 1149.70 1153.95 1159.55 1167.63 1172.66 1176.38 1181.87 1189.25
1300 1190.60 1194.68 1197.67 1202.01 1207.72 1215.97 1221.10 1224.90 1230.50 1238.03
1350 1238.46 1242.63 1245.67 1250.10 1255.92 1264.34 1269.57 1273.45 1279.16 1286.83
1400 1286.36 1290.61 1293.71 1298.22 1304.16 1312.74 1318.07 1322.02 1327.84 1335.66
1450 1334.30 1338.62 1341.78 1346.38 1352.43 1361.16 1366.60 1370.62 1376.55 1384.51
1500 1382.27 1386.67 1389.89 1394.57 1400.73 1409.62 1415.15 1419.24 1425.27 1433.37
1550 1430.28 1434.76 1438.03 1442.79 1449.05 1458.10 1463.72 1467.89 1474.02 1482.26
1600 1478.31 1482.87 1486.20 1491.04 1497.41 1506.60 1512.32 1516.55 1522.79 1531.16
1650 1526.38 1531.01 1534.40 1539.31 1545.79 1555.13 1560.94 1565.24 1571.58 1580.09
1700 1574.48 1579.18 1582.62 1587.61 1594.19 1603.68 1609.58 1613.95 1620.38 1629.02
1750 1622.61 1627.38 1630.87 1635.94 1642.61 1652.25 1658.24 1662.67 1669.20 1677.98
1800 1670.76 1675.60 1679.14 1684.29 1691.06 1700.84 1706.92 1711.42 1718.04 1726.94
1850 1718.93 1723.85 1727.44 1732.66 1739.53 1749.45 1755.62 1760.18 1766.90 1775.92
1900 1767.13 1772.12 1775.76 1781.06 1788.02 1798.08 1804.33 1808.96 1815.77 1824.92
1950 1815.36 1820.41 1824.11 1829.47 1836.53 1846.72 1853.06 1857.75 1864.66 1873.93
2000 1863.61 1868.73 1872.47 1877.91 1885.06 1895.39 1901.81 1906.56 1913.56 1922.95
2050 1911.88 1917.06 1920.85 1926.36 1933.61 1944.07 1950.57 1955.38 1962.47 1971.98
2100 1960.17 1965.42 1969.26 1974.84 1982.18 1992.77 1999.35 2004.22 2011.40 2021.03
2150 2008.48 2013.80 2017.68 2023.33 2030.76 2041.48 2048.14 2053.07 2060.34 2070.08
2200 2056.81 2062.19 2066.12 2071.84 2079.36 2090.20 2096.95 2101.94 2109.29 2119.15
2250 2105.16 2110.60 2114.58 2120.36 2127.97 2138.95 2145.77 2150.82 2158.25 2168.23
2300 2153.52 2159.03 2163.06 2168.91 2176.60 2187.70 2194.60 2199.71 2207.23 2217.32
2350 2201.91 2207.48 2211.55 2217.46 2225.24 2236.47 2243.45 2248.61 2256.21 2266.42
2400 2250.31 2255.94 2260.06 2266.04 2273.90 2285.25 2292.31 2297.52 2305.21 2315.52
2450 2298.73 2304.42 2308.58 2314.63 2322.58 2334.05 2341.18 2346.45 2354.22 2364.64
2500 2347.16 2352.92 2357.12 2363.23 2371.26 2382.85 2390.06 2395.38 2403.23 2413.77
2550 2395.61 2401.43 2405.67 2411.84 2419.96 2431.67 2438.95 2444.33 2452.26 2462.90
2600 2444.08 2449.95 2454.24 2460.47 2468.67 2480.50 2487.85 2493.29 2501.30 2512.04
2650 2492.56 2498.49 2502.82 2509.12 2517.40 2529.34 2536.77 2542.26 2550.34 2561.19
2700 2541.05 2547.04 2551.42 2557.77 2566.13 2578.19 2585.69 2591.23 2599.40 2610.35
2750 2589.56 2595.61 2600.02 2606.44 2614.88 2627.06 2634.62 2640.22 2648.46 2659.52
... continued on next page
C

Appendix C – Erlang C Tables – continued
CDMA SC Products System Resource Guide (CSSRG) June 2001C-12
Channels
N 5.0%3.0%2.0%1.5%1.0%0.5%0.3%0.2%0.15%0.1%
2800 2638.08 2644.19 2648.64 2655.12 2663.64 2675.93 2683.57 2689.21 2697.53 2708.69
2850 2686.62 2692.78 2697.28 2703.81 2712.41 2724.81 2732.52 2738.22 2746.61 2757.88
2900 2735.17 2741.38 2745.92 2752.52 2761.19 2773.71 2781.48 2787.23 2795.70 2807.06
2950 2783.73 2790.00 2794.58 2801.23 2809.98 2822.61 2830.45 2836.25 2844.80 2856.26
3000 2832.30 2838.62 2843.24 2849.96 2858.79 2871.52 2879.43 2885.28 2893.90 2905.46
3050 2880.88 2887.26 2891.92 2898.69 2907.60 2920.44 2928.42 2934.32 2943.01 2954.67
3100 2929.48 2935.91 2940.61 2947.44 2956.42 2969.37 2977.42 2983.37 2992.13 3003.89
3150 2978.08 2984.57 2989.31 2996.20 3005.25 3018.31 3026.42 3032.42 3041.26 3053.11
3200 3026.70 3033.24 3038.02 3044.96 3054.09 3067.25 3075.43 3081.48 3090.39 3102.34
3250 3075.33 3081.92 3086.74 3093.74 3102.94 3116.21 3124.45 3130.55 3139.53 3151.57
3300 3123.97 3130.62 3135.47 3142.52 3151.80 3165.17 3173.48 3179.62 3188.67 3200.81
3350 3172.62 3179.32 3184.21 3191.32 3200.66 3214.14 3222.51 3228.71 3237.83 3250.06
3400 3221.28 3228.03 3232.96 3240.12 3249.54 3263.12 3271.56 3277.80 3286.98 3299.31
3450 3269.95 3276.75 3281.72 3288.93 3298.42 3312.10 3320.61 3326.89 3336.15 3348.57
3500 3318.63 3325.48 3330.48 3337.75 3347.31 3361.10 3369.66 3375.99 3385.32 3397.83
3550 3367.31 3374.22 3379.26 3386.58 3396.21 3410.10 3418.72 3425.10 3434.50 3447.09
3600 3416.01 3422.96 3428.04 3435.42 3445.12 3459.10 3467.79 3474.22 3483.68 3496.37
3650 3464.72 3471.72 3476.83 3484.26 3494.03 3508.12 3516.87 3523.34 3532.87 3545.64
3700 3513.43 3520.49 3525.63 3533.12 3542.95 3557.14 3565.95 3572.47 3582.06 3594.93
3750 3562.16 3569.26 3574.44 3581.98 3591.88 3606.17 3615.04 3621.60 3631.26 3644.21
3800 3610.89 3618.04 3623.26 3630.85 3640.82 3655.20 3664.13 3670.74 3680.46 3693.51
3850 3659.63 3666.83 3672.09 3679.72 3689.76 3704.24 3713.23 3719.88 3729.67 3742.80
3900 3708.38 3715.63 3720.92 3728.61 3738.71 3753.29 3762.34 3769.03 3778.89 3792.10
3950 3757.14 3764.43 3769.76 3777.50 3787.67 3802.34 3811.45 3818.19 3828.11 3841.41
4000 3805.90 3813.24 3818.60 3826.39 3836.63 3851.40 3860.57 3867.35 3877.33 3890.72
C

Appendix C – Erlang C Tables – continued
June 2001 C-13CDMA SC Products System Resource Guide (CSSRG)
Erlang C Table for T1/E1 Spans
Table C-2: Erlang C Spans
Spans
T1
Circuits
T1 Erlangs
at 0.1%
T1 Erlangs
at 0.2%
T1 Erlangs
at 0.3%
E1
Circuits
E1 Erlangs
at 0.1%
E1 Erlangs
at 0.2%
E1 Erlangs
at 0.3%
1 24 11.59 12.22 12.62 30 15.80 16.55 17.02
2 48 29.30 30.34 30.99 60 38.76 39.97 40.72
3 72 48.46 49.82 50.67 90 63.34 64.91 65.88
4 96 68.38 70.01 71.02 120 88.78 90.65 91.81
5 120 88.78 90.65 91.81 150 114.75 116.89 118.21
6 144 109.52 111.61 112.90 180 141.11 143.49 144.96
7 168 130.53 132.81 134.23 210 167.77 170.37 171.97
8 192 151.74 154.21 155.74 240 194.65 197.46 199.19
9 216 173.13 175.77 177.40 270 221.72 224.73 226.58
10 240 194.65 197.46 199.19 300 248.96 252.14 254.11
11 264 216.30 219.26 221.09 330 276.32 279.68 281.76
12 288 238.05 241.16 243.08 360 303.81 307.34 309.51
13 312 259.89 263.15 265.15 390 331.40 335.08 337.36
14 336 281.81 285.21 287.30 420 359.07 362.92 365.28
15 360 303.81 307.34 309.51 450 386.83 390.83 393.28
16 384 325.87 329.53 331.78 480 414.67 418.80 421.35
17 408 347.99 351.77 354.10 510 442.57 446.84 449.47
18 432 370.17 374.07 376.47 540 470.53 474.94 477.65
19 456 392.39 396.42 398.89 570 498.54 503.09 505.88
20 480 414.67 418.80 421.35 600 526.61 531.28 534.16
21 504 436.98 441.23 443.84 630 554.73 559.52 562.47
22 528 459.34 463.69 466.37 660 582.89 587.81 590.83
23 552 481.73 486.19 488.94 690 611.09 616.13 619.23
24 576 504.15 508.72 511.53 720 639.33 644.49 647.66
25 600 526.61 531.28 534.16 750 667.61 672.88 676.12
26 624 549.10 553.87 556.81 780 695.92 701.30 704.61
27 648 571.62 576.49 579.48 810 724.26 729.75 733.13
28 672 594.16 599.13 602.19 840 752.63 758.23 761.68
29 696 616.74 621.80 624.91 870 781.04 786.74 790.25
30 720 639.33 644.49 647.66 900 809.46 815.28 818.85
... continued on next page
C

Appendix C – Erlang C Tables – continued
CDMA SC Products System Resource Guide (CSSRG) June 2001C-14
E1
Circuits
E1 Erlangs
at 0.3%
E1 Erlangs
at 0.2%
E1 Erlangs
at 0.1%Spans
T1 Erlangs
at 0.3%
T1 Erlangs
at 0.2%
T1 Erlangs
at 0.1%
T1
Circuits
31 744 661.95 667.20 670.42 930 837.92 843.83 847.47
32 768 684.59 689.93 693.21 960 866.40 872.42 876.11
33 792 707.25 712.68 716.01 990 894.90 901.02 904.78
34 816 729.93 735.45 738.84 1020 923.43 929.64 933.46
35 840 752.63 758.23 761.68 1050 951.98 958.29 962.16
36 864 775.35 781.04 784.53 1080 980.55 986.95 990.88
37 888 798.09 803.86 807.41 1110 1009.13 1015.63 1019.62
38 912 820.84 826.70 830.29 1140 1037.74 1044.33 1048.38
39 936 843.61 849.55 853.20 1170 1066.37 1073.05 1077.15
40 960 866.40 872.42 876.11 1200 1095.01 1101.78 1105.94
41 984 889.20 895.30 899.04 1230 1123.67 1130.53 1134.74
42 1008 912.02 918.19 921.98 1260 1152.34 1159.29 1163.56
43 1032 934.85 941.10 944.94 1290 1181.04 1188.07 1192.39
44 1056 957.69 964.02 967.91 1320 1209.74 1216.87 1221.24
45 1080 980.55 986.95 990.88 1350 1238.46 1245.67 1250.10
46 1104 1003.41 1009.89 1013.88 1380 1267.20 1274.49 1278.97
47 1128 1026.30 1032.85 1036.88 1410 1295.95 1303.32 1307.85
48 1152 1049.19 1055.82 1059.89 1440 1324.71 1332.17 1336.75
49 1176 1072.09 1078.79 1082.91 1470 1353.48 1361.02 1365.65
50 1200 1095.01 1101.78 1105.94 1500 1382.27 1389.89 1394.57
51 1224 1117.93 1124.78 1128.98 1530 1411.07 1418.77 1423.50
52 1248 1140.87 1147.79 1152.03 1560 1439.88 1447.66 1452.44
53 1272 1163.82 1170.80 1175.09 1590 1468.70 1476.56 1481.39
54 1296 1186.78 1193.83 1198.16 1620 1497.54 1505.47 1510.35
55 1320 1209.74 1216.87 1221.24 1650 1526.38 1534.40 1539.31
56 1344 1232.72 1239.91 1244.32 1680 1555.24 1563.33 1568.29
57 1368 1255.70 1262.96 1267.42 1710 1584.10 1592.27 1597.28
58 1392 1278.70 1286.02 1290.52 1740 1612.98 1621.22 1626.27
59 1416 1301.70 1309.09 1313.63 1770 1641.86 1650.18 1655.28
60 1440 1324.71 1332.17 1336.75 1800 1670.76 1679.14 1684.29
61 1464 1347.73 1355.25 1359.87 1830 1699.66 1708.12 1713.31
62 1488 1370.76 1378.34 1383.00 1860 1728.57 1737.10 1742.34
... continued on next page
C

Appendix C – Erlang C Tables – continued
June 2001 C-15CDMA SC Products System Resource Guide (CSSRG)
E1
Circuits
E1 Erlangs
at 0.3%
E1 Erlangs
at 0.2%
E1 Erlangs
at 0.1%Spans
T1 Erlangs
at 0.3%
T1 Erlangs
at 0.2%
T1 Erlangs
at 0.1%
T1
Circuits
63 1512 1393.79 1401.44 1406.14 1890 1757.49 1766.10 1771.38
64 1536 1416.83 1424.55 1429.29 1920 1786.42 1795.10 1800.42
65 1560 1439.88 1447.66 1452.44 1950 1815.36 1824.11 1829.47
66 1584 1462.94 1470.78 1475.60 1980 1844.31 1853.12 1858.53
67 1608 1486.00 1493.91 1498.76 2010 1873.26 1882.15 1887.60
68 1632 1509.08 1517.04 1521.93 2040 1902.22 1911.18 1916.67
69 1656 1532.15 1540.18 1545.11 2070 1931.19 1940.21 1945.75
70 1680 1555.24 1563.33 1568.29 2100 1960.17 1969.26 1974.84
71 1704 1578.33 1586.48 1591.48 2130 1989.15 1998.31 2003.93
72 1728 1601.43 1609.64 1614.67 2160 2018.14 2027.37 2033.03
73 1752 1624.53 1632.80 1637.87 2190 2047.14 2056.43 2062.13
74 1776 1647.64 1655.97 1661.08 2220 2076.15 2085.50 2091.25
75 1800 1670.76 1679.14 1684.29 2250 2105.16 2114.58 2120.36
76 1824 1693.88 1702.32 1707.51 2280 2134.17 2143.66 2149.49
77 1848 1717.01 1725.51 1730.73 2310 2163.20 2172.75 2178.62
78 1872 1740.14 1748.70 1753.95 2340 2192.23 2201.85 2207.75
79 1896 1763.28 1771.90 1777.19 2370 2221.27 2230.95 2236.89
80 1920 1786.42 1795.10 1800.42 2400 2250.31 2260.06 2266.04
81 1944 1809.57 1818.30 1823.66 2430 2279.36 2289.17 2295.19
82 1968 1832.73 1841.51 1846.91 2460 2308.41 2318.29 2324.35
83 1992 1855.89 1864.73 1870.16 2490 2337.48 2347.41 2353.51
84 2016 1879.05 1887.95 1893.41 2520 2366.54 2376.54 2382.67
85 2040 1902.22 1911.18 1916.67 2550 2395.61 2405.67 2411.84
86 2064 1925.40 1934.41 1939.93 2580 2424.69 2434.81 2441.02
87 2088 1948.58 1957.64 1963.20 2610 2453.77 2463.96 2470.20
88 2112 1971.76 1980.88 1986.47 2640 2482.86 2493.10 2499.39
89 2136 1994.95 2004.12 2009.75 2670 2511.96 2522.26 2528.58
90 2160 2018.14 2027.37 2033.03 2700 2541.05 2551.42 2557.77
91 2184 2041.34 2050.62 2056.31 2730 2570.16 2580.58 2586.97
92 2208 2064.54 2073.87 2079.60 2760 2599.26 2609.75 2616.18
93 2232 2087.75 2097.13 2102.89 2790 2628.38 2638.92 2645.38
94 2256 2110.96 2120.40 2126.19 2820 2657.50 2668.10 2674.60
... continued on next page
C
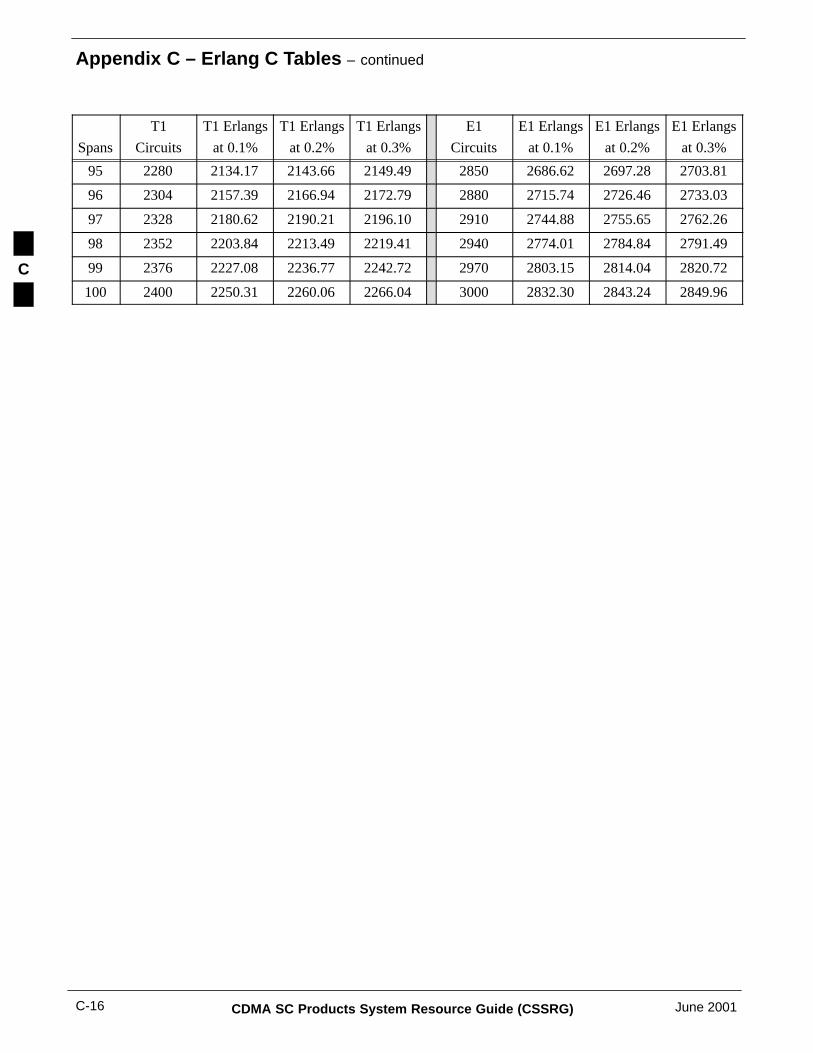
Appendix C – Erlang C Tables – continued
CDMA SC Products System Resource Guide (CSSRG) June 2001C-16
E1
Circuits
E1 Erlangs
at 0.3%
E1 Erlangs
at 0.2%
E1 Erlangs
at 0.1%Spans
T1 Erlangs
at 0.3%
T1 Erlangs
at 0.2%
T1 Erlangs
at 0.1%
T1
Circuits
95 2280 2134.17 2143.66 2149.49 2850 2686.62 2697.28 2703.81
96 2304 2157.39 2166.94 2172.79 2880 2715.74 2726.46 2733.03
97 2328 2180.62 2190.21 2196.10 2910 2744.88 2755.65 2762.26
98 2352 2203.84 2213.49 2219.41 2940 2774.01 2784.84 2791.49
99 2376 2227.08 2236.77 2242.72 2970 2803.15 2814.04 2820.72
100 2400 2250.31 2260.06 2266.04 3000 2832.30 2843.24 2849.96
C

CDMA SC Products SystemResource Guide (CSSRG)
CDMA SC Products System Resource Guide (CSSRG)
English
June 200168P09298A50–A

Eng
lish
June
200
168
P09
298A
50–ACDMA SC Products System Resource Guide
(CSSRG)CDMA SC Products System Resource Guide (CSSRG)
![Telme Evolution 09_[slo]](https://static.fdocuments.net/doc/165x107/54918c80b479590b3c8b45aa/telme-evolution-09slo.jpg)