08 JAN 2018 Bharti Infratel - hdfcsec.com Infratel - Update - Jan18... · EV of Rs 5mn/tower (+Rs...
15
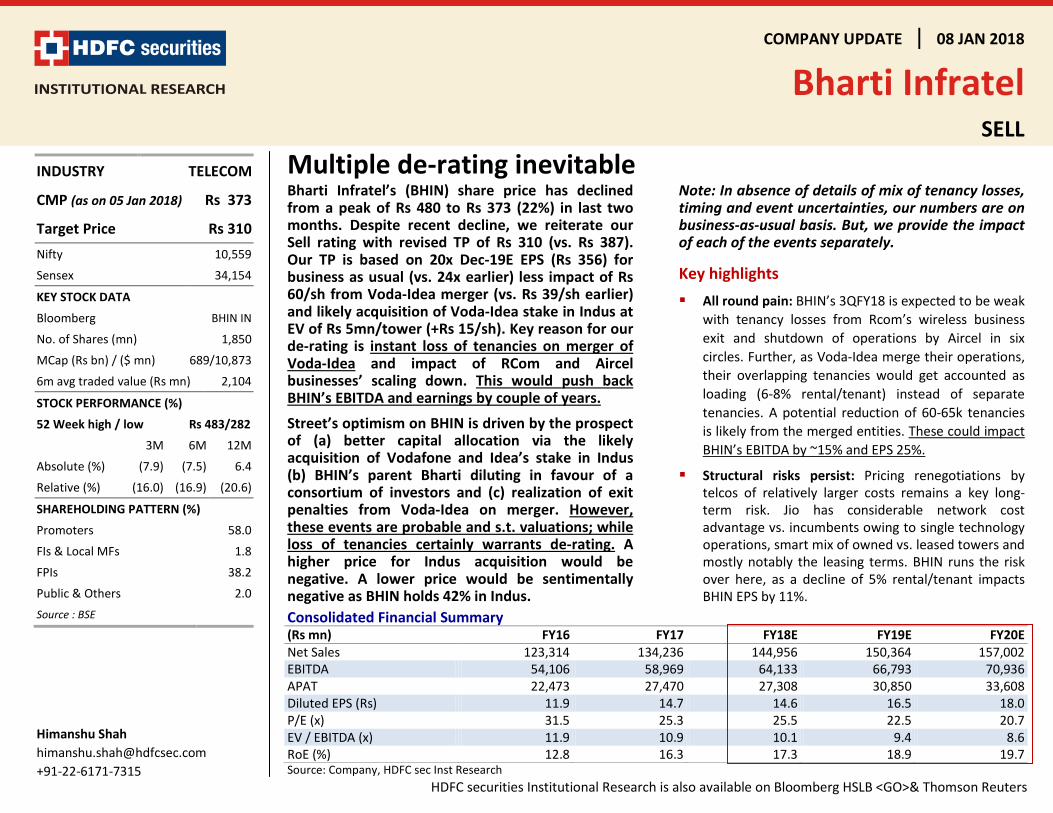
COMPANY UPDATE 08 JAN 2018 Bharti Infratel SELL HDFC securities Institutional Research is also available on Bloomberg HSLB <GO>& Thomson Reuters Multiple de-rating inevitable Bharti Infratel’s (BHIN) share price has declined from a peak of Rs 480 to Rs 373 (22%) in last two months. Despite recent decline, we reiterate our Sell rating with revised TP of Rs 310 (vs. Rs 387). Our TP is based on 20x Dec-19E EPS (Rs 356) for business as usual (vs. 24x earlier) less impact of Rs 60/sh from Voda-Idea merger (vs. Rs 39/sh earlier) and likely acquisition of Voda-Idea stake in Indus at EV of Rs 5mn/tower (+Rs 15/sh). Key reason for our de-rating is instant loss of tenancies on merger of Voda-Idea and impact of RCom and Aircel businesses’ scaling down. This would push back BHIN’s EBITDA and earnings by couple of years. Street’s optimism on BHIN is driven by the prospect of (a) better capital allocation via the likely acquisition of Vodafone and Idea’s stake in Indus (b) BHIN’s parent Bharti diluting in favour of a consortium of investors and (c) realization of exit penalties from Voda-Idea on merger. However, these events are probable and s.t. valuations; while loss of tenancies certainly warrants de-rating. A higher price for Indus acquisition would be negative. A lower price would be sentimentally negative as BHIN holds 42% in Indus. Note: In absence of details of mix of tenancy losses, timing and event uncertainties, our numbers are on business-as-usual basis. But, we provide the impact of each of the events separately. Key highlights All round pain: BHIN’s 3QFY18 is expected to be weak with tenancy losses from Rcom’s wireless business exit and shutdown of operations by Aircel in six circles. Further, as Voda-Idea merge their operations, their overlapping tenancies would get accounted as loading (6-8% rental/tenant) instead of separate tenancies. A potential reduction of 60-65k tenancies is likely from the merged entities. These could impact BHIN’s EBITDA by ~15% and EPS 25%. Structural risks persist: Pricing renegotiations by telcos of relatively larger costs remains a key long- term risk. Jio has considerable network cost advantage vs. incumbents owing to single technology operations, smart mix of owned vs. leased towers and mostly notably the leasing terms. BHIN runs the risk over here, as a decline of 5% rental/tenant impacts BHIN EPS by 11%. Consolidated Financial Summary (Rs mn) FY16 FY17 FY18E FY19E FY20E Net Sales 123,314 134,236 144,956 150,364 157,002 EBITDA 54,106 58,969 64,133 66,793 70,936 APAT 22,473 27,470 27,308 30,850 33,608 Diluted EPS (Rs) 11.9 14.7 14.6 16.5 18.0 P/E (x) 31.5 25.3 25.5 22.5 20.7 EV / EBITDA (x) 11.9 10.9 10.1 9.4 8.6 RoE (%) 12.8 16.3 17.3 18.9 19.7 Source: Company, HDFC sec Inst Research INDUSTRY TELECOM CMP (as on 05 Jan 2018) Rs 373 Target Price Rs 310 Nifty 10,559 Sensex 34,154 KEY STOCK DATA Bloomberg BHIN IN No. of Shares (mn) 1,850 MCap (Rs bn) / ($ mn) 689/10,873 6m avg traded value (Rs mn) 2,104 STOCK PERFORMANCE (%) 52 Week high / low Rs 483/282 3M 6M 12M Absolute (%) (7.9) (7.5) 6.4 Relative (%) (16.0) (16.9) (20.6) SHAREHOLDING PATTERN (%) Promoters 58.0 FIs & Local MFs 1.8 FPIs 38.2 Public & Others 2.0 Source : BSE Himanshu Shah [email protected] +91-22-6171-7315
Transcript of 08 JAN 2018 Bharti Infratel - hdfcsec.com Infratel - Update - Jan18... · EV of Rs 5mn/tower (+Rs...
COMPANY UPDATE 08 JAN 2018
Bharti Infratel SELL
HDFC securities Institutional Research is also available on Bloomberg HSLB <GO>& Thomson Reuters
Multiple de-rating inevitableBharti Infratel’s (BHIN) share price has declined from a peak of Rs 480 to Rs 373 (22%) in last two months. Despite recent decline, we reiterate our Sell rating with revised TP of Rs 310 (vs. Rs 387). Our TP is based on 20x Dec-19E EPS (Rs 356) for business as usual (vs. 24x earlier) less impact of Rs 60/sh from Voda-Idea merger (vs. Rs 39/sh earlier) and likely acquisition of Voda-Idea stake in Indus at EV of Rs 5mn/tower (+Rs 15/sh). Key reason for our de-rating is instant loss of tenancies on merger of Voda-Idea and impact of RCom and Aircel businesses’ scaling down. This would push back BHIN’s EBITDA and earnings by couple of years.
Street’s optimism on BHIN is driven by the prospect of (a) better capital allocation via the likely acquisition of Vodafone and Idea’s stake in Indus (b) BHIN’s parent Bharti diluting in favour of a consortium of investors and (c) realization of exit penalties from Voda-Idea on merger. However, these events are probable and s.t. valuations; while loss of tenancies certainly warrants de-rating. A higher price for Indus acquisition would be negative. A lower price would be sentimentally negative as BHIN holds 42% in Indus.
Note: In absence of details of mix of tenancy losses, timing and event uncertainties, our numbers are on business-as-usual basis. But, we provide the impact of each of the events separately.
Key highlights All round pain: BHIN’s 3QFY18 is expected to be weak
with tenancy losses from Rcom’s wireless business exit and shutdown of operations by Aircel in six circles. Further, as Voda-Idea merge their operations, their overlapping tenancies would get accounted as loading (6-8% rental/tenant) instead of separate tenancies. A potential reduction of 60-65k tenancies is likely from the merged entities. These could impact BHIN’s EBITDA by ~15% and EPS 25%.
Structural risks persist: Pricing renegotiations by telcos of relatively larger costs remains a key long-term risk. Jio has considerable network cost advantage vs. incumbents owing to single technology operations, smart mix of owned vs. leased towers and mostly notably the leasing terms. BHIN runs the risk over here, as a decline of 5% rental/tenant impacts BHIN EPS by 11%.
Consolidated Financial Summary (Rs mn) FY16 FY17 FY18E FY19E FY20E Net Sales 123,314 134,236 144,956 150,364 157,002 EBITDA 54,106 58,969 64,133 66,793 70,936 APAT 22,473 27,470 27,308 30,850 33,608 Diluted EPS (Rs) 11.9 14.7 14.6 16.5 18.0 P/E (x) 31.5 25.3 25.5 22.5 20.7 EV / EBITDA (x) 11.9 10.9 10.1 9.4 8.6 RoE (%) 12.8 16.3 17.3 18.9 19.7 Source: Company, HDFC sec Inst Research
INDUSTRY TELECOM
CMP (as on 05 Jan 2018) Rs 373
Target Price Rs 310 Nifty 10,559
Sensex 34,154
KEY STOCK DATA
Bloomberg BHIN IN
No. of Shares (mn) 1,850
MCap (Rs bn) / ($ mn) 689/10,873
6m avg traded value (Rs mn) 2,104
STOCK PERFORMANCE (%)
52 Week high / low Rs 483/282
3M 6M 12M
Absolute (%) (7.9) (7.5) 6.4
Relative (%) (16.0) (16.9) (20.6)
SHAREHOLDING PATTERN (%)
Promoters 58.0
FIs & Local MFs 1.8
FPIs 38.2
Public & Others 2.0 Source : BSE
Himanshu Shah [email protected] +91-22-6171-7315
BHARTI INFRATEL : COMPANY UPDATE
Page | 2
A tough CY18 for BHIN
BHIN is likely to witness an eventful and tough CY18 on account of tenancy losses from exit of fringe players (Rcom and Aircel) and from merger of Vodafone-Idea. Weaker players constitute <10% of BHIN’s tenancies. Realization of exit penalties from Vodafone-Idea and acquisition of their stake in Indus (s.t. valuations) are the likely positive developments to be watched out. Stake sale in BHIN by parent Bharti Airtel making it a truly independent tower company rather than being operator owned could be another potential event.
In the medium term risk of rental renegotiations by telcos is a key risk especially as BHIN/Indus became an independent tower company. We discuss the impact of each events on BHIN:
Impact of Voda-Idea merger Vodafone and Idea merger is progressing at fast pace
with NCLT and DOT approval as the only pending requirements. As per Vodafone the transaction is likely to close in 1HCY18 vs. earlier towards end CY18.
As Vodafone and Idea merge their operations, the overlapping tenancies would get accounted for as a single tenancy instead of two earlier. For the second tenancy, the combined entity would pay loading charges (6-8% of rental charges of fresh tenant) till it decides to withdraw the equipments. As per the master services agreement, the rental charges for remaining tenants would increase with reduction in tenancies. This would lead to a steep reduction in revenue and EBITDA for BHIN by ~15% and EPS by 25%, a key reason for multiple de-rating. Refer workings below.
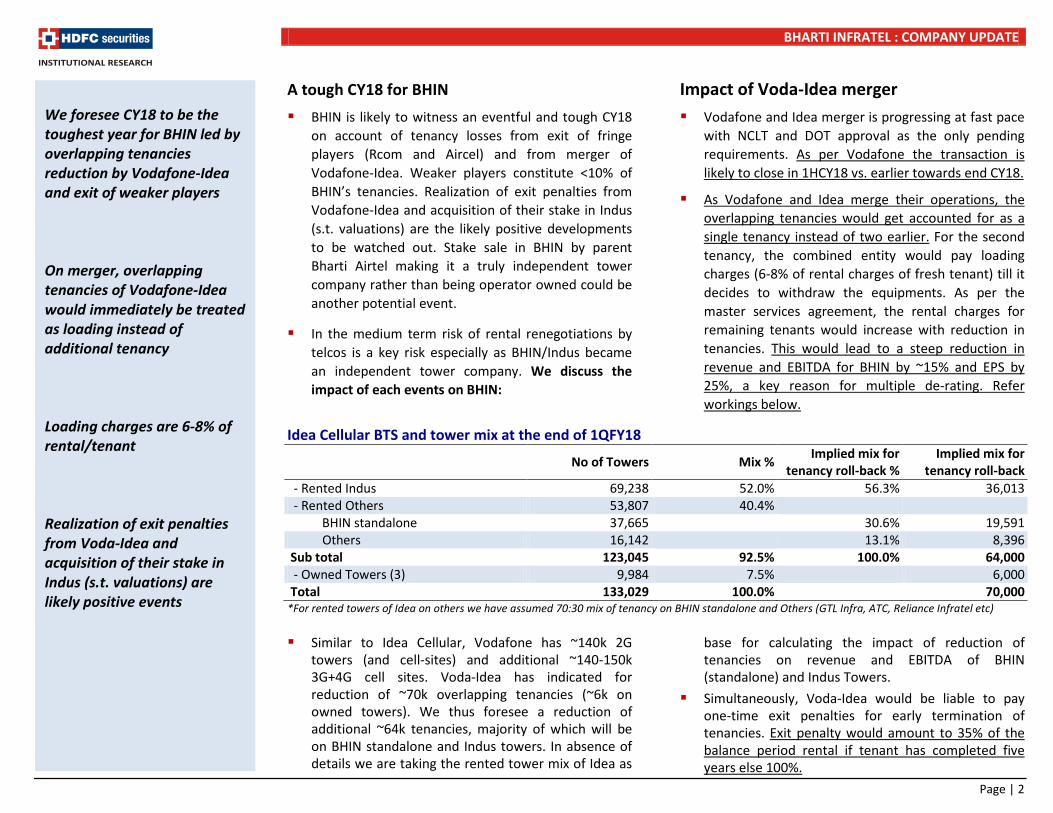
Idea Cellular BTS and tower mix at the end of 1QFY18
No of Towers Mix % Implied mix for tenancy roll-back %
Implied mix for tenancy roll-back
- Rented Indus 69,238 52.0% 56.3% 36,013 - Rented Others 53,807 40.4% BHIN standalone 37,665 30.6% 19,591 Others 16,142 13.1% 8,396 Sub total 123,045 92.5% 100.0% 64,000 - Owned Towers (3) 9,984 7.5% 6,000 Total 133,029 100.0% 70,000 *For rented towers of Idea on others we have assumed 70:30 mix of tenancy on BHIN standalone and Others (GTL Infra, ATC, Reliance Infratel etc) Similar to Idea Cellular, Vodafone has ~140k 2G
towers (and cell-sites) and additional ~140-150k 3G+4G cell sites. Voda-Idea has indicated for reduction of ~70k overlapping tenancies (~6k on owned towers). We thus foresee a reduction of additional ~64k tenancies, majority of which will be on BHIN standalone and Indus towers. In absence of details we are taking the rented tower mix of Idea as
base for calculating the impact of reduction of tenancies on revenue and EBITDA of BHIN (standalone) and Indus Towers.
Simultaneously, Voda-Idea would be liable to pay one-time exit penalties for early termination of tenancies. Exit penalty would amount to 35% of the balance period rental if tenant has completed five years else 100%.
We foresee CY18 to be the toughest year for BHIN led by overlapping tenancies reduction by Vodafone-Idea and exit of weaker players On merger, overlapping tenancies of Vodafone-Idea would immediately be treated as loading instead of additional tenancy Loading charges are 6-8% of rental/tenant Realization of exit penalties from Voda-Idea and acquisition of their stake in Indus (s.t. valuations) are likely positive events
BHARTI INFRATEL : COMPANY UPDATE
Page | 3
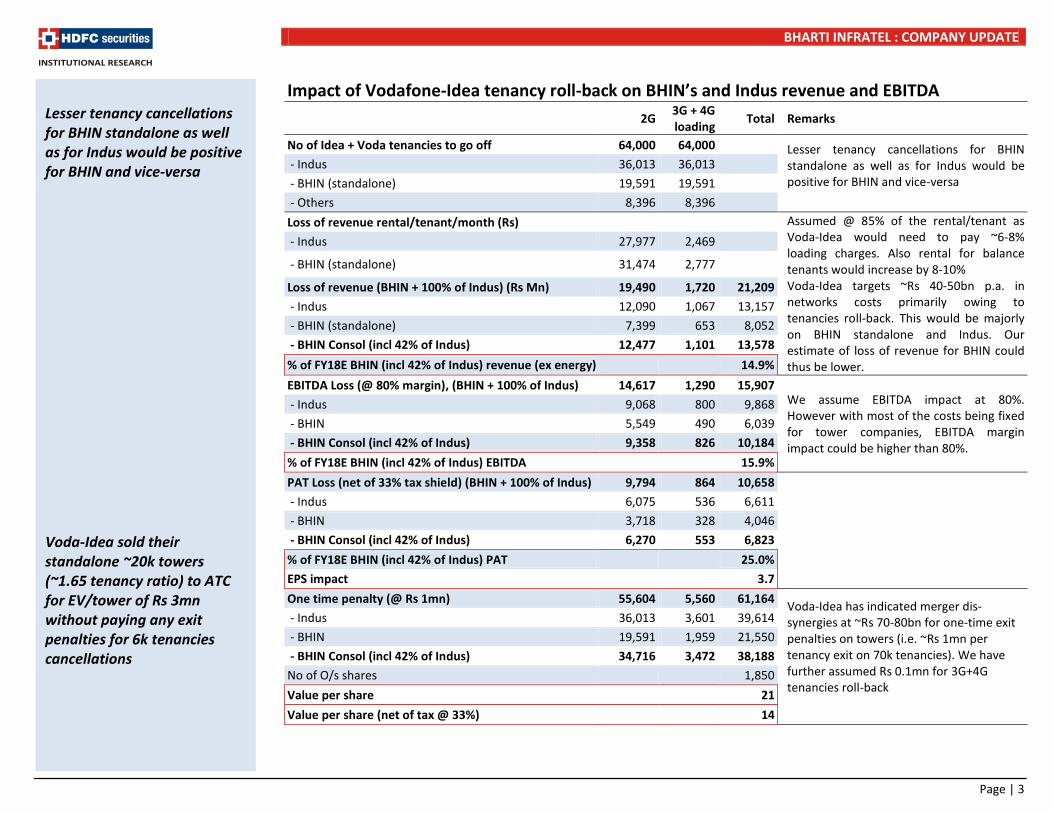
Impact of Vodafone-Idea tenancy roll-back on BHIN’s and Indus revenue and EBITDA
2G 3G + 4G loading Total Remarks
No of Idea + Voda tenancies to go off 64,000 64,000 Lesser tenancy cancellations for BHIN standalone as well as for Indus would be positive for BHIN and vice-versa
- Indus 36,013 36,013 - BHIN (standalone) 19,591 19,591 - Others 8,396 8,396 Loss of revenue rental/tenant/month (Rs)
Assumed @ 85% of the rental/tenant as Voda-Idea would need to pay ~6-8% loading charges. Also rental for balance tenants would increase by 8-10%
- Indus 27,977 2,469 - BHIN (standalone) 31,474 2,777 Loss of revenue (BHIN + 100% of Indus) (Rs Mn) 19,490 1,720 21,209 Voda-Idea targets ~Rs 40-50bn p.a. in
networks costs primarily owing to tenancies roll-back. This would be majorly on BHIN standalone and Indus. Our estimate of loss of revenue for BHIN could thus be lower.
- Indus 12,090 1,067 13,157 - BHIN (standalone) 7,399 653 8,052 - BHIN Consol (incl 42% of Indus) 12,477 1,101 13,578 % of FY18E BHIN (incl 42% of Indus) revenue (ex energy) 14.9% EBITDA Loss (@ 80% margin), (BHIN + 100% of Indus) 14,617 1,290 15,907
We assume EBITDA impact at 80%. However with most of the costs being fixed for tower companies, EBITDA margin impact could be higher than 80%.
- Indus 9,068 800 9,868 - BHIN 5,549 490 6,039 - BHIN Consol (incl 42% of Indus) 9,358 826 10,184 % of FY18E BHIN (incl 42% of Indus) EBITDA 15.9% PAT Loss (net of 33% tax shield) (BHIN + 100% of Indus) 9,794 864 10,658 - Indus 6,075 536 6,611 - BHIN 3,718 328 4,046 - BHIN Consol (incl 42% of Indus) 6,270 553 6,823 % of FY18E BHIN (incl 42% of Indus) PAT 25.0% EPS impact 3.7 One time penalty (@ Rs 1mn) 55,604 5,560 61,164 Voda-Idea has indicated merger dis-
synergies at ~Rs 70-80bn for one-time exit penalties on towers (i.e. ~Rs 1mn per tenancy exit on 70k tenancies). We have further assumed Rs 0.1mn for 3G+4G tenancies roll-back
- Indus 36,013 3,601 39,614 - BHIN 19,591 1,959 21,550 - BHIN Consol (incl 42% of Indus) 34,716 3,472 38,188 No of O/s shares 1,850 Value per share 21 Value per share (net of tax @ 33%) 14
Lesser tenancy cancellations for BHIN standalone as well as for Indus would be positive for BHIN and vice-versa Voda-Idea sold their standalone ~20k towers (~1.65 tenancy ratio) to ATC for EV/tower of Rs 3mn without paying any exit penalties for 6k tenancies cancellations
BHARTI INFRATEL : COMPANY UPDATE
Page | 4
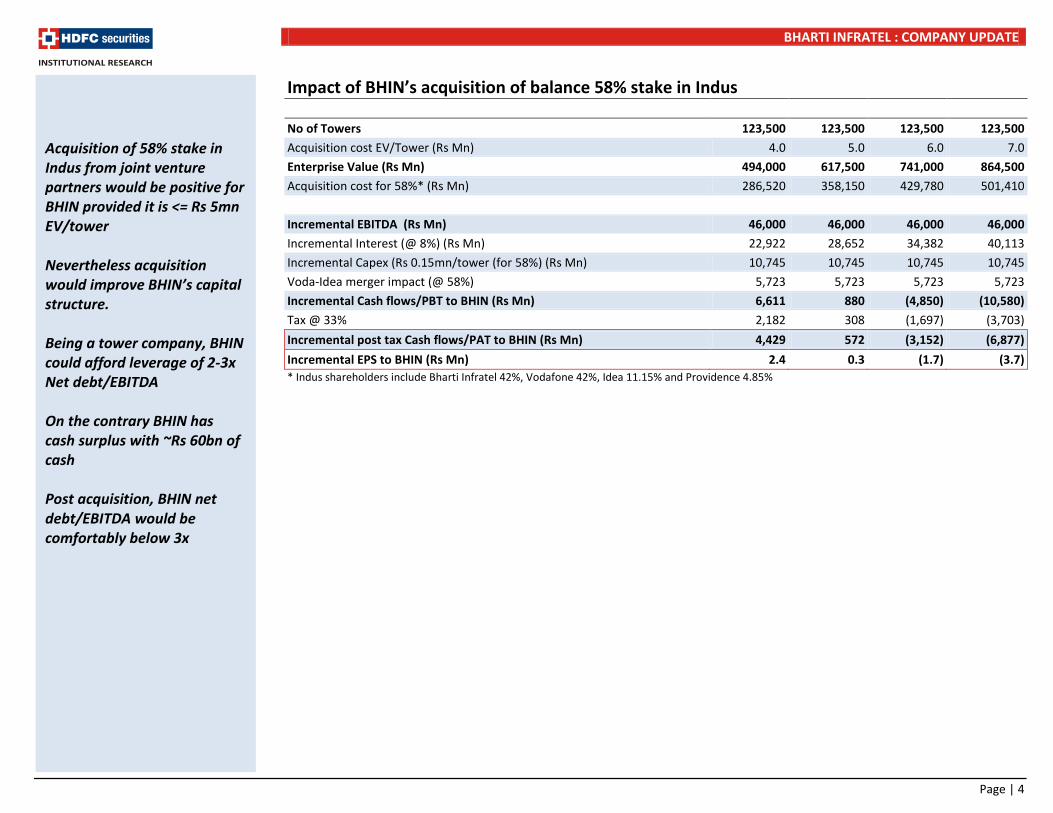
Impact of BHIN’s acquisition of balance 58% stake in Indus No of Towers 123,500 123,500 123,500 123,500 Acquisition cost EV/Tower (Rs Mn) 4.0 5.0 6.0 7.0 Enterprise Value (Rs Mn) 494,000 617,500 741,000 864,500 Acquisition cost for 58%* (Rs Mn) 286,520 358,150 429,780 501,410
Incremental EBITDA (Rs Mn) 46,000 46,000 46,000 46,000 Incremental Interest (@ 8%) (Rs Mn) 22,922 28,652 34,382 40,113 Incremental Capex (Rs 0.15mn/tower (for 58%) (Rs Mn) 10,745 10,745 10,745 10,745 Voda-Idea merger impact (@ 58%) 5,723 5,723 5,723 5,723 Incremental Cash flows/PBT to BHIN (Rs Mn) 6,611 880 (4,850) (10,580) Tax @ 33% 2,182 308 (1,697) (3,703) Incremental post tax Cash flows/PAT to BHIN (Rs Mn) 4,429 572 (3,152) (6,877) Incremental EPS to BHIN (Rs Mn) 2.4 0.3 (1.7) (3.7) * Indus shareholders include Bharti Infratel 42%, Vodafone 42%, Idea 11.15% and Providence 4.85%
Acquisition of 58% stake in Indus from joint venture partners would be positive for BHIN provided it is <= Rs 5mn EV/tower Nevertheless acquisition would improve BHIN’s capital structure. Being a tower company, BHIN could afford leverage of 2-3x Net debt/EBITDA On the contrary BHIN has cash surplus with ~Rs 60bn of cash Post acquisition, BHIN net debt/EBITDA would be comfortably below 3x
BHARTI INFRATEL : COMPANY UPDATE
Page | 5
Valuation Snapshot Impact of Voda-Idea merger
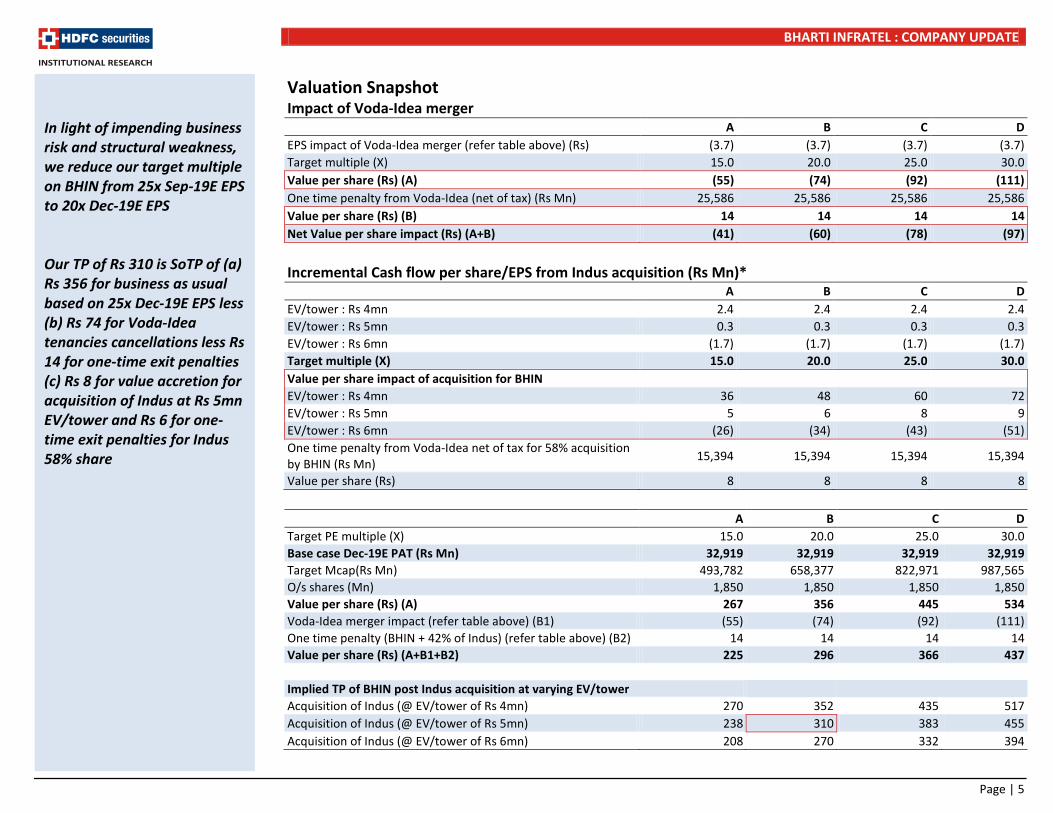
A B C D EPS impact of Voda-Idea merger (refer table above) (Rs) (3.7) (3.7) (3.7) (3.7) Target multiple (X) 15.0 20.0 25.0 30.0 Value per share (Rs) (A) (55) (74) (92) (111) One time penalty from Voda-Idea (net of tax) (Rs Mn) 25,586 25,586 25,586 25,586 Value per share (Rs) (B) 14 14 14 14 Net Value per share impact (Rs) (A+B) (41) (60) (78) (97) Incremental Cash flow per share/EPS from Indus acquisition (Rs Mn)*
A B C D EV/tower : Rs 4mn 2.4 2.4 2.4 2.4 EV/tower : Rs 5mn 0.3 0.3 0.3 0.3 EV/tower : Rs 6mn (1.7) (1.7) (1.7) (1.7) Target multiple (X) 15.0 20.0 25.0 30.0 Value per share impact of acquisition for BHIN EV/tower : Rs 4mn 36 48 60 72 EV/tower : Rs 5mn 5 6 8 9 EV/tower : Rs 6mn (26) (34) (43) (51) One time penalty from Voda-Idea net of tax for 58% acquisition by BHIN (Rs Mn) 15,394 15,394 15,394 15,394
Value per share (Rs) 8 8 8 8
A B C D Target PE multiple (X) 15.0 20.0 25.0 30.0 Base case Dec-19E PAT (Rs Mn) 32,919 32,919 32,919 32,919 Target Mcap(Rs Mn) 493,782 658,377 822,971 987,565 O/s shares (Mn) 1,850 1,850 1,850 1,850 Value per share (Rs) (A) 267 356 445 534 Voda-Idea merger impact (refer table above) (B1) (55) (74) (92) (111) One time penalty (BHIN + 42% of Indus) (refer table above) (B2) 14 14 14 14 Value per share (Rs) (A+B1+B2) 225 296 366 437
Implied TP of BHIN post Indus acquisition at varying EV/tower Acquisition of Indus (@ EV/tower of Rs 4mn) 270 352 435 517 Acquisition of Indus (@ EV/tower of Rs 5mn) 238 310 383 455 Acquisition of Indus (@ EV/tower of Rs 6mn) 208 270 332 394
In light of impending business risk and structural weakness, we reduce our target multiple on BHIN from 25x Sep-19E EPS to 20x Dec-19E EPS Our TP of Rs 310 is SoTP of (a) Rs 356 for business as usual based on 25x Dec-19E EPS less (b) Rs 74 for Voda-Idea tenancies cancellations less Rs 14 for one-time exit penalties (c) Rs 8 for value accretion for acquisition of Indus at Rs 5mn EV/tower and Rs 6 for one-time exit penalties for Indus 58% share
BHARTI INFRATEL : COMPANY UPDATE
Page | 6
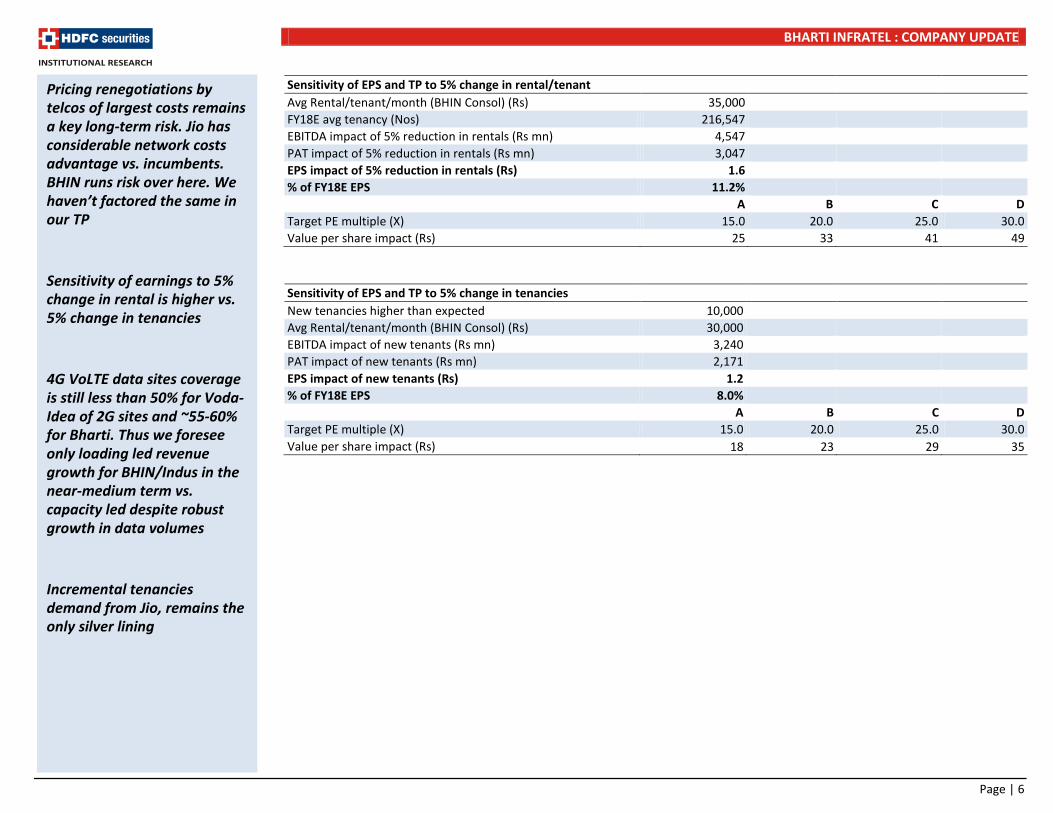
Sensitivity of EPS and TP to 5% change in rental/tenant Avg Rental/tenant/month (BHIN Consol) (Rs) 35,000 FY18E avg tenancy (Nos) 216,547 EBITDA impact of 5% reduction in rentals (Rs mn) 4,547 PAT impact of 5% reduction in rentals (Rs mn) 3,047 EPS impact of 5% reduction in rentals (Rs) 1.6 % of FY18E EPS 11.2% A B C D Target PE multiple (X) 15.0 20.0 25.0 30.0 Value per share impact (Rs) 25 33 41 49 Sensitivity of EPS and TP to 5% change in tenancies New tenancies higher than expected 10,000 Avg Rental/tenant/month (BHIN Consol) (Rs) 30,000 EBITDA impact of new tenants (Rs mn) 3,240 PAT impact of new tenants (Rs mn) 2,171 EPS impact of new tenants (Rs) 1.2 % of FY18E EPS 8.0% A B C D Target PE multiple (X) 15.0 20.0 25.0 30.0 Value per share impact (Rs) 18 23 29 35
Pricing renegotiations by telcos of largest costs remains a key long-term risk. Jio has considerable network costs advantage vs. incumbents. BHIN runs risk over here. We haven’t factored the same in our TP
Sensitivity of earnings to 5% change in rental is higher vs. 5% change in tenancies
4G VoLTE data sites coverage is still less than 50% for Voda-Idea of 2G sites and ~55-60% for Bharti. Thus we foresee only loading led revenue growth for BHIN/Indus in the near-medium term vs. capacity led despite robust growth in data volumes
Incremental tenancies demand from Jio, remains the only silver lining
BHARTI INFRATEL : COMPANY UPDATE
Page | 7
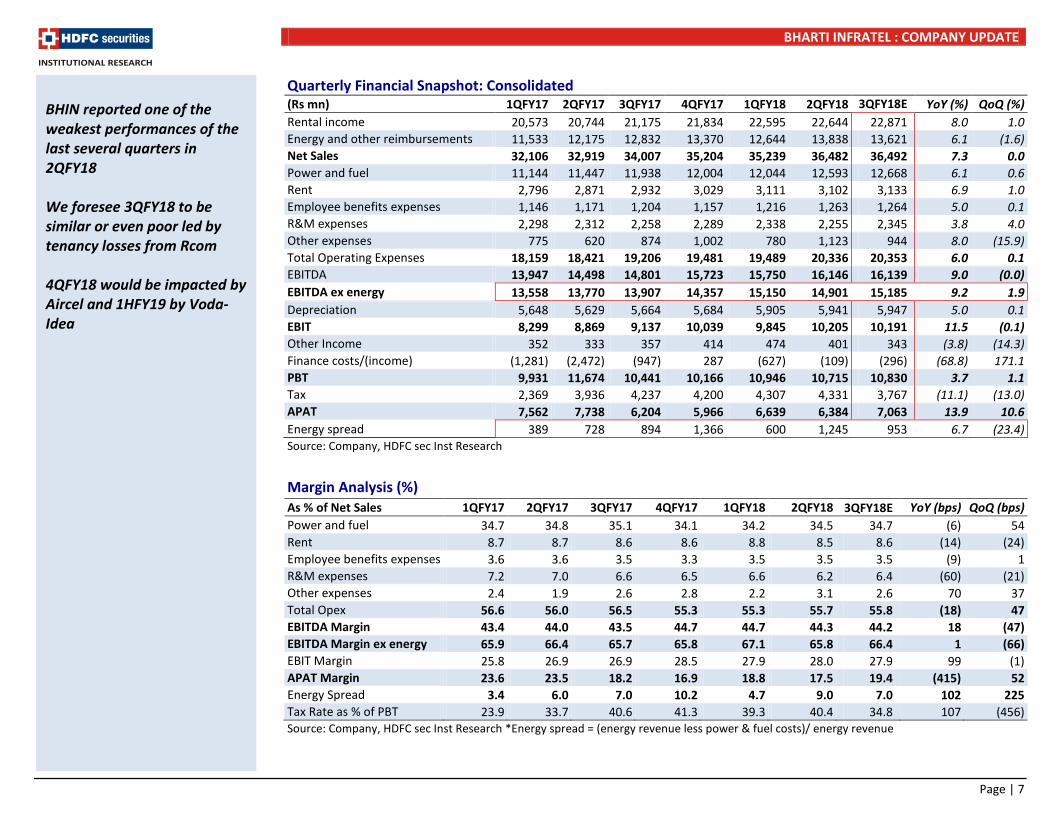
Quarterly Financial Snapshot: Consolidated (Rs mn) 1QFY17 2QFY17 3QFY17 4QFY17 1QFY18 2QFY18 3QFY18E YoY (%) QoQ (%) Rental income 20,573 20,744 21,175 21,834 22,595 22,644 22,871 8.0 1.0 Energy and other reimbursements 11,533 12,175 12,832 13,370 12,644 13,838 13,621 6.1 (1.6) Net Sales 32,106 32,919 34,007 35,204 35,239 36,482 36,492 7.3 0.0 Power and fuel 11,144 11,447 11,938 12,004 12,044 12,593 12,668 6.1 0.6 Rent 2,796 2,871 2,932 3,029 3,111 3,102 3,133 6.9 1.0 Employee benefits expenses 1,146 1,171 1,204 1,157 1,216 1,263 1,264 5.0 0.1 R&M expenses 2,298 2,312 2,258 2,289 2,338 2,255 2,345 3.8 4.0 Other expenses 775 620 874 1,002 780 1,123 944 8.0 (15.9) Total Operating Expenses 18,159 18,421 19,206 19,481 19,489 20,336 20,353 6.0 0.1 EBITDA 13,947 14,498 14,801 15,723 15,750 16,146 16,139 9.0 (0.0) EBITDA ex energy 13,558 13,770 13,907 14,357 15,150 14,901 15,185 9.2 1.9 Depreciation 5,648 5,629 5,664 5,684 5,905 5,941 5,947 5.0 0.1 EBIT 8,299 8,869 9,137 10,039 9,845 10,205 10,191 11.5 (0.1) Other Income 352 333 357 414 474 401 343 (3.8) (14.3) Finance costs/(income) (1,281) (2,472) (947) 287 (627) (109) (296) (68.8) 171.1 PBT 9,931 11,674 10,441 10,166 10,946 10,715 10,830 3.7 1.1 Tax 2,369 3,936 4,237 4,200 4,307 4,331 3,767 (11.1) (13.0) APAT 7,562 7,738 6,204 5,966 6,639 6,384 7,063 13.9 10.6 Energy spread 389 728 894 1,366 600 1,245 953 6.7 (23.4) Source: Company, HDFC sec Inst Research
Margin Analysis (%)
As % of Net Sales 1QFY17 2QFY17 3QFY17 4QFY17 1QFY18 2QFY18 3QFY18E YoY (bps) QoQ (bps) Power and fuel 34.7 34.8 35.1 34.1 34.2 34.5 34.7 (6) 54 Rent 8.7 8.7 8.6 8.6 8.8 8.5 8.6 (14) (24) Employee benefits expenses 3.6 3.6 3.5 3.3 3.5 3.5 3.5 (9) 1 R&M expenses 7.2 7.0 6.6 6.5 6.6 6.2 6.4 (60) (21) Other expenses 2.4 1.9 2.6 2.8 2.2 3.1 2.6 70 37 Total Opex 56.6 56.0 56.5 55.3 55.3 55.7 55.8 (18) 47 EBITDA Margin 43.4 44.0 43.5 44.7 44.7 44.3 44.2 18 (47) EBITDA Margin ex energy 65.9 66.4 65.7 65.8 67.1 65.8 66.4 1 (66) EBIT Margin 25.8 26.9 26.9 28.5 27.9 28.0 27.9 99 (1) APAT Margin 23.6 23.5 18.2 16.9 18.8 17.5 19.4 (415) 52 Energy Spread 3.4 6.0 7.0 10.2 4.7 9.0 7.0 102 225 Tax Rate as % of PBT 23.9 33.7 40.6 41.3 39.3 40.4 34.8 107 (456) Source: Company, HDFC sec Inst Research *Energy spread = (energy revenue less power & fuel costs)/ energy revenue
BHIN reported one of the weakest performances of the last several quarters in 2QFY18 We foresee 3QFY18 to be similar or even poor led by tenancy losses from Rcom 4QFY18 would be impacted by Aircel and 1HFY19 by Voda-Idea
BHARTI INFRATEL : COMPANY UPDATE
Page | 8
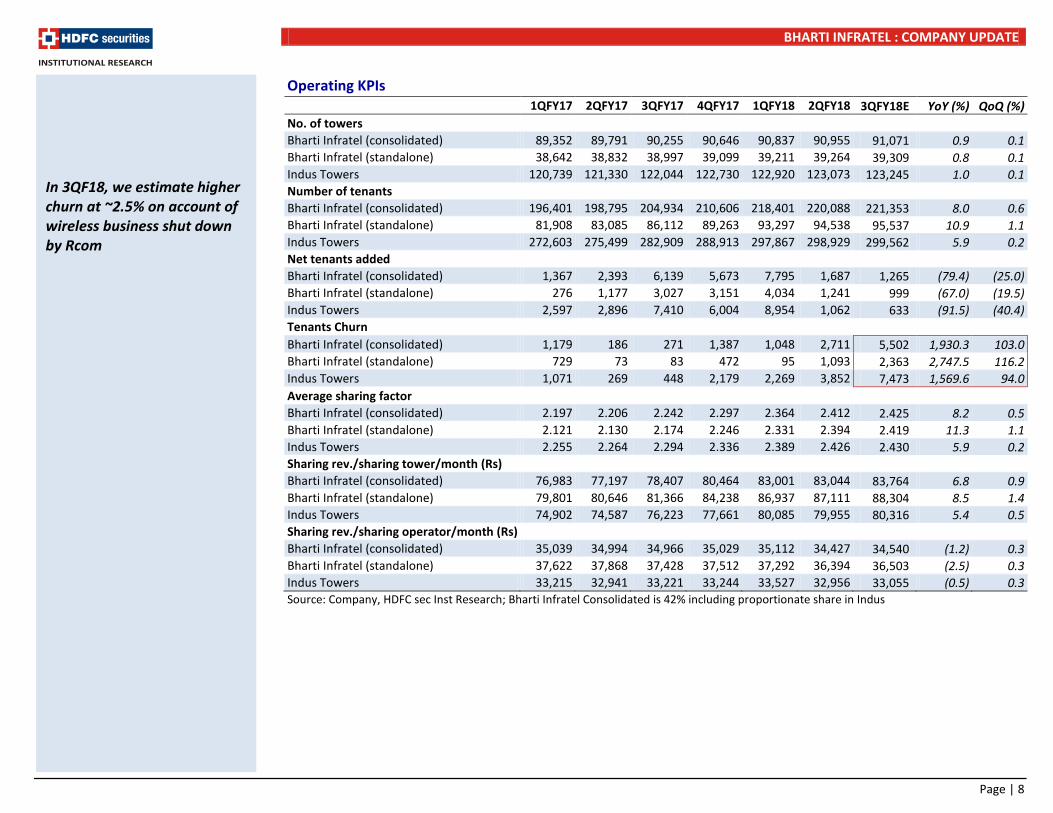
Operating KPIs 1QFY17 2QFY17 3QFY17 4QFY17 1QFY18 2QFY18 3QFY18E YoY (%) QoQ (%) No. of towers
Bharti Infratel (consolidated) 89,352 89,791 90,255 90,646 90,837 90,955 91,071 0.9 0.1 Bharti Infratel (standalone) 38,642 38,832 38,997 39,099 39,211 39,264 39,309 0.8 0.1 Indus Towers 120,739 121,330 122,044 122,730 122,920 123,073 123,245 1.0 0.1 Number of tenants
Bharti Infratel (consolidated) 196,401 198,795 204,934 210,606 218,401 220,088 221,353 8.0 0.6 Bharti Infratel (standalone) 81,908 83,085 86,112 89,263 93,297 94,538 95,537 10.9 1.1 Indus Towers 272,603 275,499 282,909 288,913 297,867 298,929 299,562 5.9 0.2 Net tenants added
Bharti Infratel (consolidated) 1,367 2,393 6,139 5,673 7,795 1,687 1,265 (79.4) (25.0) Bharti Infratel (standalone) 276 1,177 3,027 3,151 4,034 1,241 999 (67.0) (19.5) Indus Towers 2,597 2,896 7,410 6,004 8,954 1,062 633 (91.5) (40.4) Tenants Churn
Bharti Infratel (consolidated) 1,179 186 271 1,387 1,048 2,711 5,502 1,930.3 103.0 Bharti Infratel (standalone) 729 73 83 472 95 1,093 2,363 2,747.5 116.2 Indus Towers 1,071 269 448 2,179 2,269 3,852 7,473 1,569.6 94.0 Average sharing factor
Bharti Infratel (consolidated) 2.197 2.206 2.242 2.297 2.364 2.412 2.425 8.2 0.5 Bharti Infratel (standalone) 2.121 2.130 2.174 2.246 2.331 2.394 2.419 11.3 1.1 Indus Towers 2.255 2.264 2.294 2.336 2.389 2.426 2.430 5.9 0.2 Sharing rev./sharing tower/month (Rs)
Bharti Infratel (consolidated) 76,983 77,197 78,407 80,464 83,001 83,044 83,764 6.8 0.9 Bharti Infratel (standalone) 79,801 80,646 81,366 84,238 86,937 87,111 88,304 8.5 1.4 Indus Towers 74,902 74,587 76,223 77,661 80,085 79,955 80,316 5.4 0.5 Sharing rev./sharing operator/month (Rs)
Bharti Infratel (consolidated) 35,039 34,994 34,966 35,029 35,112 34,427 34,540 (1.2) 0.3 Bharti Infratel (standalone) 37,622 37,868 37,428 37,512 37,292 36,394 36,503 (2.5) 0.3 Indus Towers 33,215 32,941 33,221 33,244 33,527 32,956 33,055 (0.5) 0.3 Source: Company, HDFC sec Inst Research; Bharti Infratel Consolidated is 42% including proportionate share in Indus
In 3QF18, we estimate higher churn at ~2.5% on account of wireless business shut down by Rcom
BHARTI INFRATEL : COMPANY UPDATE
Page | 9
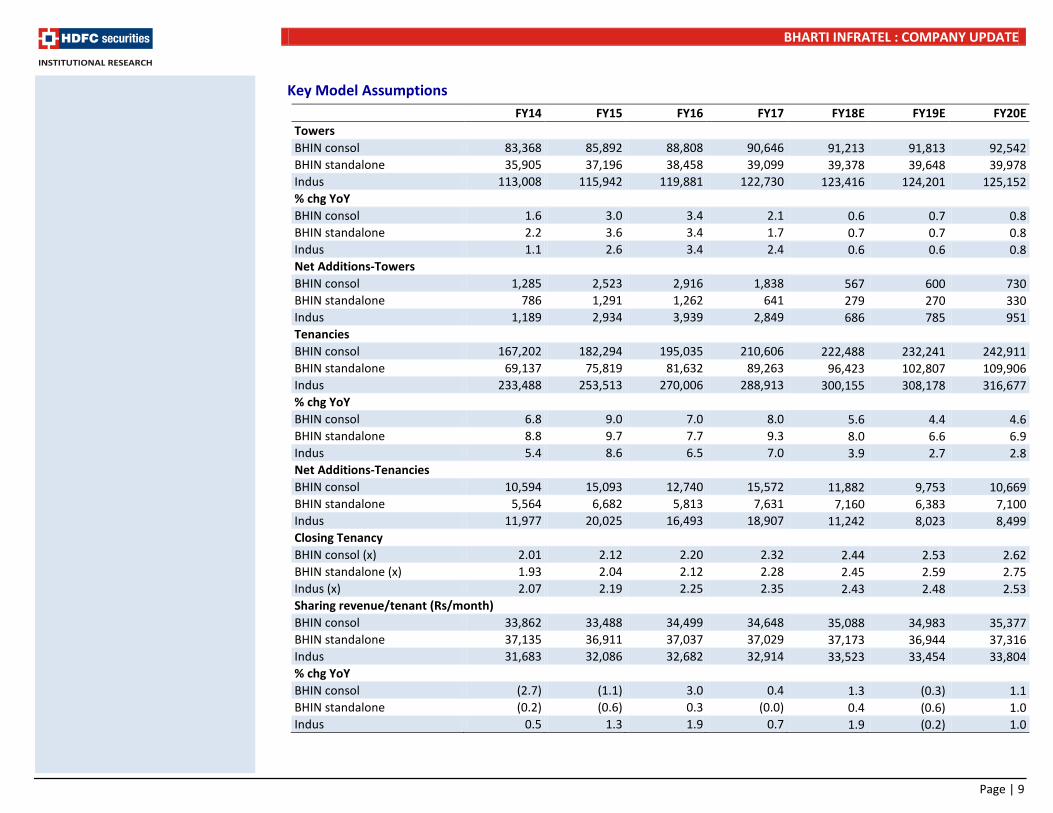
Key Model Assumptions FY14 FY15 FY16 FY17 FY18E FY19E FY20E Towers BHIN consol 83,368 85,892 88,808 90,646 91,213 91,813 92,542 BHIN standalone 35,905 37,196 38,458 39,099 39,378 39,648 39,978 Indus 113,008 115,942 119,881 122,730 123,416 124,201 125,152 % chg YoY
BHIN consol 1.6 3.0 3.4 2.1 0.6 0.7 0.8 BHIN standalone 2.2 3.6 3.4 1.7 0.7 0.7 0.8 Indus 1.1 2.6 3.4 2.4 0.6 0.6 0.8 Net Additions-Towers
BHIN consol 1,285 2,523 2,916 1,838 567 600 730 BHIN standalone 786 1,291 1,262 641 279 270 330 Indus 1,189 2,934 3,939 2,849 686 785 951 Tenancies
BHIN consol 167,202 182,294 195,035 210,606 222,488 232,241 242,911 BHIN standalone 69,137 75,819 81,632 89,263 96,423 102,807 109,906 Indus 233,488 253,513 270,006 288,913 300,155 308,178 316,677 % chg YoY
BHIN consol 6.8 9.0 7.0 8.0 5.6 4.4 4.6 BHIN standalone 8.8 9.7 7.7 9.3 8.0 6.6 6.9 Indus 5.4 8.6 6.5 7.0 3.9 2.7 2.8 Net Additions-Tenancies BHIN consol 10,594 15,093 12,740 15,572 11,882 9,753 10,669 BHIN standalone 5,564 6,682 5,813 7,631 7,160 6,383 7,100 Indus 11,977 20,025 16,493 18,907 11,242 8,023 8,499 Closing Tenancy
BHIN consol (x) 2.01 2.12 2.20 2.32 2.44 2.53 2.62 BHIN standalone (x) 1.93 2.04 2.12 2.28 2.45 2.59 2.75 Indus (x) 2.07 2.19 2.25 2.35 2.43 2.48 2.53 Sharing revenue/tenant (Rs/month) BHIN consol 33,862 33,488 34,499 34,648 35,088 34,983 35,377 BHIN standalone 37,135 36,911 37,037 37,029 37,173 36,944 37,316 Indus 31,683 32,086 32,682 32,914 33,523 33,454 33,804 % chg YoY
BHIN consol (2.7) (1.1) 3.0 0.4 1.3 (0.3) 1.1 BHIN standalone (0.2) (0.6) 0.3 (0.0) 0.4 (0.6) 1.0 Indus 0.5 1.3 1.9 0.7 1.9 (0.2) 1.0
BHARTI INFRATEL : COMPANY UPDATE
Page | 10
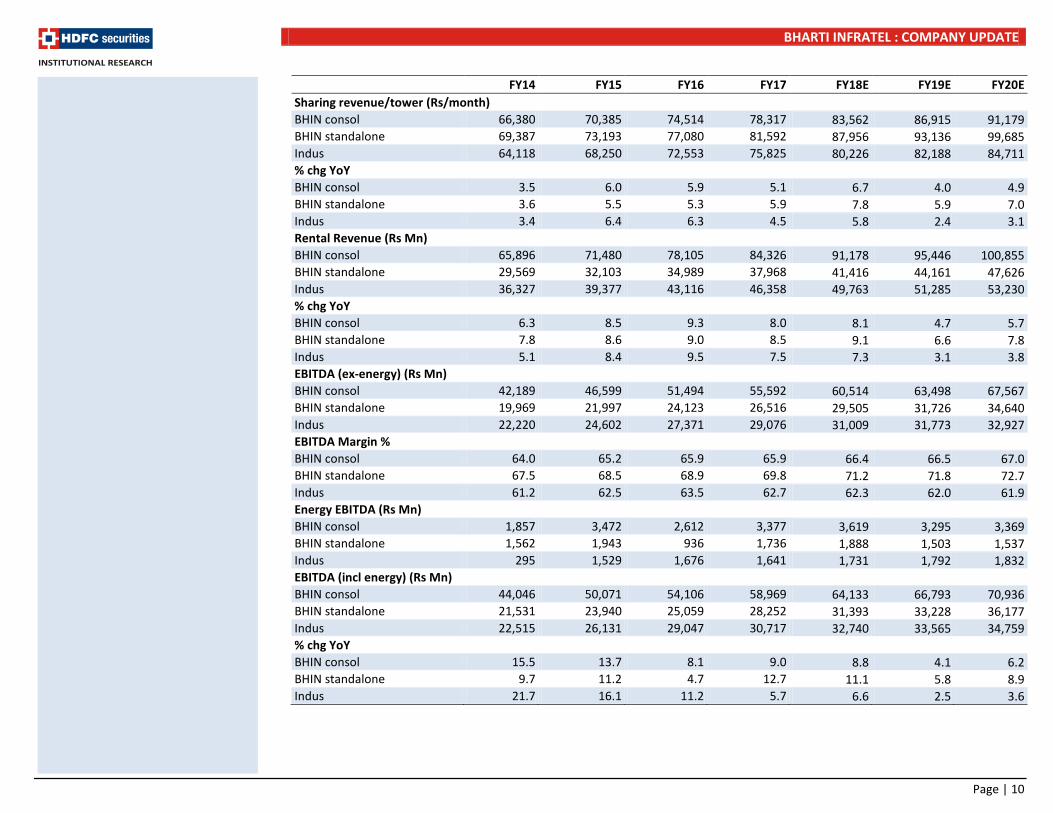
FY14 FY15 FY16 FY17 FY18E FY19E FY20E Sharing revenue/tower (Rs/month) BHIN consol 66,380 70,385 74,514 78,317 83,562 86,915 91,179 BHIN standalone 69,387 73,193 77,080 81,592 87,956 93,136 99,685 Indus 64,118 68,250 72,553 75,825 80,226 82,188 84,711 % chg YoY
BHIN consol 3.5 6.0 5.9 5.1 6.7 4.0 4.9 BHIN standalone 3.6 5.5 5.3 5.9 7.8 5.9 7.0 Indus 3.4 6.4 6.3 4.5 5.8 2.4 3.1 Rental Revenue (Rs Mn)
BHIN consol 65,896 71,480 78,105 84,326 91,178 95,446 100,855 BHIN standalone 29,569 32,103 34,989 37,968 41,416 44,161 47,626 Indus 36,327 39,377 43,116 46,358 49,763 51,285 53,230 % chg YoY
BHIN consol 6.3 8.5 9.3 8.0 8.1 4.7 5.7 BHIN standalone 7.8 8.6 9.0 8.5 9.1 6.6 7.8 Indus 5.1 8.4 9.5 7.5 7.3 3.1 3.8 EBITDA (ex-energy) (Rs Mn) BHIN consol 42,189 46,599 51,494 55,592 60,514 63,498 67,567 BHIN standalone 19,969 21,997 24,123 26,516 29,505 31,726 34,640 Indus 22,220 24,602 27,371 29,076 31,009 31,773 32,927 EBITDA Margin %
BHIN consol 64.0 65.2 65.9 65.9 66.4 66.5 67.0 BHIN standalone 67.5 68.5 68.9 69.8 71.2 71.8 72.7 Indus 61.2 62.5 63.5 62.7 62.3 62.0 61.9 Energy EBITDA (Rs Mn)
BHIN consol 1,857 3,472 2,612 3,377 3,619 3,295 3,369 BHIN standalone 1,562 1,943 936 1,736 1,888 1,503 1,537 Indus 295 1,529 1,676 1,641 1,731 1,792 1,832 EBITDA (incl energy) (Rs Mn) BHIN consol 44,046 50,071 54,106 58,969 64,133 66,793 70,936 BHIN standalone 21,531 23,940 25,059 28,252 31,393 33,228 36,177 Indus 22,515 26,131 29,047 30,717 32,740 33,565 34,759 % chg YoY BHIN consol 15.5 13.7 8.1 9.0 8.8 4.1 6.2 BHIN standalone 9.7 11.2 4.7 12.7 11.1 5.8 8.9 Indus 21.7 16.1 11.2 5.7 6.6 2.5 3.6
BHARTI INFRATEL : COMPANY UPDATE
Page | 11
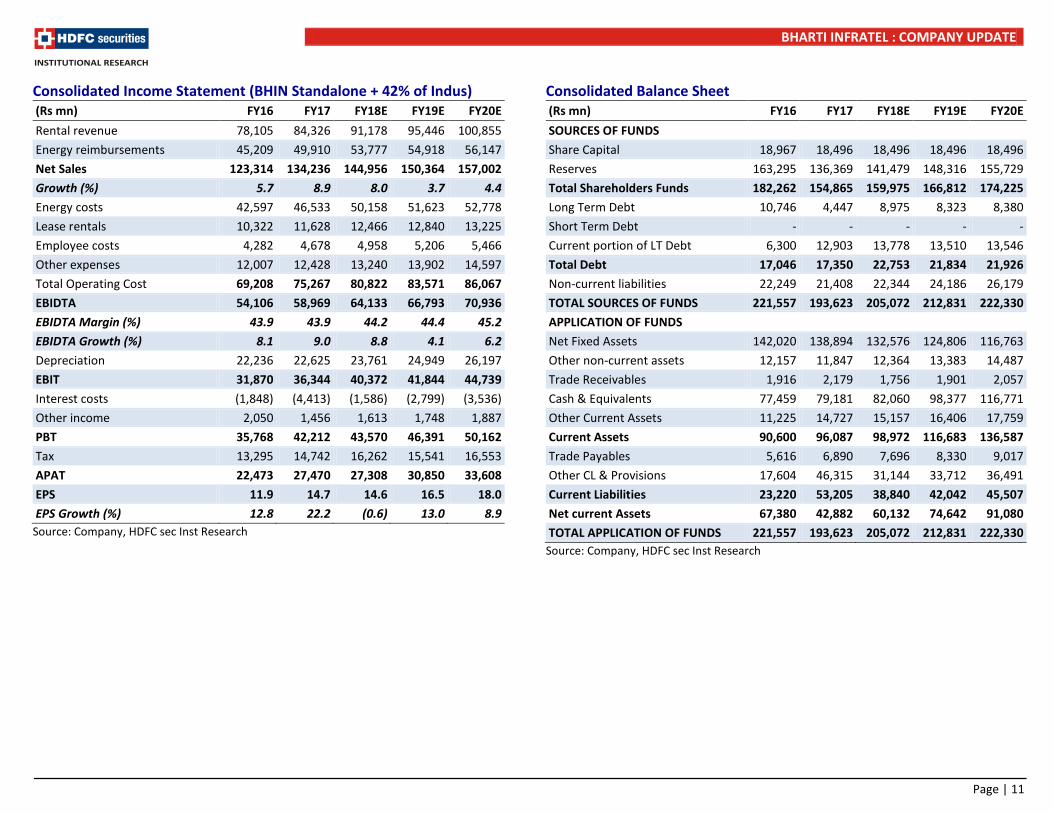
Consolidated Income Statement (BHIN Standalone + 42% of Indus) (Rs mn) FY16 FY17 FY18E FY19E FY20E Rental revenue 78,105 84,326 91,178 95,446 100,855 Energy reimbursements 45,209 49,910 53,777 54,918 56,147 Net Sales 123,314 134,236 144,956 150,364 157,002 Growth (%) 5.7 8.9 8.0 3.7 4.4 Energy costs 42,597 46,533 50,158 51,623 52,778 Lease rentals 10,322 11,628 12,466 12,840 13,225 Employee costs 4,282 4,678 4,958 5,206 5,466 Other expenses 12,007 12,428 13,240 13,902 14,597 Total Operating Cost 69,208 75,267 80,822 83,571 86,067 EBIDTA 54,106 58,969 64,133 66,793 70,936 EBIDTA Margin (%) 43.9 43.9 44.2 44.4 45.2 EBIDTA Growth (%) 8.1 9.0 8.8 4.1 6.2 Depreciation 22,236 22,625 23,761 24,949 26,197 EBIT 31,870 36,344 40,372 41,844 44,739 Interest costs (1,848) (4,413) (1,586) (2,799) (3,536) Other income 2,050 1,456 1,613 1,748 1,887 PBT 35,768 42,212 43,570 46,391 50,162 Tax 13,295 14,742 16,262 15,541 16,553 APAT 22,473 27,470 27,308 30,850 33,608 EPS 11.9 14.7 14.6 16.5 18.0 EPS Growth (%) 12.8 22.2 (0.6) 13.0 8.9
Source: Company, HDFC sec Inst Research
Consolidated Balance Sheet (Rs mn) FY16 FY17 FY18E FY19E FY20E SOURCES OF FUNDS Share Capital 18,967 18,496 18,496 18,496 18,496 Reserves 163,295 136,369 141,479 148,316 155,729 Total Shareholders Funds 182,262 154,865 159,975 166,812 174,225 Long Term Debt 10,746 4,447 8,975 8,323 8,380 Short Term Debt - - - - - Current portion of LT Debt 6,300 12,903 13,778 13,510 13,546 Total Debt 17,046 17,350 22,753 21,834 21,926 Non-current liabilities 22,249 21,408 22,344 24,186 26,179 TOTAL SOURCES OF FUNDS 221,557 193,623 205,072 212,831 222,330 APPLICATION OF FUNDS Net Fixed Assets 142,020 138,894 132,576 124,806 116,763 Other non-current assets 12,157 11,847 12,364 13,383 14,487 Trade Receivables 1,916 2,179 1,756 1,901 2,057 Cash & Equivalents 77,459 79,181 82,060 98,377 116,771 Other Current Assets 11,225 14,727 15,157 16,406 17,759 Current Assets 90,600 96,087 98,972 116,683 136,587 Trade Payables 5,616 6,890 7,696 8,330 9,017 Other CL & Provisions 17,604 46,315 31,144 33,712 36,491 Current Liabilities 23,220 53,205 38,840 42,042 45,507 Net current Assets 67,380 42,882 60,132 74,642 91,080 TOTAL APPLICATION OF FUNDS 221,557 193,623 205,072 212,831 222,330
Source: Company, HDFC sec Inst Research
BHARTI INFRATEL : COMPANY UPDATE
Page | 12
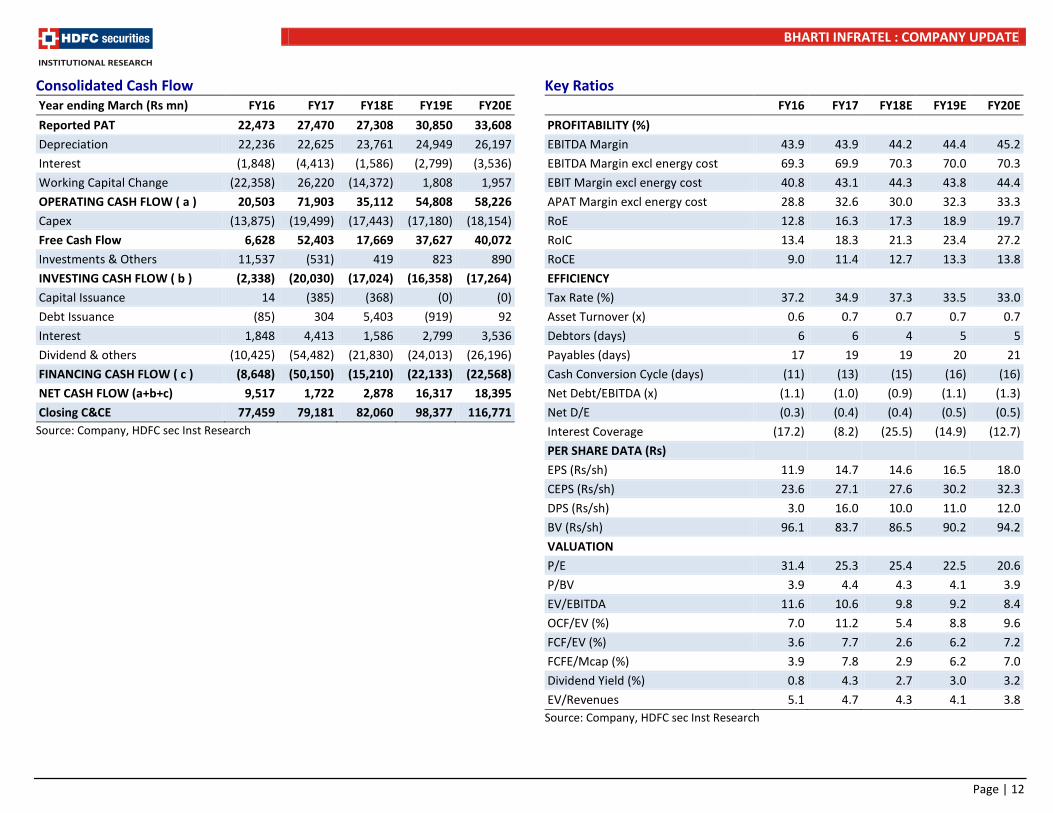
Consolidated Cash Flow Year ending March (Rs mn) FY16 FY17 FY18E FY19E FY20E Reported PAT 22,473 27,470 27,308 30,850 33,608 Depreciation 22,236 22,625 23,761 24,949 26,197 Interest (1,848) (4,413) (1,586) (2,799) (3,536) Working Capital Change (22,358) 26,220 (14,372) 1,808 1,957 OPERATING CASH FLOW ( a ) 20,503 71,903 35,112 54,808 58,226 Capex (13,875) (19,499) (17,443) (17,180) (18,154) Free Cash Flow 6,628 52,403 17,669 37,627 40,072 Investments & Others 11,537 (531) 419 823 890 INVESTING CASH FLOW ( b ) (2,338) (20,030) (17,024) (16,358) (17,264) Capital Issuance 14 (385) (368) (0) (0) Debt Issuance (85) 304 5,403 (919) 92 Interest 1,848 4,413 1,586 2,799 3,536 Dividend & others (10,425) (54,482) (21,830) (24,013) (26,196) FINANCING CASH FLOW ( c ) (8,648) (50,150) (15,210) (22,133) (22,568) NET CASH FLOW (a+b+c) 9,517 1,722 2,878 16,317 18,395 Closing C&CE 77,459 79,181 82,060 98,377 116,771
Source: Company, HDFC sec Inst Research
Key Ratios FY16 FY17 FY18E FY19E FY20E PROFITABILITY (%) EBITDA Margin 43.9 43.9 44.2 44.4 45.2 EBITDA Margin excl energy cost 69.3 69.9 70.3 70.0 70.3 EBIT Margin excl energy cost 40.8 43.1 44.3 43.8 44.4 APAT Margin excl energy cost 28.8 32.6 30.0 32.3 33.3 RoE 12.8 16.3 17.3 18.9 19.7 RoIC 13.4 18.3 21.3 23.4 27.2 RoCE 9.0 11.4 12.7 13.3 13.8 EFFICIENCY Tax Rate (%) 37.2 34.9 37.3 33.5 33.0 Asset Turnover (x) 0.6 0.7 0.7 0.7 0.7 Debtors (days) 6 6 4 5 5 Payables (days) 17 19 19 20 21 Cash Conversion Cycle (days) (11) (13) (15) (16) (16) Net Debt/EBITDA (x) (1.1) (1.0) (0.9) (1.1) (1.3) Net D/E (0.3) (0.4) (0.4) (0.5) (0.5) Interest Coverage (17.2) (8.2) (25.5) (14.9) (12.7) PER SHARE DATA (Rs) EPS (Rs/sh) 11.9 14.7 14.6 16.5 18.0 CEPS (Rs/sh) 23.6 27.1 27.6 30.2 32.3 DPS (Rs/sh) 3.0 16.0 10.0 11.0 12.0 BV (Rs/sh) 96.1 83.7 86.5 90.2 94.2 VALUATION P/E 31.4 25.3 25.4 22.5 20.6 P/BV 3.9 4.4 4.3 4.1 3.9 EV/EBITDA 11.6 10.6 9.8 9.2 8.4 OCF/EV (%) 7.0 11.2 5.4 8.8 9.6 FCF/EV (%) 3.6 7.7 2.6 6.2 7.2 FCFE/Mcap (%) 3.9 7.8 2.9 6.2 7.0 Dividend Yield (%) 0.8 4.3 2.7 3.0 3.2 EV/Revenues 5.1 4.7 4.3 4.1 3.8 Source: Company, HDFC sec Inst Research
BHARTI INFRATEL : COMPANY UPDATE
Page | 13
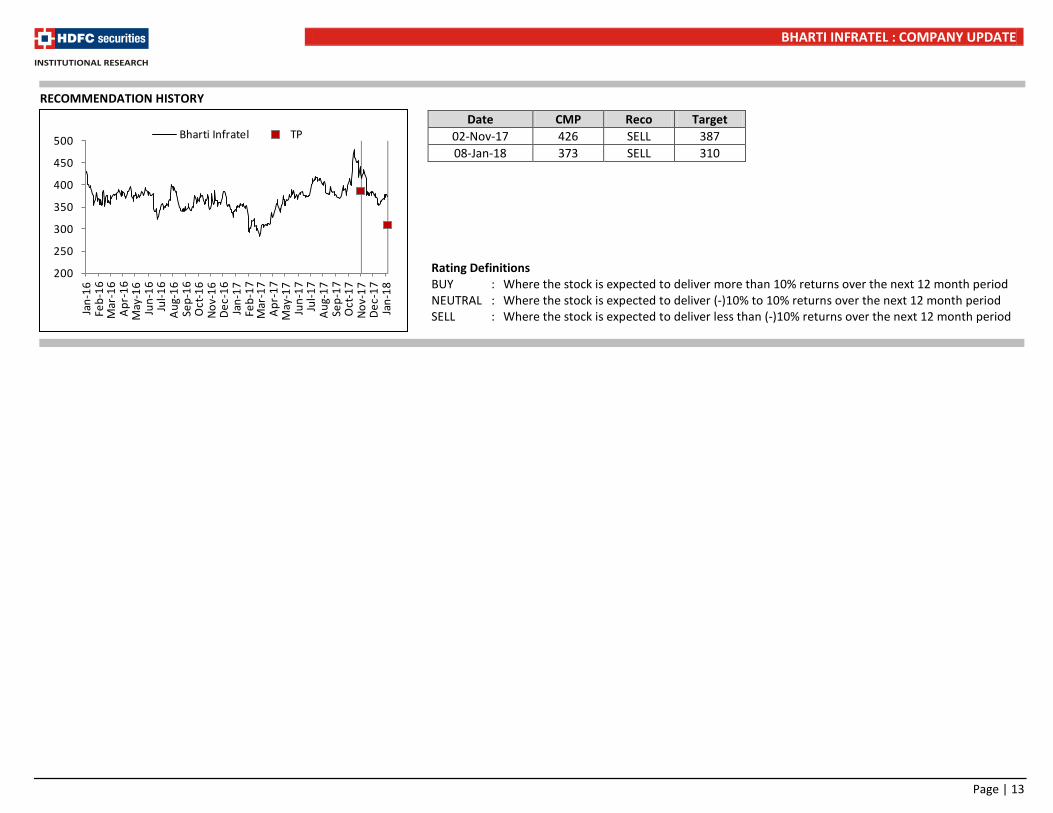
Rating Definitions BUY : Where the stock is expected to deliver more than 10% returns over the next 12 month period NEUTRAL : Where the stock is expected to deliver (-)10% to 10% returns over the next 12 month period SELL : Where the stock is expected to deliver less than (-)10% returns over the next 12 month period
Date CMP Reco Target 02-Nov-17 426 SELL 387 08-Jan-18 373 SELL 310
RECOMMENDATION HISTORY
200
250
300
350
400
450
500
Jan-
16Fe
b-16
Mar
-16
Apr-
16M
ay-1
6Ju
n-16
Jul-1
6Au
g-16
Sep-
16O
ct-1
6No
v-16
Dec-
16Ja
n-17
Feb-
17M
ar-1
7Ap
r-17
May
-17
Jun-
17Ju
l-17
Aug-
17Se
p-17
Oct
-17
Nov-
17De
c-17
Jan-
18
Bharti Infratel TP
BHARTI INFRATEL : COMPANY UPDATE
Page | 14
Disclosure: I, Himanshu Shah, CA, author and the name subscribed to this report, hereby certify that all of the views expressed in this research report accurately reflect our views about the subject issuer(s) or securities. HSL has no material adverse disciplinary history as on the date of publication of this report. We also certify that no part of our compensation was, is, or will be directly or indirectly related to the specific recommendation(s) or view(s) in this report. Research Analyst or his/her relative or HDFC Securities Ltd. does not have any financial interest in the subject company. Also Research Analyst or his relative or HDFC Securities Ltd. or its Associate may have beneficial ownership of 1% or more in the subject company at the end of the month immediately preceding the date of publication of the Research Report. Further Research Analyst or his relative or HDFC Securities Ltd. or its associate does not have any material conflict of interest. Any holding in stock –No HDFC Securities Limited (HSL) is a SEBI Registered Research Analyst having registration no. INH000002475. Disclaimer: This report has been prepared by HDFC Securities Ltd and is meant for sole use by the recipient and not for circulation. The information and opinions contained herein have been compiled or arrived at, based upon information obtained in good faith from sources believed to be reliable. Such information has not been independently verified and no guaranty, representation of warranty, express or implied, is made as to its accuracy, completeness or correctness. All such information and opinions are subject to change without notice. This document is for information purposes only. Descriptions of any company or companies or their securities mentioned herein are not intended to be complete and this document is not, and should not be construed as an offer or solicitation of an offer, to buy or sell any securities or other financial instruments. This report is not directed to, or intended for display, downloading, printing, reproducing or for distribution to or use by, any person or entity who is a citizen or resident or located in any locality, state, country or other jurisdiction where such distribution, publication, reproduction, availability or use would be contrary to law or regulation or what would subject HSL or its affiliates to any registration or licensing requirement within such jurisdiction. If this report is inadvertently send or has reached any individual in such country, especially, USA, the same may be ignored and brought to the attention of the sender. This document may not be reproduced, distributed or published for any purposes without prior written approval of HSL. Foreign currencies denominated securities, wherever mentioned, are subject to exchange rate fluctuations, which could have an adverse effect on their value or price, or the income derived from them. In addition, investors in securities such as ADRs, the values of which are influenced by foreign currencies effectively assume currency risk. It should not be considered to be taken as an offer to sell or a solicitation to buy any security. HSL may from time to time solicit from, or perform broking, or other services for, any company mentioned in this mail and/or its attachments. HSL and its affiliated company(ies), their directors and employees may; (a) from time to time, have a long or short position in, and buy or sell the securities of the company(ies) mentioned herein or (b) be engaged in any other transaction involving such securities and earn brokerage or other compensation or act as a market maker in the financial instruments of the company(ies) discussed herein or act as an advisor or lender/borrower to such company(ies) or may have any other potential conflict of interests with respect to any recommendation and other related information and opinions. HSL, its directors, analysts or employees do not take any responsibility, financial or otherwise, of the losses or the damages sustained due to the investments made or any action taken on basis of this report, including but not restricted to, fluctuation in the prices of shares and bonds, changes in the currency rates, diminution in the NAVs, reduction in the dividend or income, etc. HSL and other group companies, its directors, associates, employees may have various positions in any of the stocks, securities and financial instruments dealt in the report, or may make sell or purchase or other deals in these securities from time to time or may deal in other securities of the companies / organizations described in this report. HSL or its associates might have managed or co-managed public offering of securities for the subject company or might have been mandated by the subject company for any other assignment in the past twelve months. HSL or its associates might have received any compensation from the companies mentioned in the report during the period preceding twelve months from t date of this report for services in respect of managing or co-managing public offerings, corporate finance, investment banking or merchant banking, brokerage services or other advisory service in a merger or specific transaction in the normal course of business. HSL or its analysts did not receive any compensation or other benefits from the companies mentioned in the report or third party in connection with preparation of the research report. Accordingly, neither HSL nor Research Analysts have any material conflict of interest at the time of publication of this report. Compensation of our Research Analysts is not based on any specific merchant banking, investment banking or brokerage service transactions. HSL may have issued other reports that are inconsistent with and reach different conclusion from the information presented in this report. Research entity has not been engaged in market making activity for the subject company. Research analyst has not served as an officer, director or employee of the subject company. We have not received any compensation/benefits from the subject company or third party in connection with the Research Report. HDFC securities Limited, I Think Techno Campus, Building - B, "Alpha", Office Floor 8, Near Kanjurmarg Station, Opp. Crompton Greaves, Kanjurmarg (East), Mumbai 400 042 Phone: (022) 3075 3400 Fax: (022) 2496 5066 Compliance Officer: Binkle R. Oza Email: [email protected] Phone: (022) 3045 3600 HDFC Securities Limited, SEBI Reg. No.: NSE-INB/F/E 231109431, BSE-INB/F 011109437, AMFI Reg. No. ARN: 13549, PFRDA Reg. No. POP: 04102015, IRDA Corporate Agent License No.: HDF 2806925/HDF C000222657, SEBI Research Analyst Reg. No.: INH000002475, CIN - U67120MH2000PLC152193 Mutual Funds Investments are subject to market risk. Please read the offer and scheme related documents carefully before investing.
BHARTI INFRATEL : COMPANY UPDATE
Page | 15
HDFC securities Institutional Equities Unit No. 1602, 16th Floor, Tower A, Peninsula Business Park, Senapati Bapat Marg, Lower Parel, Mumbai - 400 013 Board : +91-22-6171-7330 www.hdfcsec.com