079_D 3.3-3.5 Life-Cycle Assessment and Environmental Assessment
120
Proposal full title: Algae and aquatic biomass for a sustainable production of 2 nd generation biofuels Proposal acronym: AquaFUELs Type of funding scheme: Cooperation Theme 5 Energy Deliverables 3.3 and 3.5 Lifecycle assessment and environmental assessment Name of the coordinating person: Mr. Raffaello Garofalo Coordinator email: ebb@ebb‐eu.org Coordinator phone: +32 2 7632477 Coordinator fax: +32 2 7630457 Disclaimer: the views expressed in this document are purely the authors' own and do not reflect the views of the European Commission REV Date Organisation Beneficiaries involved Dissemination level Rev 0 29/03/2011 Dongxu Xu, Raphael Slade, Ausilio Bauen IMPERIAL BGU, EBB, IMPERIAL, IMIC, NE PU Rev 1 10/05/2011 F. Gabriel Acien UAL UAL PU Rev 2 15/05/2011 Dongxu Xu, Raphael Slade, Ausilio Bauen IMPERIAL IMPERIAL PU Rev3 10/06/2011 Benoit Queguineur, Jessica Ratcliff ISC ISC PU FINAL 15/06/2011 Dongxu Xu, Raphael Slade, Ausilio Bauen IMPERIAL IMPERIAL PU
description
Algae and aquatic biomass for a sustainable production of 2nd generation biofuels
Transcript of 079_D 3.3-3.5 Life-Cycle Assessment and Environmental Assessment

Proposal full title:
Algae and aquatic biomass for a sustainable production of 2nd generation biofuels
Proposal acronym:
AquaFUELs
Type of funding scheme:
Cooperation
Theme 5 Energy
Deliverables 3.3 and 3.5
Lifecycle assessment and environmental assessment
Name of the coordinating person:
Mr. Raffaello Garofalo Coordinator email: ebb@ebb‐eu.org Coordinator phone: +32 2 7632477 Coordinator fax: +32 2 7630457
Disclaimer: the views expressed in this document are purely the authors' own and do not reflect the views of
the European Commission
REV Date Organisation Beneficiaries involved
Dissemination level
Rev 0 29/03/2011 Dongxu Xu, Raphael Slade, Ausilio Bauen
IMPERIAL BGU, EBB, IMPERIAL, IMIC, NE
PU
Rev 1 10/05/2011 F. Gabriel Acien UAL UAL PU
Rev 2 15/05/2011 Dongxu Xu, Raphael Slade, Ausilio Bauen
IMPERIAL IMPERIAL PU
Rev3 10/06/2011 Benoit Queguineur, Jessica Ratcliff
ISC ISC PU
FINAL 15/06/2011 Dongxu Xu, Raphael Slade, Ausilio Bauen
IMPERIAL IMPERIAL PU

AQUAFUEL FP7 – 241301‐2
Coordination Action
FP7‐ENERGY‐2009‐1
1
Table of contents
1. Introduction ....................................................................................................... 9
1.1 Objective and structure of this Report................................................................... 9
1.2 The Aquafuels project .......................................................................................... 10
2. An introduction to algae cultivation and use .................................................... 11
2.1 Algae Strains ......................................................................................................... 12
2.1.2 The US Aquatic Species Program (ASP) ....................................................... 14
2.2 Micro‐algae Production Systems: Raceway Ponds and Photo‐bioreactors.......... 14
2.2.2 Open Pond Systems..................................................................................... 15
2.2.3 Closed Systems ............................................................................................ 16
2.3 Recovery of Biomass: harvesting.......................................................................... 21
2.3.2 Lipid and product extraction ....................................................................... 22
2.4 Conversion to Biofuels.......................................................................................... 23
2.5 Biomass productivity ............................................................................................ 24
2.5.2 Solar Conversion Efficiency.......................................................................... 25
2.5.3 Lipid biosynthesis and oil producing algae strain selection ........................ 27
3. Life Cycle Assessments of algae biomass production ........................................ 28
3.1 Introduction to Life Cycle Assessment ................................................................. 28
3.2 System Boundaries ............................................................................................... 30
3.2.2 LCA boundary selection: EU Guidelines ...................................................... 30
3.2.3 LCA boundary selection: RMEE method ..................................................... 30
3.2.4 Allocation guidelines ................................................................................... 31
3.2.5 Impact Assessment...................................................................................... 31

AQUAFUEL FP7 – 241301‐2
Coordination Action
FP7‐ENERGY‐2009‐1
2
4. Review of micro‐algae LCA ............................................................................... 33
4.1 Functional Unit ..................................................................................................... 34
4.2 System boundaries ............................................................................................... 35
4.3 Allocation strategies ............................................................................................. 35
4.4 Sources of data ..................................................................................................... 36
4.5 Algae composition and strain assumptions.......................................................... 37
4.6 Productivity assumptions ..................................................................................... 38
4.7 Global Warming Potential .................................................................................... 39
4.8 Other critiques levied at algae LCA....................................................................... 40
4.9 Conclusions on the existing LCA studies............................................................... 41
5. Meta‐analysis of micro‐algae production systems ............................................ 42
5.1 Meta‐model approach and assumptions. ............................................................ 42
5.1.2 Meta‐model system description and boundaries ....................................... 43
5.1.3 Functional Unit and basis for comparison................................................... 45
5.2 Results .................................................................................................................. 46
5.3 Conclusions........................................................................................................... 54
6. Environmental impacts of micro‐algae production ............................................56
6.1 Water Resources................................................................................................... 56
6.2 Land Use ............................................................................................................... 57
6.3 Nutrient and Fertilizer Use ................................................................................... 58
6.4 Carbon fertilisation............................................................................................... 58
6.5 Fossil Fuel Inputs .................................................................................................. 59
6.6 Eutrophication ...................................................................................................... 59
6.7 Genetic Modified Algae ........................................................................................ 60
6.8 Algal toxicity ......................................................................................................... 61

AQUAFUEL FP7 – 241301‐2
Coordination Action
FP7‐ENERGY‐2009‐1
3
6.9 Conclusions........................................................................................................... 61
7. Review of macro‐algae LCA ...............................................................................62
8. Environmental impacts of macro‐algae production .......................................... 66
8.1 Land use and near‐shore area use........................................................................ 66
8.1.2 Cultivation at sea......................................................................................... 66
8.1.3 Tank based cultivation on land.................................................................... 67
8.1.4 On‐shore facilities for sea and tank cultivation, wild harvest and bloom
harvest……….................................................................................................................... 67
8.2 Use of Near‐shore/Off‐shore space...................................................................... 67
8.3 Freshwater Use..................................................................................................... 68
8.4 Fertiliser and nutrients ......................................................................................... 68
8.4.2 Cultivation at sea:........................................................................................ 68
8.4.3 Land‐based tank cultivation ........................................................................ 70
8.5 Macro‐algal Domestication and Genetic Engineering.......................................... 71
8.6 Ecosystem Effects ................................................................................................. 72
8.6.2 Cultivation at Sea......................................................................................... 72
8.6.3 Land‐based Tank Cultivation ....................................................................... 73
8.6.4 Wild Harvest................................................................................................ 73
8.6.5 Harvest of blooms ....................................................................................... 74
8.7 Environmental Contamination ............................................................................. 74
8.8 Conclusions........................................................................................................... 75
9. Conclusions and recommendations .................................................................. 75
9.1 Conclusions for micro‐algae LCA, and environmental impacts ............................ 75
9.2 Conclusions for macro‐algae LCA and environmental impacts ............................ 77

AQUAFUEL FP7 – 241301‐2
Coordination Action
FP7‐ENERGY‐2009‐1
4
10. References ........................................................................................................78
11. Annex 1: Heterotrophic Microalgae...................................................................87
12. Annex 2: Review of existing micro‐algae LCA Studies........................................ 89
12.1 Kadam 2001/2 ..................................................................................................... 89
12.1.2 Functional Unit and System Boundaries ..................................................... 89
12.1.3 Source of Data ............................................................................................. 89
12.1.4 Process......................................................................................................... 90
12.1.5 Results ......................................................................................................... 91
12.1.6 Discussion.................................................................................................... 91
12.2 Lardon et al. 2009............................................................................................... 91
12.2.2 Functional Unit and System Boundaries ..................................................... 92
12.2.3 Source of Data ............................................................................................. 92
12.2.4 Process......................................................................................................... 92
12.2.5 Results ......................................................................................................... 93
12.2.6 Discussion.................................................................................................... 95
12.3 Clarens et.al. (2010) ........................................................................................... 95
12.3.2 Functional Unit and System Boundaries ..................................................... 95
12.3.3 Source of Data ............................................................................................. 96
12.3.4 Process......................................................................................................... 96
12.3.5 Results ......................................................................................................... 97
12.3.6 Discussion.................................................................................................... 98
12.4 Jorquera et.al. (2010) ....................................................................................... 100
12.4.2 Functional Unit and System Boundaries ................................................... 100
12.4.3 Results ....................................................................................................... 101
12.4.4 Discussion.................................................................................................. 101

AQUAFUEL FP7 – 241301‐2
Coordination Action
FP7‐ENERGY‐2009‐1
5
12.5 Sander& Murthy (2010) ................................................................................... 102
12.5.2 Functional Unit and System Boundaries ................................................... 102
12.5.3 Source of Data ........................................................................................... 102
12.5.4 Process....................................................................................................... 103
12.5.5 Results ....................................................................................................... 103
12.5.6 Discussion.................................................................................................. 106
12.6 Stephenson et.al. (2010) .................................................................................. 106
12.6.2 Functional Unit and System Boundaries ................................................... 106
12.6.3 Source of Data ........................................................................................... 107
12.6.4 Process....................................................................................................... 107
12.6.5 Results ....................................................................................................... 108
12.6.6 Discussion.................................................................................................. 110
12.7 Campbell et.al. (2010) ...................................................................................... 110
12.7.2 Functional Unit and System Boundaries ................................................... 110
12.7.3 Source of Data ........................................................................................... 110
12.7.4 Process....................................................................................................... 111
12.7.5 Results ....................................................................................................... 111
12.7.6 Discussion.................................................................................................. 113
13. Annex 3: Expert Stakeholders participating in this study .................................114
14. Annex 4: Questionnaire...................................................................................115
15. Annex 5: Assumptions of Normalized Modelling .............................................118
16. Annex 6: Example of data normalization .........................................................119

AQUAFUEL FP7 – 241301‐2
Coordination Action
FP7‐ENERGY‐2009‐1
6
List of Figures
Figure 2.1 : A raceway pond and farm .................................................................................... 16
Figure 2.2: Tubular photobioreactor system & Flat plate Photobioreactor............................ 19
Figure 2.3: Algal biomass conversion strategies...................................................................... 23
Figure 2.4: Yearly sum of global solar irradiance averages over the period of 1981 to 2000. 26
Figure 2.5: World map of algae biomass productivity ............................................................ 26
Figure 3.1: The analytical stages in Life Cycle Assessment ..................................................... 29
Figure 5.1: Algae LCA meta‐modeling approach..................................................................... 43
Figure 5.2: Description of meta‐model process ...................................................................... 44
Figure 5.3: Definition of Net Energy Ratio (NER) .................................................................... 45
Figure 5.4: NER Biomass production: comparison of published values with normalised values
for algal biomass production. ............................................................................... 47
Figure 5.5: Net Energy Ratio for biomass production in raceway ponds: comparison of
published values with normalised values............................................................. 49
Figure 5.6: Net Energy Ratio for biomass production in photobioreactors PBRs: comparison
of published values with normalised values for algal biomass production.......... 50
Figure 5.7: Illustrative estimates for carbon dioxide emissions from algal biomass production
in raceway ponds.................................................................................................. 51
Figure 5.8: Illustrative estimates for carbon dioxide emissions from algal biomass production
in photobioreactors PBRs. .................................................................................... 52
Figure 5.7: Net Energy Ratio for biomass and lipid production in raceway ponds: comparison
of normalised values............................................................................................. 53
Figure 5.8: Net Energy Ratio for biomass and lipid production in PBRs: comparison of
normalised values................................................................................................. 54
Figure 10.1: General system boundaries for the comparison of electricity production via coal
firing vs. coal/algae co‐firing in Kadam’s study .................................................... 89
AQUAFUEL FP7 – 241301‐2
Coordination Action
FP7‐ENERGY‐2009‐1
7
Figure 10.2: Simplified flow diagram for microalgae production in Kadam’s study ............... 90
Figure 10.3: Process chain overview from Lardon’s study ...................................................... 93
Figure 10.4: Comparison of impacts categories in Lardon et al ’s study................................. 95
Figure 10.5: Schematic of system considered in Clarens study .............................................. 97
Figure 10.6: System Process in Jorquera’s study................................................................... 100
Figure 10.7: Process flow diagram from Sander & Murthy’s study ...................................... 104
Figure 10.8: Energy and Emissions associated with unit process
in Sander & Murthy’s study................................................................................ 105
Figure 10.9: Process chain for production of 1 ton biodiesel in Stephenson et al’s study ... 108
Figure 10.10: LCA results for base case production of biodiesel
from Stephenson et al’s study ............................................................................ 109

AQUAFUEL FP7 – 241301‐2
Coordination Action
FP7‐ENERGY‐2009‐1
8
List of Tables
Table 2.1 : Overview on commercially produced micro‐algae ................................................ 13
Table 2.2: Overall Comparison of Open versus Closed Systems.............................................. 18
Table 2.3: Illustrative energy requirements of a tubular photo‐bioreactor’s design .............. 19
Table 2.4: Advantages and disadvantages of alternative closed photobioreactor designs..... 20
Table 4.1: LCA studies on algae derived fuels ......................................................................... 33
Table 4.2: Function units used in the LCA studies ................................................................... 35
Table 4.3: Algae composition assumption in LCA studies ....................................................... 38
Table 4.4: Algae productivity assumptions used in LCA studies.............................................. 38
Table 4.5: Overview of Global Warming Potential claims in algae biomass LCA..................... 40
Table 10.1: Most important material and energy flows generated by the production
of 1kg of biodiesel from Lardon et al’s study ....................................................... 94
Table 10.2: Life cycle burdens of Algae, Corn, Canola, and Switch grass in Virginia............... 98
Table 10.3: Comparative analysis of three cultivation methods from Jorquera’s study ....... 101
Table 10.5: GHG emissions (kg CO2 equivalent) for 1 ton km truck use ............................... 111
Error! No table of contents entries found.

AQUAFUEL FP7 – 241301‐2
Coordination Action
FP7‐ENERGY‐2009‐1
9
1. Introduction
1.1 Objective and structure of this Report
This report explores the environmental impacts of algae production and the merits of Life
Cycle Assessment (LCA) as a tool for examining the future environmental performance of
transport fuels produced from algal biomass. Specifically, this report examines:
• The current production methods and future possibilities of using algae to produce
biofuels.
• The current status of Life Cycle Assessments of algae derived fuels that are available in
the academic literature; the strengths and weakness of these studies are assessed in
detail.
• The environmental impacts from micro‐algae and macro‐algae cultivation
The report is structured as follows:
• Chapter 1 describes the objectives and structure of the report, and introduces the
AquaFUELS project of which this research is part.
• Chapter 2 introduces the basic concepts of algae cultivation and processing and
reviews the options for cultivation, harvesting and biofuel production.
• Chapter 3 describes the principles of life cycle assessment and the alternative
approaches to setting system boundaries, and allocating impacts to products.
• Chapter 4 presents an analysis of the micro‐algae LCA that are available in the
academic literature. Strengths and weaknesses are identified and the studies are
critiqued. This critique draws on both literature sources and data gathered from expert
stakeholders.
• Chapter 5 presents a meta‐model of the energetics of micro‐algae production. The
data presented in the LCA studies is re‐analysed and normalised to permit a
comparison of the alternative production systems in terms of 1) the energy produced,
and 2) the energy required to construct and operate the system.
• Chapter 6 reviews the major environment impacts which could influence sitting
decisions for micro‐algae cultivation.

AQUAFUEL FP7 – 241301‐2
Coordination Action
FP7‐ENERGY‐2009‐1
10
• Chapter 7 reviews LCA for macro‐algae
• Chapter 8 review the major environmental impacts associated with macro‐algae
cultivation.
• Chapter 9 presents overall conclusions and recommendations.
1.2 The Aquafuels project
The work presented in this report was undertaken within the context of an EU sponsored
project: Aquafuels (AquaFUELs, 2010). This project aims to bring together and co‐ordinate
existing knowledge, and to establish the state of the art for research, technological
development and demonstration activities regarding the exploitation of algal biomass for 2nd
generation biofuels production. A secondary objective of the project is to put robust and
credible information about algae into the public domain, and thereby counter some of the
more extravagant claims that have been expressed in the media.

AQUAFUEL FP7 – 241301‐2
Coordination Action
FP7‐ENERGY‐2009‐1
11
2. An introduction to algae cultivation and use
Algae are a large and diverse group of plant‐like aquatic organisms which range from multi‐
cellular macroalgae – e.g. seaweeds such as giant kelp, which can grow up to 60m – to
unicellular microalgae – as small as 3µm. Depending on the species, algae can be farmed
(algaculture) in either freshwater or saline conditions (Carlsson, et al., 2007, Schenk, et al.,
2008). Most algae are photoautotrophic, converting solar energy into chemical forms through
photosynthesis and a variety of biochemical pathways. However many species display some
degree of heterotrophism, utilizing organic carbon as their primary source of carbon and
energy (Barsani and Gualtieri, 2006). Heterotrophic algae are reviewed in Annex 1. The
mechanisms of algal photosynthesis are very similar to photosynthesis in higher plants and
their products are molecularly equivalent to conventional agricultural crops (Graham and
Wilcox, 2000). Although both micro and macro‐algae are of interest within the context of the
Aquafuels project, there is an emphasis within this report upon micro‐algae. The reason for
this is that despite macro‐algae having being cultivated on a larger scale globally than micro‐
algae, there are few assessments of the impacts in the scientific literature.
Microalgae are a broad group of unicellular and simple multi‐cellular photosynthetic
microorganisms that lack complex cell structure and organization. As a source of biomass for
biofuels, potential advantages of algae include:
• high photosynthetic yields (up to a maximum of 5‐6% conversion of light c.f. 1‐2% for
the majority of terrestrial plants);
• the ability to grow in fresh, salt and waste water;
• high overall oil content (dependent on species and growth conditions);
• ability to produce non‐toxic and biodegradable biofuels as well as high concentrations
of commercially valuable compounds such as proteins, carbohydrates, lipids and
pigments;
• the ability to be used in conjunction with wastewater treatment;
• possibility of cultivation on unproductive desert land, thereby reducing competition
for agricultural land.
Regarding biofuel production, microalgae can provide different types of biofuels, including:
methane (produced by anaerobic digestion of algal biomass); biodiesel (from algal fatty acids);

AQUAFUEL FP7 – 241301‐2
Coordination Action
FP7‐ENERGY‐2009‐1
12
ethanol (produced by fermentation of starch); and hydrogen (produced biologically) (Chisti,
2007, Wang, et al., 2008).
2.1 Algae Strains
The final products from algae aquaculture are determined by the species, strain, and growth
conditions. The US Aquatic Species Program (ASP) looked at over 3000 species; including
strains that can exist in myriad of different environments. One point they focused on was
getting, and then growing, a strain in its native environment, as this was considered to have a
greater chance of success (Sheehan, 1998b). The factors which make an algal strain more
suitable for biofuel production include the following properties:
• a high lipid productivity;
• a high photosynthetic efficiency;
• robustness to growth environment (and in particular the ability to survive the shear
stress from mixing);
• be able to withstand or dominate wild strains in the event of contamination;
• have a high CO2 sinking capacity;
• able to grow in a variety of temperatures and seasons;
• be able to provide (valuable) co‐products;
• be able to self flocculate, or display some of those characteristics (Brennan and
Owende, 2010).
There are currently no algal strains that meet all these criteria. There may also be
additional requirements depending on the location.
The dominant species currently in commercial production are Isochrysis, Chaetoceros,
Chlorella, Arthrospira (Spirulina) and Dunaliella (Carlsson, et al., 2007). An overview of
commercially grown algae is shown in Table 2.1.

AQUAFUEL FP7 – 241301‐2
Coordination Action
FP7‐ENERGY‐2009‐1
13
Table 2.1 Overview on commercially produced micro‐algae
Source: (Pulz and Gross, 2004)

AQUAFUEL FP7 – 241301‐2
Coordination Action
FP7‐ENERGY‐2009‐1
14
2.1.2 The US Aquatic Species Program (ASP)
The United States National Renewable Energy Lab (NREL) initiated its Aquatic Species
Program (ASP) in 1978. This programme undertook comprehensive research on algae derived
fuels. After 20 years of research, and 3000 algae strains screened, the project terminated at
1996 due to low oil prices in that decade (Sheehan, 1998b). The overall conclusion for the ASP
project was that low cost production of biofuels from algae was not likely to be feasible within
short or medium term. Although the final report from NREL indicated that the biodiesel from
algae would only become cost effective if conventional diesel prices rose to twice the 1998
levels which was 27 U.S. dollar per barrel.
Factors that have contributed to the renaissance of interest in algae derived fuels, include
policies at regional and national levels, concerns about the security of supply of fossil fuels,
and sustained high oil prices.
2.2 Micro‐algae Production Systems: Raceway Ponds and Photo‐bioreactors
Algal production systems may be classified as either photoautotrophic or heterotrophic.
Photoautotrophic systems use light as the energy source1, while heterotrophic production use
organic substances (such as glucose) to provide the energy the algae require. Some algae
strains can combine these in a mixotrophic process. Currently, the dominant method is
photoautotrophic production of algae as it is the most economically and technically viable,
and shall be the only method discussed here (Brennan and Owende, 2010).
There are two alternative methods for growing photoautotrophic algae: Open Systems
(Raceway Pond System) and Closed Systems (Photo‐bioreactors (PBRs). These systems, and
their variations, are discussed below. An overall comparison is presented in Table 2.4.
1 The reaction in photosynthesis can be summarized as 6CO2 + 12H2O + photons C6H12O6 + 6O2 + 6H2O. Eight photons
must be absorbed to fix one CO2 and two H2O molecules, yielding one base carbohydrate (CH2O) molecule. As the average
energy of “photosynthetically available radiation (PAR) photons is around 217 kJ (accounting for about 43% of incident
sunlight on the Earth’s surface), while the energy content of a single carbohydrate (CH2O) is about 467 kJ/mol, it follows that
the maximum efficiency is roughly 11.6%. In actuality, most plants only have 0.5‐2% efficiency, due to other limitations such
water and nutrient availability, as well as an excess or lack of sunlight, while algae can have as much as 3‐8% efficiency
(Lardon et al., 2009; Vasudevan & Briggs, 2008).

AQUAFUEL FP7 – 241301‐2
Coordination Action
FP7‐ENERGY‐2009‐1
15
2.2.2 Open Pond Systems
Currently, the majority of commercially grown algae are produced using open pond
systems. These can include natural water bodies such as lakes, lagoons, and ponds, or artificial
systems such as raceway ponds. The latter is the most common, and has been used since the
1950’s. In a typical raceway pond the area is divided into a rectangular grid containing a closed
loop oval shaped channel ~0.2m deep (shallower systems are not commercial, but have been
reported for research purposes. Ponds have to be kept shallow in order to allow the sunlight
to penetrate the water. In most designs some form of mixing and circulation equipment is also
required to stabilize algae growth and prevent sedimentation. Examples of a typical Raceway
pond and an Open Pond farm are shown in Figure 2.1. One of the largest of these types of
systems is the Werribee wastewater treatment plant in Melbourne, Australia, which is 11,000
ha and relies on gravitational flow (Brennan and Owende, 2010, Schenk, et al., 2008).
Raceway ponds that need extra infrastructure (e.g. a paddle wheel) for mixing and tend to
be more expensive to construct than a simple gravity led ponds, as the construction material
(i.e. concrete or compacted earth) has to be able to withstand the shear stress from mixing.
For an Open Pond Raceway, a typical harvest‐growth‐harvest cycle is around 4 days (Sander
and Murthy, 2010).
A comprehensive study undertaken by the US Department of Energy with a variety of
different strains showed that algae selected on the basis of laboratory results would not
compete as well as those that spontaneously colonized and subsequently dominated the
pond, although these adventitious species may not have all the desirable biofuel properties
(Sheehan, 1998b). One method to overcome this is to carefully cultivate and select species
that can dominate the system, such as using the local species, or extremophiles that can
survive well in very particular environments (e.g. extreme temperatures, pH, or salinity). For
example, Spirulina thrives at high pH levels (9 – 11.5), while Dunaliella salina grows well in
saline water (Schenk, et al., 2008). Another option is to cultivate the algae in greenhouse
conditions to control the temperatures and limit contact with contaminating species (Hase,
2000).
Their main advantages of raceway pond systems are that they are relatively easy to operate
and maintain, chiefly due to the simplicity of the design, and have a low energy requirement.
The main is disadvantage is that since they are open to the air, there is higher evaporative
losses and lower utilization of the available CO2 due to diffusion to the atmosphere, which can
lead to changes in the composition of the growth medium harmful for the algae. A comparison

AQUAFUEL FP7 – 241301‐2
Coordination Action
FP7‐ENERGY‐2009‐1
16
of open versus closed systems is provided in Table 2.2 (Schenk, et al., 2008, Brennan and
Owende, 2010, Chisti, 2007, Oilgae, 2010).
Figure 2.1 A raceway pond and farm
Source: (Sheehan, 1998b)
2.2.3 Closed Systems
The other option for cultivating algae is using a closed system, or photo‐bioreactor (PBR).
These systems have gained in popularity as more high‐value products have been produced
from algae. PBRs tend to be more complex and expensive than open systems, but allow for
better control of the algae culture environment: they can prevent contamination and can be
successfully used to cultivate single species; operate at high biomass concentration; can be
erected over any open space; offering better control of the temperature; and reduce water or
CO2 loss (Amin, 2009, Chisti, 2007, Pulz, 2001a).
Tubular photobioreactor consists of an array of transparent tubes (either plastic or glass) of
0.1m or less in diameter (to allow the sunlight to penetrate the dense medium and allow for
high biomass productivity). In a typical system the micro‐algal broth is circulated round the
system from a central reservoir, which also serves to degas the medium (preventing oxygen
accumulation), harvest the broth, and introduce new broth. Sedimentation is prevented by
either mechanical or airlift pumps. The latter is more inflexible, but does allow CO2 and
oxygen to be exchanged between the medium and the gas. The system is continuously mixed
to prevent sedimentation, even at night when no growth occurs (Amin, 2009, Brennan and
Owende, 2010, Chisti, 2007).

AQUAFUEL FP7 – 241301‐2
Coordination Action
FP7‐ENERGY‐2009‐1
17
In order to maximize production, incident light needs to be diluted over the surface of the
reactors. This prevents a small area of algae from being oversaturated with light. One of the
simplest approaches to sunlight dilution is to orient photo‐bioreactors vertically, instead of
horizontally, to catch the sunlight over a large surface area (Benemann, 2010a). More
generally, the tubes can be laid out horizontally, vertically (as shown in Figure 2.2), laid out
north to south to maximize solar collection, or coiled around a central support structure. The
ground may also be covered by white plastic to increase the reflectance.
Minimizing the auxiliary energy demand is also an important design parameter. In most
PBR designs energy is required for pumping and mixing to ensure good mass transfer of CO2
andO2. Mixing also helps to prevent the cells from staying too long in dark or bright zones of
the reactor, something that can reduce productivity. Energy may also be needed to cool the
reactors. Pumping energy requirements can be reduced by minimizing the hydrodynamic
pressure of the system. This can be achieved by increasing the diameter of the tubes
(something that may also reduce the overall cost), but the diameter cannot be increased too
far; otherwise light may not be able to penetrate the core of the tube. From a design
perspective there is also a limit on the length of a continuous tube, as the pH may vary within
the system, CO2 may be depleted, and most importantly, photosynthesis produces oxygen
which can inhibit algal growth (Brennan and Owende, 2010, Chisti, 2007, Patil, et al., 2008).
Tubular systems require periodic cleaning, and this increases the operational cost and
water demand. They are also more expensive than raceway ponds due to the higher
infrastructure costs. Illustrative energy requirements of a tubular PBR are shown in Table 2.3.
The comparative advantages and disadvantages of alternative closed photobioreactor designs
are outlined in Table 2.4.

AQUAFUEL FP7 – 241301‐2
Coordination Action
FP7‐ENERGY‐2009‐1
18
Table 2.2: Overall Comparison of Open versus Closed Systems
Source: (Pulz, 2001b)

AQUAFUEL FP7 – 241301‐2
Coordination Action
FP7‐ENERGY‐2009‐1
19
Table 2.3: Illustrative energy requirements of a tubular photo‐bioreactor’s design
Total incident solar energy I=150w/m2
Photo conversion efficiency (PCE) PCE=5%
Auxiliary energy demand 50W/m3
Areal water coverage 50L/m2
Areal auxiliary energy demand 2.5W/m2
Source: (Lehr,2009)
Figure 2.2: Tubular photobioreactor system & Flat plate Photobioreactor
Source: (Chisti, 2008a)
There are many alternative Tubular Photo‐bioreactor designs, including flat plate, annular
or column PBRs. Flat plate PBRs increase the surface area of illumination and allow for high
density of cells over a thin layer. Column Photobioreactors offer better control and volumetric
mass transfer rates, and are aerated from the bottom. Their performance is equal to or better
than tubular Photobioreactors. Flat plate systems were researched a lot in the early days,
while column reactors are receiving a lot of attention now, although both systems are still in
pilot scale(Brennan and Owende, 2010).

AQUAFUEL FP7 – 241301‐2
Coordination Action
FP7‐ENERGY‐2009‐1
20
Table 2.4: Advantages and disadvantages of alternative closed photobioreactor designs
PBR System Advantages Disadvantages
Tubular photobioreactor
• Large illumination surface area• Suitable for outdoor cultures • Relatively cheap • Good biomass productivities • Allows culture of single species• More control and accurate
addition of nutrients and water
• Higher energy requirements • Some degree of wall growth • Fouling • Requires large land space • Gradients of pH, dissolved
oxygen and CO2 along the tubes
• Demonstrated at pilot scale but not scaled up, not commercial
Flat plate photobioreactor
• High biomass productivities • Easy to sterilize • Low oxygen build‐up • Readily tempered • Good light path • Large illumination surface area• Suitable for outdoor cultures
• Difficult to scale‐up • Difficult temperature control • Small degree of hydrodynamic
stress • Some degree of wall growth • Only at pilot scale
Column photobioreactor
• Compact • High mass transfer • Low energy consumption • Good mixing with low shear
stress • Easy to sterilize • Reduced photo‐inhibition and
photo‐oxidation
• Small illumination area • Expensive compared to open
ponds • Shear stress • Sophisticated construction • Only at pilot scale
Source: (Schenk, et al., 2008, Brennan and Owende, 2010, Chisti, 2007, Oilgae, 2010)

AQUAFUEL FP7 – 241301‐2
Coordination Action
FP7‐ENERGY‐2009‐1
21
2.3 Recovery of Biomass: harvesting
The choice of harvesting method will depend on the type of species involved (i.e. size, density,
etc.), the quantity that needs to be processed and the desired final product. Generally, there
are two main steps:
• Bulk harvesting – separate the biomass from the broth to achieve a slurry with 2‐7% solid
content (involving a concentration factor of 100‐800) (e.g. flocculation, gravity
sedimentation).
• Thickening – concentrate the slurry (i.e. centrifugation, filtration, ultrasonic aggregation). This is generally the more energy intensive step (Brennan and Owende, 2010, Molina
Grima, et al., 2003).
The harvesting process can be highly energy intensive and be quite complex due to the
relatively small size of some microalgal cells (3‐30µm diameter), as well as the relatively dilute
nature of the algal broth (it can be less than 0.5 kg / m3). Some species are easier to harvest
than others, for example, Spirulina (which is 20‐100µm long) can be harvested relatively easily.
Overall, harvesting can contribute as much as 20‐30% to the final cost of production. Notably,
the cost of recovery from photobioreactors may be significantly smaller than from raceways
because the biomass concentration is greater (Brennan and Owende, 2010, Chisti, 2007,
Molina Grima, et al., 2003).
Flocculation is an effective method to aggregate the cells and increase the effective
‘particle’ size, which facilitates the downstream processing. It is important to choose
flocculants that are non‐toxic, effective in low concentrations and will not increase the
amount of downstream processing. Micro‐algal cells generally have a negative charge so
multivalent metal salts are often effective coagulants (i.e. Ferric Chloride (FeCl3), Aluminium
Sulphate (Al2(SO4)3, alum) and Ferric Sulphate (Fe2(SO4)3)). Alum is already widely used in
wastewater treatment. Other options include Polyferric Sulphate (PES), pre‐polymerized metal
salts, or cationic polymers (polyelectrolyte’s) (Molina Grima, et al., 2003)
Filtration is a relatively slow process, but may be a feasible option for low value products
where a higher level of moisture is acceptable. Conventional filtration can be used for larger
algal species, while membrane or ultra‐filtration may be necessary for smaller species. For low
volumes of broth, filtration may be the more economically sound option.
Gravity sedimentation can be used for larger species, but centrifugation is usually the
preferred method of recovery. It is a more energy intensive method, but is also faster and can

AQUAFUEL FP7 – 241301‐2
Coordination Action
FP7‐ENERGY‐2009‐1
22
handle larger volumes. It also requires more maintenance and has higher costs, but can
increase the slurry concentration by up to 150 times and be up to 95% efficient (Brennan and
Owende, 2010, Molina Grima, et al., 2003, Oilgae, 2010).
2.3.2 Lipid and product extraction
Once harvested, the biomass has to be processed rapidly as it is easily perishable. At this
stage it is typically 5‐15% solid content, but can perish in only a few hours. Algal biomass tends
to have a water content of 80‐90% and low energy density, which, along with the inferior heat
content, makes the biomass harder to use for heat and power generation, necessitating pre‐
treatment (Patil, et al., 2008). This can be achieved by dehydration or drying, which are the
most common methods to treat the slurry, although more expensive than just mechanical
dewatering. Drying methods include: spray drying, drum drying, freeze‐drying, or solar drying.
The choice depends on the desired product. Solar drying for example is the cheapest and
simplest option, but also takes the longest, while freeze and spray drying are expensive and
can cause damage to the cells (although freeze‐drying may help extraction of oils). It is
important to establish a balance between the drying efficiency and cost effectiveness, as well
as the impact on the final product. Temperatures greater than 60°C, for example, can decrease
the lipid yield or denature other components in the biomass (Brennan and Owende, 2010,
Molina Grima, et al., 2003).
To extract the contents of the cells, cell disruption is often necessary. This can be done
mechanically or chemically. Mechanical methods can include using high pressure
homogenisers, bead mills (agitation with glass or ceramic beads), or ultra‐sonication (for small
scale only). Chemical methods include using organic solvents (e.g. hexane), or supercritical
fluid extraction, and may prevent the necessity of drying the cells first (saving a lot of the
energy and costs), but may present health and safety issues (Molina Grima, et al., 2003,
Oilgae, 2010). It is currently commonly done using the same approximate method as for
soybean extraction (hexane solvents), so the algal biomass should have approximately 9 – 11%
moisture content, but this is still the subject of much discussion (Sheehan, et al., 1998a). The
choice of extraction method depends on the final product.
AQUAFUEL FP7 – 241301‐2
Coordination Action
FP7‐ENERGY‐2009‐1
23
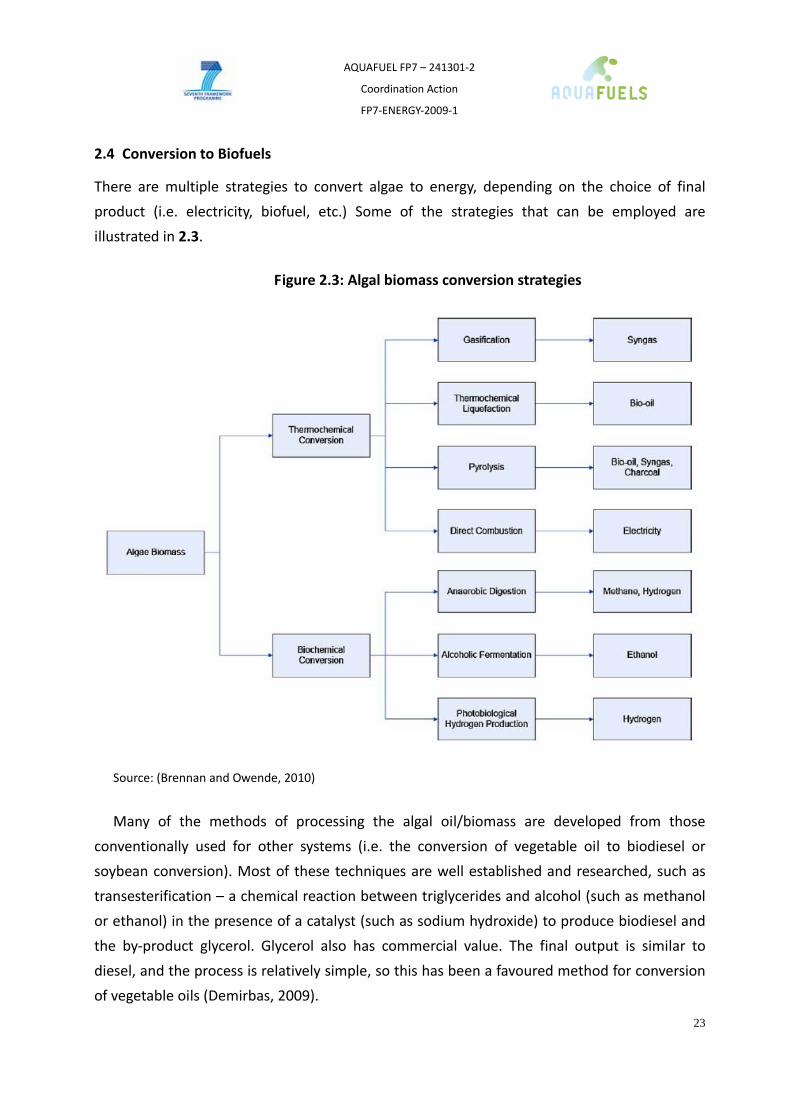
2.4 Conversion to Biofuels
There are multiple strategies to convert algae to energy, depending on the choice of final
product (i.e. electricity, biofuel, etc.) Some of the strategies that can be employed are
illustrated in 2.3.
Figure 2.3: Algal biomass conversion strategies
Source: (Brennan and Owende, 2010)
Many of the methods of processing the algal oil/biomass are developed from those
conventionally used for other systems (i.e. the conversion of vegetable oil to biodiesel or
soybean conversion). Most of these techniques are well established and researched, such as
transesterification – a chemical reaction between triglycerides and alcohol (such as methanol
or ethanol) in the presence of a catalyst (such as sodium hydroxide) to produce biodiesel and
the by‐product glycerol. Glycerol also has commercial value. The final output is similar to
diesel, and the process is relatively simple, so this has been a favoured method for conversion
of vegetable oils (Demirbas, 2009).

AQUAFUEL FP7 – 241301‐2
Coordination Action
FP7‐ENERGY‐2009‐1
24
Some methods do not require the oil to be extracted, and can convert the whole biomass
into fuels (such as pyrolysis, gasification, and anaerobic digestion). Other methods, such as the
Fischer‐Tropsch method for biomass gasification could also provide the heat needed for the
drying phase (since it is an exothermic reaction). Newer and lower cost methods are emerging
as well, such as the extraction and simultaneous transesterification of oils using supercritical
ethanol or methanol. Some work at high temperatures (such as pyrolysis or direct
combustion), while others (such as anaerobic digestion) work at room temperature. Many
have potential for large scale systems. However, due to the abundance of methods, and the
relative uncertainty of which will be the preferred conversion method, they shall not be
discussed further (Brennan and Owende, 2010, IEA, 2010).
2.5 Biomass productivity
There are several factors to be considered for optimal algae growth. Mostly, they should
recreate as best as possible the natural process of algal growth, which includes:
• Sunlight – this can be the limiting factor as it means no algae is produced at night and
commercial production is limited to areas with a high incidence of solar radiation. This
can be complemented with artificial lighting, but this adds to the energy consumption
of the system, so is used almost exclusively at pilot scale production.
• Nutrients – these include Nitrogen (N), Phosphorus (P), Iron (Fe) and Silicon (Si). Most
algae require N to be in soluble form (such as nitrate, ammonium or urea), although
some can fix atmospheric nitrogen directly. Phosphorus is required in lesser amounts,
but is less readily bioavailable, so must be supplied in excess of the required amounts,
while Silicon is only important to certain species of algae (such as diatoms).
• CO2 – microalgae can fix this from three sources, namely: the atmosphere; discharge
gases from heavy industries (such as power plants); or soluble carbonates. Most
microalgae can utilize considerably higher amounts of CO2 than under normal
conditions (up to 150,000 ppm), so excess carbon can be fed to the system. Typically,
microalgal biomass contains 50% carbon by dry weight, so producing 100 tonnes of
algal biomass fixes 183 tonnes of carbon dioxide.
• Temperature – although there are strains of algae that can survive extreme temperatures,
generally, the optimal temperature is around 20°‐30°C (Brennan and Owende, 2010,
Chisti, 2007, Kadam, 2001).

AQUAFUEL FP7 – 241301‐2
Coordination Action
FP7‐ENERGY‐2009‐1
25
2.5.2 Solar Conversion Efficiency
Photosynthetic Efficiency (PE) is one of the major factors used to evaluate the growth rate
of terrestrial plants, and is defined as the fraction of light energy which is fixed as chemical
energy during photo‐autotrophic growth. In common with terrestrial plants, there are two
metabolic pathways by which algae fix CO2, known as the C3 (Calvin cycle) or C4 pathways.
Most algae use the C3 pathway which has a maximum theoretical efficiency of ~12% (Tredici,
2010). The maximum that can be practically achieved, however, is ~5%. This is roughly
equivalent to the photosynthetic efficiency of a leaf. The C4 pathway is more efficient (up to
twice the photosynthetic efficiency of C3 plants. (Lundquist, et al., 2010)) and can be found in
diatoms and sugar cane. Many algae strains, however, have evolved to tolerate low light level
and are not only unable to use large amounts of energy at peak light intensities but actually
performed worse under conditions of high exposure to light. This is the principle of light
dilution in photobioreactor design.
Solar radiation is, nevertheless, one of the most important factors influencing algal growth,
and in areas of high insolation (>6 kWh/m2/day), the theoretical maximum production rate for
algae is approximately 100 g/m2/day (Darzins, et al., 2010). The minimum level considered
adequate for algal growth is ~1.5 kWh/m2/day.
The yearly average solar irradiance in different parts of the globe is shown in Figure 2.4.
And, using the 1.5 kWh/m2/day criteria it appears that the majority of the earth‘s land surface
is to be suitable for algae production. To achieve high levels of production throughout the
year, however, it is desirable that there is little seasonal variation. For practical purposes the
suitable locations are those areas where insolation is not less than 3000 hours/yr (average of
250 hours /month) (Necton, 1990, AquaFUELs, 2011b). Most commercial microalgae
production to‐date has occurred in low‐latitude regions. Israel, Hawaii and southern California
are home to several commercial microalgae farms. Figure 2.5 shows the potential yield of
algae biomass at 5% photosynthetic efficiency (Tredici, 2010). Productivity is highest in warm
countries close to the equator where there is little seasonal variation in sunlight levels and
temperatures. (AquaFUELs, 2011b).

AQUAFUEL FP7 – 241301‐2
Coordination Action
FP7‐ENERGY‐2009‐1
26
Figure 2.4: Yearly sum of global solar irradiance averages over the period of 1981 to
2000.
Source: (Meteotest); database Meteonorm (www.meteonorm.com)
Figure 2.5: World map of algae biomass productivity
Source: (Tredici, 2010); (tonnes ha‐1 year‐1) at 5% photosynthetic efficiency considering an energy content of 20 MJ
kg‐1 dry biomass.

AQUAFUEL FP7 – 241301‐2
Coordination Action
FP7‐ENERGY‐2009‐1
27
2.5.3 Lipid biosynthesis and oil producing algae strain selection
The most common lipids in algal cells are Triacylglycerides (TAG), which are formed from
fatty acids and glycerol. The lipid content in algae can range from 1% to 50% and can vary
greatly with the growth conditions. TAG storage is an important adaptation for photosynthetic
organisms that feast and famine with the diurnal cycle as TAG produced during the day
provides a carbon and energy source for the night.
In eukaryotic algae, lipid content is normally inversely proportional to growth rate; with
lipid is increasing when growth is inhibited by lack of nutrients, such as nitrogen or silicon
(Lundquist, et al., 2010). The fatty acid composition of membrane fluidity and triglyceride
carbon chains can vary in length depending upon the algae species, and environmental
conditions during growth. The growth limitation is not thought to be due to reduced
biosynthetic rates but rather to reduction in other cellular components, leaving a higher
proportion of lipid overall (Lundquist, et al., 2010).
AQUAFUEL FP7 – 241301‐2
Coordination Action
FP7‐ENERGY‐2009‐1
28
3. Life Cycle Assessments of algae biomass production
This chapter introduces basic concept of Life Cycle Assessment and describes the current
methodologies for conducting Life Cycle Assessment studies.
3.1 Introduction to Life Cycle Assessment
Life‐Cycle Assessment (LCA) is a process formalised by the International Standards
Organisation(ISO, 1997) to evaluate the environmental burdens associated with a products
and processes. LCA seeks to identify and quantify energy and materials consumed and waste
released to the environment, thereby enabling the evaluation and comparison of
environmental improvement options. The assessment includes the entire life cycle of the
product, process, or activity, encompassing extracting and processing raw materials;
manufacturing, transportation and distribution; use, re‐use, maintenance; recycling, and final
disposal” (SETAC, 1993).
In contrast to other environmental management tools, which tend to focus on specific life
stages of a product or process, LCA analyses the entire life cycle, looking up and down the
supply‐chain, from raw material extraction to final disposal. LCA is not site specific and
includes burdens and impacts outside the immediate factory gates. The argument in favour of
the LCA approach is that, whilst traditional environmental assessment tools may overlook the
problem of burden shifting or displacement, LCA ensures that environmental impacts which
have been identified and reduced at one stage of the life cycle are not replaced by other,
possibly greater, environmental impacts elsewhere.
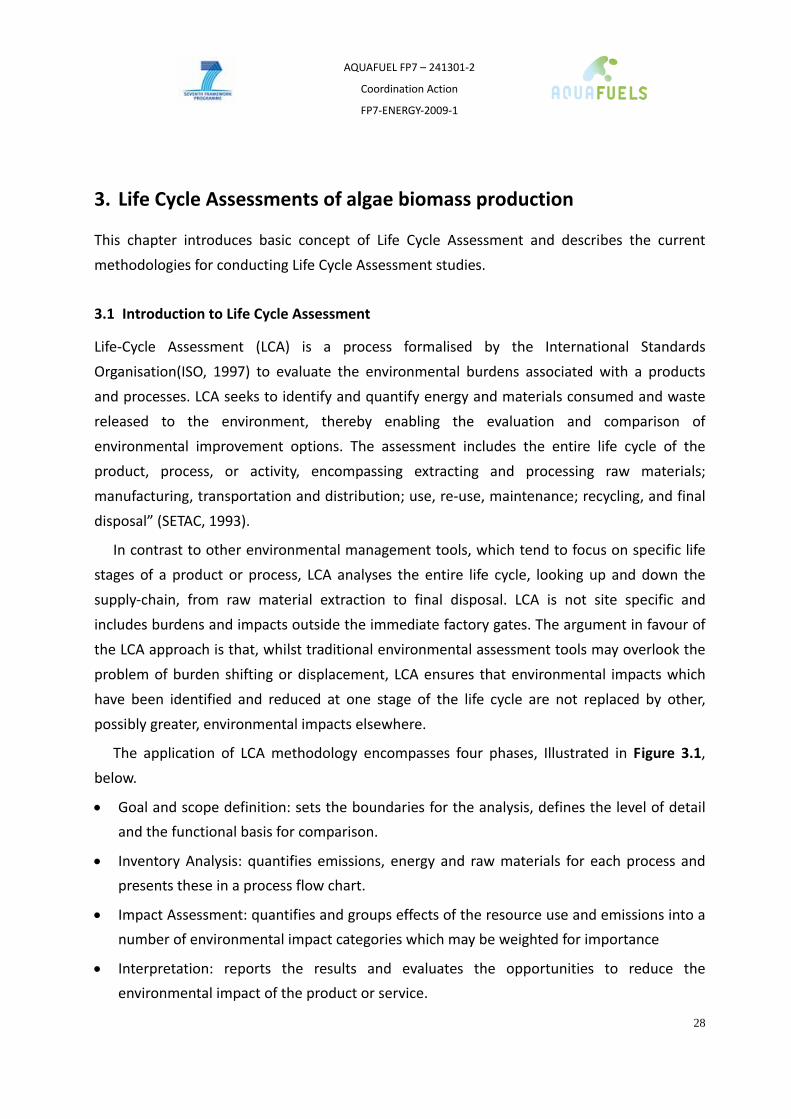
The application of LCA methodology encompasses four phases, Illustrated in Figure 3.1,
below.
• Goal and scope definition: sets the boundaries for the analysis, defines the level of detail
and the functional basis for comparison.
• Inventory Analysis: quantifies emissions, energy and raw materials for each process and
presents these in a process flow chart.
• Impact Assessment: quantifies and groups effects of the resource use and emissions into a
number of environmental impact categories which may be weighted for importance
• Interpretation: reports the results and evaluates the opportunities to reduce the
environmental impact of the product or service.
AQUAFUEL FP7 – 241301‐2
Coordination Action
FP7‐ENERGY‐2009‐1
29
Figure 3.1: The analytical stages in Life Cycle Assessment
Source: (De Smet, et al., 1996)
Although LCA is a popular tool it has a number of widely recognised limitations:
• The quality of an LCA depends on the quality and availability of accurate data. For
many processes and materials such data does not (yet) exist or is not readily
accessible.
• LCA methods are inherently subjective. Numerous assumptions must be made in
particular relating to the definition of boundaries, the choice of data sources and the
weighting and allocation of impacts
• LCA is a bottom‐up analysis tool which is best used to compare alternative products or
services
• LCA do not take account of rebound effects where environmental and cost efficiency
improvements are cancelled out by greater consumption.
System boundaries, allocation strategies and impact assessment, in particular, merit further
discussion.

AQUAFUEL FP7 – 241301‐2
Coordination Action
FP7‐ENERGY‐2009‐1
30
3.2 System Boundaries
The system boundaries selected determine what processes and activities are included in
the overall LCA. Many sub‐processes, such as the manufacture of equipment, could potentially
be included and their inclusion/exclusion can strongly influence the outcome of the study.
Various approaches to setting boundaries have been proposed and are described in more
detail below.
3.2.2 LCA boundary selection: EU Guidelines
The EC has published a guide for good LCA practice, and recommends that all the important
processes and activities are included, with only processes of minor importance excluded. It
warns against misleading results due to cut‐off criteria are that are weak, irrelevant, not in
accordance with the intended application, or when they focus on a single flow without due
consideration of all their individual environmental impacts. Another potential problem area is
if there is a lack of proper screening and iteration in the LCA methodology, which may lead to
the exclusion of activities without justifying whether they are significant or not, leading to
misleading conclusions (EC, 2010).
Article 17 in the 2009 Renewable Energy Directive deals with the sustainability criteria for
biofuels, and states that raw materials for biofuels should not come from protected land (e.g.
land with high biodiversity). This implies the system boundaries should, where possible, be
drawn back to include extraction of raw materials from the earth (EC, 2009).
3.2.3 LCA boundary selection: RMEE method
One proposed method to systematically and quantitatively set the system boundaries is the
Relative Mass, Energy, and Economic value (RMEE) protocol. In this protocol, the relevant data
about individual processes is gathered before the system boundary is drawn. A predefined cut‐
off ratio is then applied to the functional unit on the basis of mass, energy and economic
value. Starting with the process units closest to the functional unit, the RMEE ratios are
calculated for each input, and if larger than the cut off ratio, it is included in the system
boundary. This is repeated until all upstream processes are below the cut off threshold. This
helps reduce the subjectivity inherent in LCAs (Sander and Murthy, 2010, Raynolds, et al.,
2000a, Raynolds, et al., 2000b).

AQUAFUEL FP7 – 241301‐2
Coordination Action
FP7‐ENERGY‐2009‐1
31
3.2.4 Allocation guidelines
Allocation of the various input and output streams credited to any co‐products created is
considered one of the weaknesses of current biofuel LCAs. Co‐ or by‐products are any
products that are obtained from the process in addition to the desired product.
The ISO recommends avoiding allocation if possible, preferring to divide the unit process
into sub‐processes or expanding the system to include the functions of the co‐products. If
allocation is necessary, it should reflect the physical relationship between co‐products (or if
not possible, other relationships such as the economic value), reflecting the way in which the
inputs and outputs are changed, although not necessarily in proportion to simple
measurements such as the mass flow (ISO, 1997, SAIC, 2006).
These guidelines can be broken down into several concrete methods of allocation. One is
the use of direct substitution, where the by‐product (i.e. heat) from a process can be directly
used elsewhere; thereby replacing what would otherwise have been used. This method is
useful when there is a direct use for the by‐product, but in situations when the by‐product is
viewed as waste is less useful. Other methods exist, such as allocation on an arbitrary basis
(i.e. equal value), or on the basis of economic, calorific value or mass. Each has advantages
and disadvantages; for example, allocation based on market value is highly variable over time
and in some cases, where one product far outweighs another, may also be impractical (SAIC,
2006, Stephenson, et al., 2010).
3.2.5 Impact Assessment
Numerous impact categories can be assessed. The most common ones selected are:
• Greenhouse gas emissions:
• Energy use: any energy recovered from waste is historically given as the higher heating
value (HHV) of the materials being burned
• Water use: impact on water, including:
o Water consumed during process

AQUAFUEL FP7 – 241301‐2
Coordination Action
FP7‐ENERGY‐2009‐1
32
o Waterborne emissions: discharges into any receiving waters after treatment,
measured as a value of the biological oxygen demand (BOD), chemical oxygen
demand (COD), or suspended/dissolved solids
• Solid waste: any waste sent to landfills
• Land use
Economics of the process (Heijungs, et al., 1992):
Generally speaking it is desirable that the outcome should be quantitative given in either a
range of values, or, depending on the information available, cover a variety of different
production methods (Heijungs, et al., 1992, Boguski, et al., 1996).

AQUAFUEL FP7 – 241301‐2
Coordination Action
FP7‐ENERGY‐2009‐1
33
4. Review of micro‐algae LCA
Despite a high level of interest, no industrial scale processes designed specifically for micro‐
algal biofuel production yet exist. Only a limited number of LCA have been conducted, and,
because of the lack of data from operating plant, they are somewhat speculative. A systematic
review of the literature in late 2010 identified 7 LCA assessments, listed in Table 4.1. For
reference, a detailed description of each study is provided in Annex 2. No life cycle
assessments of macro‐algae production were found.
This chapter reviews the main features of the studies – i.e. choice of functional unit,
boundaries, allocation strategies, etc. A discussion of each of each of these aspects is also
provided. The basis of this discussion is comments and criticisms that have been made in the
literature, and information gathered from stakeholders. Input from stakeholders was elicited
using a questionnaire and semi‐structured interviews. (Stake holders consulted are listed in
Annex 3; the questionnaire used to elicit their input is described in Annex 4.)
Table 4.1: LCA studies on algae derived fuels
Author & year Description
Kadam 2002
This study compares a conventional coal‐fired power station with one in which coal is co‐fired with algae cultivated using recycled flue gas as a source of CO2. The system is based in the southern USA, where there is a high incidence of solar radiation.
Lardon et.al. 2009
This study considers a hypothetical system consisting of an open pond raceway covering 100ha, and cultivating Chlorella vulgaris. Two operating regimes are considered: normal levels of nitrogen fertilisation, and low nitrogen fertilisation. The stated objective was to identify obstacles and limitations requiring further research.
Clarens et.al. 2010
This study compares algae cultivation with corn, switch grass and canola. The study was based in Virginia, Iowa and California in the US, each of which have different levels of solar radiation and water availability five impact categories: energy consumption (MJ), water use (m3), greenhouse gas emissions (kg CO2 equivalent), land use (ha), and eutrophication (kg PO4)

AQUAFUEL FP7 – 241301‐2
Coordination Action
FP7‐ENERGY‐2009‐1
34
Jorquera et al. 2010
This study compares the energetic balance of oil rich microalgae production. Three systems are described: raceway ponds, tubular horizontal PBR, and flat‐plate PBRs. No specific location was assumed, and the study only considers the cultivation stage and the system energetics
Sander & Murthy 2010
This was a well‐to‐pump study that aimed to determine the overall sustainability of algae biodiesel and identify energy and emission bottlenecks. The primary water source was treated wastewater, and this was assumed to contain all the necessary nutrients except for carbon dioxide. Filtration and centrifugation were compared for harvesting. Lipids were extracted using hexane, and then transesterified.
Stephenson et. al. 2010
This study is a well‐to‐pump analysis, including a sensitivity analysis on various operating parameters. Two systems were considered, a raceway pond and an air‐lift tubular PBR. The location of the study is in the UK, which has lower solar radiation than the other studies.
Campbell et.al. 2010
This study looked at the environmental impacts of growing algae in raceway ponds using seawater. Lipids were extracted using hexane, and then transesterified. The location of this study was in Australia, which has a high solar incidence, but limited fresh water supply.
4.1 Functional Unit
The function units used in the LCA studies are listed in Table 4.2. It can be seen that a diverse
range of units has been used. Although, as (Clarens, et al., 2010) notes, the choice of
functional unit may not be that important for an individual study, as it is only used to assess a
given aspect of a life cycle. Nevertheless, the widespread use of incomparable units prevents
easy comparison between studies. (Benemann, 2010b) recommends a functional unit of “CO2
emissions per gallon of biodiesel or similar biofuel delivered to the plant gate”. Fonseca
(Fonseca, August 2010) goes further and suggests that the calculation, unit capacity and
conditions should be standardized across studies; he recommends the following functional
units: “for assessing the energetic balance ‐ energy produced/1 unit of energy consumed in the
whole process, and for environmental balance – GHG emissions/1 unit of energy produced (of
the whole process, and of each relevant step)”.

AQUAFUEL FP7 – 241301‐2
Coordination Action
FP7‐ENERGY‐2009‐1
35
Table 4.2: Function units used in the LCA studies
Author & year Functional unit
Note
Kadam 2002
1MW Of electricity
Lardon et.al. 2009
1MJ Of fuel used in a diesel engine (assumed to be identical to other biofuels)
Clarens et.al. 2010
317 GJ Equivalent to the approximate per capita primary energy consumption of one American
Jorquera et al. 2010
100,000 kg Biomass dry weight per annum
Sander & Murthy 2010
1000 MJ Energy in the form of algal biodiesel produced using existing technology at a filling station (equal to 24kg dry algal biomass)
Stephenson et. al. 2010
1 Tonne Biodiesel blended with conventional diesel, delivered toa UK filling station and used in an average UK car
Campbell et.al. 2010 0.89 MJ The diesel fuel equivalent to transport one tonne of freight one kilometre in a an articulated truck (the most common form of freight transport in Australia)
4.2 System boundaries
The studies all adopt different approaches to setting the system boundaries. For example,
(Jorquera, et al., 2010) only considers the cultivation phase, whereas Clarens et al. (2010)
considers both cultivation and harvesting. Sander & Murthy (2010) adopt the RMEE protocol
(described in Chapter 4) to define their system boundaries, and this means that they are the
only study to consider the production of algae inoculums. Stephenson et al. (2010) found that
the manufacture of equipment (PVC lining and the PBR tubes) required a large energy input,
yet many of the studies did not include this aspect.
Production processes can only be fairly compared if the system boundaries are the same.
Nevertheless, there may be good reasons for varying the selected boundary. Greenwell
(2010), for example, argues against making a standardized system, as a local consortium in a
developing country will have different considerations (environmental, economic, energetic,
and societal) to a large company in the U.S.
4.3 Allocation strategies
Only two of the studies, Sander & Murthy (2010) and Stephenson et al.(2010), consider how
impacts should be allocated to products and co‐products. Sander & Murthy (2010) show how

AQUAFUEL FP7 – 241301‐2
Coordination Action
FP7‐ENERGY‐2009‐1
36
the choice of co‐products could have a major impact on the final GHG emissions and
energetics of the system, while Stephenson et al.(2010) demonstrated the potential
importance of using the residual biomass for methane production. Neither deals exclusively
with one form of allocation, although Stephenson et al.(2010) did show that alternative uses
of minor co‐products (glycerol) – which consequently change the allocation method – did not
make a big difference overall. It may be argued that Campbell et al. (2010) should be included
in this list as includes electricity generation from the algal cake. More generally, there are
numerous of previous assessments of biofuels that have shown how important allocation
calculations are on the final outcome (Gnansounou, et al., 2009).
Different experts prefer different methods of allocation and there is little consensus. For
example Clarens (2010b) and Fonseca (2010) prefer market valuation, while Greenwell (2010)
prefers the simplest option.
Benemann (2010b) argues that biofuels should be considered a co‐product of wastewater
treatment and not the other way around, and eventually that biofuels should be a separate
business. Biomass from algae grown for feeds would have a higher market value sold
elsewhere than they would from biofuels, so co‐products would not be generated and there
would be no need to allocate. However, a survey undertaken by the EABA (2010) shows that
many members of the industry are interested in producing energy in conjunction with some
other product.
4.4 Sources of data
There is significant variation in the parameter values used in the studies. The majority are
based on pilot or lab scale values and different methods have been used to estimate how
these values scale to a full size system. Many studies use data which is over 15 years old; for
example, one of the most frequently cited papers is a one by (Benemann and Oswald, 1996),
which discussed the various possibilities for algae production. Other commonly used data
sources for the studies include the EcoInvent database, various LCI databases, and GREET.
One of the major criticisms of the current studies is their lack of transparency about data
sources, and the lack critical thinking about how reliable the sources and assumptions are
(Benemann, 2010b; Greenwell, 2010). For the most part the studies do credit their sources,
however, many refer to their own earlier work (e.g. Campbell et al. bases his system on a
previous paper written in 2009).

AQUAFUEL FP7 – 241301‐2
Coordination Action
FP7‐ENERGY‐2009‐1
37
Some experts also believe that scope for technical advance is significant. Consequently, the
literature may be outdated and the assumptions unduly negative, or incorrectly chosen. As
Fonseca (2010) says:
“Available options for optimization in each step of the technology are many, but just few
have been analysed in the referred LCA. The negative values some LCA demonstrate for algae
biotechnology do not mirror reality because the initial conditions and technological options
were not correctly chosen”.
Another consideration to keep in mind about the data use is that some of the authors may
be LCA experts, but not experts in the field of algae cultivation. Greenwell (2010) sums this up
by saying:
“[LCA studies] tend to be conducted by either LCA specialists who are not specialists in the
technology, or do not have enough aspects of the process covered. For example, palm oil
would look pretty good by energetic or economic LCA, but societal pressures prevented its
take‐up”.
Clearly, due to the hypothetical nature of the current work, arguments about the values
used are bound to happen, and until an actual system is created, basing the work on pilot
systems with critical thinking of the effects of scaling up is the best that studies can do.
4.5 Algae composition and strain assumptions
The major components of algal biomass are carbohydrates, proteins and lipid. Each species
differs in their physiological composition of these components. The relative proportion of
components will also depend upon the growth regime. The values used in the studies are
shown in Table 4.3. It can be seen that the lipid varies from 17.5‐43%, carbohydrate from 20‐
53%, and protein from 5.5‐32%. These composition assumptions may significantly affect the
final result. It should also be noted that a high lipid content will usually comes at the cost of
lower productivity, and this will also affect the result of the LCA. High lipid content will not
necessarily always be beneficial, however, as Greenwell (2010) argues: “many [LCA] do not
address the problem that biodiesel only can use a very limited range of the oil produced in
algae. [This is usually ignored] because the production chemists usually have no input into the
LCA” (Greenwell, 2010).

AQUAFUEL FP7 – 241301‐2
Coordination Action
FP7‐ENERGY‐2009‐1
38
Table 4.3: Algae composition assumption in LCA studies
Lardon et al. Kadam
Normal N
Low N
Jorquera et al.
Clarens et al.
Sander & Murthy
Stephenson et al.
Campbelll et al.
Algae strain ND Chlorella vulgaris
Nanno‐ chloropsis
sp. ND ND
Chlorella vulgaris
ND
Lipids 30.0 17.5 30.0 29.6 ‐ 30.0 45.01 43
Carbohydrates 20.0 49.5 52.9 ‐ ‐ 31.0 49.3 ‐
Proteins 32.0 28.2 6.7 ‐ ‐ 37.5 5.5 ‐ 1 Original study assumed 40% TAG, and 5% free fatty acid
ND = Not defined in study
4.6 Productivity assumptions
The productivity estimates used in the LCA studies are compared in Table 4.4. These estimates
illustrate the range of optimism about possible algae growth rates, and describe a range from
26‐112 t/ha/a, with an average of ~54 t/ha/a. For comparison a number of other estimates
that can be found in the literature are also shown (Chisti, 2008b; Griffiths & Harrison, 2009;
Sawayama et al., 1999). These studies indicate a less optimistic maximum annual productivity
of ~60t/ha/a.
It should be noted, however, that some studies report productivity per unit volume rather
than per unit area. Moreover, the length of the growing season assumed is not necessarily
transparent. Consequently, some manipulation of the figures provided in the papers is
required before they can be compared on an equal basis.
From the perspective of conducting comparable LCA in the future, the best choice of unit is
probably the average annual productivity, expressed per unit area.
Table 4.4: Algae productivity assumptions used in LCA studies
Production rate quoted in studyStudy Per day
(g/m2/d) Per annum (t/ha/a)
Normalised annual production ratea (t/ha/a)
2001 17.1 33.17 42.75b Kadam
2002 45.0 104 112.50 Normal N 24.8 ‐ 61.88
Lardon et al Low N 19.3 ‐ 48.13

AQUAFUEL FP7 – 241301‐2
Coordination Action
FP7‐ENERGY‐2009‐1
39
California 12.9e 47.1 32.26 Virginia 11.0 e 40.2 27.53 Clarens et al.c Iowa 14.1 e 34.5 35.35 Raceway 10.5 e 38.5 26.36 Flat‐plate PBR 27.0 e 98.6 67.50 Jorquera et al. Tubular PBR 25.5 e 92.9 63.64
Sander & Murthy
n/a ‐ ‐ ‐
Raceway 27.4 e 68.49 Stephenson et al. PBR 27.4 e
100 68.49
Low 15.0 54.8 37.50 Campbell et al.
High 30.0 109.6 75.00 LITERATURE
Chlorella vulgaris 16.0 ‐ 40.00 Nannochloropsis 15.0 ‐ 37.50
Griffiths & Harrison
Average 24.0 ‐ 60.00 Chisti 25.00 ‐ 62.50 Sawayama et al.d
B. braunii 4.11 15 10.27
a unless otherwise stated, it is assumed that the quoted annual production rate is for 365 days. The
normalised production rate assumes 250 days of production per year, corresponding to a May to October in a
seasonal country where winter inhibits growth. bNormalised value assumes 100% of culture area is productive, whereas original study assumes only 86% of
area is productive. cClarens et al. varied their production values over the year (the average is given here) dChisti (2008b) questions the validity of this productivity estimate, claiming it is only 16% of current
production in the tropics. e Value calculated from figures presented in the original study.
There is a general consensus among the experts questioned that algae growth rate in terms
of biomass productivity and lipid productivity are far too optimistic and do not take into
account the losses that would occur with scaling up the process. It is assumed that the
productivity values given are based on the year average, for, as Greenwell (2010) points out:
“comparing mean productivity on a given day is not the same as averaging over a whole year”.
4.7 Global Warming Potential
Comparisons made to conventional biofuels and fossil fuels depend on the reference systems
used and direct comparison is not straightforward. An overview of the relative GWP savings
claimed in the reviewed studies is shown in Table 4.5. Caution is required, however, because

AQUAFUEL FP7 – 241301‐2
Coordination Action
FP7‐ENERGY‐2009‐1
40
the studies use very different boundary and allocation assumptions. Nevertheless, it can
clearly be seen that there is a wide range of estimates ranging from significant savings to
additional emissions.
Table 4.5: Overview of Global Warming Potential claims in algae biomass LCA.
Author & year Reference system CO2 balance Kadam 2002
Electricity from coal firing
‐36.72% (direct injection of the flue gas) ‐2.46% (monoethanolamine (MEA) extraction of CO2 from flue gas
Lardon et.al. 2009
Diesel ‐25%
Clarens et.al. 2010
Corn / canola / switchgrass
+244% / +189% / +233%
Jorquera et al. 2010
NA NA
Sander & Murthy 2010
Gasoline ‐117% (dewatering using filter press)a +14% (dewatering using centrifuge)
Stephenson et. al. 2010
Diesel ‐ 78% (Raceway ponds) + 273% (PBR)
Campbell et.al. 2010
Diesel per freight km.Tonne
‐66% ‐122%
a This study assumes that co‐produced algal residue displaces animal feed.
4.8 Other critiques levied at algae LCA
Other, more general critiques levied at algae LCA include concerns about the quality,
representativeness, and application of the studies. As illustrated by the following comments
from expert stakeholders:
• LCA as a very complex tool to use on such a young industry… [Fonseca (2010)] • “LCAs should at least mention the temporary nature of the production pathways in use, or
possibly assess the "representativity gap" of other LCAs performed on experimental pathways but intending to derive findings applicable to algae production for biofuels”. [Vernon 2010.]
• LCA studies cannot so easily be adapted to such a new industry, and do not give a holistic view of the whole sustainability (the “global wrapping”), including the use of land, water, etc. [Leu (2010) ] • From an industry point of view, it is happening the worst possible thing; a pollution of publications on microalgae production LCA which refer to each other and in many cases are careless and get strange conclusions (which are interesting to publish)”. (Vieira, 2010)

AQUAFUEL FP7 – 241301‐2
Coordination Action
FP7‐ENERGY‐2009‐1
41
• [Referring to the Clarens et.al. 2010 report] The report was based upon obsolete data and grossly outdated business models, and overlooked tremendous improvements in technology and processes across the production cycle. [These] obsolete data and faulty assumptions seriously undermine the credibility of the study’s conclusions. (ABO, 2010)
• “The fundamental problem here is that biofuels are subsidized and therefore we get into the quandary of converting low price fossil fuels into high price subsidized biofuels, which is why we now have to do LCAs. Actually, a better measure may be process sustainability over a 100 year period, in which all non‐renewable inputs are accounted for. For example for algae, use of phosphates has a very small impact on LCAs but a potentially very large impact on sustainability, as phosphate mining is a rapidly depleting resource. If this is not accounted for as a major factor in an LCA, which currently focuses mainly on greenhouse gases, it is not useful”. [Benemann ]
4.9 Conclusions on the existing LCA studies
This review of existing LCA supports the following conclusions:
• The studies reviewed here consider a wide range of conceptual designs, but, with the
exception of the study by (Stephenson, et al., 2010), they all provide only partial
descriptions of algal biofuel production systems. Studies such as (Kadam, 2001) which only
consider the production stage, will naturally provide a more positive energy balance than
studies that include subsequent energy intensive processing steps.
• Comparison is also hindered by the use of inconsistent boundaries and functional units.
• The studies use a range of allocation methods, some of which, it may be argued, are
overcomplicated given the immaturity of the industry.
• It is also evident that, in the absence of commercial production facilities there is little
primary data upon which process assumptions can be based. The production processes
analyzed appear to be assembled from component parts, rather than designed as
integrated systems.
• The validity of some of the results and the usefulness are called into question, by experts
in the field. Prominent causes of concern include the hypothetical nature of the LCA, and
that without more detailed information about the system, the strain used, and the
possible amount of oil that can be extracted, the conclusions that may be drawn from the
existing LCAs are tenuous at best.

AQUAFUEL FP7 – 241301‐2
Coordination Action
FP7‐ENERGY‐2009‐1
42
5. Meta‐analysis of micro‐algae production systems
Comparing the results of the existing LCA studies is challenging because of the inconsistencies
in boundaries, allocation strategies etc. used in the different studies (Described in Chapter 5).
To enable a comparison of algae production systems in terms of 1) the energy produced, and
2) the energy required to construct and operate the system, an LCA meta‐model was built and
populated using data from the original studies. This chapter describes the meta‐modelling
approach, and the results obtained.
5.1 Meta‐model approach and assumptions.
The objectives of the meta‐model were two‐fold; firstly, to enable a more detailed
examination of the assumptions used in the existing LCA, and secondly, to compare the
studies in terms of the energy produced and consumed. The model was built in Excel using a
simplified, but complete, description of the processes involved in cultivation, harvesting of
algal biomass, and extraction of algal oil.
The modelling approach (shown in Figure 5.1) was undertaken in three stages. Firstly, the
data and assumptions contained in the original studies were identified and transcribed.
Secondly, the units were normalized. Lastly, the process descriptions were normalized to fit a
consistent system boundary, and to allow comparison using a single functional unit. An
overview of the assumptions used to normalize the studies are described below, detailed
assumptions for the normalization of each study are described in Annex 5 & 6.

AQUAFUEL FP7 – 241301‐2
Coordination Action
FP7‐ENERGY‐2009‐1
43
Figure 5.1: Algae LCA meta‐modeling approach
5.1.2 Meta‐model system description and boundaries
The meta‐model process system is shown in Figure 5.2. In Stage 1, the algae are cultivated
and harvested. At this stage both raceway pond and closed (PBR) systems are included for
comparison. For each study the efficiency with which nutrients and CO2 are captured is based
on the original study. The residence time of the algae strain in the cultivation system – where
algae cell has to accumulate the lipid (TAG) to a certain level for biodiesel production – also
follows the original studies. The boundaries include the manufacture of the principal
equipment (e.g. the PVC lining for the raceway pond systems and system maintenance and
operations).
In Stage 2, the slurry of mature algae cells is transported to a dewatering and drying stage.
The amount of drying required is determined by the oil extraction process (Stage 3). Most of
the LCA studies adopt hexane extraction as they assume algal oil extraction will be very
similar to soybean oil extraction2. This process requires that the paste has to be dried up to a
solid content of ~90% before being processed in oil mill3. In order to achieve this a belt dryer
2 It should be noted that some experts contest this assumption
3 A belt dryer, usually is used for wastewater treatment plant sludge, is assumed as it is one of the less energy
demanding drying process. Heating supplied in the system comes from natural gas combustion.

AQUAFUEL FP7 – 241301‐2
Coordination Action
FP7‐ENERGY‐2009‐1
44
was chosen as the preferred technology for biomass drying based on data presented in
Lardon et al., (Lardon, et al., 2009).
Stage 3 is oil extraction. The extraction efficiencies are based on the data from original
studies. Co‐products from oil extraction – mainly carbohydrate and protein – are assumed to
be used as feedstock to produce biogas in Stage 4 (Sialve, et al.). This biogas is then used in a
gas boiler to generate heat for the drying process. Any excess gas is converted into electricity,
which is also used for system operations.
Figure 5.2: Description of meta‐model process
1. Harvesting (Raceway ponds / PBR)
2. Dewatering; drying
3. Oil extraction
Algae Lipid
Algae Cake
Algae
Nutrients; Carbon dioxide; Energy
Residue (Carbohydrate,
Protein)
Flue gas; nutrients
Flocculant; Energy
Hexane; Energy
4. Biogas production and
combustion

AQUAFUEL FP7 – 241301‐2
Coordination Action
FP7‐ENERGY‐2009‐1
45
5.1.3 Functional Unit and basis for comparison
The functional units selected for comparing energetic performance were 1MJ dry algal
biomass and 1MJ algal lipid. Alternative processes were compared in terms of the Net Energy
Ratio (NER) of biomass and lipid production, defined in Figure 5.3. If the NER is greater than
unity, the process consumes more energy than it produces.
Figure 5.3: Definition of Net Energy Ratio (NER)
To calculate the NERBiomass three processes stages are considered: algal biomass cultivation,
drying and dewatering and oil extraction. No co‐product allocation is applied and we assume
that the energy content of the dry biomass is equal to the lower heating value of the algal
biomass specified in the original LCA studies. For those studies that didn’t specify heating
values, estimates were made by summing the heating values of the biomass compositions
given.
Primary Energy Inputs were assumed to include the energy content of the fossil fuel inputs
only; i.e. the embedded energy from the production of the fossil fuel itself is excluded from
the boundary. The energy associated with building the plant was also included (assuming a
20yr lifetime for concrete and 5yrs for PVC (Stephenson, et al., 2010)).
For illustrative purposes, the CO2 emissions for algae biomass cultivation are estimated by
multiplying the primary energy inputs by the default emissions factors described in the EU
renewable energy directive (2009/28/EC)4.
4 The default emissions factors outlined in the renewable energy directive(2009/28/EC) are – diesel: 83.80gCO2.MJ-1; electricity: 91 gCO2.MJ-1; Heat: 77 gCO2.MJ-1. The emissions factor for the embodied energy in fertiliser and for production of PVC lining (in the case of raceway ponds) and tubes (in the case of PBRs) was assumed to be the same as for heat.

AQUAFUEL FP7 – 241301‐2
Coordination Action
FP7‐ENERGY‐2009‐1
46
The calculation of the NERLipid assumes that co‐products are treated by anaerobic digestion.
Anaerobic digestion is appropriate for processing high moisture content, such as 80%~90%
moisture organic wastes. (Two of the existing LCA studies took anaerobic digestion for algal
residual application)5. It has been estimated that the conversion of algal biomass into
methane could recover as much energy as obtained from the extraction of cell lipid, while
leaving a nutrient rich waste product which could be recycled into a new algal growth
medium.
In the normalized case, we assume anaerobic digestion could convert 60% of the algal
residue to methane (on an energy basis) (Sialve, et al.). This methane is then fed into a gas
boiler to generate heat and offset natural gas demand for the drying process. The efficiency of
the gas boiler is assumed to be 75% (Stephenson, et al., 2010). In the Stephenson et al’s
study, they took homogenization before lipid extraction: this means that the algae biomass
could have higher moisture content in the subsequent processing stage and that not all
residue was required to produce heat for the biomass drying and dewatering process.
Consequently, we applied another scenario to normalize Stephenson et al’s case, assuming
that the gas boiler was replaced by a gas‐engine combined heat and power system (CHP). The
generated heat and electricity is then used to offset fossil fuel used in the production process
(34% efficiency in electricity generation; 41% efficiency in heat generation; overall efficiency is
75%) (Macadam, 2010).
5.2 Results
The seven studies describe eleven alternative processing systems. The primary energy input
for biomass production for each alternative system, before and after normalization, is shown
in Figure 5.4, It can be seen that in all cases the primary energy input for the normalized
process is equal to, or less attractive than, the original case. It is also noticeable that the
closed systems, especially tubular PBR, demonstrate poor energetic performances compared
to raceway ponds.
Six, out of eight, of the raceway pond systems have a Primary Energy Input less than 1,
suggesting that a positive energy balance may be achievable for these systems, although this
benefit is marginal in the normalized case. The normalized Primary Energy Inputs for PBR
systems are all greater than 1. The best performing PBR is the flat‐plate system. This appears
5 Sander and Murthy (2010) and Stephenson et al(2010)

AQUAFUEL FP7 – 241301‐2
Coordination Action
FP7‐ENERGY‐2009‐1
47
to outperform tubular systems as it benefits from a large illumination surface area and low
oxygen build‐up.
Figure 5.4: NER Biomass production: comparison of published values with
normalised values for algal biomass production.
NC: Normal Cultivation; LN: Low Nitrogen Cultivation; FP: Filter Press; C: Centrifuge; Flat‐plate PBR: Flat‐plate
Photobioreactor; Tubular PBR: Tubular Photobioreactor. RP: Raceway Pond
*=Normalised system boundary
The energy inputs to raceway pond systems are shown in Figure 5.5, expanded to show the
energy input into the different stages.
The three studies where normalisation has the greatest impact are Kadam, Jorquera and
Campbell. Originally these studies only considered the cultivation stage; the addition of drying
and dewatering processes and lipid extraction changes the NER from ~0.05‐0.1 to 0.5‐0.75. For
these studies, even if drying and lipid extraction were excluded, the normalised value for
cultivation is less favourable. This is because the original studies did not include system
construction. (The normalised system also includes transport of fertiliser (data from
Campbell), and the embodied energy in the fertiliser, but these factors are comparatively
insignificant.)
Sander & Murthy use high values for the energy required for algae culture, drying and
harvesting, and these systems will deliver less energy output that they require input. The

AQUAFUEL FP7 – 241301‐2
Coordination Action
FP7‐ENERGY‐2009‐1
48
original assumptions about the algal species and its productivity are unclear but the data
appears to come from studies completed in the 1980’s, and so may not be representative of
more recent designs.
Stephenson et.al is the only LCA that gives a complete description of the cultivation, and
harvesting process, and so normalisation makes no difference in this case. The energy
demands of the cultivation stage are higher than other studies because the authors assume
more electricity is required at this stage to overcome frictional losses (which they estimate
from first principles). Less energy is required for drying than other studies because, in a
subsequent step, the authors assume the use of an oil extraction process that can accept wet
biomass (homogenisation with heat recovery).
Another source of variation is that each study selects a different composition for the algae
produced and a different productivity for the growth phase; this affects the energy required
per functional unit produced. If the productivity of the algae is assumed to be low, then, all
else being equal, it follows that the energy required to produce 1MJ dry biomass will be
greater (as the mixing requirement per unit time etc. will not be reduced). One complicating
factor is that growing the algae under lower productivity conditions, such as nitrogen
starvation, may allow the algae to accumulate more lipid and so may result in a higher calorific
value for the biomass overall. It is clearly important that productivity and composition values
correspond with one another.

AQUAFUEL FP7 – 241301‐2
Coordination Action
FP7‐ENERGY‐2009‐1
49
Figure 5.5: Net Energy Ratio for biomass production in raceway ponds: comparison
of published values with normalised values.
0.00
0.50
1.00
1.50
2.00
2.50Ra
ceway Pond
Raceway Pond*
Normal Cultivation
Normal Cultivation*
Low Nitrogen
Low Nitrogen
*
Raceway Pond
Raceway Pond*
Raceway Pond
Raceway Pond*
Raceway Pond
Raceway Pond*
Filte
r Press
Filte
r Press*
Centrifugatio
n
Centrifugatio
n*
Kadam(RP) Lardon(NC) Lardon(LN) Jorquera(RP) Cambell(RP) Stephenson(RP) Sander&Murthy(FP)Sander&Murthy(C )
NER
Biomass
Prim
ary En
ergy Inpu
t(MJ/MJ D
ry Algal Biomass)
Lipid Extraction Biomass Drying and Dewatering Algae Cultivation and Harvesting
NC: Normal Cultivation; LN: Low Nitrogen Cultivation; FP: Filter Press; C: Centrifuge; RP: Raceway Pond
*=Normalised system boundary
At the cultivation stage, the most important contributions to the energy demand come from
the electricity required to circulate the culture 0.02‐0.79MJ/MJdrybiomass, and the embodied
energy in system construction 0.05‐0.14MJ/MJdrybiomass (8‐70%). The embodied energy
contained in the nitrogen fertiliser ranges from 0.02‐0.09 MJ/MJdrybiomass (6‐40%) (this range
excludes the Kadam study which includes a fertiliser value of 0.05g nitrogen per kg dry algae (a
value that appears infeasably low given that this study assumes the biomass contains >30%
protein).
The energy inputs to PBR systems are shown in Figure 5.6 All the normalised systems
consume more energy than they produce. Biomass drying and de‐watering are
proportionately less important than the energy consumed in cultivation and harvesting. This is

AQUAFUEL FP7 – 241301‐2
Coordination Action
FP7‐ENERGY‐2009‐1
50
partly because greater algal biomass concentrations can be achieved in PBR systems, and
partly because PBRs consume more energy for cultivation and harvesting than raceway ponds.
In the tubular PBRs, the electricity used to pump the culture medium around the system
and overcome frictional losses accounts for 2.5‐5.0MJ/MJdrybiomass (~86‐92% of the energy
input to the cultivation and harvesting stage) (0.22MJ/MJdrybiomass (22%) for the flat‐plate PBR).
System construction accounts for the majority of the remainder: 0.34‐0.36MJ/MJdrybiomass (6‐
12%).
Figure 5.6: Net Energy Ratio for biomass production in photobioreactors PBRs:
comparison of published values with normalised values for algal biomass
production.
0.00
1.00
2.00
3.00
4.00
5.00
6.00
Flat‐plate PBR Flat‐plate PBR* Tubular PBR Tubular PBR* Tubular PBR Tubular PBR*
Jorquera(FP PBR) Stephenson(T PBR) Jorquera(T PBR)
NER
Biomass
Prim
ary En
ergy Inpu
t (MJ/MJ D
ry Algal Biomass)
Lipid Extraction Biomass Drying and Dewatering Algae Cultivation and Harvesting FP PBR: Flat‐plate Photobioreactor; T PBR: Tubular Photobioreactor
*Normalised system boundary
The carbon dioxide emissions associated with algal biomass production are shown in Figures
5.7 and 5.8. The results essentially mirror the results for the energy consumption and the
majority of emissions are associated with the drying phase and the consumption of electricity.
Notably, emissions associated with algal biomass production in raceway ponds are comparable

AQUAFUEL FP7 – 241301‐2
Coordination Action
FP7‐ENERGY‐2009‐1
51
with the emissions from the cultivation and production stages of rape methyl ester biodiesel.
Production in PBRs, however, demonstrates emissions greater than conventional fossil diesel.
An important caveat to this analysis is that the carbon emissions are highly dependent on the
emissions factors used for the different energy inputs into the system (and in particular
electricity) and generic factors may not be appropriate in all situations.
Figure 5.7: Illustrative estimates for carbon dioxide emissions from algal biomass
production in raceway ponds
0
50
100
150
200
Carbon
Emission
sgCO2e.M
J‐1
System
Oil extraction Drying Cultivation
Rape Biodiesel ‐RED 2009/28/EC default value (cultivation & production)
Diesel ‐RED 2009/28/EC default value
NC: Normal Cultivation; LN: Low Nitrogen Cultivation; FP: Filter Press; C: Centrifuge; RP: Raceway Pond
*=Normalised system boundary

AQUAFUEL FP7 – 241301‐2
Coordination Action
FP7‐ENERGY‐2009‐1
52
Figure 5.8: Illustrative estimates for carbon dioxide emissions from algal biomass
production in photobioreactors PBRs.
0
100
200
300
400
500
600
Jorquera(FP PBR) Jorquera(FP PBR)* Stephenson(T PBR) Stephenson(T PBR)*
Jorquera(T PBR) Jorquera(T PBR)*
Carbon
Emission
sgCO2e.M
J‐1
System
Oil extraction Drying Cultivation
Rape Biodiesel ‐RED 2009/28/EC default value (cultivation & production)
Diesel ‐RED 2009/28/EC default value
FP PBR: Flat‐plate Photobioreactor; T PBR: Tubular Photobioreactor
*Normalised system boundary
The impact of expanding the system boundary to include lipid production (and energy
recovery from residues) is shown in Figures 5.7 and 5.8, for raceway and PBR systems. As
might be expected, the NER for lipid production is less favourable than for biomass production
as there are losses in the conversion of the residue to heat and electricity and all the burdens
of the system are allocated to the lipid6.
Only two normalised systems, Stephenson et al (Stephenson, et al., 2010) and Kadam
(Kadam, 2001) yield more energy in the lipid than they consume. It is also apparent that
NERlipid and NERbiomass values do not vary by a constant proportion; this is due to reported
differences in the composition of the algae. For example, the NERbiomass for the Stephenson
6 The energy reported for lipid extraction in the various studies is ~0.04-0.06MJ/MJdry algal biomass. This compares with an energy demand of ~0.5-0.7MJ/MJdry algal biomass for production in a raceway pond and ~1-6MJ/MJdry algal
biomass in a PBR.

AQUAFUEL FP7 – 241301‐2
Coordination Action
FP7‐ENERGY‐2009‐1
53
and Lardon systems is similar, but Stephenson’s system is preferable7 for producing biodiesel
because the lipid proportion is greater. Another factor that contributes to the difference is the
oil extraction efficiency (for example, Lardon assumes ~70% oil extraction efficiency, whereas
Sander and Murthy assume ~90%).
Overall, these results indicate that producing biodiesel as the main product is likely to have
limited benefits, if assessed in terms of the system energetics. These results also illustrate the
importance of comparing systems within consistent boundaries, and it should be noted that
an alternative allocation system, for example, producing high value protein for animal feed
and allocating the impacts on the basis of market value, could change this result.
Figure 5.7: Net Energy Ratio for biomass and lipid production in raceway ponds:
comparison of normalised values.
NC: Normal Cultivation; LN: Low Nitrogen Cultivation; FP: Filter Press; C: Centrifuge; RP: Raceway Pond
*Normalised system boundary
7 I.e. it has a lower NERlipid

AQUAFUEL FP7 – 241301‐2
Coordination Action
FP7‐ENERGY‐2009‐1
54
Figure 5.8: Net Energy Ratio for biomass and lipid production in PBRs: comparison
of normalised values
0
1
2
3
4
5
6
7
8
9
10
11
12
13
14
Jorquera(FP PBR)* Stephenson(T PBR)* Jorquera(T PBR)*
Net Ene
rgy R
atio
Prim
ary E
nergy Inp
ut (M
J/MJ o
utpu
t)
Net Energy Ratio in Photobioreactor
Net Energy Ratio (NER) for Oil production Net Energy Ratio (NER) for Biomass production
FP PBR: Flat‐plate Photobioreactor; T PBR: Tubular Photobioreactor
*Normalised system boundary
5.3 Conclusions
The LCA studies that are accessible in the literature describe a range of production systems,
but the results are difficult to compare. The normalized model presented in this chapter allows
the energetic performance of these systems to be examined on a more consistent basis and
provides some insight into the assumptions used in each of the studies. We consider that this
analysis supports the following conclusions:
• Raceway Pond Systems consistently demonstrate a lower (more desirable) NER for both
biomass and lipid production than PBR Systems
• The NER for biomass and lipid production in the normalized system described is
unattractive, or at best, marginal. This suggests that algae production may be most
attractive where energy is not the main product.
• The carbon emissions from algae biomass produced in raceway ponds is comparable to
the emissions from conventional biodiesel.
• The carbon emissions from algae biomass produced in PBRs is greater than the emissions
from conventional diesel. The principle reason for this is the electricity used for
pumping the algal broth around the system.

AQUAFUEL FP7 – 241301‐2
Coordination Action
FP7‐ENERGY‐2009‐1
55
• The most optimistic values for algae production in the literature come from the systems
that are the least complete. The addition of additional process steps makes the NER less
attractive in all cases.
• While the meta‐model includes some additional process steps, others might also
reasonably be included in a complete system. These include: the energy embodied in
chemical flocculant, and hexane loss during harvesting and lipid extraction. In hot
climates PBRs may also require cooling. The addition of these processes would make
the NER less attractive.
• There is a significant variation in the energy consumed in the cultivation and harvesting
phase per MJ algae (biomass or lipid) produced. Key assumptions that affect this are the
productivity of the algae, its calorific value and lipid content. (As discussed in Chapter 5,
assuming both a high productivity and high lipid content may be over optimistic.)
• Assumptions in the original studies are often obscure, or open to interpretation. For
example, the study by Kadam includes less nitrogen as an input than is contained in the
algae anticipated as an output. This may be an oversight, or the authors may have made
some additional assumption that is not explicit: it is possible that the missing nitrogen
may be recycled or come from some other source.
• Algae production requires a number of energy demanding processes. However, within the
LCA studies considered here there is no consistent hierarchy of energy consumption.
Aspects that will need to be addressed in a viable commercial system include: the
energy required for pumping, the embodied energy required for construction, the
embodied energy in fertilizer, and the energy required for drying and de‐watering.
AQUAFUEL FP7 – 241301‐2
Coordination Action
FP7‐ENERGY‐2009‐1
56
6. Environmental impacts of micro‐algae production
Algae production could have a wide variety of environmental impacts beyond the
consumption of energy in the production process. Impacts will vary depending on the
production technology and location, and may be positive, e.g. contributing to water
remediation, or negative e.g. emissions of hexane or fertilizer. This chapter reviews the major
environment impacts which could influence sitting decision for the cultivation of micro‐algae.
6.1 Water Resources
A reliable, low cost water supply is an important factor in the overall success of biofuel
production from micro‐algae. Per litre re of biofuel, a minimum 1.5 litres of water are required
(assuming a lipid content of 50%) (René H and Maria J, 2010). In practice, however, water use
in production systems will be much larger: fresh water needs to be added to raceway pond
systems to compensate water evaporation; water is also used for cooling Closed Systems
(PBRs).
Evaporation may be particularly high in raceway pond systems that are shallow and
mechanically mixed (Lundquist, et al., 2010). The evaporation rate may also affect the “blow
down rate (BDR)”, which is defined as the quantity of water discharged divided by the quantity
of water supplied to the pond (Lundquist, et al., 2010). In normal operation the BDR is set to
ensure that the water salinity does not exceed a certain optimal point for algae production.
One suggestion is that algae cultivation could utilize water with few competing uses, such
as seawater and brackish water from aquifers. Brackish water, however, may require pre‐
treatment if the chemical constituents of the water could inhibit algae growth. This pre‐
treatment could raise the energy demand of the process (Darzins, et al., 2010).
The distance to the water source is also an important factor in locating the cultivation site,
as 100 meters elevation could mean that 6% of the energy produced by the algae would be
used for pumping (Lundquist, et al., 2010). Consequently, coastal regions are more obviously
suitable for sustainable large scale algae production systems.
Using algae with wastewater treatment is another option for algae cultivation that has
been greatly discussed. Clarens et al. (2010) considers the different types of wastewater that
can be used, and argue that that using wastewater can greatly improve the final outcome of
the LCA. (Benemann, 2010b) argues that the final use of wastewater will be limited, and
Greenwell (2010), suggests that the best choice in the end would be seawater, as “once

AQUAFUEL FP7 – 241301‐2
Coordination Action
FP7‐ENERGY‐2009‐1
57
wastewater becomes the basis of a process, it is then no longer waste and will begin to have a
value”. “Waste,” he considers, “will be useful in micro‐scale operations or where remediation
is important”. An important consideration in the use of waste water is the acceptability of the
co‐products for large markets such as animal feed. In Europe, for example, the Animal Feed
Regulation bans the use of wastewater and all derived products in animal feed.
Campbell et al. (2010) and Kadam (2001) use marine water, but do not expand on the
implications of this (i.e. whether it would need desalination and what the environmental
consequences of this would be).
Stephenson et al. (2010) (and to a lesser extent Clarens et al. (2010)) are the only studies
that consider the country specific nature of the water usage and shows that it would be lower
in open systems in the UK due to higher rainfall than it would in other countries. None of the
LCA studies reviewed in the report consider the implications of using freshwater: where this
water would be sourced from, the consequences on nearby agriculture (or if it could be
recycled within the local system), and the consequences of using it in water‐scarce areas.
Although most experts agree this is the least favourable option for water supply. Neither do
any of the LCA studies consider the added‐value that could be achieved by algae helping to
treat wastewater.
6.2 Land Use
One of the suggested benefits of algae production is that it could use marginal land, and thus
would entail little additional competition on land required for food production. Land use
change has non‐obvious life cycle impacts, however, physical constrains from topography and
soil could limit the land availability for the raceway pond system: such as the installation of
large shallow ponds requires relatively flat terrain; Soil issues also have to be concerned as
their porosity/ permeability could affect the need for pond lining and sealing, which could
contribute to the environmental burdens (Lundquist, et al., 2010).
Clarens et al. (2010) shows that algae requires less land than other biofuels, while
Stephenson et al. (2010) and Campbell et al. (2010) both mention that non‐arable land can be
used, but none of the studies truly take into account the impact of this and quantitatively
shows how this compares to first generation biofuels which require cropland. This is an
important feature of algae growth, and is one of the arguments in favour of the overall
sustainability, yet is not demonstrated in the LCA studies.

AQUAFUEL FP7 – 241301‐2
Coordination Action
FP7‐ENERGY‐2009‐1
58
6.3 Nutrient and Fertilizer Use
Algae cultivation requires several fertilizers, primarily Nitrogen (N), Phosphorus (P) and
Potassium (K). The requirement for fertilization cannot be avoided as the algal biomass itself
consists of ~7% Nitrogen and ~1% Phosphorus. Substituting fossil fuels with algal biomass
would require a lot of fertilizer (René H and Maria J, 2010). For instance, if the EU substituted
all existing fuels with from algae biofuels this would require ~25 million tonnes of Nitrogen
and 4 million tonnes of Phosphorus. Supplying this would double the current EU capacity for
fertilizer production (van Egmond, et al., 2002).
Recycling nutrients from waste water could potentially provide some of the nutrients
required. Also, locating large algae cultivation system near waste water treatment could help it
holds the potential both for fuel production and waste water remediation.
6.4 Carbon fertilisation
Currently, large point sources of CO2 are concentrated close to major industrial and urban
areas. Research from the IPCC on Carbon Capture and Storage (CCS) identifies that, a small
proportion of large CO2 sources are close to oceans, which are potential storage locations for
CO2 and are likely to be the preferred location for algal biofuel production (Darzins, et al.,
2010). The proximity of the cultivation to a carbon source has been identified by various
experts as one of the possible limitations for growth. If we assume that a minimum of 1.8 ton
of CO2 is needed to produce 1 ton of algal biomass (Kliphuis, et al., 2010), ~1.3 billion ton of
CO2 would be required to produce the 0.4 billion m3 of biodiesel needed to supply the EU
transport market (European Environment Agency, 2008). The distance across which CO2 may
need to be transported to the cultivation site may be a concern as long CO2 transport
distances could increase the emission and energy consumption dramatically. Campbell et al.
(2010) is the only LCA study to explore the implications of this, showing that transporting
(liquefied) carbon greatly reduces the overall sustainability of the project, while using flue gas
or carbon from industry is more beneficial. It should be noted that separating CO2 from flue
gas is a highly energy consuming process (~4MJ.kg‐1) (Gambini, 2000) and so the direct use of
flue gas would be preferable. While the studies generally considered flue gas as the main
carbon source this needs further investigation as it may limit the areas of growth (a large
amount of land would have to be available near a power plant). Power plants also produce
CO2 24 hours per day, but algae will only consume it during daylight, an algal system, therefore
will only ever be able to use a small proportion of the CO2 produced from a power plant.
AQUAFUEL FP7 – 241301‐2
Coordination Action
FP7‐ENERGY‐2009‐1
59
The EU 2009 Renewable Energy Directive does not give any incentive to use CO2 emissions
(or wastewater), although if PBRs could capture 80% of the CO2 fed to them, they could fall
under the EU Emissions Trading Scheme (ETS), resulting in financial incentive for industry to
partake in algae production (Vernon, 2010). There is a danger, however in viewing algae as a
sequestration method as CO2 use by algal cultures is not CO2 sequestration – that comes from
algal biofuels replacing fossil fuels” (Benemann, 2010a). Campbell et al. (2010) differentiated
between the carbon released from fossil fuels (which would add new carbon to the
atmosphere) and that by biomass burning (which only re‐releases carbon previously
captured): this is an important differentiation to make.
6.5 Fossil Fuel Inputs
As discussed in the previous chapter, the majority of the of the fossil fuel inputs to algae
cultivation come from electricity consumption during cultivation sector and natural gas
consumption from the biomass drying process. Algae are quite sensitive to temperature, and
maintaining a high level of productivity could also require temperature control. If required,
both heating and cooling could require additional fossil fuel. The environmental performance
could, however, be improved by system integration that to utilize the waste heating from
power generation for drying the algal biomass.
6.6 Eutrophication
Nutrient pollution is termed eutrophication and can lead to highly undesirable changes in
ecosystem structure and function, including:
• Increased biomass of freshwater phytoplankton and periphyton
• Changes in vascular plant production, biomass, and species composition
• Reduced water clarity
• Decreases in the perceived aesthetic value of the water body
• Taste and water supply filtration problems
• Possible health risks in water supplies
• Elevated pH and dissolved oxygen depletion in the water column
• Increased probability of fish kills (Lardon, et al., 2009).

AQUAFUEL FP7 – 241301‐2
Coordination Action
FP7‐ENERGY‐2009‐1
60
The impact of algal aquaculture on eutrophication could be positive or negative. Negative
impacts could occur if residual nutrients in spent culture medium are allowed to leach into
local aquatic systems. On the other hand, positive impacts could occur if algae production
were to be integrated into the treatment of water bodies already suffering from
eutrophication. For example, Agricultural Research Service scientists found that 60%~90% of
nitrogen runoff and 70%~100% of phosphorus runoff can be captured from manure effluents
using an algal turf scrubber (ATS) (AquaFUELs, 2011a). Remediation efforts of polluted water
bodies suffering from algal blooms may also provide significant amounts of free waste
biomass, and this could be used for biofuel production.
In the case of macro‐algae, it has been suggested that cultivating it close to fish farms and
shrimp ponds could reduce nitrate and phosphate pollution from the farm and provide a
source of agar (Troell, et al., 1997).
6.7 Genetic Modified Algae
In the search for algae that can deliver both a high biomass productivity and a high oil content,
genetic modification is one possible option (Lundquist, et al., 2010). Applications of molecular
genetics range from speeding up the screening and selection of desirable strains, to cultivating
modified algae on a large scale. Traits that could be desirable include herbicide resistance to
prevent contamination of cultures by wild type organisms. The legal status of genetically
modified algae is somewhat unclear. In the U.S, there is question about whether applicable
laws and regulations constrain the use of Genetic Modified Algae(GMA) for biofuel
production, and there is the possibility that some companies may go ahead and use of GMA in
open systems under current regulation (or their absence) (Lundquist, et al., 2010). Open
systems present a particular challenge in terms of containment, as some culture leakage and
transfer (e.g. by waterfowl) is unavoidable. Closed bioreactors may appear more secure but
Lundquist et al., (2010) comments that PBRs are only cosmetically different from open ponds
and culture leakage is unavoidable.
In the European Union the use of genetically modified organisms is closely regulated and if
algae were genetically modified they would come under the control of European legislation
aiming to prevent the release genetically modified organisms (GMOs) and their entry into the
food chain8. There are, however, a number of projects that seek to deliver value added
8 Key legislation includes: • Directive 2001/18, as amended by Directive 2008/27/EC on the deliberate release into the environment
of genetically modified organisms;

AQUAFUEL FP7 – 241301‐2
Coordination Action
FP7‐ENERGY‐2009‐1
61
products through genetic engineering in the EU including the Framework Programme 7 ‐
Genetic Improvement of Algae for Value Added Products (GIAVAP) project.
6.8 Algal toxicity
Algal toxicity may be a concern where co‐products are used to produce food. Many algae
species can produce a wide variety of toxins ranging from simple ammonia to physiological
active polypeptides and polysaccharides. Effects can range from acute effects (e.g. the algae
responsible for paralytic shellfish poison may cause death) to the chronic (e.g. the toxins
produced in red tides – carrageenans – can induce carcinogenic and ulcerative tissue changes
over long periods of time). Toxin production is species and strain specific and may also
depend on environmental conditions. The presence or absence of toxins is thus difficult to
predict (Collins, 1978) (Rellán, et al., 2009).
From the perspective of producing biofuels, perhaps the most important issue is that
where co‐products are used in the human food chain producers will have to show that the
products are safe. Where algae are harvested from the wild for human consumption the
principal concern is contamination from undesirable species. From an economic perspective
algal toxins may be important and valuable products in their own right with applications in
biomedical, toxicological and chemical research.
6.9 Conclusions
Micro‐algae culture can have a diverse range of environmental impacts. Many of these
impacts are location specific, e.g. water and land use. Impacts such as the use of genetic
engineering are uncertain, but may affect what systems are viable in particular legislatures.
The impacts presented here are the ones identified as most important in the existing
literature, but should not be considered exhaustive. In any algae cultivation scheme it should
be anticipated that environmental monitoring will play an important role and will be an
ongoing requirement.
• Regulation (EC) No 1830/2003 concerning the traceability and labelling of genetically modified
organisms and the traceability of food and feed products produced from genetically modified organisms;
• Directive 2009/41/EC on the contained use of genetically modified micro-organisms. •

AQUAFUEL FP7 – 241301‐2
Coordination Action
FP7‐ENERGY‐2009‐1
62
7. Review of macro‐algae LCA
In the 1970’s the Energy Research and Development Authority and the American Gas
Association took over the Marine Biomass Concept programme working on cultivation and
bioconversion of the giant kelp Macrocystis pyrifera (extensive review and discussion in Bird &
Benson (1987)). The project was largely unsuccessful and research subsequently abandoned.
In 1994, Gao & McKinley then published a paper entitled ‘Use of macroalgae for marine
biomass production and CO2 remediation: a review’ (Gao and McKinley, 1994). Little research
was stimulated until recently when resurgence of interest in the potential of algal biofuels has
become intense. Thus, in spite of the relative longevity of the idea, and much current
speculation about possibilities, there are very few published studies relating to the social,
economic, environmental (including energy balances) and technical challenges of using
macroalgae as a third generation biofuel feedstock. To our knowledge no full Life‐Cycle
Analyses (LCA’s) exist in the published literature, in part this is due to lack of data with which
to populate the models.
Testimony to the fact that there is still very little available data, there are a number of recent
publications addressing algal biofuels in which macro‐algae are given scant mention, and often
only in the context of stressing the lack of information ( see for example, Chung et al. 2010;
Singh et al. 2011; John et al. 2011; Singh & Olsen 2011).
One partial LCA study on macro‐algae has been completed by Aresta et al. {, 2005 #600}.
These authors report on the development of computing software for a macro‐algal biofuel
production LCA and give some preliminary outputs of the model. They claim that the model
can be adapted to assess biofuel from either micro‐ or macroalgae and is summarised in Table
7.1. They state preliminary results of analysis for Chaetomorpha linum and Pterocladiella
capillacea grown in ponds and lipid extracted by scCO2. In the best case there was a net
energy gain in the order of 11000MJ/t dry algae, which compared to 9500MJ/t dry, gasified
microalgae. They state that distribution of separated CO2 was more energetically favourable
than the distribution of flue gas, and that the application of fresh nutrients (as opposed to
wastewater/aquaculture recycled nutrients) gave a barely positive energy balance, if not
negative.

AQUAFUEL FP7 – 241301‐2
Coordination Action
FP7‐ENERGY‐2009‐1
63
A recent hypothetical analysis, was carried undertaken by Goh & Lee (2010) on the macro‐
algal production capacity in Sabah, Malaysia. Along with figures for carbohydrate yields,
fermentation efficiencies and net calorific value for ethanol derived from literature, this gave a
total available energy estimate of 6.50 x 10⁶ GJ per year. The authors go on to discuss some
challenges and constraints but in this case none of these are quantified
Table 7.1: Summary of Aresta et al. (2005) study of macro‐algae LCA
Aim To establish the energetic benefits of biofuel production from macroalgae
Assumptions • The ponds/bioreactors are situated at the coast • Nutrients are recycled from wastewater or an associated fishery • Gas transport is within the range of 100km
CO2 Capture • Considers capture from power plants ranging in size from 100‐600MW and powered by coal, oil or natural gas.
• Transport of either flue gas (if algae are resistant to NOx, SO2) or separated pure CO2
Production System Temperature, salinity, irradiance, aeration, stirring, fertilisation
Harvest Not elucidated
Drying By solar energy or recovered heat
Conversion Considers a range of processes: combustion; extraction by supercritical CO2
or organic solvents, pyrolysis, gasification, liquefaction, anaerobic
fermentation
Source: {Aresta, 2005 #600}
Despite the paucity of studies, there are a number of ongoing research projects, the outputs
of which will include LCA for macro‐algae. These are listed below.
BioMara ‐ http://www.biomara.org/
Sustainable Fuels from Marine Biomass is a joint UK and Irish Interreg IVA Project. Socio‐
economic outputs will include a microeconomic cost‐benefit analysis; a macroeconomic study
of the impacts of the development of a mari‐fuels industry in Scotland and the North of
Ireland; a techno‐economic evaluation of systems and options including biorefinery, energy
scenarios and infrastructure. Macroalgae outputs will include an Environmental Impact
Assessment (EIA); optimisation of methane yield from anaerobic digestion and scaling up;
bioethanol production and scaling up.

AQUAFUEL FP7 – 241301‐2
Coordination Action
FP7‐ENERGY‐2009‐1
64
Energetic Algae ‐ http://www.nweurope.eu/index.php?act=project_detail&id=4124
An Interreg IVB Project running from 2009‐2015. The project aims to establish an up to
date inventory of current and planned pilot cultivation sites with information sharing and
establishment of best practice. It will also identify political, economic, social and technical
opportunities to exploit algal biomass in North West Europe.
SuperGen ‐ http://www.supergen‐bioenergy.net/
Supergen II is the second phase of a UK based bioenergy research consortium funded by
the EPSRC. ‘Systems’ is one of the Supergen II themes and includes resource assessment;
technical, economic, environmental and social systems analyses; multi‐criteria assessment;
pathways, policies and impacts. ‘Technical performance, economic feasibility, environmental
impact and social implications of entire Bioenergy systems are to be evaluated over their full
life‐cycle.’ Marine biomass is included as a sub‐theme within the Resources theme.
7.1 Conclusions
No LCA for macro‐algae are available in the literature, although a number of research projects
are expected to publish on this subject in the near future. It is thought that LCAs will improve
the rationale behind each step of biofuel production and therefore give a key to the least
harmful and most efficient way of producing biofuel from macroalgal biomass.
The environmental impacts of macro‐algae production are also uncertain, despite
cultivation on artificial structures having been undertaken for decades now in SE Asia. Unlike
micro‐algae cultivation, water use is not considered a major obstacle. In cultivated systems the
most significant impacts are likely to be the provision of nutrients, and competition for the use
of the near‐shore area. Where macro‐algae are harvested from the wild, overharvesting may
risk damage to ecosystems that are dependent on macro‐algae as the bottom trophic level.
Specific environmental impacts include the following issues:
• Land‐Based Tank cultivation offers the advantage of possible integration of seaweed
into systems as biofilters with terrestrial aquaculture/wastewater, however land
availability may be an issue for the scale required in biofuel production.
• Kelp harvesting has been the main source of seaweed biomass in Europe so far.
Despite the resilience of kelp beds, resources are limited and the effect of harvesting
on associated biological communities is uncertain.

AQUAFUEL FP7 – 241301‐2
Coordination Action
FP7‐ENERGY‐2009‐1
65
• Harvesting macroalgal blooms in European coastal localities mitigates a high
environmental cost (risk of anoxia, decomposition and nutrient release, noxious
gases). The removal of large quantities of biomass and associated sediment (mostly
sand) might have some impact on coastal erosion however, latest techniques aim at
harvesting the biomass before it is stranded on beaches.

AQUAFUEL FP7 – 241301‐2
Coordination Action
FP7‐ENERGY‐2009‐1
66
8. Environmental impacts of macro‐algae production
Four alternative scenarios can be envisaged for harnessing macro‐algal production for
biofuels: cultivation at sea; tank‐based cultivation on land; harvest of the wild resource, and
harvest of nuisance bloom species. The potential impacts, both positive and negative, vary
between these alternatives methods; they will also be affected by scale. There is, however,
very little published data relating to the environmental impacts of cultivated macro‐algae
production for biofuels. In light of this, this chapter simply aims to summarise what little
published data is available, and give reference to other related studies that may highlight
future research needs and direction. The impacts of each cultivation scenario are considered
in terms of land and sea‐surface area required, water, fertiliser and nutrients, and ecosystem
effects.
8.1 Land use and near‐shore area use
8.1.2 Cultivation at sea
Laminaria production occurs both on land and at sea. The hatchery phase, where spores are
released, gametophytes cultivated, culture rope seeded and seedlings grown to transplant size
however requires relatively little space due to the minute nature of the early stages –
seedlings are transplanted to sea when they are between 3‐15mm. Large‐scale, commercial
production of kelps is only carried out in Asia but taking an example from Saccharina japonica
cultivation in China, 36kg of gametophytes was produced over a 3 month period (from an
initial inoculation of 0.75kg) using 100 x 20l bottles. This would be sufficient to produce 400
million sporelings, enough to seed 1300 hectares (Zhang, et al., 2008). Even at this scale it is
clear that this could be easily accommodated within the space of a normal laboratory (30‐50m
shelf space). Somewhat more space is required in order to seed the rope used to transfer the
seedlings to sea. This is hard to predict as it depends on longline set‐up, type of culture rope
used, nursery facilities etc. but based on extrapolations from pilot scale work in Ireland, a tank
of 1 cubic meter would be sufficient to produce enough seeded rope for 200m of longline, or
enough seeded string for a minimum of 1000m of longline. Over one hectare this would
require 25 cubic meter tanks for seeded rope or 5 tanks for seeded string.

AQUAFUEL FP7 – 241301‐2
Coordination Action
FP7‐ENERGY‐2009‐1
67
8.1.3 Tank based cultivation on land
Cultivation in tanks is more appropriate for small, fast‐growing species that need repeated
harvesting in order to maintain an appropriate stocking density, such as Ulva sp. Bruhn et al.
(2010) achieved a maximum biomass production of 45t dry weight ha‐1yr‐1 under ambient
(outside) light conditions and with minimal fertiliser input (latitude 56°N). They cite other
studies reporting energy intensive cultivation yields of 74 t dry weight ha‐1yr‐1, and non‐energy
intensive yields of 26 t dry weight ha‐1yr‐1 (Ryther et al. 1984, in (Bruhn, et al., 2010)).
Obviously yields will vary according to methods of cultivation; the figures here just serve to
give an idea of the area of land that might be required for cultivation of bioenergy significant
yields. Due to the necessity of a salt‐water supply, any tank‐based system must be coastally
located. Conflict with other land‐ or resource‐users is more likely to be in the form of the coast
as a shared landscape/leisure amenity, rather than in direct competition with agricultural or
industrial interests.
8.1.4 On‐shore facilities for sea and tank cultivation, wild harvest and bloom harvest
Land is not required on a large‐scale for macro‐algae production except in the case of land‐
based tank production. However, because of the seasonality of algae production, some
method of storage is required. The state in which the algae are stored (wet, semi‐dry or dry)
will affect the type of storage facility and space required.
All macroalgae production systems will also require on‐shore facilities in terms of offices,
warehouses and perhaps seaweed drying facilities. Harbour and pier facilities are required
with space for unloading large quantities of seaweed, as are bio‐refinery facilities, including
fermentation/digestion, separation and purification units. It is not envisaged that any of these
features will require more shore area than a normal aquaculture operation and processing
facility requires. Besides, the required land‐space does not require arable land, is not in
competition with agricultural land, and therefore the land area required for macro‐algae
cultivation can reasonably be excluded from the land for food vs energy debate.
8.2 Use of Near‐shore/Off‐shore space
Space in the near‐shore coastal environment is likely to be limited, particularly in Europe
where there is intense competition for coastal resources. Realistic projections of potential
yields (e.g. maximum 30 dry tonnes hectare‐1, based on repeated annual harvests of
Saccharina japonica in China) give some idea of the area required depending on the size of
biorefinery/biofuel installation intended.

AQUAFUEL FP7 – 241301‐2
Coordination Action
FP7‐ENERGY‐2009‐1
68
Further offshore space is less limited and this has been suggested as a potential solution
(e.g. (Buck and Buchholz, 2004)), but there are a number of technical, environmental and
economic questions to resolve before this becomes a reality.
8.3 Freshwater Use
Freshwater requirements for production of marine macroalgae are absolutely minimal and
limited to equipment care and maintenance.
8.4 Fertiliser and nutrients
8.4.2 Cultivation at sea:
In Europe cultivation at sea has been practiced on a very small‐scale. The use of fertilisers has
not been carried out/assessed, even experimentally ‐ all growth/biomass estimates reported
being those naturally attained. The FAO Culture of Kelp Manual states that the need for
fertiliser depends on the minimum N growth requirements of kelp and the hydrodynamic
regime of the farm area (FAO, 1989). Key considerations are the ability of the water body to
distribute nutrients, and the continual influx of non‐nutrient depleted water. The FAO states a
general requirement (for Saccharina japonica) of 20 mg NO3‐N.m‐3, but as little as 6‐10 mg
NO3‐N.m‐3 will still support production of 30 d.t.ha‐1 where there is rapid water exchange.
They give an annual fertiliser input of 2250 kg ha‐1, although what fertiliser is used, or the total
N content is not stated.
While kelps grow and survive well in nutrient poor waters (for example, exposed locations
on the west coast of Ireland support 80 wet t.ha‐1), N uptake is positively correlated with
characteristics such as heat tolerance / decay resistance and sorus (gamete) formation, and
can therefore be central to extending the growth season (and therefore the final yield of the
crop), or to producing high quality reproductive sporophytes. Maximising the growth season
has been found to dramatically enhance yield and so the importance of this point should not
be underestimated.
Every site will also be different. The Nitrates Directive / Water Framework Directive
(Directive 2000/60/EC) gives no specific protocol or criteria for fertilisation at sea although
provides a comprehensive format for monitoring of biological and physico‐chemical water
quality aimed at attaining or maintaining/improving ‘good’ status in water bodies. Criteria are
such that fertilisation in certain water bodies might not be out of the question in terms of

AQUAFUEL FP7 – 241301‐2
Coordination Action
FP7‐ENERGY‐2009‐1
69
compliance with the directive, but the public response would also need to be considered in
terms of acceptability.
There are other options for providing sufficient nutrients for luxuriant kelp growth that have
been proposed and in some cases experimentally, or commercially, verified. The high capacity
of kelps to remove inorganic N and P from the environment makes them potential nutrient
‘scrubbers’ from environments receiving a high nutrient loading or from those that are
eutrophic. There is quite a large body of work that has started to elucidate the capacity of
various macro‐algae to remove nutrients from wastewater sources, or from other forms of
higher trophic level aquaculture (Integrated Multi‐Trophic Aquaculture (IMTA) concept – e.g.
(Abreu, et al., 2009), or see Chopin et al. (2001) for review). While the nutrient budgets of
each aquaculture installation will be site and species specific, as an example, Sanderson (2006)
estimated that the area of S. latissima needed for remediation of a 500 tonne salmon farm in
Scotland, over the two year growth cycle, would be between 20 and 100 hectares, dependent
on the exact N incorporation into the seaweed. Based on δ15N isotope tracking, the effect of
fish farm nitrogen was detected at 500m+ (Sanderson, 2006) and up to 1350m (Handley, et al.,
2004) from the source, suggesting that a macroalgae farm of sufficient size could be located
within the area directly impacted.
Likewise, remediation of eutrophic areas resulting from land‐based nutrient inputs is a
possibility; however, while this may ameliorate an existing problem it does not provide a full
solution. Moreover, the Water Framework Directive is aiming to remove the source of the
eutrophication problems. The ideal future situation must be that there is no eutrophication
problem to remedy in the first place. Where it is deemed suitable as a mitigation method,
however, Fei (2004) identified four pre‐requisites in order that macroalgae fulfils the
mitigation role: that there is the possibility of large scale aquaculture in the eutrophic area;
that scientific and technical problems of cultivation are solved; that there are no harmful
ecological side‐effects; that cultivation is economically attractive. In Europe, all four of these
questions remain at least partially unanswered.
The feasibility of offshore macro‐algal production has been demonstrated at a concept level,
with carrier structures able to withstand offshore conditions ( >8 nautical miles from the
coast, fully exposed to all oceanographic conditions – (Buck and Buchholz, 2004) – in this case
6 m wave height and over 2 m.s‐1 current speed (Buck and Buchholz, 2004) (Buck and
Buchholz, 2005). Seaweed (Saccharina latissima) grew in fully and partially exposed locations

AQUAFUEL FP7 – 241301‐2
Coordination Action
FP7‐ENERGY‐2009‐1
70
although no biomass yield was reported for the fully exposed sites, and yields of 4kg
wet.weight.m‐1 was achieved at the partially exposed location. Optimisation of yield was not
the objective of this study, so, although the yield seems rather low, future improvements may
be possible. However, nutrient distribution in the offshore environment is both spatially and
temporally variable, and oceanic waters are predominantly oligotrophic so it may be that
some form of fertilisation is necessary in order to achieve economically viable yields.
Proposals include integration with offshore aquaculture, possibly itself integrated into
offshore wind farms e.g. (Buck, et al., 2008), in order that the infrastructure and
technical/maintenance costs are shared. Artificial up‐welling of nutrient rich deep water has
been suggested as a method of fertilising the relatively nutrient poor surface waters and this
has been successfully trialled in circumstances related to enhancing primary productivity e.g.
Masuda et al. (2010) (Japan), and in Norwegian fjords to enhance primary production and
thereby carrying capacity for mussel cultivation (Aure, et al., 2007). Filgueira et al. (2010) also
incorporated up‐welling into a model of aquaculture‐environment interactions and carrying
capacity. Technical and biological/ecological research into up‐welling systems is in its infancy
and the environmental consequences of this are unknown.
Another possibility is the reduction of the need for fertiliser input through strain selection.
There is the possibility of enhancing nutrient uptake characteristics by selective breeding or
careful selection of parent source populations – e.g. Macrocystis pyrifera in California
(Kopczak, et al., 1991). Successful breeding of heat‐tolerant strains allowing growth over a
longer season has also been carried out, e.g. Zhang et al. (2011).
8.4.3 Land‐based tank cultivation
As for sea cultivation, tank cultivation can also be integrated into other aquaculture systems in
order to bio‐remediate the waste‐water of fed aquaculture at the same time as producing a
valuable crop. There are many examples of this on experimental/pilot scales (e.g. Neori et al.
(2003) – Ulva lactuca with gilthead seabream, (Rodruigeza and Montaño, 2007)‐ Kappaphycus
spp. (carrageenophytes), with the milkfish Chanos chanos). In this case cultivation has a clear
environmental benefit, but care must be taken with release of cultivation water back into the
environment and continual monitoring will be necessary as nutrient rich cultivation water
released into environment could stimulate a eutrophic event.

AQUAFUEL FP7 – 241301‐2
Coordination Action
FP7‐ENERGY‐2009‐1
71
8.5 Macro‐algal Domestication and Genetic Engineering
Agronomically, macroalgae cultivation is in its infancy by comparison with terrestrial crops.
Domestication of kelp began in earnest in China during the mid 1950’s when the summer
sporeling method was introduced (FAO, 1989) and strain selection began to be developed in
the early 1960’s (Zhang, et al., 2011). Strain selection has led to dramatic increases in yields in
recent years and is considered vital to development of an economically viable industry. In spite
of this, there are potentially negative consequences of large‐scale release into the
environment of modified crops. Byrne & Stone (2011) state, in relation to terrestrial biofuel
crops: ‘The biosecurity risks of biomass feedstock production for bioenergy need to be
evaluated since the functional traits for bioenergy crops are also typical of weed species.’
Escape outside of the cultivation environment and establishment in the wild can lead to
establishment of environmental weeds which may impact on the ‘structural and compositional
features of biodiversity in agricultural landscapes’ (ibid.) as well as on ecosystem services. The
authors propose a risk assessment formula for assessing invasiveness, potential impact of
establishment (of either selectively bred, or genetically modified organisms), and risks of
genetic pollution for transgenic organisms. Genetic pollution relates to hybridisation between
domesticated and native crops (both between species, and within cultivars/populations). The
impacts relate to expression of hybrid vigour and introgression of foreign genes (e.g.
(Bergelson, et al., 1998) – ‘genetic engineering can substantially increase the probability of
transgene escape) or through out‐breeding depression and reduction of reproductive output.
Several authors stress that the consequences of genetic pollution are hard to evaluate and
advise extreme caution (e.g. Latham et al. (2006), also see articles in Current Opinion in
Environmental Sustainability 2011, Vol.3, pp. 1‐112). There are numerous examples of escapes
and establishment of transgenic organisms including some having long‐term environmental
and economic costs, for example the escape of Sorghum halepense, an introduced forage
grass in the USA (see Raghu et al. (2006)), and Agrostis stolonifera (creeping bentgrass), also in
the USA (see Moon et al. (2010), also for discussion of strategies of biocontainment of
transgenes for sustainable use of biotechnology). Having said this, while transgenic kelp is a
reality (see Qin et al. (2004, , 2005, , 1999), it has been limited to closed systems which the
authors stress must remain the case (Qin, et al., 2005).
Further to the above, problems common to large‐scale monocultures, particularly of non‐
native species are those of pest and disease introduction or enhancement and the risk of
transfer to wild populations. These also have the potential to affect yield and therefore should
be considered in environmental and economic projections.

AQUAFUEL FP7 – 241301‐2
Coordination Action
FP7‐ENERGY‐2009‐1
72
Sheppard et al. (2011) conclude: ‘We believe these future threats posed by a large new
non‐food agricultural sector driven by the bioeconomy have not been given adequate thought
or acceptance by industry and policy makers and in many cases have gone ignored.’ As the
macroalgal cultivation industry is in the very early stages, the opportunity to ensure full
consideration of unresolved issues, and incorporate knowledge from terrestrial systems need
not be missed.
8.6 Ecosystem Effects
8.6.2 Cultivation at Sea
Again there is little published data. Effects on the benthos have been demonstrated by Eklof et
al. (2005) (2006). Both these are tropical examples and relate to off‐bottom cultivation above
seagrass beds. Physical and biological changes were documented in sediment quality (became
finer), decreased sediment organic matter, decreased macroalgae and seagrass diversity,
decreased abundance and biomass of macrofauna, and a shift in seagrass community
structure – these changes, via speculated mechanisms of shading, emergence stress and
mechanical abrasion, are typically associated with a decrease in ecological quality. In the same
tropical system, Bergman et al. (2009) (2001) demonstrated changes (trophic identity,
abundance, species richness and community composition) in fish assemblages associated with
seaweed cultivation that were regarded as positive in some cases and negative in others. The
observed differences between lagoons were thought to be due to farming intensity and
substratum character.
Flow modification on a bay scale have been predicted by Grant & Bacher (2001), in Sungo
Bay, China. The bay occupies approximately 140km2 with a maximum depth of 15m and
virtually the whole bay is taken up with aquaculture of the kelp Laminaria japonica (3300
hectares in 1994) and the scallop Chlamys farreri (1333 hectares in 1994). A model of altered
current speeds and particle exchange was developed which predicted a 54% reduction in flow
and 41% reduction in particle exchange rate within the main cultivation area. The authors
state that ‘disregard for physical barriers associated with culture will result in a serious
overestimation of the particle renewal term and thus an overestimation of carrying capacity.’
They also acknowledge the need for field measurements to validate and refine the model.
Productivity of Laminaria forests is high and has been estimated, based on biomass, to be in
the range of 800‐1900 gCm‐2 (Sjotun, et al., 1995), 603‐1750 gCm‐2 (Mann, 1973). Productivity

AQUAFUEL FP7 – 241301‐2
Coordination Action
FP7‐ENERGY‐2009‐1
73
is actually greater than would appear based on biomass alone because of the continual
attrition of the lamina which results in a steady supply of particulate organic matter (POM), in
addition to exudation of excess fixed carbon contributing to the supply of dissolved organic
carbon (DOC) in the system. Abdullah & Fredriksen (2004) (2004) estimated total productivity
of L. hyperborea, i.e. including DOC (estimated at 26% of fixed carbon) and POM, to be as high
as 3000 gCm‐2. This large supply of organic matter subsidises trophic systems outside the kelp
ecosystem itself. For example, in South Africa, kelp derived detritus accounted for 65% of POM
in the intertidal zone – consumers in the intertidal were shown to be dependent on
productivity in the sub‐tidal and this effect was important even at sites along the coast where
there was no immediate kelp forest (Bustamante and Branch, 1996). Steneck et al. (2002) cite
further studies demonstrating carbon contributions to intertidal, offshore, shallow and deep
soft‐sediment, and terrestrial ecosystems. Large‐scale macroalgal cultivation will therefore
also contribute to the DOC and POM in the local ecosystem (although regular harvesting will
alter the overall dynamics) and this will perhaps be a positive effect. However quantification
of the contribution of organic matter and the impact on the ecosystem has not so far been
studied.
8.6.3 Land‐based Tank Cultivation
There is limited potential for effects due to the semi‐enclosed nature of the system, except for
the potential stimulation of a eutrophication event by release of nutrient enhanced water.
8.6.4 Wild Harvest
Kelp forest ecosystems have a high intrinsic ecological stability (Steneck, et al., 2002) meaning
that in themselves they are relatively resilient and can withstand considerable physical
disturbance, including that of harvesting. However, kelp individuals and ecosystems support a
very diverse and abundant flora and fauna e.g. Christie et al. (2003), Norderhaug et al. (2003)
and studies have shown that the resilience of the associated communities tends to be less
than that of kelp forest itself and the recovery times post‐harvest slower than for the kelps
(Christie, et al., 1998). Further to this, multi‐trophic interactions are largely unknown, but see
Lorentsen et al. (2010) for a comprehensive study of trophic interactions between kelps and
associated fauna and consequences of harvesting.
High productivity means that kelp ecosystems tend to provide trophic subsidies to other
inter‐related ecosystems (e.g. (Abdullah and Fredriksen, 2004) (Jørgensen and Christie, 2003))
so de‐stabilisation of kelp ecosystems has the potential to have far‐reaching consequences.

AQUAFUEL FP7 – 241301‐2
Coordination Action
FP7‐ENERGY‐2009‐1
74
The effect will be very much dependent on scale of the harvest. Norway has experience of
long‐term kelp harvesting with apparent stability (Vea and Ask, 2010) but a recent paper
suggests that the effects of the harvest (in terms of local and offshore ecosystems) are not
fully appreciated at present and may be more detrimental than previously thought (Lorentsen,
et al., 2010).
For a full discussion of the potential effects of harvesting see Ratcliff (Ratcliff J (in press),
2010).
8.6.5 Harvest of blooms
Liu et al. (2009) found large‐scale porphyra aquaculture in combination with a eutrophic water
body stimulated a massive (400km2) Enteromorpha prolifera bloom in China. Removal of
bloom biomass is important to prevent the formation of the anoxic conditions that follow
during the degradation of the biomass, which can be extremely detrimental to other
organisms. Bloom events resulting from eutrophic water bodies are not uncommon and can
result in substantial quantities of biomass however, they may be unpredictable in terms of
time and space which results in logistical difficulties for harvesting and processing, particularly
in terms of transport of a wet, bulky material, which will impact the GHG emissions budget for
the process. Further to this, as mentioned above, the ideal is that the eutrophication initially
stimulating the bloom is dealt with in the first place rather than attempting to mitigate the
effects of a different problem.
8.7 Environmental Contamination
During the nursery stage of cultivation antibiotics (chloromycetin) and germanium dioxide are
sometimes used in order to control contamination of the gametophyte and juvenile
sporophyte cultures with alginic acid decomposing bacteria and diatoms (respectively). In
terms of contamination, standard laboratory procedures avoiding release of these agents to
the environment should be sufficient to avoid potential negative environmental
consequences.
Solid waste will be mainly in the form of ropes, buoys and structural components of the
farm. Longevity is of obvious importance from an economic perspective however, particularly
in terms of rope requirements, which over a large‐scale farm will amount to a substantial
quantity, consideration of materials will be important. In China, seeding has predominantly
been carried out on palm‐fibre rope which is biodegradable. However, in Europe, trial

AQUAFUEL FP7 – 241301‐2
Coordination Action
FP7‐ENERGY‐2009‐1
75
cultivation projects have tended to use synthetics – either polypropylene or polyvinyl alcohol
based vinylon fibre. Potential for re‐use or recycling should be assessed.
Airborne emissions during both production (above the macro‐algal crop) and storage have
not been measured. However, kelps are known to emit volatile short‐lived organic compounds
like organo‐iodines and molecular iodine which play a major role in the iodine biogeochemical
cycle. The emissions are significant especially when kelps are subjected to stress such as
emersion, exposure to ultraviolet radiation or elevated ozone. These volatile organic
compounds could contribute to marine aerosol formation and have a direct effect on the
earth’s climate (see Carpenter et.al. (2000)). Emissions of H2S during wet storage would also
need to be quantified and monitored.
8.8 Conclusions
The environmental impact of macro‐algae production for biofuels has yet to be assessed.
Nevertheless, there is evidence that this source of biomass is associated with a range of
impacts. In cultivated systems the most significant impacts are likely to be the provision of
nutrients, and competition for the use of the near‐shore area. Where macro‐algae are
harvested from the wild, overharvesting may risk damage to ecosystems that are dependent
on macro‐algae.
9. Conclusions and recommendations
This report examines the available literature on biofuel production from micro‐algae and
macro‐algae, focusing on the life cycle and environmental impacts reported, and the
methodologies that have been used to assess them. This examination was supplemented with
information gathered from experts and stakeholders.
9.1 Conclusions for micro‐algae LCA, and environmental impacts
The impacts of micro‐algal biofuel production have been assessed using a variety of life
cycle assessment (LCA) approaches. These studies share a common aspiration to identify
production bottlenecks and help steer the future development of algae biofuel technology.
Clarens (2010b), for example, claims that one of the strengths of LCA is that it “can provide a
quantitative road map, and when it is combined with financial modelling can provide an
excellent barometer for how to develop algae bioenergy”. Yet, the extent to which the studies
meet this aspiration appears to be somewhat limited.

AQUAFUEL FP7 – 241301‐2
Coordination Action
FP7‐ENERGY‐2009‐1
76
Issues of concern include:
• The conceptual, and often incomplete, nature of the systems under investigation, and
the absence of coherent and well designed processes.
• The limited sources of primary data upon which process assumptions are based, and
the extrapolation of laboratory data to production scale. The transparency of
assumptions is also poor.
• The validity of specific assumptions, particularly those relating to the biomass and
lipid productivity, has been called into question, and may be over optimistic.
• The use of inconsistent boundaries, functional units and allocation methodologies
impedes comparison between studies.
Despite these shortcomings, and the concerns voiced by stakeholders about the extent to
which the existing LCA can be considered representative, this examination of LCA studies
suggest that:
• The net energy ratio (NER) for biomass or lipid production in a simplistic but
normalized system is unattractive, or, at best, marginal. This suggests that algae
production may be most attractive where energy is not the main product.
• Carbon emissions from algae biomass – calculated using default emission factors –
produced in raceway ponds are comparable to the emissions associated with
conventional biodiesel. The carbon emissions from algae biomass produced in PBRs
are greater than the emissions associated with conventional diesel. The principle
reason for this is the electricity used to pump the algal broth around the system.
• Raceway Pond Systems consistently demonstrate a more attractive energy ratio than
PBR Systems (it should also be borne in mind that a commercial system may
combine elements of both).
• Algae production requires a number of energy demanding processes. However, within
the LCA studies considered here there is no consistent hierarchy of energy
consumption. Aspects that will need to be addressed in a viable commercial system
include: the energy required for pumping, the embodied energy required for
construction, the embodied energy in fertilizer, and the energy required for drying
and de‐watering.

AQUAFUEL FP7 – 241301‐2
Coordination Action
FP7‐ENERGY‐2009‐1
77
An important caveat to these conclusions is that they reflect the state of the existing academic
literature, and this is inevitably an imperfect reflection of systems being evaluated by
companies. It is quite possible that many of the challenges identified have been addressed,
but that the information about how this has been achieve is yet to make it into the public
domain.
In the absence of commercially operating systems, attempts to assess the lifecycle and
environmental impacts of algae production are necessarily based on assumed process
descriptions. This does not negate the value of these studies, but it does mitigate in favour of
a cautious approach to their interpretation. Future LCA are can be improved if these issues
identified above are addressed, but perhaps the greatest opportunity for improvement lies
obtaining good quality primary data from pilot scale systems and improving the extrapolation
of this data to full scale systems.
Looking at the environmental impacts of algae production, it is apparent that micro‐algae
culture can have a diverse range of environmental impacts, but, that depending on how the
system is configured, these may be positive or negative. Other than the energy balance,
possibly the most important environmental aspect of micro‐algae culture that needs to be
considered is water management: both the water consumed by the process, and the
emissions to water courses from the process.
9.2 Conclusions for macro‐algae LCA and environmental impacts
No LCA for macro‐algae are available in the literature, although a number of research projects
are expected to publish on this subject in the near future.
The environmental impacts of macro‐algae production are also uncertain. Unlike micro‐
algae cultivation, water use is not considered a major obstacle. In cultivated systems the most
significant impacts are likely to be the provision of nutrients, and competition for the use of
the near‐shore area. Where macro‐algae are harvested from the wild, overharvesting may risk
damage to ecosystems that are dependent on macro‐algae as the bottom trophic level.

AQUAFUEL FP7 – 241301‐2
Coordination Action
FP7‐ENERGY‐2009‐1
78
10. References
ABDULLAH, M. and FREDRIKSEN, S. (2004) Production, respiration and exudation of dissolved organic matter by the kelp Laminaria hyperborea along the west coast of Norway. Journal of the Marine Biological Association of the UK, 84, 887‐891.
ABO (2010) Algal Biomass Organization Questions Accuracy of University of Virginia Algae Life Cycle Study [Internet], Algal Biomass Organisation (ABO), available from: <http://www.algalbiomass.org/media‐center/news‐press‐releases/abo‐press‐releases/algal‐biomass‐organization‐questions‐accuracy‐of‐university‐of‐virginia‐algae‐life‐cycle‐study‐2/> [Accessed: 13 May 2011].
ABREU, M., VARELA, D., HENRÍQUEZ, L., VILLARROEL, A., YARISH, C., SOUSA‐PINTO, I. and BUSCHMANN, A. (2009) Traditional versus Integrated Multi‐Trophic Aquaculture of Gracilaria chilensis C.J. Bird, J. McLachlan & E.C. Oliveira: Productivity and physiological performance. Aquaculture 293: 211‐220. .
AMIN, S. (2009) Review on biofuel oil and gas production processes from microalgae. Energy Conversion and Management, 50, 1834‐1840.
APT, K. E. and BEHRENS, P. W. (1999) COMMERCIAL DEVELOPMENTS IN MICROALGAL BIOTECHNOLOGY. Journal of Phycology, 35, 215‐226.
AQUAFUELS (2010) Project Info [Internet], available from: <http://www.aquafuels.eu/project‐info.html> [Accessed: 16/7/2010,
AQUAFUELS (2011a) Report on Biology and Biotechnology of algae with indication of criteria for strain selection.
AQUAFUELS (2011b) Task 1.9 Mapping of natural resources in artificial, marine and freshwater bodies.
AURE, J., STRAND, Ø., ERGA, S. and STROHMEIER, T. (2007) Primary production enhancement by artificial upwelling in a western Norwegian fjord. Marine Ecology Progress Series 352, 39‐52.
BARSANI, L. and GUALTIERI, P. (2006) Algae Anatomy, Biochemistry, and Biotechnology. Boca Raton, FL. CRC Press.
BENEMANN, J. R. (2010a) Microalgae Biofuels and Animal Feeds: An Introduction.
BENEMANN, J. R. (2010b) Questionnaire about LCA on Microalgae.

AQUAFUEL FP7 – 241301‐2
Coordination Action
FP7‐ENERGY‐2009‐1
79
BENEMANN, J. R. and OSWALD, W. J. (1996) Systems and economic analysis of microalgae ponds for conversion of CO2 to biomass. Department of Energy, Pittsburgh Energy Technology Center.
BERGELSON, J., PURRINGTON, C. and WICHMANN, G. (1998) Promiscuity in transgenic plants. Nature, 395.
BERGMAN, K., SVENSSON, S. and ÖHMAN, M. (2009) Influence of algal farming on fish assemblages. Marine Pollution Bulletin, 42 1379‐1389.
BIRD, K. and BENSON, P. (1987) Seaweed Cultivation for Renewable Resources., Elsevier Science Publishers.
BOGUSKI, T. K., HUNT, R. G., CHOLAKIS, J. M. and FRANKLIN, W. E. (1996) Environmental Life‐Cycle Assessment. New York, London, McGraw‐Hill.
BRENNAN, L. and OWENDE, P. (2010) Biofuels from microalgae—A review of technologies for production, processing, and extractions of biofuels and co‐products. Renewable and Sustainable Energy Reviews, 14, 557‐577.
BRUHN, A., DAHL, J., NIELSEN, H., NIKOLAISEN, L., RASMUSSEN, M., MARKAGER, S., OLESEN, B., ARIAS, C. and JENSEN, P. (2010) Bioenergy potential of Ulva lactuca: biomass yield, methane production and combustion. Bioresource Technology.
BUCK, B. and BUCHHOLZ, C. (2004) The offshore‐ring: A new system design for the open ocean aquaculture of macroalgae. Journal of Applied Phycology, 16, 355‐368.
BUCK, B. and BUCHHOLZ, C. (2005) Response of offshore cultivated Laminaria saccharina to hydrodynamic forcing in the North Sea. Aquaculture, 250, 674‐691.
BUCK, B., KRAUSE, G., MICHLER‐CIELUCH, T., BRENNER, M., BUCHHOLZ, C., BUSCH, J., FISCH, R., GEISEN, M. and ZIELINSKI, O. (2008) Meeting the quest for spatial efficiency: progress and prospects of extensive aquaculture within offshore wind farms. Helgoland Marine Research, 62, 269‐281.
BUSTAMANTE, H. and BRANCH, G. (1996) The dependence of intertidal consumers on kelp‐derived organic matter on the west coast of South Africa. Journal of Experimental Marine Biology and Ecology, 196, 1‐28.
BYRNE, M. and STONE, L. (2011) The need for ‘duty of care’ when introducing new crops for sustainable agriculture. Current Opinion in Environmental Sustainability, 3, 50‐54.
CARLSSON, A. S., VAN BEILIN, J. B., MOLLER, R. and CLAYTON, D. (2007) Micro‐ and Macro‐algae: Utility for Industrial Applications., University of York, CPL Press.

AQUAFUEL FP7 – 241301‐2
Coordination Action
FP7‐ENERGY‐2009‐1
80
CARPENTER, L., MALIN, G., LISS, P. and KUPPER, F. (2000) Novel biogenic iodine‐containing trihalomethanes and other short‐lived halocarbons in the coastal East Atlantic. Global Biogeochemical Cycles, 12, 1191‐1204.
CHEN, F. (1996) High cell density culture of microalgae in heterotrophic growth. Trends in Biotechnology, 14, 421‐426.
CHEN, F. and JOHNS, M. (1995) A strategy for high cell density culture of heterotrophic microalgae with inhibitory substrates. Journal of Applied Phycology, 7, 43‐46.
CHEN, F. and JOHNS, M. R. (1996) Heterotrophic growth of Chlamydomonas reinhardtii on acetate in chemostat culture. Process Biochemistry, 31, 601‐604.
CHISTI, Y. (2007) Biodiesel from microalgae. Biotechnology Advances, 25, 294‐306.
CHISTI, Y. (2008a) Biodiesel from microalgae beats bioethanol. Trends in Biotechnology, 26, 126‐131.
CHOPIN, T., BUSCHMANN, A., HALLING, C., TROELL, M., KAUTSKY, N., NEORI, A., KRAEMER, G., ZERTUCHE‐GONZÁLEZ, J., YARISH, C. and NEEFUS, C. (2001) Minireview. Integrating seaweeds into marine aquaculture systems: A key toward sustainability. Journal of Phycology, 37, 975‐986.
CHRISTIE, H., FREDRIKSEN, S. and RINDE, E. (1998) Regrowth of kelp and colonization of epiphyte and fauna community after kelp trawling at the coast of Norway. Hydrobiologia, 375/376, 49‐58.
CHRISTIE, H., JORGENSEN, N., NORDERHAUG, K. and WAAGE‐NIELSEN, E. (2003) Species distribution and habitat exploitation of fauna associated with kelp (Laminaria hyperborea) along the Norwegian coast. Journal of the Marine Biological Association of the UK, 83, 687‐699.
CLARENS, A., RESURRECCION, E., WHITE, M. and COLOSI, L. (2010) Environmental Life Cycle Comparison of Algae to Other Bioenergy Feedstocks. Environmental Science Technology, 44, 1813‐1819.
COLLINS, M. (1978) Algal Toxins. Microbiological reviews, 42, 726‐746.
DARZINS, A., PIENKOS, P. and EDYE, L. (2010) Current Status and Potential for Algae Biofuels Production. [Available from: <Error! Hyperlink reference not valid..
DE SMET, B., WHITE, P. R. and OWENS, J. W. (1996) Environmental life‐cycle assessment. New York, McGraw‐Hill.

AQUAFUEL FP7 – 241301‐2
Coordination Action
FP7‐ENERGY‐2009‐1
81
DEMIRBAS, A. (2009) Progress and recent trends in biodiesel fuels. Energy Conversion and Management, 50, 14‐34.
EC (2009) Directive on the promotion of the use of energy from renewable sources and amending and subsequently repealing Directives 2001/77/EC and 2003/30/EC. IN E. COMMISSION (Ed.). Brussels, Belgium, European Commission.
EC (2010) ILCD Handbook: General guide for Life Cycle Assessment ‐ Detailed guidance. Joint Research Centre, Institute for Environment and Sustainability,European Commission.
EKLÖF, J., DE LA TORRE CASTRO, M., ADELSKÖLD, L., JIDDAWI, N. and KAUTSKY, N. (2005) Differences in macrofaunal and seagrass assemblages in seagrass beds with and without seaweed farms. Estuarine, Coastal and Shelf Science, 63, 385‐396.
EKLÖF, J., HENRIKSSON, R. and KAUTSKY, N. (2006) Effects of tropical open‐water seaweed farmin on seagrass ecosystem structure and function. Marine Ecology Progress Series 352, 73‐84.
EUROPEAN ENVIRONMENT AGENCY (2008) Greenhouse Gas Emission Trends and Projections in Europe 2008. European Environment Agency, Copenhagen, Denmark.
FAO (1989) Culture of kelp (Laminaria japonica) in China. Training manual 89/5. Food and Agriculture Organization of the United Nations (FAO). [Available from: < http://www.fao.org/docrep/field/003/AB724E/AB724E00.htm >].
FEI, X. (2004) Solving the coastal eutrophication problem by large scale seaweed cultivation. Hydrobiologia, 512, 145‐151.
FILGUEIRA, R., GRANT, J., STRAND, Ø., ASPLIN, L. and AURE, J. (2010) A simulation model of carrying capacity for mussel culture in a Norwegian fjord: Role of induced upwelling. Aquaculture, 308, 20‐27.
FONSECA, D. (August 2010) Questionnaire about LCA on Microalgae.
GAO, K. and MCKINLEY, K. (1994) Use of macroalgae for marine biomass production and CO2 remediation: a review. Journal of Applied Phycology, 6, 45‐60.
GNANSOUNOU, E., DAURIAT, A., VILLEGAS, J. and PANICHELLI, L. (2009) Life cycle assessment of biofuels: Energy and greenhouse gas balances. Bioresource Technology, 100, 4919‐4930.
GRAHAM, L. E. and WILCOX, L. W. (2000) Algae. Upper Saddle River, NJ, Prentice Hall Inc.
GRANT, J. and BACHER, C. (2001) A numerical model of flow modification induced by suspended aquaculture in a Chinese bay. Canadian Journal of Fisheries and Aquatic Sciences, 58, 1003‐1011.

AQUAFUEL FP7 – 241301‐2
Coordination Action
FP7‐ENERGY‐2009‐1
82
GRAVERHOLT, O. and ERIKSEN, N. (2007) Heterotrophic high‐cell‐density fed‐batch and continuous‐flow cultures of <i>Galdieria sulphuraria</i> and production of phycocyanin. Applied Microbiology and Biotechnology, 77, 69‐75.
HANDLEY, L., DAVIES, I., ROBINSON, C., RAVEN, J. and HADFIELD, B. (2004) Fish‐farm nitrogen: It’s area of biological impact (a scoping study). Final Project Report to The Crown Estate. [Available from: <www.thecrownestate.co.uk/aqua_fish_farm_nitrogen.pdf>].
HASE, R., OIKAWA, H., SASAO, C., MORITA, M. & WATANABE, Y. (2000) Photosynthetic production of microalgal biomass in a raceway system under greenhouse conditions in Sendai city. Journal of Bioscience and Bioengineering, 89, 157‐163.
HEIJUNGS, R., GUINEE, J. B., HUPPES, G., LANKREIJER, R. M., UDO DE HAES, H. A., WEGENER SLEESWIJK, A., ANSEMS, A. M. M., EGGELS, P. G., VAN DUIN, R. and DE GOEDE, H. P. (1992) Environmental life cycle assessment of products: Guide LCA. Centre of Environmental Science (CML), Unilever, Leiden, The Netherlands.
IEA, B. (2010) Algae – The Future for Bioenergy? Summary and conclusions from the IEA Bioenergy ExCo64 Workshop.
ISO (1997) Environmental management‐life cycle assessment‐principle and framework. ISO.
JØRGENSEN, N. and CHRISTIE, H. (2003) Diurnal, horizontal and vertical dispersal of kelp‐associated fauna. Hydrobiologia 503, 69‐76.
JORQUERA, O., KIPERSTOK, A., SALES, E. A., EMBIRUÇU, M. and GHIRARDI, M. L. (2010) Comparative energy life‐cycle analyses of microalgal biomass production in open ponds and photobioreactors. Bioresource Technology, 101, 1406‐1413.
KADAM, K. L. (2001) Microalgae production from power plant flue gas: Environmental implications on a life cycle basis. National Renewable Energy Laboratory.
KLIPHUIS, A. M. J., DE WINTER, L., VEJRAZKA, C., MARTENS, D. E., JANSSEN, M. and WIJFFELS, R. H. (2010) Photosynthetic efficiency of Chlorella sorokiniana in a turbulently mixed short light‐path photobioreactor. Biotechnology Progress, 26, 687‐696.
KOPCZAK, C., ZIMMERMAN, R. and KREMER, J. (1991) Variation in nitrogen physiology and growth among geographically isolated populations of the giant kelp Macrocystis pyrifera (Phaeophyta). Journal of Phycology, 27, 149‐158.
LARDON, L., HELIAS, A., SIALVE, B., STEYER, J. P. and BERNARD, O. (2009) Life‐Cycle Assessment of Biodiesel Production from Microalgae. Environmental Science & Technology, 43, 6475‐6481.

AQUAFUEL FP7 – 241301‐2
Coordination Action
FP7‐ENERGY‐2009‐1
83
LATHAM, J., WILSON, A. and STEINBRECHER, R. (2006) The Mutational Consequences of Plant Transformation. Journal of Biomedicine and Biotechnology. 1‐7.
LIU, D., KEESING, J., XING, Q. and SHI, P. (2009) World’s largest macroalgae bloom caused by expansion of seaweed aquaculture in China. Marine Pollution Bulletin 58, 888‐895.
LORENTSEN, S.‐H., SJOTUN, K. and GRÉMILLET, D. (2010) Multi‐trophic consequences of kelp harvest. . Biological Conservation, 143, 2054‐2062.
LUNDQUIST, T. J., WOERTZ, I. C., QUINN, N. W. T. and BENEMANN, J. R. (2010) A Realistic Technology and Engineering Assessment of Algae Biofuel Production. Energy Biosciences Institute, University of California, Berkeley, California.
MACADAM, J. (2010) Combined Heat & Power and District Heating:the urban context. A lecture to the MSc Course in Sustainable Energy Futures, Imperial College London. London.
MANN, K. (1973) Seaweeds: Their productivity and strategy for growth. Science 182, 975‐981.
MASUDA, T., FURUYA, K., KOHASHI, N., SATO, M., TAKEDA, S., UCHIYAMA, M., HORIMOTO, N. and ISHIMARU, T. (2010) Lagrangian observation of phytoplankton dynamics at an artificially enriched subsurface water in Sagami Bay, Japan. Journal of Oceanography, 66, 801‐813.
METEOTEST database Meteonorm.
MOLINA GRIMA, E., BELARBI, E. H., ACIEN FERNANDEZ, F. G., ROBLES MEDINA, A. and CHISTI, Y. (2003) Recovery of microalgal biomass and metabolites: process options and economics. Biotechnology Advances, 20, 491‐515.
MOON, H., ABERCROMBIE, J., KAUSCH, A. and STEWART, J. C. (2010) Sustainable Use of Biotechnology for Bioenergy Feedstocks. Environmental Management, 46, 531‐538.
NECTON (1990) Estudo de localização de unidade industrial para produção de microalgas em portugal.
NEORI, A., MSUYA, F., SHAULI, L., SCHUENHOFF, A., KOPEL, F. and SHPIGEL, M. (2003) A novel three‐stage seaweed (Ulva lactuca) biofilter design for integrated mariculture. Journal of Applied Phycology, 15, 543‐553.
NORDERHAUG, K., FREDRIKSEN, S. and NYGAARD, K. (2003) Trophic importance of Laminaria hyperborea to kelp forest consumers and the importance of bacterial degradation to food quality. Marine Ecology Progress Series 255, 135‐144.
OILGAE (2010) Algae Cultivation.

AQUAFUEL FP7 – 241301‐2
Coordination Action
FP7‐ENERGY‐2009‐1
84
PATIL, V., TRAN, K. Q. and GISELRØD, H. R. (2008) Towards sustainable production of biofuels from microalgae. International Journal of Molecular Sciences, 9, 1188‐1195.
PULZ, O. (2001a) Photobioreactors: production systems for phototrophic microorganisms. Applied Microbiology and Biotechnology, 57, 287‐293.
PULZ, O. (2001b) Photobioreactors: production systems for phototrophic microorganisms. Appl Microbiol Biotech, 57.
QIN, S., JIANG, P. and TSENG, C. (2004) Molecular biotechnology of marine algae in China. Hydrobiologia 512, 21‐26.
QIN, S., JIANG, P. and TSENG, C. (2005) Transforming kelp into a marine bioreactor. Trends in Biotechnology, 23, 264‐268.
QIN, S., SUN, G.‐Q., JINAG, P., ZOU, L.‐H., WU, Y. and TSENG, C.‐K. (1999) Review of genetic engineering of Laminaria japonica (Laminariales, Phaeophyta) in China. Hydrobiologia 398/399, 469‐472.
RAGHU, S., ANDERSON, R., DAEHLER, C., DAVIS, A., WIEDENMANN, R., SIMBERLOFF, D. and MACK, R. (2006) Adding Biofuels to the Invasive Species Fire? Science 313, 1742.
RATCLIFF J (IN PRESS) ( 2010) Evaluation of the existing and future biomass potential of the wild kelp resource in the UK and Ireland. Proceedings of Bioten ‐ Engaging UK Bioenergy.
RAYNOLDS, M., FRASER, R. and CHECKEL, D. (2000a) The relative mass‐energy‐economic (RMEE) method for system boundary selection Part 1: A means to systematically and quantitatively select LCA boundaries. The International Journal of Life Cycle Assessment, 5, 37‐46.
RAYNOLDS, M., FRASER, R. and CHECKEL, D. (2000b) The relative mass‐energy‐economic (RMEE) method for system boundary selection. Part 2: Selecting the Boundary Cut‐off Parameter (ZRMEE) and its Relationship to Overall Uncertainty. The International Journal of Life Cycle Assessment, 5, 96‐104.
RELLÁN, S., OSSWALD, J., SAKER, M., GAGO‐MARTINEZ, A. and VASCONCELOS, V. (2009) First detection of anatoxin‐a in human and animal dietary supplements containing cyanobacteria. Food and Chemical Toxicology, 47, 2189‐2195.
RENÉ H, W. and MARIA J, B. (2010) An Outlook on Microalgal Biofuels. Science, 329, 796‐799.
RODRUIGEZA, M. and MONTAÑO, M. (2007) Bioremediation potential of three carrageenophytes cultivated in tanks with seawater from fish farms. Journal of Applied Phycology, 19, 755‐762.

AQUAFUEL FP7 – 241301‐2
Coordination Action
FP7‐ENERGY‐2009‐1
85
SAIC (2006) Life Cycle Assessment: Principles and Practice. Scientific Applications International Corporation (SAIC). National Risk Management Research Laboratory, U.S. Environmental Protection Agency, Cincinnati, USA.
SANDER, K. and MURTHY, G. S. (2010) Life cycle analysis of algae biodiesel. The International Journal of Life Cycle Assessment, 1‐11.
SANDERSON, J. (2006) Reducing the environmental impact of seacage fish farming through cultivation of seaweed. Scottish Association of Marine Science,
SCHENK, M. P., THOMAS‐HALL, S. R., STEPHENS, E., MARX, U. C., MUSSGNUG, J. H., POSTEN, C., KRUSE, O. and HANKAMER, B. (2008) Second Generation Biofuels: High‐Efficiency Microalgae for Biodiesel Production. Bioenergy Research, 1, 20‐43.
SETAC (1993) Guidelines for Life‐Cycle Assessment: a ‘Code of Practice' from the workshop held at Sesimbra, Portugal, 31 March ‐ 3 April 1993 Society of Environmental Toxicology and Chemistry (SETAC) Journal Environmental Science and Pollution Research
SHEEHAN, J., CAMOBRECO, V., DUFFIELD, J., GRABOSKI, M. and SHAPOURI, H. (1998a) Life cycle inventory of biodiesel and petroleum diesel for use in an urban bus. Golden, CO (US).
SHEEHAN, J., DUNAHAY, T., BENEMANN, J. & ROESSLER, P. (1998b) A Look Back at the US Department of Energy’s Aquatic Species Program—Biodiesel from Algae. U. D. O. ENERGY., Golden, CO.
SHEPPARD, A., GILLESPIE, I., HIRSCH, M. and BEGLEY, C. (2011) Biosecurity and sustainability within the growing global bioeconomy. Current Opinion in Environmental Sustainability, 3, 4‐10.
SIALVE, B., BERNET, N. and BERNARD, O. (2009) Anaerobic digestion of microalgae as a necessary step to make microalgal biodiesel sustainable. Biotechnology Advances, 27, 409‐416.
SJOTUN, K., FREDRIKSEN, S., RUENESS, J. and LEIN, T. (1995) Ecological studies of the kelp Laminaria hyperborea (Gunnerus) Foslie in Norway In Ecology of Fjords and Coastal Waters., Elsevier Science.
STENECK, R., GRAHAM, M., BOURQUE, B., CORBETT, D., ERLANDSON, J., ESTES, J. and TEGNER, M. (2002) Kelp forest ecosystems: biodiversity, stability, resilience and future. Environmental Conservation 29, 436‐459.
STEPHENSON, A. L., KAZAMIA, E., DENNIS, J. S., HOWE, C. J., SCOTT, S. A. and SMITH, A. G. (2010) Life‐Cycle Assessment of Potential Algal Biodiesel Production in the United Kingdom: A Comparison of Raceways and Air‐Lift Tubular Bioreactors. Energy & Fuels, 100‐112.

AQUAFUEL FP7 – 241301‐2
Coordination Action
FP7‐ENERGY‐2009‐1
86
TREDICI, M. R. (2010) Photobiology of microalgae mass cultures: understanding the tools for the next green revolution. Biofuels, 1, 143‐162.
TROELL, M., HALLING, C., NILSSON, A., BUSCHMANN, A. H., KAUTSKY, N. and KAUTSKY, L. (1997) Integrated marine cultivation of Gracilaria chilensis (Gracilariales, Rhodophyta) and salmon cages for reduced environmental impact and increased economic output. Aquaculture, 156, 45‐61.
VAN EGMOND, K., BRESSER, T. and BOUWMAN, L. (2002) The European Nitrogen Case. AMBIO: A Journal of the Human Environment, 31, 72‐78.
VEA, J. and ASK, E. (2010) Creating a sustainable commercial harvest of Laminaria hyperborea, in Norway. Journal of Applied Phycology.
VIEIRA, V. V. (2010) Personal communication about LCA on Microalgae.
WANG, B., LI, Y., WU, N. and LAN, C. Q. (2008) CO2 bio‐mitigation using microalgae. Applied Microbiology and Biotechnology, 79, 707‐718.
XU, H., MIAO, X. and WU, Q. (2006) High quality biodiesel production from a microalga Chlorella protothecoides by heterotrophic growth in fermenters. Journal of Biotechnology, 126, 499‐507.
ZHANG, J., LIU, Y., YU, D., SONG, H., CUI, J. and LIU, T. (2011) Study on high‐temperature‐resistant and high‐yield Laminaria variety “Rongfu”. Journal of Applied Phycology.
ZHANG, Q., QU, S., CONG, Y., LUO, S. and TANG, X. (2008) High throughput culture and gametogenesis induction of Laminaria japonica gametophyte clones. Journal of Applied Phycology, 20, 205‐211.
AQUAFUEL FP7 – 241301‐2
Coordination Action
FP7‐ENERGY‐2009‐1
87
11. Annex 1: Heterotrophic Microalgae
Heterotrophic microalgae are grown in closed culture systems that are equivalent to
conventional fermentation technologies (Apt and Behrens, 1999). In these systems,
heterotrophic algae use organic Carbon as their sole source of energy and Carbon. This
removes the issue of light limitation that dominates most aspects of photobioreactor and
raceway pond design. However since heterotrophic microalgae are grown on organic
material that could itself be used for biofuel production, it is incorrect to view this as a
primary biomass production system. Heterotrophic cultivation of microalgae should be
viewed as an alternative technology platform for conversion of biomass into biofuels, which
can produce biodiesel from carbohydrate feedstocks. The fundamental design of
heterotrophic bioreactors consists of a closed vessel that contains algae and their nutrients in
optimal conditions to maximise productivity. Vessels can range in size from 1‐500,000 litres
and their shape is dictated by economic and structural factors, unlike photobioreactors which
must maximise their surface area for the penetration of light (Apt and Behrens, 1999). The
culture medium is similar to that used for photobioreactors, with nutrients such as Nitrogen
and Phosphorous added in the correct proportions for the specific algal strain. However
heterotrophic bioreactors also introduce carbohydrates into the culture medium. Typical
carbohydrates that are used as a substrate for heterotrophic microalgal growth can be
glucose, acetate or corn powder hydrosylate (Xu, et al., 2006). Sterile air is introduced into
the culture medium at high pressure and flow rate to ensure appropriate gas exchange and
optimal conditions are maintained by constant monitoring and control of temperature, pH
and dissolved O2 and CO2 within the culture medium (Apt and Behrens, 1999).
It is possible to cultivate heterotrophic microalgae in either batch‐based or continuous
culture systems. Batch based systems provide a fixed amount of culture medium and organic
substrate to grow a batch of microalgae, which are completely harvested after a fixed period.
The major challenge of batch cultivation is to provide sufficient supply of nutrients and
substrate to ensure high cell density, without exceeding concentrations that inhibit algal
growth (Chen, 1996). This issue can be addressed using fed‐batch cultivation, which introduces
culture medium and substrate in response to demand signals such as increased oxygen
tension (Graverholt and Eriksen, 2007). Continuous culture of heterotrophic algae is usually

AQUAFUEL FP7 – 241301‐2
Coordination Action
FP7‐ENERGY‐2009‐1
88
performed in a chemostat, where fresh medium is introduced at the same rate as the culture
is harvested (Chen and Johns, 1996). This maintains the culture volume and cell concentration
at a steady state to optimise productivity. Alternative continuous culture systems include
membrane bioreactors. These are essentially the same as chemostat cultures apart from the
addition of a selectively permeable membrane that retains algae in the main vessel while
allowing some culture medium to wash through (Chen and Johns, 1995). This prevents
inhibitory compounds such as sodium from accumulating and reducing the stability of the
culture (Chen, 1996).

AQUAFUEL FP7 – 241301‐2
Coordination Action
FP7‐ENERGY‐2009‐1
89
12. Annex 2: Review of existing micro algae LCA Studies
12.1 Kadam 2001/2
Kadam (2001; 2002) compared a a conventional coal‐fired power station with one in which
coal was co‐fired with algae cultivated from recycling power plant flue gas as a source of CO2.
The system is based in the southern USA, where there is a high incidence of solar radiation.
12.1.2 Functional Unit and System Boundaries
The functional unit considered was the quantity of coal and algae necessary to produce 1
MW of electricity. The system boundaries are shown in Figure 10.1
Figure 10.1: General system boundaries for the comparison of electricity production
via coal firing vs. coal/algae co‐firing in Kadam’s study
Source: (Kadam, 2002)
12.1.3 Source of Data
Primary data was used where possible for algae cultivation, while the US EPA and literature
data was used for the other processes. According to Kadam’s own analysis, the data was

AQUAFUEL FP7 – 241301‐2
Coordination Action
FP7‐ENERGY‐2009‐1
90
reliable and complete at the time of writing. The system was run using TEAM® (v 3.0)
software.
12.1.4 Process
The algae cultivation was assumed to take up 1000 ha, using approximately 60% of the
emitted CO2 of a 50MW plant. Two potential pathways were investigated: direct injection of
the flue gas, and monoethanolamine (MEA) extraction. The former process includes
compression, dehydration and transportation of the CO2 to the algal ponds, with a final
concentration of 14%. The latter process includes MEA extraction, compression, dehydration
and transportation, and produces a final concentration of almost 100%. Marine water was
provided as the water supply.
The microalgae production system is shown in 10.2. Algae was grown in raceway ponds,
and used solar drying to achieve a biomass that could be used for co‐firing.
Figure 10.2: Simplified flow diagram for microalgae production in Kadam’s study
Source: (Kadam, 2002)

AQUAFUEL FP7 – 241301‐2
Coordination Action
FP7‐ENERGY‐2009‐1
91
12.1.5 Results
Four impact assessment categories were evaluated: greenhouse warming potential,
depletion of natural resources, air acidification potential, and eutrophication potential. Algae
co‐firing was shown to have lower greenhouse potential than a coal fired power plant, as well
as a lower air acidification potential. The CO2 emitted was lower, as well as the SOx and NOx,
particulates, methane, and the fossil energy consumption. However, the depletion of natural
resources (more gas and oil is necessary) and eutrophication potential (due to the fertilizer)
was much higher for algae co‐firing. As such, any final decision on the usefulness of algae co‐
firing would have to find the correct balance between these factors (Kadam, 2001; 2002).
12.1.6 Discussion
This study does not focus on algae for biofuels, but does provide a useful look at possible
linkages that could be formed between algae production and industry – especially in the use
of using flue gas from power stations to grow algae.
Many of the individual assumptions in this study have been called into question (such as
productivity values) (Benemann, 2010b), while the use of solar drying remains a large
question, as it may not be possible (certainly not in all parts of the world) and experts agree
that it probably won’t be feasible in large scale processes (Sander & Murthy, 2010; Clarens,
2010b). Dewatering was not shown to be a large factor in the design, even though other
studies show that it is.
Also, the study discusses the eutrophication potential, but unlike agriculture, algae
cultivation is done under controlled circumstances which limit the possibility of a run‐off (Leu,
2010).
12.2 Lardon et al. 2009
Lardon et al. (2009) state that since this LCA is not based upon actual systems, it should be
used more to identify possible bottlenecks and:
“The key objective of this study is not to offer a LCA of the current microalgal biodiesel
technology, but to identify the obstacles and limitations which should receive specific research
efforts to make this process environmentally sustainable.”
No specific location was used as a basis for this study.

AQUAFUEL FP7 – 241301‐2
Coordination Action
FP7‐ENERGY‐2009‐1
92
12.2.2 Functional Unit and System Boundaries
The functional unit was the combustion of 1MJ of fuel in a diesel engine (assumed to act
the same way as other biofuels), and the boundaries included the extraction and production
of raw materials, facility construction (assuming a 30 year lifespan of buildings, 10 years for
electrical engines, etc), and biofuel elaboration and use in the engine.
12.2.3 Source of Data
Due to the lack of large scale commercial algae producers, the data was extrapolated from
laboratory scale experiments. The data was collected from industrial partners, inventory data
of similar processes, the EcoInvent database and literature reviews.
The required nitrogen inputs, as well as the heating value of the oil were calculated based
upon the algae composition, and standard practices from pilot scale systems were adapted as
necessary to fit the larger system (i.e. centrifugation works well on small scale but is too
expensive for larger scales).
12.2.4 Process
The hypothetical system is shown in 10.3, and consists of an open pond raceway system
covering 100ha, using Chlorella vulgaris. Two methods of operation were considered: normal
levels of Nitrogen, and low N fed to the system. Harvesting is done by use of continuous
circulation of the algae through a thickener, and then the flocculated stream is dewatered.
Two methods of oil extraction were evaluated, namely: advanced drying followed by hexane
extraction (as used for soybeans) (dry), or direct extraction from the wet algal paste (wet).

AQUAFUEL FP7 – 241301‐2
Coordination Action
FP7‐ENERGY‐2009‐1
93
Figure 10.3: Process chain overview from Lardon’s study
Source: (Lardon et al., 2009)
12.2.5 Results
The LCI was done without any allocation, but reflects the actual flows in the process chain,
as shown in Table 10.1. A cumulative energy analysis was performed to find the cumulative
energy demand (CED), which showed that only the wet extraction on low‐N grown algae has a
positive balance. Reducing the amount of nitrogen fed to the system improves the CED by 60%
(due to the lower fertilizer requirements), whereas wet extraction only increases the CED by
25% (since it needs larger production due to the lower extraction yield).

AQUAFUEL FP7 – 241301‐2
Coordination Action
FP7‐ENERGY‐2009‐1
94
Table 10.1: Most important material and energy flows generated by the production
of 1kg of biodiesel from Lardon et al’s study
Normal Low N
Dry Wet Dry Wet
Algae culture and harvesting
Algae (kg) 5.93 8.39 2.7 3.81
CO2 (kg) 10.4 14.8 5.32 7.52
Electricity (MJ) 7.5 10.6 4 5.7
CaNO3, as g N 273 386 29.4 41.6
Drying
Heat (MJ) 81.8 37.1
Electricity (MJ) 8.52 3.9
Oil extraction
Heat (MJ) 7.1 22.4 3.2 10.2
Electricity (MJ) 1.5 8.4 0.7 3.9
Hexane loss (g) 15.2 55 6.9 25
Oil transesterification
Methanol (g) 114 114 114 114
Heat (MJ) 0.9 0.9 0.9 0.9
Total Energy
Consumption (MJ) 106.4 41.4 48.9 19.8
Production (MJ) 103.8 146.8 61 86
Balance (MJ) ‐2.6 105 12 66
Source: (Lardon et al., 2009)
The impact analysis was done and focused on: abiotic depletion (AbD), potential
acidification (Ac), eutrophication (Eu), global warming potential (GWP100 (time horizon 100
years)), ozone layer depletion (Ozone), human (HumTox) and marine (Mar Tox) toxicity, land
competition (Land), ionizing radiations (Rad) and photochemical oxidation (Photo). The results
are shown in 10.4.
Algae was compared to other biofuels, and shown to be better for eutrophication, and land
use, but worse for ionizing radiation, photochemical oxidation and marine toxicity. The energy

AQUAFUEL FP7 – 241301‐2
Coordination Action
FP7‐ENERGY‐2009‐1
95
demand is also shown to be highly dependent on the process used, which should be kept in
mind for future designs (Lardon et al., 2009).
Figure 10.4: Comparison of impacts categories in Lardon et al ’s study
Source: (Lardon et al., 2009)
12.2.6 Discussion
This study clearly shows that drying is one of the most energy intensive steps. It
demonstrates what a difference in nutrient supply would mean to the final outcome, as well
as some of the different possibilities in downstream processing of the algal biomass. However,
experts have been critical about this study, since many of the values were based on pilot scale
systems, and would not be wholly applicable to industrial cultivation (Leu, 2010).
12.3 Clarens et.al. (2010)
In this study, the life cycle of the cultivation of algae was compared to corn, switch grass
and canola. The study was based in Virginia, Iowa and California in the US, each of which have
different levels of solar radiation and water availability.
12.3.2 Functional Unit and System Boundaries
The functional unit was 317 GJ, equivalent to the approximate per capita primary energy
consumption of one American.

AQUAFUEL FP7 – 241301‐2
Coordination Action
FP7‐ENERGY‐2009‐1
96
The system was limited to cultivation and harvesting only, with the final product being dry
biomass. It was assumed that the biomass was burned directly so the higher heating value
(HHV) was used to calculate the energy obtained. This was done because of the uncertainties
surrounding the choice of conversion process and the final product (electricity vs. liquid fuels).
The manufacture of the equipment used was considered negligible and not included.
12.3.3 Source of Data
Data was collected from previously published pilot‐scale demonstration projects, climactic
records, the EcoInvent database, and various other sources (as far as possible based in the
United States), and input using the Crystal Ball® predictive modelling suite. For example, the
dry biomass yields were calculated based upon radiation and meteorological data for the last
30 years, as well as empirical estimates for the radiation use efficiency (RUE).
12.3.4 Process
The chosen cultivation method for the algae was open raceways with paddle wheels for
mixing, with harvesting done by flocculation and centrifugation. Three different types of
wastewater effluent were considered as nutrient sources: activated sludge, source‐separated
urine, and biological nitrogen removal. The process, as well as those of the other feedstocks
considered, is shown in Figure 10.5.

AQUAFUEL FP7 – 241301‐2
Coordination Action
FP7‐ENERGY‐2009‐1
97
Figure 10.5: Schematic of system considered in Clarens study
Source: (Clarens et al., 2010)
12.3.5 Results
The output of the model was five impact categories: energy consumption (MJ), water use
(m3), greenhouse gas emissions (kg CO2 equivalent), land use (ha), and eutrophication (kg PO4
eq.). Algae cultivation was found to emit more GHG’s than it sequesters, requiring more fossil‐
based carbon to produce the same amount of bioenergy, while corn, canola and switch grass
had a net uptake of CO2. Water use for algae was also considerably higher than the others.
Energy production is positive for all of the studied biofuels in that they generate more energy
than they consume. Algae was however approximately 3.3–5 times more efficient in the land
use than the competitors. It is calculated that it would only require 13% of the USA’s land area
to meet the country’s total energy needs. The eutrophication (calculated on the basis of any

AQUAFUEL FP7 – 241301‐2
Coordination Action
FP7‐ENERGY‐2009‐1
98
potential leakages/spillages and any contributions from fertilizers) was also considerably lower
for algae. The values of a system based in Virginia, USA, are shown in Table 10.2.
Table 10.2: Life cycle burdens of Algae, Corn, Canola, and Switch grass in Virginia
Land (ha)
Energy (MJ)
x 104
GHG (kg CO2
equiv.) x 104
Water (m3)
x 104
Eutrophication
(kg PO4 equiv)
Algae 0.4 ± 0.05 30 ± 6.6 1.8 ± 0.58 12 ± 2.4 3.3 ± 0.86
Corn 1.3 ± 0.3 3.8 ± 0.35 ‐ 2.6 ± 0.09 0.82 ± 0.19 26 ± 5.4
Canola 2.0 ± 0.2 7.0 ± 0.83 ‐ 1.6 ± 0.10 1.0 ± 0.14 28 ± 5.8
Switch grass 1.7 ± 0.4 2.9 ± 0.27 ‐ 2.4 ± 0.18 0.57 ± 0.21 6.1 ± 1.7
Source: (Clarens et al., 2010)
Sunlight and water availability was not shown to have such a large impact on the final
outcome (California, as the sunniest was shown to have a slightly lower land requirement than
the other places, but a slightly higher energy requirement). The principle burden of algae
cultivation is the fertilizers (about 50% of energy use and GHG emissions).
The potential of co‐firing with coal power plants, as Kadam suggested, could provide large
reduction in the GHG, but would require large scale cultivation, which would increase the
fertilizer demand such that it would still be larger than that of corn, canola, or switch grass.
Using wastewater to supplant the need for chemical fertilizers (as well as water use)
substantially reduced the environmental impact of algae cultivation as well as the treatment of
the wastewater itself (meaning there is incentive for both algae producers and wastewater
treatment plants to work together) (Clarens et al., 2010).
12.3.6 Discussion
This is one of the more widely known LCA studies on algae, so there has been more
discussion surrounding it. Criticisms were made of the paper by Subhadra (2010), Benemann
(2010b) and others, including:
• The rationale of using Radiation Use Efficiency (RUE) instead of the absolute bio‐
productivity is not clear;
• The choice of functional unit (1MJ of algae biomass is not equivalent to 1MJ of switch
grass biomass as the former can be more easily converted to biofuels);
• The age of the data;

AQUAFUEL FP7 – 241301‐2
Coordination Action
FP7‐ENERGY‐2009‐1
99
• High fertilizer energy input as compared to other studies, as well as high cost
estimation of CO2 usage;
• Clarens et al. assumed that photobioreactors would not give a better land footprint,
but would give a higher life cycle burden – these assumptions were not fully justified
in his study;
• As with Kadam (2001), the eutrophication potential is limited in algae production as it
is a controlled, closed system;
• The manufacturing burdens should decrease in the future as electricity, the
manufacturing process, and the know how all becomes better and more
environmentally sustainable; and,
• The LCA performed does not take a holistic view of the system, but views each factor
as mutually exclusive (i.e. not taking into account that algae can produce co‐products,
etc.).
Subhadra (2010) concludes by stating:
“The investors are eagerly reviewing the feasibility status of various feedstocks, so studies
such as this are crucial. However, defining a comprehensive LCA boundary with an integrated
account of indirect GHG emission, energetic costs, and other sustainability indexes would yield
more meaningful comparisons”.
Clarens (2010a) responded to these criticisms by stating that although the actual system
boundaries used can be disputed, overall is should not make a great difference to the final
result. He justifies not including the co‐products in his LCA because of the varied nature and
amount of these co‐products, which would not fit in with the generic LCA performed. He
justifies the data by saying he updated it as necessary, as well as only focusing on existing,
rather than emerging technologies which could be more sustainable. He defends the choice of
open ponds over PBRs by claiming (as others have done) that PBRs are not yet commercially
viable. The eutrophication potential is calculated on the basis of the possibility of a leakage
from the closed system, not from continuous run‐off. Finally, he states that individual aspects
would not alter the overall outcome of the LCA, as shown by sensitivity analysis that he
performed in the LCA.
This study does not paint algae in the most positive light (as other biofuels are considered
more sustainable), but has received a lot of attention in the media, especially when taken out
of context. This could be damaging to the industry as a whole (Greenwell, 2010).

AQUAFUEL FP7 – 241301‐2
Coordination Action
FP7‐ENERGY‐2009‐1
100
12.4 Jorquera et.al. (2010)
The aim of this study was to compare the energy life‐cycle of the production of oil rich
microalgae, using the net energy ratio (NER) as a comparison factor, where NER is given as:
(Eqn 1.)
The study did not look at the final GHG emissions, only at the energy requirements. No
specific location was used for the study.
12.4.2 Functional Unit and System Boundaries
The functional unit was a production level of 100,000 kg of biomass (dry weight) produced
under various production methods. The assessment was performed using the GaBi® software,
which estimates the output of a particular process (in this case biomass produced and energy
generated) from the input of the energy costs associated with each process (i.e. the price of
raw materials, transportation, and equipment used).
Each systems unit (shown in Figure 10.6) was considered to be made up of the raw
materials required, the transport, and the manufacturing of the equipment. The inoculation
steps, oil extraction, and conversion to biofuels were not considered.
Figure 10.6: System Process in Jorquera’s study
Source: (Jorquera et al 2010). The red line indicates the system boundary

AQUAFUEL FP7 – 241301‐2
Coordination Action
FP7‐ENERGY‐2009‐1
101
12.4.3 Results
The results of the analysis are shown Table 10.3.
Table 10.3: Comparative analysis of three cultivation methods from Jorquera’s study
Variable Raceway Ponds Flat‐plate PBR Tubular PBR
Annual biomass production (kg/yr) 100,000 100,000 100,000
Volumetric productivity (kg / m3 day) 0.035 0.27 0.56
Space required (m2) 25,988.25 10,147.00 10,763.20
Reactor volume (m3) 7,827.79 1,014.71 489.24
Flow rate to maintain dilatation rate (m3 / day) 782.79 101.47 48.9
Relative oil content (%) 29.6 29.6 29.6
Net oil yield (m3 / yr) 32.9 32.9 32.9
Oil yield per area (m3 / ha year) 12.65 31.6 30.56
Energy consumption (W / m3) 3.72 53 2500
Energy consumption (W) 29,119.37 53,779.80 1,223,091.98
Total energy consumption (KWh / months) 8,735.81 16,133.94 366,927.6
Total energy consumption (GJ / year) 378.45 698.94 15,895.8
Total energy content in biomass (GJ / year) 3,155.30 3,155.30 3,155.30
NER for oil production 3.05 1.65 0.07
NER for biomass production 8.34 4.51 0.20
Source: (Jorquera et al., 2010)
Due to evaporation, the water consumption for raceway ponds is more than 16 times
higher than tubular PBRs, and 7 times higher than flat plate. The productivity and biomass
concentration is also significantly higher in the PBR systems, while the land requirements are
lower. However, the energy requirement, and final NER is quite a bit lower for raceway ponds,
as well as the construction and materials costs.
The results indicate that raceway and flat‐plate PBR systems had a NER > 1, and are
therefore economically viable. However, since the extraction and conversion was not included,
this could significantly add to the costs and energy requirements. It is clear from this study
that tubular PBR systems are not currently feasible at a large scale (Jorquera et al., 2010).
12.4.4 Discussion
This is a relatively unknown study, and quite limited in its scope. A major flaw of this study
is that it only focuses on the cultivation, and only looks at the energetics without due
consideration of the GHG emissions, economics, etc. As the other studies show, harvesting is a

AQUAFUEL FP7 – 241301‐2
Coordination Action
FP7‐ENERGY‐2009‐1
102
major component of the final energy balance, and the overall downstream processing will
have a large impact on the final energy consumption.
It shows the comparative land requirements to produce the same amount of biomass for
the three systems (showing how raceway ponds would need almost 2.5 times more land than
PBR systems). However, the data was based on pilot scale information, so does not take into
account the economies of scale.
12.5 Sander& Murthy (2010)
This was a well‐to‐pump study, done to determine the overall sustainability of algae biodiesel.
The objective of the study is given:
“Understanding the environmental burdens of the algal biodiesel production will allow
insight into inherent sustainability. Information from this LCA will be useful in identifying
energy and emission bottlenecks in the process. This information can be used to provide
impetus for further technological advancement of algal biodiesel and reduce overall energy
use and environmental impact of a future algal biodiesel process” (Sander & Murthy, 2010).
Since a lot of the data was based in the US, it is assumed that that is the location of the
study.
12.5.2 Functional Unit and System Boundaries
The functional unit was 1,000 MJ energy from algal biodiesel using existing technology
(which is equivalent to 24kg of algal biodiesel).
The system boundaries were determined by the RMEE protocol, discussed earlier, using a
cut off ratio of 5%, and shown in Figure 10.7.
This LCA deals with co‐product allocation by using the system expansion method. It
assumes that the carbohydrate and protein in the algal biomass will be used as feedstock for
ethanol conversion process, and by doing so, offset currently used feedstock (corn). It is
assumed to have the same ethanol yield as wheat straw due to the similar glucan content.
12.5.3 Source of Data
Data was gathered from the Greenhouse Gases, Regulated Emissions and Energy use in
Transportation (GREET) model, the US LCI database, as well as the 1998 Sheehan et al. report
and a 1988 Borowitzka & Borowitzka paper for information from the growth to separation
stage, as well as a few other specialized papers.

AQUAFUEL FP7 – 241301‐2
Coordination Action
FP7‐ENERGY‐2009‐1
103
12.5.4 Process
The process was based on the current state of the art technology upon which it is assumed
future systems will base themselves on. The process starts with inoculum grown in PBRs,
which is then transferred to an open pond raceway. Treated wastewater is the given medium,
presumed to provide all the necessary nutrients except for carbon, which is provided
separately (flue gas sparging is not considered in this study). Separation and dewatering then
occurs, with two methods considered: filtration and centrifugation. The final steps are hexane
extraction, with the resulting transesterification occurring at a different site and following the
same method as previously reported soybean conversion to biodiesel. Finally, the biodiesel is
transported to the pump, as described by the GREET model. The process diagram is given in
.
12.5.5 Results
The energy requirements and emissions for each step are given in Error! Reference source
not found.. It is clear that using a centrifuge requires more energy, while the most energy and
GHG emission intensive step is that of harvesting. Natural gas drying of the algal cake requires
69% of the total energy input – solar drying can significantly reduce this but is impractical at a
large scale and is not suitable for all climates. It is clear to see that the downstream processes
are important for the final sustainability of the system, and improvements must be made to
enhance the performance of algae as biofuels (Sander & Murthy, 2010).

AQUAFUEL FP7 – 241301‐2
Coordination Action
FP7‐ENERGY‐2009‐1
104
Figure 10.7: Process flow diagram from Sander & Murthy’s study
Source: (Sander & Murthy, 2010)

AQUAFUEL FP7 – 241301‐2
Coordination Action
FP7‐ENERGY‐2009‐1
105
Figure 10.8: Energy and Emissions associated with unit process in Sander &
Murthy’s study
Source: (Sander & Murthy, 2010)

AQUAFUEL FP7 – 241301‐2
Coordination Action
FP7‐ENERGY‐2009‐1
106
12.5.6 Discussion
One of the strengths of the Sander & Murthy (2010) study was a detailed overview of
where they obtained their data values from, as well as a systematic approach to defining the
system boundaries. They clearly indicated what values were used, and described the
limitations and changes they made to the data. However, as with the other studies discussed,
a major issue is the validity of the assumptions used (some of the papers are 22 years old, and
the data from the LCI databases are not specialized for algae cultivation).
12.6 Stephenson et.al. (2010)
This study is a well‐to‐pump analysis, with sensitivity analysis on various operating parameters
included. The basis of the study is in the UK, which has lower solar radiation than the other
papers considered.
12.6.2 Functional Unit and System Boundaries
The functional unit of this system was 1 ton of biodiesel, blended with conventional diesel
for a use in a compact sized car.
The boundaries include all the background systems, or homogenous markets, providing the
materials and energy to the main process. It was assumed that the land used would be
derelict, so there would be no system that the algae cultivation is replacing. The lifetime of the
equipment was assumed to be 20 years, and maintenance impacts were considered negligible.
By‐products of the system include algal residue, glycerol and potassium phosphate. The
algal residue is assumed to be anaerobically digested onsite to generate methane and satisfy
the heating requirements of the process, with excess sent to generate electricity. In this case,
direct substitution for the electricity was used. The glycerol can be used by the pharmaceutical
industry, using the market price as an allocation method. Another possibility is using it for the
generation of heat, where direct substitution could be used. The last by‐product is relatively
small in quantity, so the market price was used as an allocation method.
AQUAFUEL FP7 – 241301‐2
Coordination Action
FP7‐ENERGY‐2009‐1
107
12.6.3 Source of Data
Certain assumptions were made based on commercial and pilot scale systems currently in
use, as well as previous experience of the authors in growing algae. Other values were
obtained from literature.
12.6.4 Process
The basic system is shown in Figure 10.9. Two systems were considered, a raceway pond
and an air‐lift tubular PBR. For each system, there were two stages of production – the first
stage under a nutrient‐sufficient environment to achieve a dense culture, and a second stage
with no nitrogen supply to increase the triacylglycerides (TAG) content of the culture to
approximately 40%. Once cultivated, the algae is dewatered by flocculants (using Aluminium
Sulphate), with the spent medium returned to the cultivation. The biomass then undergoes
homogenization to break open the cells, and the lipids are extracted using hexane. This would
then be refined using the same method to recover rapeseed oil, before being transported to a
facility to convert it, via transesterification, to biodiesel, which is then transported for final use
in a car. It is assumed that the conversion to biodiesel occurs in a pre‐existing plant (previously
described in other papers) that can produce 250,000 tons of biodiesel per year. The aqueous
waste stream would be anaerobically digested to convert it into methane.
Various modifications to this system were considered. These include altering some of the
operating parameters, the TAG content, and changing the mode and distance of transport
required between process units.

AQUAFUEL FP7 – 241301‐2
Coordination Action
FP7‐ENERGY‐2009‐1
108
Figure 10.9: Process chain for production of 1 ton biodiesel in Stephenson et al’s
study
Source: (Stephenson et al., 2010)
12.6.5 Results
The results of the base case are shown in Figure 10.10. It is clear that tubular PBR requires
more energy, and as such has a higher Global Warming Potential (GWP). Compared to fossil‐
derived diesel, the energy requirements and GWP are 85 and 78% lower respectively for
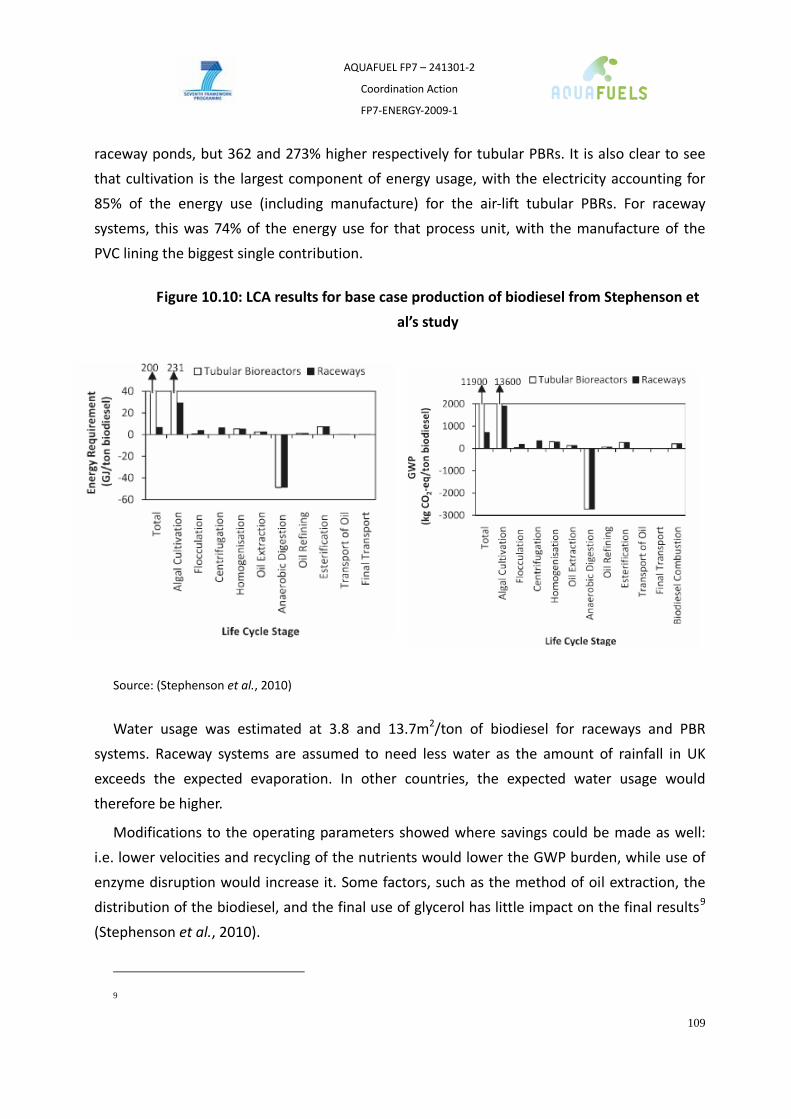
AQUAFUEL FP7 – 241301‐2
Coordination Action
FP7‐ENERGY‐2009‐1
109
raceway ponds, but 362 and 273% higher respectively for tubular PBRs. It is also clear to see
that cultivation is the largest component of energy usage, with the electricity accounting for
85% of the energy use (including manufacture) for the air‐lift tubular PBRs. For raceway
systems, this was 74% of the energy use for that process unit, with the manufacture of the
PVC lining the biggest single contribution.
Figure 10.10: LCA results for base case production of biodiesel from Stephenson et
al’s study
Source: (Stephenson et al., 2010)
Water usage was estimated at 3.8 and 13.7m2/ton of biodiesel for raceways and PBR
systems. Raceway systems are assumed to need less water as the amount of rainfall in UK
exceeds the expected evaporation. In other countries, the expected water usage would
therefore be higher.
Modifications to the operating parameters showed where savings could be made as well:
i.e. lower velocities and recycling of the nutrients would lower the GWP burden, while use of
enzyme disruption would increase it. Some factors, such as the method of oil extraction, the
distribution of the biodiesel, and the final use of glycerol has little impact on the final results9
(Stephenson et al., 2010).
9
AQUAFUEL FP7 – 241301‐2
Coordination Action
FP7‐ENERGY‐2009‐1
110
12.6.6 Discussion
This system is localized for the UK, which gives a better view of the country impacts on the
algae growth (i.e. the water usage). This differs from other studies, which tended to focus
more on sunnier climates and areas of less rainfall. This was the only study to focus on some
of the possible operating parameters that could be improved upon (although there are many
more to be considered), which is useful for future considerations of the design of a facility.
This was also the only study which used primary data for the system, but limited the pond size
to 100m2, which limits the final outcome. However, it did mean that the assumptions were
based more firmly on what is possible rather than hypothetical, and many of the experts
consulted agree that this study uses more valid assumptions (Benemann, 2010b; Greenwell,
2010).
12.7 Campbell et.al. (2010)
This study looked at the environmental impacts of growing algae in ponds. The location of this
study was in Australia, which has a high solar incidence, but limited fresh water supply.
12.7.2 Functional Unit and System Boundaries
The functional unit was the “the combustion of enough fuel in an articulated truck (AT; the
most common form of freight transport in Australia) diesel engine to transport one tonne of
freight one kilometre, i.e. a tonne kilometre (t km or tkm). This has previously been calculated
to require the equivalent of 0.89 MJ of diesel fuel, which is 23.057 ml of ULS diesel” (Campbell
et al., 2010).
The system boundaries exclude the production facilities and construction, partly because
detailed information about all the subsystems is not yet readily available (and is also rarely
considered in analysis of fossil fuels). For the rest, the study looks to do a complete cradle to
grave analysis, with the waste algal biomass used to generate methane.
12.7.3 Source of Data
The data for the system was gathered from literature, and is mainly based on the 1996
Benemann and Oswald paper, as well as a paper in 1983 by Regan and Gartside (outlining the
design). Other literature, as well as the Australian LCI and the relevant Australian authorities
(such as the department of energy), were consulted for details and updating of the system. If
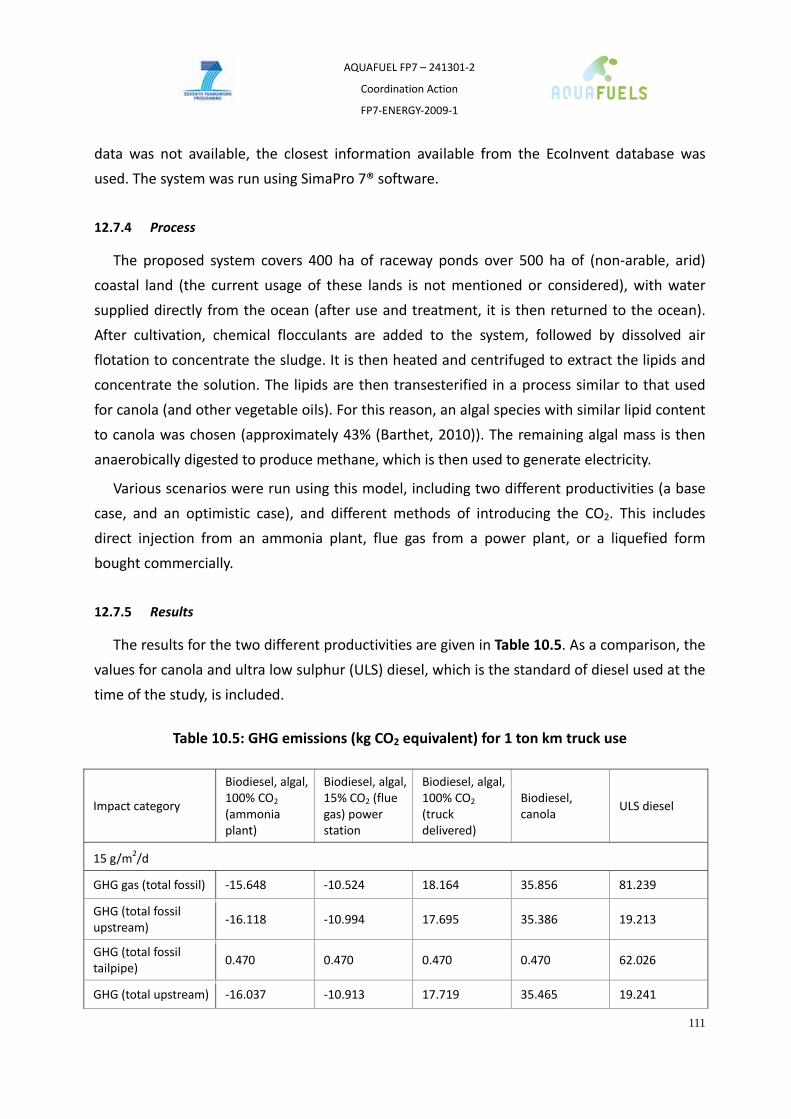
AQUAFUEL FP7 – 241301‐2
Coordination Action
FP7‐ENERGY‐2009‐1
111
data was not available, the closest information available from the EcoInvent database was
used. The system was run using SimaPro 7® software.
12.7.4 Process
The proposed system covers 400 ha of raceway ponds over 500 ha of (non‐arable, arid)
coastal land (the current usage of these lands is not mentioned or considered), with water
supplied directly from the ocean (after use and treatment, it is then returned to the ocean).
After cultivation, chemical flocculants are added to the system, followed by dissolved air
flotation to concentrate the sludge. It is then heated and centrifuged to extract the lipids and
concentrate the solution. The lipids are then transesterified in a process similar to that used
for canola (and other vegetable oils). For this reason, an algal species with similar lipid content
to canola was chosen (approximately 43% (Barthet, 2010)). The remaining algal mass is then
anaerobically digested to produce methane, which is then used to generate electricity.
Various scenarios were run using this model, including two different productivities (a base
case, and an optimistic case), and different methods of introducing the CO2. This includes
direct injection from an ammonia plant, flue gas from a power plant, or a liquefied form
bought commercially.
12.7.5 Results
The results for the two different productivities are given in Table 10.5. As a comparison, the
values for canola and ultra low sulphur (ULS) diesel, which is the standard of diesel used at the
time of the study, is included.
Table 10.5: GHG emissions (kg CO2 equivalent) for 1 ton km truck use
Impact category
Biodiesel, algal, 100% CO2 (ammonia plant)
Biodiesel, algal, 15% CO2 (flue gas) power station
Biodiesel, algal, 100% CO2 (truck delivered)
Biodiesel, canola
ULS diesel
15 g/m2/d
GHG gas (total fossil) ‐15.648 ‐10.524 18.164 35.856 81.239
GHG (total fossil upstream)
‐16.118 ‐10.994 17.695 35.386 19.213
GHG (total fossil tailpipe)
0.470 0.470 0.470 0.470 62.026
GHG (total upstream) ‐16.037 ‐10.913 17.719 35.465 19.241

AQUAFUEL FP7 – 241301‐2
Coordination Action
FP7‐ENERGY‐2009‐1
112
GHG (total tailpipe) 62.028 62.028 62.028 62.028 62.026
GHG ‐ CO2 (fossil upstream)
‐16.742 ‐11.477 16.594 33.437 18.040
GHG ‐ CO2 (fossil tailpipe)
0.001 0.001 0.001 0.001 61.557
GHG ‐ CH4 (total) 0.102 ‐0.033 0.364 0.984 1.156
CHG ‐ N20 (total) 0.990 0.984 1.138 1.431 0.486
GHG ‐ CO2 (total upstream)
‐16.689 ‐11.562 16.470 33.659 18.047
GHG ‐ CO2 (total tailpipe)
61.559 61.559 61.559 61.559 61.557
GHG ‐ other (total) 0.001 0.001 0.068 0.004 0.000
Total cost (Aus �) 4.3 3.9 4.8 4.2 3.8
30 g/m2/d
GHG gas (total fossil) ‐27.560 ‐23.019 8.298 35.856 81.239
GHG (total fossil upstream)
‐28.030 ‐23.489 7.828 35.386 19.213
GHG (total fossil tailpipe)
0.470 0.470 0.470 0.470 62.026
GHG (total upstream) ‐27.949 ‐23.408 7.852 35.465 19.241
GHG (total tailpipe) 62.028 62.028 62.028 62.028 62.026
GHG ‐ CO2 (fossil upstream)
‐28.563 ‐23.797 6.861 33.437 18.040
GHG ‐ CO2 (fossil tailpipe)
0.001 0.001 0.001 0.001 61.557
GHG ‐ CH4 (total) 0.030 ‐0.181 0.250 0.984 1.156
CHG ‐ N20 (total) 0.971 0.957 1.117 1.431 0.486
GHG ‐ CO2 (total upstream)
‐28.547 ‐23.987 6.657 33.659 18.047
GHG ‐ CO2 (total tailpipe)
61.559 61.559 61.559 61.559 61.557
GHG ‐ other (total) 0.001 0.001 0.068 0.004 0.000
Total cost (Aus �) 2.8 2.2 3.0 4.2 3.8
Source: Campbell et al 2010

AQUAFUEL FP7 – 241301‐2
Coordination Action
FP7‐ENERGY‐2009‐1
113
Note: Fossil emissions are from the combustion of fossil fuels and add extra GHG to the
atmosphere. Non‐fossil emissions are those that come from burning biomass, and are simply
releasing Carbon that had been previously fixed by the biomass – as such they add no new
Carbon to the atmosphere. Upstream emissions are those released during processing, while
tailpipe emissions come from combustion in the truck.
The negative emissions are because the biomass is anaerobically digested to produce
methane, then electricity, directly substituting electricity generation from other sources. The
results show that biodiesel from algae is better than canola and standard diesel, with savings
between 63.1 and 108.8 g / ton / km to ULS possible.
The study also looked at the economic considerations, although this is rife with uncertainty
(due to changing fuel prices, possible tax exemptions, changing landscape of the legislation,
etc.). The amortization rate was given at 15%, with the capital costs accounting for 43‐64% of
the annual operating costs. The conclusion is that under the right conditions, biodiesel from
algae is economically and sustainably feasible.
12.7.6 Discussion
This is the only other LCA study (other than Kadam) that uses marine water (fresh water is
scarce in Australia). However, a major disadvantage is that the environmental considerations
of desalinating and then treating this water are not considered (Greenwell, 2010). The study is
specific to Australia, as it has the distinct advantages of receiving more sun than other
countries, while also having more land available for such facilities without a big impact on
biodiversity.
Although the economic considerations are very basic calculations, with the assumptions
subject to change, it does give a favourable view of the economic feasibility of algae under the
right conditions, and is the only study to look at this aspect as well as the technical side.

AQUAFUEL FP7 – 241301‐2
Coordination Action
FP7‐ENERGY‐2009‐1
114
13. Annex 3: Expert Stakeholders participating in this study
Name Association Position and experience Type of response
John Benemann
Benemann Associates, USA
Researcher – formerly with the NREL, many years of experience in algae
Personal communication and completed questionnaire
Tomas Branyik1
Institute of Chemical Technology, Czech Republic
Researcher – current projects include bioethanol from algae
Completed life cycle inventory spreadsheet
Andres Clarens University of Virginia, USA
Researcher – lead author of a recent LCA study Completed questionnaire
Chris Greenwell2
Durham University, UK
Researcher – previous work includes feasibility studies on algae, industry consultant, and various (EU) projects
Completed questionnaire
Diana Fonseca1 Necton – AlgaFuel, Portugal
Chemical Engineer ‐ has design and production experience with algae
Completed questionnaire
Stefan Leu Ben Gurion University, Israel
Researcher – experience with biotechnology and sustainability
Personal communication and discussion
Vitor Verdelho1
Necton – AlgaFuel, Portugal
R&D Manager at Necton with experience in microalgae biotechnology
Personal communication and discussion
Pierre‐Antoine Vernon1,2
European Biodiesel Board (EBB)
Project Manager – experience in lobbying for legislation with biofuels
Personal communication and discussion
1 Member of AquaFUELs 2 Member of EABA
AQUAFUEL FP7 – 241301‐2
Coordination Action
FP7‐ENERGY‐2009‐1
115
14. Annex 4: Questionnaire
Current LCA studies
We have identified only 7 major LCA studies that provide an overview of the energy balance
for algal biofuels (listed above)
• Please list any important studies that you think we have missed.
• Are you familiar with any of the studies, Do you have any concerns about their
credibility – and if so what are they?
• Do you think these LCA provide a good reflection of the merits of algal biofuels
o If yes – how could they be improved
o If no – why not?
Click here to enter text.
What, in your view, are the main strengths and weaknesses of LCA (for algae)?
Click here to enter text.
Algae for biofuels
Which production pathway (cultivation through to final conversion to biofuel) do you believe
is most likely to be commercial, and why? Should all the various production pathways be
considered in LCAs?
Click here to enter text.
Current LCA studies identify water consumption for algae cultivation to be an important issue,
and recommend using wastewater. Do you think this will help determine where algae biofuels
can be grown and which water source do you think has the greatest potential (i.e. fresh,
marine or waste)?
Click here to enter text.
• What other factors will determine where the production plants are located (what land
constraints are there in terms of proximity to a carbon, water, solar radiation source,
type of land)
Click here to enter text.

AQUAFUEL FP7 – 241301‐2
Coordination Action
FP7‐ENERGY‐2009‐1
116
What, in your view, are the most important technical challenges that have to be overcome for
successful commercial cultivation of algae for biofuels?
Click here to enter text.
LCA on algae
Is there currently a lack of good quality data and does this affect the overall reliability of a LCA
(current studies use theoretical data based on lab/pilot scale)?
• Are there currently too many unknowns to make LCA results useful for guiding
decisions?
Click here to enter text.
The inputs for current LCAs are estimated based on the composition of the algae – whereas
inefficiencies are more likely in scaled up production processes. Does this mean that current
studies too optimistic?
Click here to enter text.
Co‐products and services can improve the calculated sustainability of algae – how are these
best incorporated in LCA studies (i.e. if algae are concurrently used for wastewater treatment
and biofuel production)?
• Which are the most likely co‐products to be used and for what?
• Do you have a preferred method of allocation, and if so, why?
Click here to enter text.
“CO2 use by algal cultures is not CO2 sequestration – that comes from algal biofuels replacing
fossil fuels”. There is some debate about the carbon credits that can be assigned to algae
cultivation, with policy makers taking the position that carbon captured by algae growth is
later released anyway, so does not count as carbon sequestration. Under what circumstances
do you think CO2 credits for sequestration can be attributed to algal biofuels?
Click here to enter text.

AQUAFUEL FP7 – 241301‐2
Coordination Action
FP7‐ENERGY‐2009‐1
117
Different LCAs adopt different functional units, such as impacts per 1000MJ, the amount of
biofuel to transport 1 tonne by 1 km, algae grown in 1 ha, etc. Given the uncertainty of the
production pathway, which is the most logical functional unit that can be adopted for future
LCAs in order to maintain consistency between studies, and how important is it to have a
consistent functional unit between studies?
Click here to enter text.
Different LCAs use different system boundaries ‐ – is there any merit to adopting a standard
practice (i.e. Relative Mass Energy and Economics method proposed by Raynolds) for all future
LCAs – or where do you see the logical system boundary should be?
Click here to enter text.
Are there any further issues you think should be considered when using LCA to guide policy
decisions in the future?
Click here to enter text.

AQUAFUEL FP7 – 241301‐2
Coordination Action
FP7‐ENERGY‐2009‐1
118
15. Annex 5: Assumptions of Normalized Modelling
Primary Energe Usage Assumptions1.Algae Cultivation and Harvesting
Electricity used in Cultivation System Electricity consumption from the cultivation system operation is based on original LCA study
Nitrogen fertilizer
Nitrogen fertilizer demand is based on original LCA study; Energy Content of the Nitrogen fertilizer is based on Fehrenbach (2008)"GHG Accounting Methodology and Default Data according to the Biomass Sustainability Ordinance (BSO)"
Tractor Fuel usage Diesel tractor used in harvesting algae (Based on Campbell et al 2009)
System Construction Tubular manufacture and PVC lining (Based on Stephenson et al 2010)
2. Biomass Drying and Dewatering
Heat
Studies which assumed certain heat input in the Biomass drying and dewatering stage still follow their original assumptions; Studies which exlude the extraction process are normalised by Lardon et al's assumption
Electricity
Studies which assumed certain electricity input in the Biomass drying and dewatering stage still follow their original assumptions; Studies which exlude the extraction process are normalised by Lardon et al's assumption
3.Lipid Extraction Electricity (Homogenization for Cell disruption) Only applied on the Stephenson et al(2010)'s study
Electricity( Extraction)
Studies which assumed certain electricity input in the extraction stage still follow their original assumptions; Studies which exlude the extraction process are normalised by Steohenson et al's assumption
Heat
Studies which assumed certain heat input in the extraction stage still follow their original assumptions; Studies which exlude the extraction process are normalised by Steohenson et al's assumption
Totals1.Algae Cultivation and Harvesting Sum up all the energy input in this stage2.Biomass Drying and Dewatering Sum up all the energy input in this stage3.Lipid Extraction Sum up all the energy input in this stageBiomass Yield Based on original LCA studyBiorefinery Based on original LCA studyVolumetric Fuel yield Based on original LCA studyEnergetic fuel yield Based on original LCA studyTotal Heat Input Sum up all the Heat InputsTotal Electricity Input Sum up all the Electricity Inputs Total Input energy Sum up all the Energy Inputs
Total Energy Output (on Mass Basis) Energy content in the algal oil plus Energy output from Gas boiler. (on the mass basis)
Total Energy Output (on Energy Basis) Energy content in the algal oil plus Energy output from Gas boiler. (on the energetic basis)
Energy content in Biomass( Heating value of Biomass)
Studies which had assumed Heating value of the biomass are still follow their original assumptions; Studies which didn't mention the value, the energy content of the biomass is calculated by Illman et al(2000) 's results
Subtotal Energy Output in Lipid(Heating value of algal oil)
Studies which had assumed Heating value of the lipid are still follow their original assumptions; Studies which didn't mention the value, the energy content of the lipid is calculated by Illman et al(2000) 's results
Subtotal Energy Output in Residual Energy content in the Algal biomass minus energy content from the algal lipid
Energy Content in Methane(Anaerobic Digestion)(60%)
Methane yield is based on Sialve et al (2009)
Generated heat from Boiler(Assuming 75% efficiency)
Efficiency of the Gas boiler is based on Stephenson et al 2010
Heat Generation From CHP(41%) Electricity Generation From CHP(34%)
Reported HV of Algal Lipid
Studies which had assumed Heating value of the lipid are still follow their original assumptions; Studies which didn't mention the value, the energy content of the lipid are calculated by Illman et al(2000) 's results
Reported HV of Biomass
Studies which had assumed Heating value of the biomass are still follow their original assumptions; Studies which didn't mention the value, the energy content of the biomass are calculated by Illman et al(2000) 's results
Net Energy Ratio (NER) for Lipid production All the Primary Energy Input minus Energy content of coproducts, then divided by Energy content of lipid fraction
Net Energy Ratio (NER) for Biomass production All the Primary Energy Input divided by Energy content of dry biomass
Only applied on Stephenson et al 2010: System Efficiency is based on John Macadam (2010)
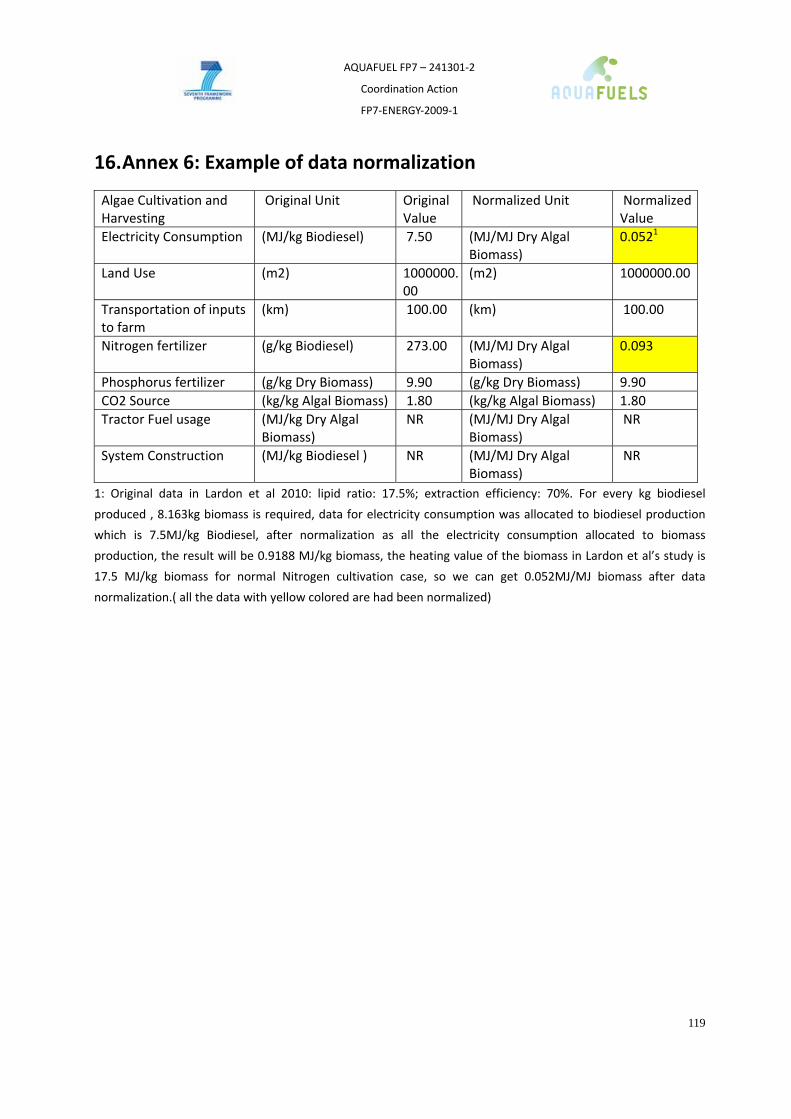
AQUAFUEL FP7 – 241301‐2
Coordination Action
FP7‐ENERGY‐2009‐1
119
16. Annex 6: Example of data normalization
Algae Cultivation and Harvesting
Original Unit Original Value
Normalized Unit Normalized Value
Electricity Consumption (MJ/kg Biodiesel) 7.50 (MJ/MJ Dry Algal Biomass)
0.0521
Land Use (m2) 1000000.00
(m2) 1000000.00
Transportation of inputs to farm
(km) 100.00 (km) 100.00
Nitrogen fertilizer (g/kg Biodiesel) 273.00 (MJ/MJ Dry Algal Biomass)
0.093
Phosphorus fertilizer (g/kg Dry Biomass) 9.90 (g/kg Dry Biomass) 9.90 CO2 Source (kg/kg Algal Biomass) 1.80 (kg/kg Algal Biomass) 1.80 Tractor Fuel usage (MJ/kg Dry Algal
Biomass) NR (MJ/MJ Dry Algal
Biomass) NR
System Construction (MJ/kg Biodiesel ) NR (MJ/MJ Dry Algal Biomass)
NR
1: Original data in Lardon et al 2010: lipid ratio: 17.5%; extraction efficiency: 70%. For every kg biodiesel
produced , 8.163kg biomass is required, data for electricity consumption was allocated to biodiesel production
which is 7.5MJ/kg Biodiesel, after normalization as all the electricity consumption allocated to biomass
production, the result will be 0.9188 MJ/kg biomass, the heating value of the biomass in Lardon et al’s study is
17.5 MJ/kg biomass for normal Nitrogen cultivation case, so we can get 0.052MJ/MJ biomass after data
normalization.( all the data with yellow colored are had been normalized)


![TOPIC: 191004 KNOWLEDGE: K1.01 [3.3/3.5] QID: P21 · PDF fileNRC Generic Fundamentals Examination Question Bank--PWR February 2017-1- Pumps . TOPIC: 191004 . KNOWLEDGE: K1.01 [3.3/3.5]](https://static.fdocuments.net/doc/165x107/5aaf33f87f8b9a3a038d13c8/topic-191004-knowledge-k101-3335-qid-p21-generic-fundamentals-examination.jpg)