
07 Measuring Domestic Output and National Income McGraw-Hill/Irwin Copyright © 2012 by The...
34
07 Measuring Domestic Output and National Income McGraw-Hill/Irwin Copyright © 2012 by The McGraw-Hill Companies, Inc. All rights reserved.
-
date post
19-Dec-2015 -
Category
Documents
-
view
213 -
download
0
Transcript of 07 Measuring Domestic Output and National Income McGraw-Hill/Irwin Copyright © 2012 by The...

07Measuring Domestic Output and
National Income
McGraw-Hill/Irwin Copyright © 2012 by The McGraw-Hill Companies, Inc. All rights reserved.

• National Income Accounting measures economy’s overall performance
• Bureau of Economic Analysis compiles National Income and Product Accounts•Assess health of economy•Track long run course•Formulate policy
Assessing the Economy’s Performance
LO1 7-2
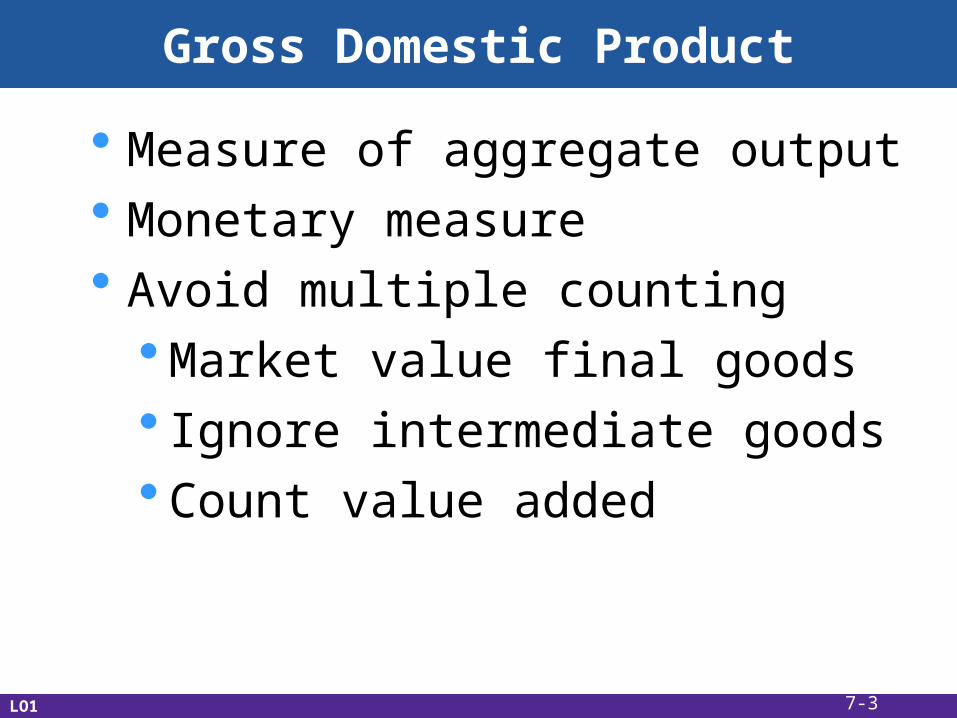
Gross Domestic Product
• Measure of aggregate output• Monetary measure• Avoid multiple counting
•Market value final goods• Ignore intermediate goods•Count value added
LO1 7-3

GDP is the market value of new, final goods and services produced year within the nation’s borders in a given time period.
Gross Domestic Product (GDP)
GDP is our basicmeasure of economic
activity

Final versus Intermediate Goods
A final good or service is produced for a final user and not as a component of a final good.
Examples: Cars, pizzas, luggage
An intermediate good or service is used as a component of a final good or service
Examples: Radiator hoses, flour, plastics.

Gross Domestic Product
(1)Stage of Production
(2)Sales ValueOf MaterialsOr Product
$ 0
Firm A, sheep ranch 120
Firm B, wool producer 180
Firm C, coat manufacturer 220
Firm D, clothing manufacturer 270
Firm E, retail clothier 350
Total Sales Value $1140
Value Added (total income)
(3)ValueAdded
]--------$120 (= $120 - $ 0)
]-------- 60 (= 180 - 120)
]-------- 40 (= 220 - 180)
]-------- 50 (= 270- 220)
]-------- 80 (= 350 – 270)
$350
LO1 7-6
To count the new coat in GDP, we count the final transaction only. Otherwise, we would be counting value added twice.

Gross Domestic Product
• Exclude financial transactions•Public transfer payments•Private transfer payments•Stock (and bond) market
transactions• Exclude second hand sales
•Sell used car to a friend
LO1 7-8
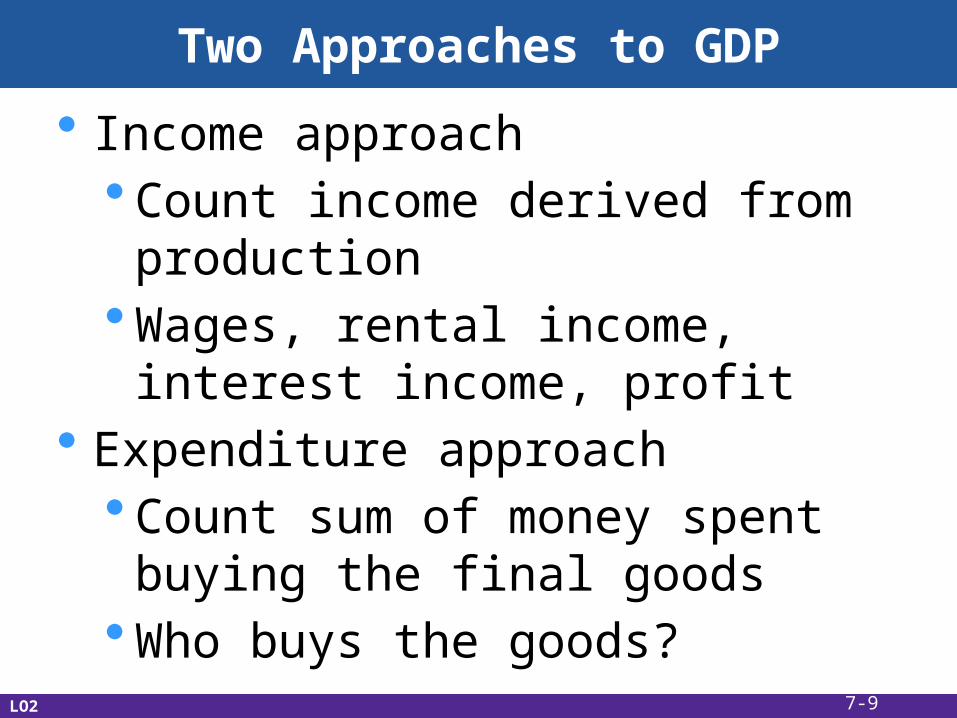
Two Approaches to GDP
• Income approach•Count income derived from
production•Wages, rental income, interest
income, profit• Expenditure approach
•Count sum of money spent buying the final goods
•Who buys the goods?LO2 7-9

GDP
= =
+Consumption by
Households
Investment byBusinesses
GovernmentPurchases
ExpendituresBy Foreigners
+
+
+++
Wages
Rents
Interest
Profits
StatisticalAdjustments
+
Two Approaches to GDPExpenditures or
Output ApproachIncome or
Allocations Approach
LO2 7-10

Expenditures Approach
• Personal consumption expenditures (C)•Durable consumer goods•Nondurable consumer goods•Consumer expenditures for
services•Domestic plus foreign goods
produced
LO2 7-11

Category
Spending in 2009
(billions)
Percent of Total
Durables $1,034.4 10
Nondurables 2,223.3 22
Services 6,835.0 68
Source: Bureau of Economic Analysis
Consumer Spending by Type, 2009 (in billions)
Total spending byU.S. households
in 2009 was a $10.1trillion

Expenditures Approach
• Gross private domestic investment (Ig)
•Machinery, equipment, and tools•All construction•Changes in inventories
• Creation of new capital assets• Noninvestment transactions excluded
LO2 7-13
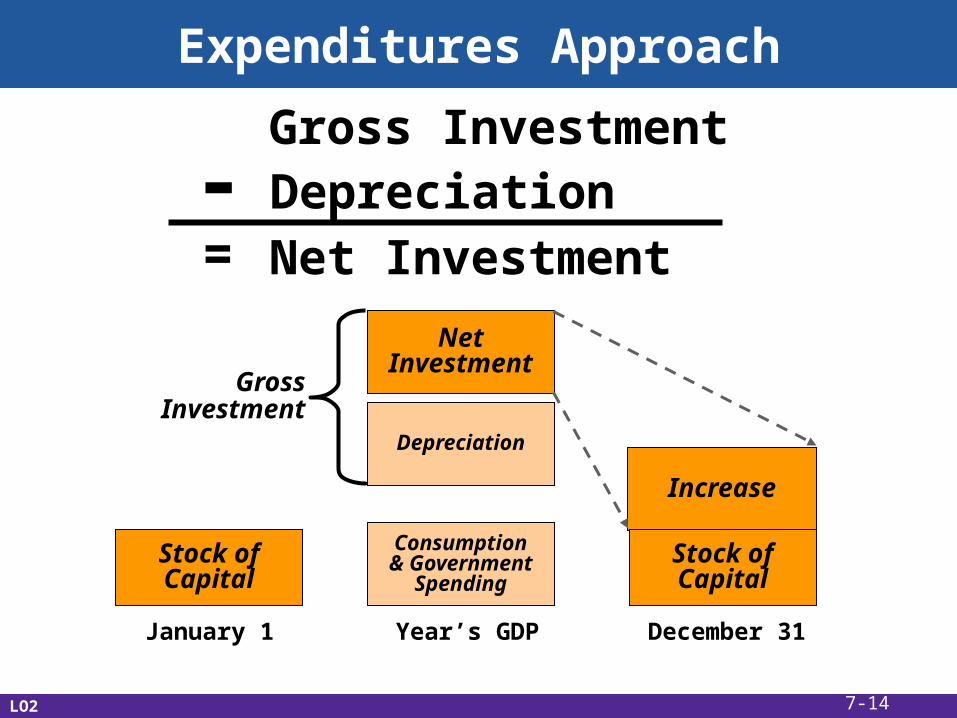
Expenditures Approach
January 1 Year’s GDP December 31
Consumption& Government
Spending
Depreciation
NetInvestment
GrossInvestment
Stock ofCapital
Increase
Stock ofCapital
Gross InvestmentDepreciationNet Investment
-=
LO2 7-14

Expenditures Approach
• Government purchases (G)• Expenditures for goods and services• Expenditures for publicly owned capital• Excludes transfer payments
• Net exports (Xn)• Add exported goods• Subtract imported goods
• Xn = exports – imports
• GDP = C + Ig + G + XnLO2 7-15

Compensation
Rents
Interest
Proprietor’s Income
Corporate Profits
Taxes on Production and
Imports
National Income
Net Foreign Factor Income (-)
Statistical Discrepancy (+)
Consumption of Fixed
Capital (+)
Gross Domestic Product
$ 7792
268
788
1041
1309
1090
$12,288
105
209
1864
$ 14,256
Personal Consumption (C)
Gross Private Domestic
Investment (Ig)
Government Purchases (G)
Net Exports (Xn)
Gross Domestic Product
In Billions ReceiptsExpenditures Approach
AllocationsIncome Approach
$10,089
1628
2931
-392
$ 14,256
U.S. Economy 2009
LO2 7-16

Comparative GDP
LO2 7-17

The Income Approach
• Compensation of employees• Rents• Interest• Proprietor’s income• Corporate profits
•Corporate income taxes•Dividends•Undistributed corporate profits
• Taxes on production and importsLO2 7-18

The Income Approach• From national income to GDP
•Subtract net foreign factor income•Statistical discrepancy•Consumption of fixed capital
• Other national accounts•Net domestic product (NDP)•National income (NI)•Personal income (PI)•Disposable income (DI)
LO2 7-19
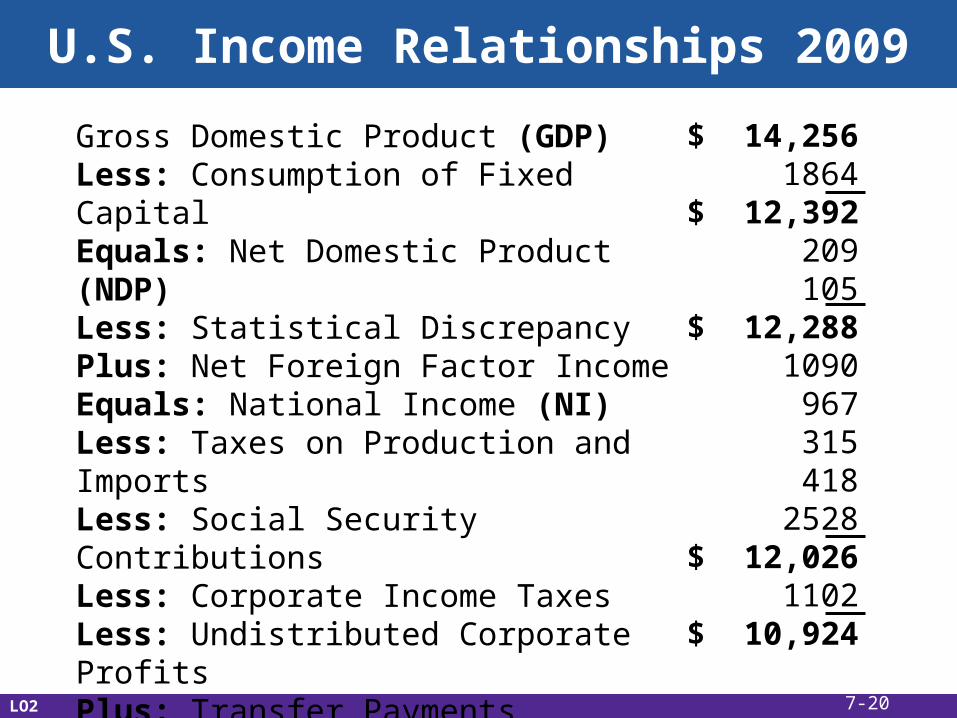
U.S. Income Relationships 2009
Gross Domestic Product (GDP)Less: Consumption of Fixed CapitalEquals: Net Domestic Product (NDP)Less: Statistical DiscrepancyPlus: Net Foreign Factor IncomeEquals: National Income (NI)Less: Taxes on Production and ImportsLess: Social Security ContributionsLess: Corporate Income TaxesLess: Undistributed Corporate ProfitsPlus: Transfer PaymentsEquals: Personal Income (PI)Less: Personal TaxesEquals: Disposable Income (DI)
$ 14,2561864
$ 12,392209105
$ 12,2881090
967315418
2528$ 12,026
1102$ 10,924
LO2 7-20

Circular Flow Revisited
LO2 7-21

Nominal vs. Real GDP
• GDP is a dollar measure of production
• Using dollar values creates problems• Nominal GDP
•Use prevailing price• Real GDP
•Reflect changes in price•Use base year price
LO3 7-22

GDP Price Index
• Use price index to determine real GDP
PriceIndexIn GivenYear
= x100Price of Market Basket
In Specific Year
Price of Same BasketIn Base Year
RealGDP =
Nominal GDP
Price Index (in hundredths)
LO3 7-23

GDP Price Index
• Calculating Real GDP (Base Year = Yr 1)
Year
(1)Units of Output
(2)Price of
PizzaPer Unit
(3)Price Index
(Year 1 = 100)
(4) Unadjusted, or Nominal,
GDP(1) X (2)
(5)Adjusted,
or Real, GDP
1 5 $10 100 $ 50 $50
2 7 20 200 140 70
3 8 25 250 200 80
4 10 30 --- --- ---
5 11 28 --- --- ---
LO3 7-24

0
5000
10000
15000
20000
25000
30000
35000
60 65 70 75 80 85 90 95
Nominal Chained 1996 dollars
GDP per Person in the United States
www.economagic.com
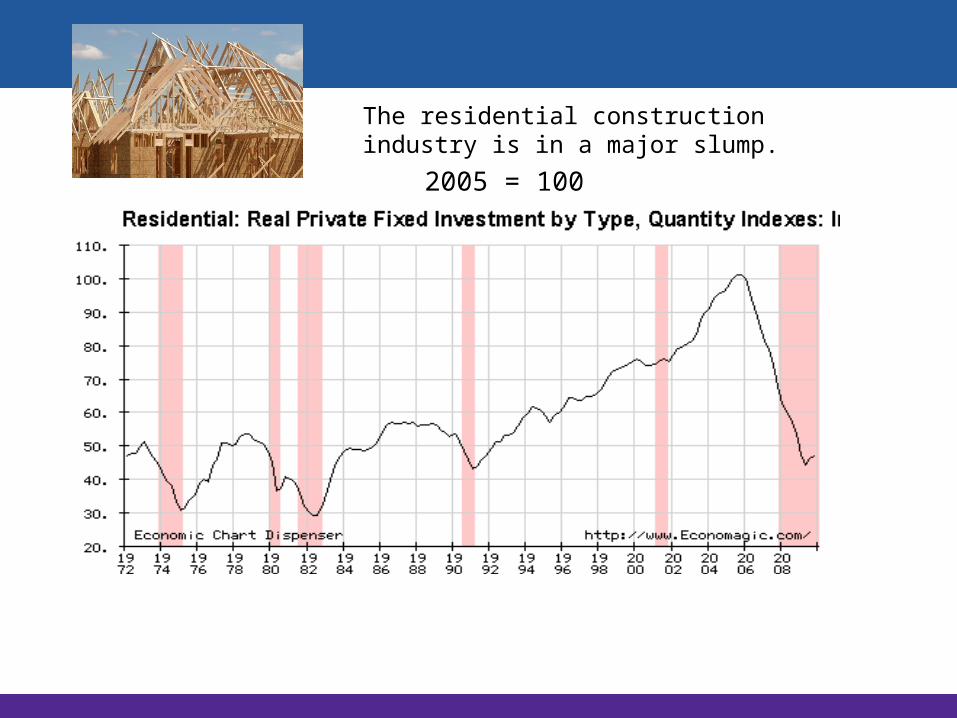
The residential construction industry is in a major slump.
2005 = 100
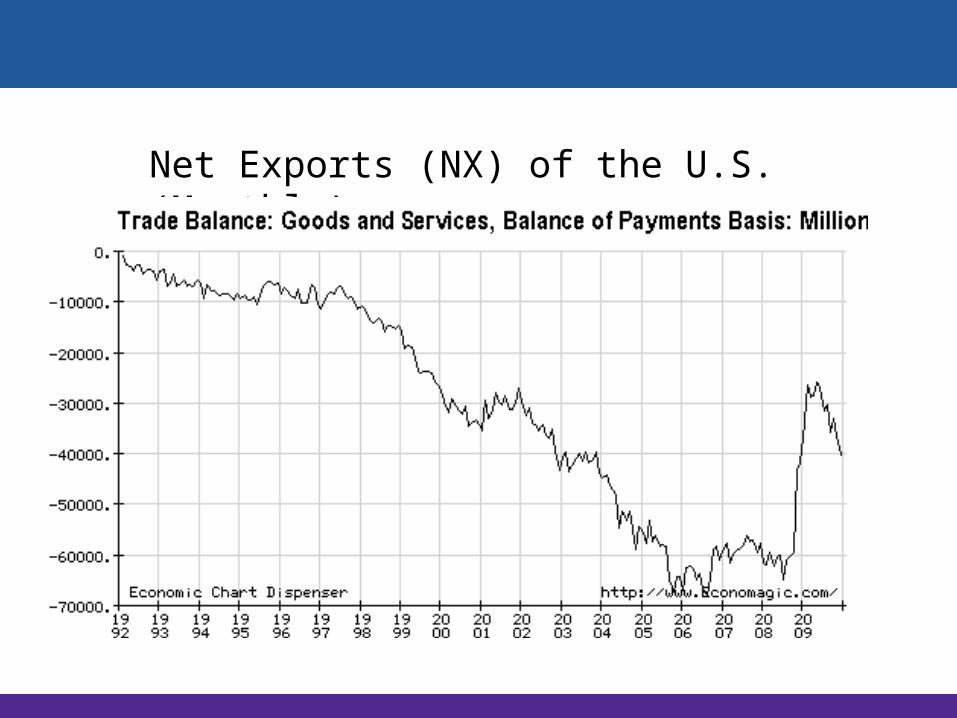
Net Exports (NX) of the U.S. (Monthly)
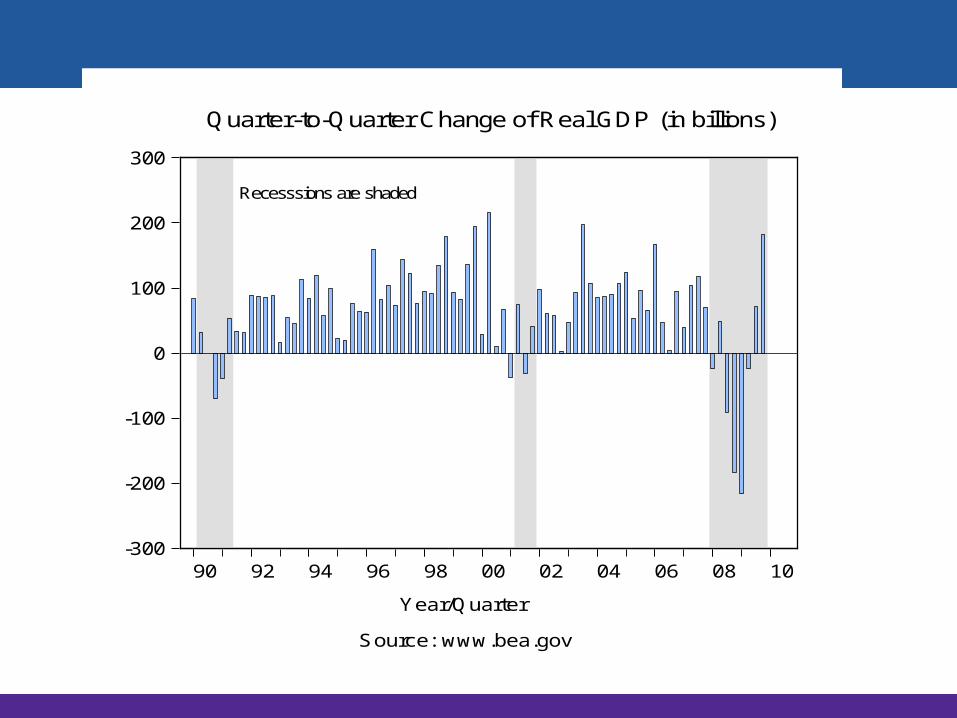
-300
-200
-100
0
100
200
300
90 92 94 96 98 00 02 04 06 08 10
Quarter-to-Quarter Change of Real GDP (in billions)
Year/Quarter
Recesssions are shaded
Source: www.bea.gov

Shortcomings of GDP
• Nonmarket activities• Leisure• Improved product quality• The underground economy• GDP and the environment• Composition and distribution of the
output• Noneconomic sources of well-being
LO4 7-30

Underground Economy
LO4 7-31

Sources of BEA Data
• Consumption•Census Bureau’s Retail Trade
Survey•Census Bureau’s Survey of
Manufacturers•Census Bureau’s Service Survey• Industry Trade Sources
LO4 7-32
Sources of BEA Data
• Investment• All consumption data sources• Census Bureau’s Housing Starts Survey and Housing
Sales Survey• Retail Trade Survey• Wholesale Trade Survey• Survey of Manufacturing
LO4 7-33
Sources of BEA Data
• Government Purchases•Office of Personnel Management•Construction Surveys•Census Bureau’s Survey of
Government Finance• Net Exports
•U.S. Customs Service•BEA Surveys and Analysis
LO4 7-34