07 May 2014 - ICFAI University, Jharkhand Journal of Management-May 2014 issue.pdf · Truncation...
110
IUJ Journal of Management Vol. 2 No. 1 May 2014 ISSN: 2347 - 5080 Contents From the Editor ……… (Page No.) Articles • The Changing Paradigm and Expansion of Knowledge with Knowledge Management (Mani Bansal, Sunita Tanwar and A.K. Vij) 1 • Entrepreneurial Contribution to Society (Laxmisha A. S.) 7 • Effectiveness of Video Teleconferencing in Teaching – Learning in Open Distance Learning Institutions in India (Ravi Ayyagari and Rampelli Satyanarayana) 13 • Information Technology Initiative at Life Insurance Corporation (LIC) of India (Tulsi Modi and Dipak kr. Shukla) 21 • National Payments Corporation of India (NPCI) - Introduction of Bank’s Cheque Truncation System - Key Features of CTS-2010 & e-Cheques –effective from 1 st July 2013 (Firdos T.Shroff) 27 • A Framwork for Requirement Prioritization for Software Products (Sita Devulapalli and Akhil Khare) 35 • Merger and Acquisitions in Indian Steel Industry: Atypical cases of Tata-Corus and Arcelor-Mittal (Susan Das) 42 • Rationale of Need and Gap Analyses in the Context of Corporate Social Responsibility Activities Initiated by Coal Mining Indus (A. Surendra Babu and Sukanta Chandra Swain) 51 • Role of Senior Management in Ethical Related Actions (K. S. Naik) 58 • Factors Influencing Preferences for Green Products (Sudipta Majumdar) 66 • Modeling Health Insurance Selection in Indian Market using Data Mining Approach (Pratik Biswas and Partha Sarathi Bishnu) 72 • Mall Shopping in Small Cities: Mania or Necessity? (Nidhi Kumari) 78 • Diagnostic Study of Handloom Cluster in Jharkhand (Priya Srivastava) 85 • Inventory Model for Items with Imperfect Quality and Screening at Vendor Site (Abhay Kumar Sinha) 97 Book Review: “Urbanization in Asia: Governance, Infrastructure and the Environment” (P. K. Samanta) 102 Vol. 2, No. 1, May 2014 IUJ Journal of Management
-
Upload
truongliem -
Category
Documents
-
view
215 -
download
0
Transcript of 07 May 2014 - ICFAI University, Jharkhand Journal of Management-May 2014 issue.pdf · Truncation...

IUJ Journal of Management Vol. 2 No. 1 May 2014 ISSN: 2347 - 5080
Contents
From the Editor ……… (Page No.)
Articles
• The Changing Paradigm and Expansion of Knowledge with Knowledge Management (Mani Bansal, Sunita Tanwar and A.K. Vij)
1
• Entrepreneurial Contribution to Society (Laxmisha A. S.)
7
• Effectiveness of Video Teleconferencing in Teaching – Learning in Open Distance Learning Institutions in India (Ravi Ayyagari and Rampelli Satyanarayana)
13
• Information Technology Initiative at Life Insurance Corporation (LIC) of India (Tulsi Modi and Dipak kr. Shukla)
21
• National Payments Corporation of India (NPCI) - Introduction of Bank’s Cheque Truncation System - Key Features of CTS-2010 & e-Cheques –effective from 1st July 2013 (Firdos T.Shroff)
27
• A Framwork for Requirement Prioritization for Software Products (Sita Devulapalli and Akhil Khare)
35
• Merger and Acquisitions in Indian Steel Industry: Atypical cases of Tata-Corus and Arcelor-Mittal (Susan Das)
42
• Rationale of Need and Gap Analyses in the Context of Corporate Social Responsibility Activities Initiated by Coal Mining Indus (A. Surendra Babu and Sukanta Chandra Swain)
51
• Role of Senior Management in Ethical Related Actions (K. S. Naik)
58
• Factors Influencing Preferences for Green Products (Sudipta Majumdar)
66
• Modeling Health Insurance Selection in Indian Market using Data Mining Approach (Pratik Biswas and Partha Sarathi Bishnu)
72
• Mall Shopping in Small Cities: Mania or Necessity? (Nidhi Kumari)
78
• Diagnostic Study of Handloom Cluster in Jharkhand (Priya Srivastava)
85
• Inventory Model for Items with Imperfect Quality and Screening at Vendor Site (Abhay Kumar Sinha)
97
Book Review: “Urbanization in Asia: Governance, Infrastructure and the Environment”
(P. K. Samanta)
102
Vol. 2, No. 1, May 2014IUJ Journal of Management

Vol. 2, No. 1, May 2014IUJ Journal of Management
From the Editor
All of us must have encountered a few personalities, with seemingly high level of knowledge and expertise in their own function, who have not achieved much and at the same time, a different set of personalities, apparently with mediocre level of knowledge and expertise, who are there much ahead of the former set on the scale of growth and development. The same thing also happens with the organizations. This common experience of ours reveals one thing very transparently that while possessing knowledge is necessary, managing the same is sufficient to accomplish something. In fact, acquisition of knowledge adds to the potential but managing knowledge puts potential into action and hence gets reflected on performance. The importance of this very fact has been well-realized by three authors of one of the articles titled “The Changing Paradigm and Expansion of Knowledge with Knowledge Management” of ‘May 2014’ Issue of the IUJ Journal of Management. They have focused on Knowledge management that seeks to make the best use of the knowledge available to an organization, while creating new knowledge in the process. Recessionary pressure in the USA and Euro-Zone crisis coupled with search cost in the factor market has put forth its toll on the job market in India leading to unemployment in Indian economy. If there in no opportunity to make use of your knowledge how well knowledgeable and good knowledge manager one may be, there will be no chance for any change in the existing situation. However, for making use of one’s knowledge and managing the same effectively, it is not that one has to do job in the corporate world or government offices. The best alternative that has been emerging in recent time is the entrepreneurship, which not only utilizes the knowledge of the proprietor but also helps in making best use of talent and providing bread and butter of others. Second article of this Issue “Entrepreneurial Contribution to Society” asserts on the basis of empirical finding that the entrepreneurs in the study area have made contribution to the society in the form of generating employment opportunities, at least, for a few unemployed and have helped in reducing the burden on the government to that extent. As we have already mentioned, knowledge has become a critical factor now for any venture and learning is the means to acquire knowledge. While during primary and secondary levels of education, the concept of distance learning does not crop up either from demand side or supply side; both the market forces are keen in distance learning at higher level owing to its aptness and usefulness. Now, with advancement in Information Communication Technology (ICT), the benefits of distance learning at higher levels have been taking momentum. Accordingly, two authors of one of our articles titled “Effectiveness of Video Teleconferencing in Teaching – Learning in Open Distance Learning Institutions in India” have analyzed the practices of two leading Open Distance Learning (ODL) Institutes in India, IGNOU and BRAOU to enhance “interactivity “between Learners and Teachers and proposed a framework on how teleconferencing can be more effectively utilized in ODL. While ICT facilitates acquisition of knowledge, Life Insurance Corporation (LIC) of India, an example of applied monopoly in the life insurance sector, in the form of insuring the life of individuals, initiates the interest of acquiring knowledge. The Company which works for our lives should provide the facilities of higher order to the customers by making use of modern information technology. And hence an article of this Issue “Information Technology (IT) Initiative at Life Insurance Corporation (LIC) of India” exhibits how LIC has made best use of the IT initiatives with its key success factors. There is no doubt on substantial advancement in the use of ICT and IT in recent time in all facets of our life. In spite of having ultra modern modes like plastic money, e-banking, mobile money, etc. to deal with monetary transactions, the use of cheques now also plays a great role in total monetary transactions in India. That’s why National Payments Corporation of India (NPCI) has introduced Cheque Truncation, i.e., one of the ways to compress the clearing cycle to provide faster clearances of local and intercity cheques, replacing in whole or in part by electronic records of their content. One of the articles of this Issue “National Payments Corporation of India (NPCI) - Introduction of Bank’s Cheque Truncation System - Key Features of CTS-2010 & e-Cheques –effective from 1st July 2013” has aptly focused on entire processes of introduction of Bank’s Cheque Truncation System in India and the mechanism

Vol. 2, No. 1, May 2014IUJ Journal of Management
achieve efficiency in software products, have developed a framework that helps and provides clear visibility and traceability across Software development life cycle and helps guide quality efforts. The author through his article titled “Merger and Acquisitions in Indian Steel Industry: Atypical cases of Tata-Corus and Arcelor-Mittal” has lucidly presented two of the most important deals in the Indian steel industry –TATA-CORUS deal and ARCELOR-MITTAL deal and made it clear to the rest of the steel-makers around the world that India has arrived on the global platform, in spite of seemingly technological backwardness. While corporate players have been adopting many strategies like Merger and Acquisitions to have competitive advantage and maintain profitability, as a corporate citizen of the country they are also to go for corporate social responsibility (CSR) activities either voluntarily or out of legal binding. As a result, many corporate like Coal Mining Industry are undertaking varied CSR initiatives. But to optimize the benefits from such initiatives, there should be proper match between the demand of the beneficiaries and supply of the corporate besides, analyzing impact and gap, if any, in the process of initiating CSR activities. The article titled “Rationale of Need and Gap Analyses in the Context of Corporate Social Responsibility Activities Initiated by Coal Mining Industry” has tried to justify this. Before undertaking any CSR initiatives, the most important thing that comes to our mind is ethics in doing business. The author in his article “Role of Senior Management in Ethical Related Actions” nicely presents the role of the Senior Management in inculcating the concepts of ‘Ethical Related Actions’ and the importance of such concepts in the ethical management of organizations. Today’s people are highly cautious about their health. So people have started preferring green products, i.e., sustainable or environment friendly products, to traditional products but the trend is not as expected. Therefore, if we can come to know from the users, why they like green products, may be, by making use of the findings, the trend could be made favourable. The article titled “Factors Influencing Preferences for Green Products” has agreeably made the grounding to undertake this task. In spite of showing concern for our health and adapting health friendly way of living, we can not assure of our sound health. Hence, health insurance has now become a highly saleable product in insurance industry and therefore many companies offer the product with varied ranges targeting differently. That’s why it is very important to select the best suited one amidst many. The article “Modeling Health Insurance Selection in Indian Market using Data Mining Approach” has tried to furnish a model to deal with the perplexity in selection of health insurance. Besides, while the article titled “Mall Shopping in Small Cities: Mania or Necessity?” explores the ideas across necessity of shopping and mania for shopping towards shopping mall, the author in her article “Diagnostic Study of Handloom Cluster in Jharkhand” has made an in-depth assessment of the various problems faced by the handloom clusters in Jharkhand and suggest relevant measures to overcome the same. Although Malls have been in a pivotal position in the supply chain, Handloom Clusters in Jharkhand struggle a lot for an effective supply chain, particularly for an appropriate inventory model. Therefore the last but not the least article of this Issue titled “Inventory Model for Items with Imperfect Quality and Screening at Vendor Site” has proposed a model for screening of defective item from a lot of items at the vendor site in a single-vendor single-buyer situation for a single product. The Issue concludes with a review of the book titled “Urbanization in Asia: Governance, Infrastructure and the Environment”. The reviewer has magnificently briefed the gist of 15 chapters of the book contributed by academicians and practitioners that focuses on urban governance in the developing world. This Issue, containing 14 articles and one book review, comprehensively covers the defined scope of the Journal, by and large providing a complete set of domains, and has interpretation that offer constructive and apt information about those domains. I sincerely wish that the contents are very useful to readers as every creation provides fairly complete treatment of the subject. (S. C. Swain) Managing Editor

Vol. 2, No. 1, May 2014 1. Research Scholar, School of Management, ITM University, Gurgaon, Haryana, Email id: 2. Assistant Professor, Central University of Haryana ,Mahendragarh, Email Id: 3. Professor, School of Management, ITM University, Gurgaon, Haryana, Email Id:
[email protected]@gmail.com
1
During the last few decades, the practice of Knowledge Management has become a central management theme throughout the world. Knowledge Management as an organisational innovation has been with us for more than a decade. The ability to manage knowledge is increasingly more crucial in today's economy.
Knowledge Management has been initially
defined as the process of applying a systematic
approach to capture, structure, manage and
disseminate knowledge throughout an
organisation in order to work faster, reuse best
practices and reduce costly rework from project
to project (Nonaka and Takeuchi, 1995).
Knowledge Management is a mix of strategies,
tools and technologies- some of which are
nothing new under the sun. Knowledge
Management utilises a combination of
techniques for knowledge base system design,
such as structured knowledge acquisition
strategies. Globalisation opportunities and
pressures coupled wi th world- wide
communication signify the point that structural
The Changing Paradigm and Expansion of Knowledge with Knowledge Management
Mani Bansal1 Sunita Tanwar2 A.K. Vij3
Knowledge Management is a branch of management that seeks to improve performance within the organisation. Knowledge is the awareness of the information that people have gained in the terms of experiences and learning. During the last few decades, the practice of Knowledge Management has become a central management theme throughout the world. It overlapped with initiatives on competence management and organisational learning, gaining credibility from the daily news on the imminent arrival of knowledge society and the continuously expanding internet. This paper focuses on the evolutionary growth and changing perspectives in knowledge management, and the present status of KM frontiers. The early emphasis in Knowledge Management was on information systems. Then the focus shifted towards organisational development, intellectual capital management and competence management. Presently Social learning, organisational sense making and systematic innovation and change management become prominent themes in knowledge management. Knowledge management is valuable tool for those enterprises that practice it deliberately and systematically. Creating and operating KM capabilities cover many disciplines such as organisational information processing, business intelligence, organisational cognition and organisational development. The first had its starting point in computer technology, the second on information services, the third on research on organisational innovation and sense making and the fourth on business strategy and human resource management. Knowledge management seeks to make the best use of the knowledge that is available to an organisation, while creating new knowledge in the process. Keywords: Knowledge management, Growth stages of KM, Changing focus of KM, Knowledge management life cycle model. Introduction
Vol. 2, No. 1, May 2014IUJ Journal of Management2
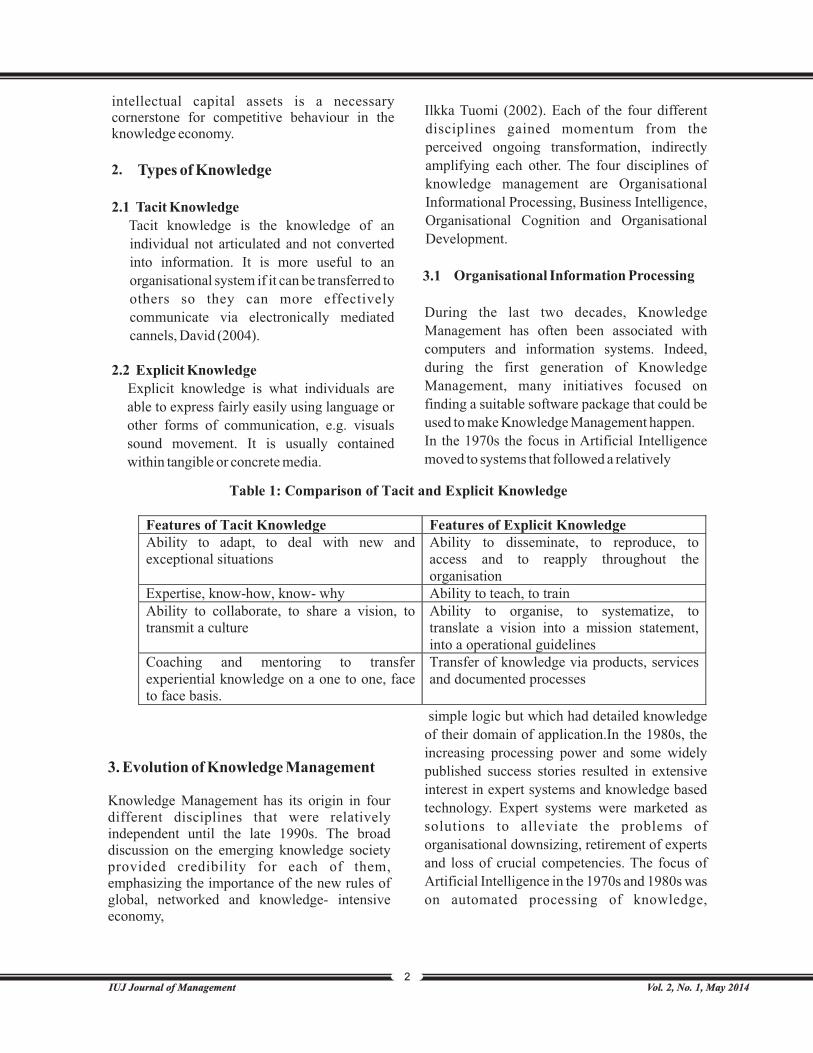
Table 1: Comparison of Tacit and Explicit Knowledge
Features of Tacit Knowledge Features of Explicit Knowledge Ability to adapt, to deal with new and exceptional situations
Ability to disseminate, to reproduce, to access and to reapply throughout the organisation
Expertise, know-how, know- why Ability to teach, to train Ability to collaborate, to share a vision, to transmit a culture
Ability to organise, to systematize, to translate a vision into a mission statement, into a operational guidelines
Coaching and mentoring to transfer experiential knowledge on a one to one, face to face basis.
Transfer of knowledge via products, services and documented processes
intellectual capital assets is a necessary cornerstone for competitive behaviour in the knowledge economy.
Types of Knowledge
Tacit Knowledge
Tacit knowledge is the knowledge of an
individual not articulated and not converted
into information. It is more useful to an
organisational system if it can be transferred to
others so they can more effectively
communicate via electronically mediated
cannels, David (2004).
2.2 Explicit Knowledge
Explicit knowledge is what individuals are
able to express fairly easily using language or
other forms of communication, e.g. visuals
sound movement. It is usually contained
within tangible or concrete media.
2.1
3. Evolution of Knowledge Management
Knowledge Management has its origin in four different disciplines that were relatively independent until the late 1990s. The broad discussion on the emerging knowledge society provided credibility for each of them, emphasizing the importance of the new rules of global, networked and knowledge- intensive economy,
Ilkka Tuomi (2002). Each of the four different
disciplines gained momentum from the
perceived ongoing transformation, indirectly
amplifying each other. The four disciplines of
knowledge management are Organisational
Informational Processing, Business Intelligence,
Organisational Cognition and Organisational
Development.
Organisational Information Processing
During the last two decades, Knowledge
Management has often been associated with
computers and information systems. Indeed,
during the first generation of Knowledge
Management, many initiatives focused on
finding a suitable software package that could be
used to make Knowledge Management happen.
In the 1970s the focus in Artificial Intelligence
moved to systems that followed a relatively
simple logic but which had detailed knowledge
of their domain of application.In the 1980s, the
increasing processing power and some widely
published success stories resulted in extensive
interest in expert systems and knowledge based
technology. Expert systems were marketed as
solutions to alleviate the problems of
organisational downsizing, retirement of experts
and loss of crucial competencies. The focus of
Artificial Intelligence in the 1970s and 1980s was
on automated processing of knowledge,
3.1
2.

Vol. 2, No. 1, May 2014IUJ Journal of Management3
3.3 Organisational Cognition
Corporate Competitive Intelligence expanded to Business Intelligence at the beginning of the 1990s when it was reconceptualised to include management of organisation's internal knowledge. Although Business Intelligence relied heavily on information systems, its focus was not just on knowledge representation, automated analysis and social networks. Cognition of a human being relates to the internal mental process that begins with receiving information and terminates with action taking. Cognitive process consists of various mental processes for using knowledge i.e. Information Gathering, Sense- Making (Interpretation), Choice and Commitment. Cognitive process is the process of using knowledge and being driven by knowledge. Research on organisational cognition has been historically inspired by information processing that is the foundation of cognitivistic theories of human mind. Nonaka's innovation studies were complemented and to some extent paralleled by research on organisational learning.
fashion within the organisation. Organisational cognition researchers however started to question the nature of knowing and its role in organised social action. In parallel, Intellectual Capital movement emerged from a more economic
Organisational Development Competence strategists, innovation managers, Human Resource developers, finance and control
Organisational capabilities and management practices
Source: adapted from IIkka Tuomi, “The future of Knowledge management”
Table 2: Changing Focus of Knowledge Management
KM Cluster Focal Root Communities Primary Object of
Intervention Organisational Information Processing
Information system support, Artificial Intelligence experts, software providers
Information systems
Business Intelligence Corporate librarians, Competitive Intelligence Professionals
Strategic decision making processes
Organisational Cognition Researchers on organisational sense making
Organisational knowledge processing
Bobrow and Winograd, (1997). The increasing capability to store information, however, also made possible new forms of document and database management systems.
3.2 Business Intelligence
Competitive Intelligence has generated interest in the recent years as a result of the information explosion and the sharpness of information technologies. Competitive Intelligence is the analytical process that transforms scattered information about competitors and customers into relevant, accurate and useable strategic knowledge on market evolution, business opportunities and threats. The focus in Competitive Intelligence is on strategic analysis of external information related to market trends and competitors. Whereas the information processing experts often approached organisational knowledge as a technical problem that could be solvedby appropriate use of technology, the competitive intelligence people are interested in finding, u n d e r s t a n d i n g , s y n t h e s i z i n g a n d disseminating relevant information. The focus of competitive intelligence is on strategic
decision making and the expanding computer ne tworks suppor t the exis tence of organisational intelligence beyond the executive offices and boardrooms.

Vol. 2, No. 1, May 2014IUJ Journal of Management4
oriented viewpoint, arising from the observation that knowledge was invisible in organisational accounting and measurement systems. Intellectual Capital people focused mainly on the management and measurement of knowledge related competencies, with relatively less emphasis on knowledge generation and learning. The strategic concern was maximum return on investment in existing knowledge assets, as well as protection of intellectual property.
4. G r o w t h S t a g e s o f K n o w l e d g e Management
4.1 F i r s t G e n e r a t i o n K n o w l e d g e Management
First generation knowledge management related to the capturing of information and experience so that it can be easily accessible in a corporate environment. The first branch of knowledge management was anchored to be the use of technology. In this view, knowledge management is an issue of information storage and retrieval. It uses ideas derived from system analyses and management theory.
First generation Knowledge Management
involved creating complex data analysis and
retrieval systems without much attention to how
the information they contained would be
developed or used, Joseph and Mark (2002). A
typical scenario might have seen an
organisational install a sophisticated intranet in
order to categorise and disseminate information,
only to find that the extra work involved in setting
up the metadata meant that few people within the
organisation actually used the intranet.
4 .2 Second Generat ion Knowledge
Management
Second generation knowledge management
focuses on learning and relating information with
individuals. Organisations are viewed as capable
of learning and so connection grew between
learning theory and management. It is concerned
with the way people create and use knowledge. It
is closely related to organisational learning and
itrecognises that learning and doing are more
important to organisational success than the
simple dissemination of information and
imitation of best practices. It raises the
requirement for new capabilities in the support
functions, facilitation of learning reviews, and
the ability to connect people with others,
matching supply with demand, and enabling
networking.
4.3 Third Generat ion Knowledge
Management
Knowledge Management was the name
introduced to describe the management activity
concerned with implementing such solutions as
provide competitive advantage to the
organisation and increase productivity and
effectiveness, Karl Wiig (2002), the notion of
Intellectual Capital had appeared a few years
earlier to account for the increasing disparity
between the market value of real world
enterprises. According to Koenig, the third stage
of Knowledge Management relates to the
importance of retrievability and therefore of the
arrangement, description and structure of the
content. In particular, the third stage is about
finding relevant content and about taxonomy
development and content management to
facilitate this goal.
5. Life Cycle Model For Knowledge Management
There are five basic processes considered for managing knowledge. These are defined as creating, sharing, structuring, using and auditing, which form the Knowledge Management Life Cycle, Mustafa Sagsan (2006). Life Cycle model helps us to understand knowledge management processes in hierarchical order.
5.1 Knowledge Creation
The ability to create knowledge is often at the heart of the organisations competitive advantage, Nonaka (1997), Knowledge creation is about continuous transfer, combination and conversion of different types of knowledge. Organisational participants create knowledge through their intuition, ability, skills, and behaviour and work experiences. Key players, departments and their

Vol. 2, No. 1, May 2014IUJ Journal of Management
Fig. No.1 Growth Stages of Knowledge Management
1st Generation: document- based KM
Aggregated, organised and analysed information
Stored in documents or data warehouses
Extract, capture, store and disseminate information
Made available through search and retrieval
Human beings are reluctant to share their knowledge
Produce or provide information for rational management
3rd Generation: system-based KM
Complex phenomena emerging from a social system
Stored in systematic interaction and relations Co-create, discover and transform sense & meaning Made available by understanding the whole through conversation and creating sense and meaning Human beings depend on interaction to be knowledgeable
Understand and innovate for sense-making and impact
2nd Generation: people-based KM
Skill of using knowledge to create something unique Stored in human brains
Interact, share and exchange knowledge
Made available in human interactions Human beings are eager to promote their expertise
Share and learn for improvement and effectiveness
5
interactivity can play a crucial role in creating knowledge in organisation.
5.2 Knowledge Sharing
The second important stage of Knowledge Management Life Cycle is Knowledge Sharing. It involves creating knowledge by individuals and groups with their interactivity and connectivity in organisations. It is carried out by social and technical communication channels. It depends on the stability and durability of organisational infrastructure. If organisational infrastructure is suitable for aligning with the knowledge management system, then only the successful knowledge sharing can be carried out.
5.3 Knowledge Structuring
After constructing a perfect infrastructure system for knowledge sharing, data, information and knowledge should be structured in order to store in organisational database for the future needs. Structuring knowledge is based on sorting, organising, codifying, analysing, and reporting that facilitates retrieval of knowledge needed by the organisation in future. Knowledge structuring categorises data and information through various classification tools and enables timely retrieval of this information. Thus, mapping, sorting, and retrieving information are three important components of knowledge structuring.

Vol. 2, No. 1, May 2014IUJ Journal of Management6
5.4 Knowledge Use
According to David (2002), organisations use knowledge for three reasons:
(i) Knowledge can be used for determining
organisations work processes and making
strategies for sustainable competitive
advantage.
(ii) Knowledge can be used for designing and
marketing product.
(iv)Knowledge plays a critical role of
organisations services quality.
Like knowledge structuring, knowledge use is also based on information technology. Hence for effective knowledge use, individuals must have IT literacy.
Knowledge AuditingKnowledge auditing means the amount of knowledge that can be used in organisations products, services and processes. In other words, what amount of information and knowledge is created, shared, stored and used in the organisation in a certain timeframe, which helps in determining the information capacity needs in the organisation. Auditing knowledge in an organisation means measuring intellectual capital; intangibles such as information, knowledge and skills that can be leveraged by an organisation to produce an asset of equal or greater importance than land, labour and capital.
Conclusion
Knowledge Management is the deliberate and systematic coordination of an organisation's people, technology, processes, and organisational structure. The main stages of evolutionary growth of knowledge management show how various generations of knowledge management succeeded each other, and summarize the learning, proposed policy and management issues. Knowledge management includes five basic steps in hierarchical order i.e. creating, sharing, structuring, using and auditing. The three generations of knowledge management focus on information systems, organisational development, intellectual capital management and competence management. Knowledge management contributes to organisational
5.5
6.
intellectual capital and innovation capacity.
References· Bobrow, D., & T., W. .. (1977). An Overview
of KRL, A Knowledge Representation
Langauge. Cognitive Science , 3-46.
· Firestone, J. M., & MCElroy, M. W. (2002).
Generations of Knowledge Management.
Executives Information Systems.
· Krogh, G., & Nonanka. (2000). Enabilng
Knowledge Creation: How to Unlock the
Mystery of Tacit Knowledge and Release
The Power Of Innovation. Oxford University
Press.
· Nonaka, D. I. (1997). Organisational
Knowledge Crea t ion . Knowledge
Advantage.
· Nonaka, I., & Takeuchi, H. (1995). The
Knowledge Creating Company: How
Japanese Copanies Create The Dynamics of
Innovation. New York: Oxford University
press.
· Sagsan, M. (2006). A New Life Cycle Model
for Processing of Knowledge Management.
Business, Management and Economics.
Izmir.
· Skyrme, D. J. (2004). Information Managers-
Do We Need Them. Learned Information
Europe.· S k y r m e , D . J . ( 2 0 0 2 ) .
K N O W L E D G E M A N A G E M E N T:
A P P R O A C H E S A N D P O L I C I E S .
Knowledge Innovation Timeline , 21-24.
· Tuomi, I. (2002). The Future of Knowledge
Management. Lifelong Learning in Europe ,
VII (2), 69-79.
· Wiig, K. M. (2002). New Generation
Knowledge Management: What May We
Expect? Knowledge Research Institute.
· Wilson, A. (2005). Integrating and Sharing
Research. APRA International Conference.
· Wittgenstein, P. V. (2006). Generations of
Knowledge Managemen. CanadAsia
Management Development Ltd.

Vol. 2, No. 1, May 2014
Entrepreneurial Contribution to Society
Laxmisha A. S.1
Entrepreneur is recognizing the opportunities, pursue the activity, assuming the risk, create employment and make contribution to the society. Many research studies have recognized the role played by the entrepreneur in the development of a nation. The present paper aims at analyzing the association between investment, sales turnover and nature of business activity with the employment generated. To fulfill the objectives of the paper three each alternate and null hypotheses were set and tested by using co-efficient of contingency tool. The paper is the result of primary data collected by conducting a field survey in Uttara Kannada district of Karnataka state. With the help of a well designed interview schedule 500 respondents were surveyed in all the 11 taluks of the study area. Due representation is given to entrepreneurs from different age, family background, category, range of investment and sales turnover and also the nature of activity. The study concluded that the entrepreneurs in the study area have made contribution to the society by providing employment to at least few people, thus reduced the burden on the government to that extent. Keywords : Co efficient of Contingency, Entrepreneur, Society
1 Assistant Professor of Commerce, L. B. & S. B. S. College (Autonomous), SAGAR, Shimoga Dist., Karnataka, E-mail: [email protected]
7
Introduction
Entrepreneurs are the individuals who recognize the opportunities, pursue the activity, assume the risk, generate the employment, create the market, fulfill the needs of and expectations of the society and thus contribute for the overall development of the society. The development in England is the result of speedy industrialization and the role played by the entrepreneurs, particularly in the latter part of the industrialization.
Literature Review
Rajkumar S.S. T in his study found that the micro, small and medium enterprises (MSMEs) sector contribute significantly to the manufacturing of goods, employment and exports of the country and provide the maximum opportunity for both self-employment and jobs after agriculture. The study concluded that unplanned urbanization can be avoided by the establishment of small centres of industrial production all over the country.
Obsan Keninde A and Adediran Ulanrewaja Adewole in their study on small and medium scale enterprises and economic growth in Nigeria from 1980 to 2008 found that the Nigerian economy has developed due to the fact that the SSI will assist in employment generation, stimulation of entrepreneurship, mobilizing hidden capital in the economy, creating a middle class of self employed entrepreneurs, development and utilization of local technology, steaming rural-urban migration to facilitate the use of local materials and leads to equitable distribution of income and wealth.
According to J.B Say an entrepreneur is the
economic agent who unifies all means of
production. Jan Timbergen points out that the
who uses much capital, but rather the man who
knows how to organize the employment and
training of his employees. Whoever concentrates
on this is rendering a much more important
service to his country than the man who uses huge

Vol. 2, No. 1, May 2014IUJ Journal of Management
8
capital. Vasanth Desai has defined the term
entrepreneur as one who detects and evaluates a
new situation in his environment and directs the
making of such adjustments in the economic
systems as he deems necessary.
Objectives of the Study
The present paper makes an attempt to analyse/study the contribution made by the entrepreneurs to the society in terms of employment generation and support others to setup their units. The association between investment and employment generation, sales turnover and employment generation and nature of activity and employment generation is analysed by using co-efficient of contingency statistical tool.
Hypotheses
The following hypotheses were set to achieve the above objectives.
H There is significant association between 1
capital employed and employment generation.
H There is no significant association 0
between capi ta l employed and employment generation.
H There is significant association between 1
turnover and employment generation.H There is no significant association 0
between turnover and employment generation.
H There is significant association between 1
activity and employment generation.H There is no significant association 0
between activity and employment generation.
Obsan Keninde A and Adediran Ulanrewaja Adewole in their study on small and medium scale enterprises and economic growth in Nigeria from 1980 to 2008 found that the Nigerian economy has developed due to the fact that the SSI will assist in employment generation, stimulation of entrepreneurship, mobilizing hidden capital in the economy, creating a middle class of self employed entrepreneurs, development and utilization of local technology,
steaming rural-urban migration to facilitate the use of local materials and leads to equitable distribution of income and wealth.
Methodology and Design
The present paper is the outcome and extracts of a research (field survey) conducted in Uttara Kannada district of Karnataka state on entrepreneurship development. The research covered 500 sample units distributed in all the 11 taluks of the district. The sample size is decided by;
2 2S=z [P(1-P)]eWhere, S= Sample size
Z= The number relating to the degree of confidence wish to have in the result.
P= An estimate of the proportion of people falling into the group in which researcher interested in the populationE= Sampling error
Due weightage was given to entrepreneurs from different background, both community and family, age, education, income level, nature of activity etc. The data is analysed by using percentage and co-efficient of contingency. The formula used is,
2 x
Co-efficient of contingency = -----------2 x +N
2 2X =(O-E) /E
The result of the co-efficient of contingency always lies with ±1. If the result is >0.5, there is significant relationship exists and if it is <0.5 relationship is negligible.
Hypotheses Testing
Entrepreneur is the provider of employment and
in a most populous country like India; he/she
reduces the burden on the government or freeing
the government from the burden of providing
employment. The level of employment
generation is influenced by the capital
investment, sales turn over and nature of activity.
The extent ofrelationship between investment,

2X =411.88 Co-efficient of Contingency=
---------- = --------------- = 0.6722 x +N 411.88+500
2 x 411.88
Vol. 2, No. 1, May 2014IUJ Journal of Management
Table 1 Investment and Employment Generation
Investment (In $.)
EMPLOY EES (No.)
>2,00,000 2,00,000 to
5,00,000
5,00,000 to
10,00,000
10,00,000 to
20,00,000
20,00,000 to
50,00,000
>50,00,000 TOTAL
No. X2 No. X2 No. X2 No. X2 No. X2 No. X2 Self 13 29.64 0 3.74 0 2.24 0 1.82 0 1.09 0 0.88 13 1 to 3 71 31.37 51 1.52 19 1.71 6 10.5
9 2 8.84 0 10.13 149
3 to 6 37 0.38 68 8.84 33 0.75 18 1.13 8 2.48 1 9.31 165 6 to 9 0 15.62 15 0.54 16 2.46 20 14.1
7 7 0.55 5 0.12 63
9 to 12 2 7.28 6 3.51 12 2.60 18 22.75
6 1.44 0 2.99 44
12 to 15 0 3.22 2 0.81 1 0.68 5 5.56 3 3.33 2 1.41 13 15 to 75 1 11.23 2 11.5
3 5 1.86 3 2.63 16 29.9
5 26 139.1
8 53
TOTAL 124 98.74 144 30.49 86 12.30 70 58.65 42 47.68 34 164.02 500
9
turnover and nature of activity with employment generation is analysed here and hypotheses are tested.
1. Investment and Employment Generation
Table 1 presents the data relating to the employment provided in numbers across the amount of investment.
Inference: Since the co-efficient of contingency is more > 0.5, there is significant relationship between investment and employment generation.
Hypothesis Testing
Since calculated value of co-efficient of contingency (0.672) is greater than 0.5 the first alternative hypothesis that “There is significant association between capital employed and employment generation” is proved.
2. Sales Turnover and Employment Generation
The turnover of entrepreneur is likely to decide the number of personnel to be appointed. The units with higher turnover can provide employment to many people and there by contribute for the society. In the study area the entrepreneurs are running their units with a meager annual sales turnover of Rs. 1,00,000 to Rs. 50,00,000. Table 2 presents the data relating to employment provided across the sales turnover.
Inference: Since the co-efficient of contingency is more > 0.5, there is significant relationship between investment and employment generation.
Source: Primary Data

Vol. 2, No. 1, May 2014IUJ Journal of Management
Sales (In $.)
Employees (No.)
100000 to 200000
2,00,000 to 5,00,000
5,00,000 to 10,00,000
10,00,000 to
20,00,000
20,00,000 to
50,00,000
500000 to 50000000 Total
No. X2 No. X2 No. X2 No. X2 No. X2 No. X2 Self 12 17.27 1 1.77 0 1.90 0 2.24 0 0.49 0 1.04 13 1 to 3 85 37.93 41 0.03 11 5.32 11 8.35 1 3.84 0 11.92 149 3 to 6 44 0.48 66 10.7
3 27 0.35 21 1.92 3 1.71 4 6.41 165
6 to 9 6 8.58 10 2.81 14 2.51 26 21.22
4 1.08 3 0.83 63
9 to 12 0 13.02 10 0.27 12 4.83 16 9.39 4 3.24 2 0.66 44 12 to 15 0 3.85 2 0.63 3 0.64 4 1.39 3 12.7
1 1 0.00 13
15 to 75 1 13.75 4 7.33 6 0.39 8 0.14 4 1.96 30 156.50
53
Total 148 94.87 134 23.57 73 15.94 86 44.65 19 25.03 40 177.36 500
10
Inference: Since the co-efficient of contingency is >0.5, there is significant relationship between sales turnover and employment generation.
Hypothesis Testing
Since value of co-efficient of contingency is 0.658 which is greater than 0.5, the second alternative hypothesis that “There is significant a s soc ia t ion be tween turnover and employment generation” is accepted.
3. Nature of Activity and Employment Generation
The entrepreneurs engage in production, processing, trading and servicing activities. The industrial entrepreneurs usually provide employment to large number of people, while the scope for providing employment is limited in trading organizations. The availability of raw materials, geographical features, entrepreneurs' willingness to take the risk etc., will influence the nature of the units coming up in that area. Big manufacturing units are limited in hilly regions compared to maidan regions. For instance in states like Uttaranchal and Chattisgad, big manufacturing units cannot be seen. But large number of sugar factories are concentrated in maidan part of Uttar Pradesh and Maharastra. Large part of the study area is bounded by forest and the district stood first in terms of forest area. Hence the scope for establishment of bigger units is limited. The provision/generation of employment across nature activity is analyzed with below Table.3.
2X =411.88 Co-efficient of Contingency=
---------- = --------------- = 0.6582 x +N 381.42+500
2 x 381.42
Source: Primary Data
Table 2Sales Turnover and Employment Generation

2X =122.5 Co-efficient of Contingency=
---------- = --------------- = 0.442 x +N 122.5+500
2 x 122.5
Vol. 2, No. 1, May 2014IUJ Journal of Management11
Inference: Since the co-efficient of contingency is <0.5, there is no relationship between nature of activity and employment generation.
Hypothesis Testing
Since value of co-efficient of contingency is 0.44, which is less than 0.5, the third null hypothesis that “There is no significant association between activity and employment generation” is not possible to reject.
4. Supporting Role
An entrepreneur on reaching a particular stage or on reaching his destiny can support other to start an ancillary unit or develop a supporting unit. The assistance or support can also be given by offering training to prospective entrepreneurs, providing technology, finance, materials, raw-material supply orders, moral support etc. The study revealed that out of 500 entrepreneurs, 181 entrepreneurs constituting 36.20 percent to total have supported the others in becoming the entrepreneurs.
5. Conclusion
The paper in brief analyzed the contribution of entrepreneurs in a thinly populated district by providing employment and supporting others in becoming entrepreneurs. The generation, sales turnover and employment generation but nature of activity had played little role with employment generation. It is observed that the entrepreneurs in the study area have provided employment to a maximum of 75 persons in the study area.
References
· Bisht, Narendra S. and Bisht, Pamila S. E n t r e p r e n e u r s ' E x p e c t a t i o n s a n d Experience, Himalaya Publishing House, pp.278-287.
· Desai, V. (2000) The Dyanamics of Ent repreneur ia l Development and Management, Fourth and Revised Millenium Edition, Himalaya Publishing House, P.18.
· Guptha, S. P. (2007) Statistical Methods, Sulthan Chand and Sons, New Delhi.
· Hambrock, J. and Sebastian H. (2011) Industrialization in India.
· Hoselitz, B. T. and Moore W.H (1963)., Industrialisation and Society, UNESCO, Monton.
· Kehinde, O. A. and Adedran Olanrewaja Adewule (2011) “Small and Medium Scale Enterprises and Economic Growth n Nigeria”, International Journal of Research in Social Sciences, Vol.I, Issue 2, Nov.,pp..20-46.
Source: Primary DataNote: Main activity of the unit is considered to calculate number of employees working.
Table 3 Nature Of Activity and Employment Generation
Nature of Activity (In $.)
Employees (No.)
Manufacturing Processing Service Trade TOTAL
O E X2 O E X2 O E X2 O E X2 Self 35 66.16 14.67 9 20.86 6.74 73 39.93 27.38 32 22.05 4.49 149 1 to 3 78 73.26 0.31 21 23.10 0.19 37 44.22 1.18 29 24.42 0.86 165 3 to 6 30 27.97 0.15 13 8.82 1.98 12 16.88 1.41 8 9.32 0.19 63 6 to 9 30 19.54 5.60 9 6.16 1.31 3 11.79 6.56 2 6.51 3.13 44 9 to 12 9 5.77 1.81 4 1.82 2.61 0 3.48 3.48 0 1.92 1.92 13 12 to 15 37 23.53 7.71 13 7.42 4.20 1 14.20 12.28 2 7.84 4.35 53 15 to 75 3 5.77 1.33 1 1.82 0.37 8 3.48 5.85 1 1.92 0.44 13 TOTAL 222 31.58 70 17.40 134 58.14 74 15.38 500

Vol. 2, No. 1, May 2014IUJ Journal of Management12
Kothari, C. R. (2008) Research Methodology-Methods and Techniques, Second Revised Edition, New Age International (P) Limited, New Delhi.Peter, K. (1971) Entrepreneurship and Economic Development, The Free Press, New York.Say, J. B. (1924) A Treatise on Political Economy, Boston, Vol.2, pp.55-59.Tinbergen, J. Cited in Vasanth
Desai(2008)., Small Scale Industries and Entrepreneurship, Himalaya Publishing House, P.340.Topandasan, Rajkumar S. (2010)“Performance of Small Scale Industries in India”, Southern Economist, Vol.48, No.6, July 15, pp.5-7.

Vol. 2, No. 1, May 20141 Research Scholar, STRIDE, IGNOU and Advisor, ICT, MHRD, Government of India 2 Associate Professor in Distance Education, STRIDE, IGNOU
13
Introduction
India, with over 1.2 billion population, has a huge demand for higher education. The conventional system of face-to-face education alone will not able to meet the continuously growing demand. Open Distance Learning (ODL), which is an organized form of self-study, in which teaching-
learning is carried out remotely, can be a powerful tool to bridge the huge demand-supply gap and can provide access to education for anyone from anywhere and any time. ODL owes its origin largely to the fast paced socio-cultural, political and technological growth of the modern era. The concept of education may be defined as “ any meaningful communication “ whereas , if it is written or produced in multi/multiple media then it is called open and distance
Effectiveness of Video Teleconferencing in Teaching – Learning in Open Distance Learning Institutions in India
Ravi Ayyagari1 and Rampelli Satyanarayana2
The people who are working for open and distance education need to have sound knowledge of systemic issues (i.e. issues pertaining to teaching at distance and its methodologies) and at the same time, they should have sound knowledge of their own discipline of study. The concept of education may be defined as “ any meaningful communication “ whereas , if it is written or produced in multi/multiple media then it is called open and distance education. In the developing countries’ context, particularly, in the age of globalization, it is perceived that the age-old bullock cart and the aircraft are going together. In the teaching learning methodologies at distance, a blended learning approach is gaining movement, wherein the method and media are meaningfully blended, based on the context, purpose and relevance. The learning environments of today are gradually being transformed by the use of Media ICTs and the use of multimedia technologies has become a vital component of the teaching learning process. The extensive use of multimedia in education depicts the convergence of the developing computing technology and internet technology leading to an enriched teaching learning process. Educational multimedia systems endeavor to make learning easier, more convenient, and thus more effective. Radio and Television have been used to deliver innovative educational content, as they have a wider reach. This paper presents the use and effectiveness of Video – Teleconferencing technology in Open Distance Learning (ODL) in India. Besides, it also analyses the practices of two leading ODL Institutes in India, IGNOU and BRAOU to enhance “interactivity “between Learners and Teachers. And it briefly touches on Tony Bates model for selection of appropriate technologies in ODL. Finally, the paper proposes a framework on how teleconferencing can be more effectively utilized in ODL. Keywords: Open Distance Learning, Video Conferencing, Multimedia, Teaching- Learning, Effectiveness, Evaluation

Vol. 2, No. 1, May 2014IUJ Journal of Management14
education . Dohmen (1977) views ODL as “a systematically organized form of self-study, in which student counseling, the presentation of learning material and securing and supervising of students is carried out remotely by a team of teachers, each of whom has responsibilities”. It is made possible at a distance by means of media which can cover long distances.
The National Policy of Education (1986) expressed the need for utilizing all available media for educational purpose. Distance teaching-learning process is being identified as multi-/multiple media learning system, i.e. learning through multi-media like audio-video, radio, television, teleconferencing, and through other electronic media. “The technology mediation helps in overcoming the space and time limitations and design educational process based on learner's needs. The mismatch between supply and demands, quality issues can be balanced through leveraging technology deployment .The basic concept of ODL, being its availability anywhere, everywhere and all time education, finally the whole ICT issue should not be seen as a religious practice or as a dogma. On the contrary, it should be viewed as one of the important tool to practice teaching-learning process” (R.Satyanarayana, 2002). ISRO originally used INSAT for one-way video two-way audio in the 1993 for school and collegiate educational purposes and in-service training. This system, called as the Training Development and Communication Channel (TDCC) is a regular operating system since 1995.
India with over 1.21 billion people (2011 census), which is more than a sixth of the world's population, is projected to be the world's most populated country by 2025 , with huge demand for higher education. The conventional system of education alone will not able to meet the continuously growing demand. Presently, India has the rare distinction of having one national Open University, fourteen state open universities and 200 dual mode universities.
Use of technology in Open Distance Learning – Role of Video conferencing
Breath-taking developments in Information
Communication Technology (ICT) have been effective in increasing the efficiency and productivity of economies, industries and organizations. Video conferencing is one of the most notable innovative technologies of the current century. This new technology , for some time, considered to be of great values for businesses, is now being used increasingly in education as an enabler to improve teaching-learning effectiveness in ODL. The pressing need for bridging the gap between the conventional method of education and the burgeoning learner community led to the use of educational teleconferencing, as a powerful medium for distance learning.
The only way for our education system can reach the learners in the widely dispersed remote areas of the country, particularly considering the huge demand-supply gap for qualified teachers, is through technologies like video conferencing. The use of technology in ODL can provide immense support to the teaching/learning process by increasing the interactivity, improving the structure and organization of materials, overcoming the cost and distance barriers, providing access to remote databases and the knowledge pool apart from providing rapid feedback that enhances counseling and evaluation. Tele-counseling / teleconferencing can be a cheaper alternative, which provides an opportunity for learner-teacher interface through audio mode. Teleconferencing is an electronic means which can bring together learners in groups at different (but limited) locations and discuss their problems with the teacher/tutor stationed at a different location.
Types of Teleconferencing and how they can Enhance Learning at a Distance
There are three types of teleconferencing:
1. Audio teleconferencing
2. Video teleconferencing
3. Computer teleconferencing.
The last two types of teleconferencing are widely used in the distance education

Vol. 2, No. 1, May 2014IUJ Journal of Management15
Vi d e o t e l e c o n f e r e n c i n g ( a l s o v i d e o conferencing) combines the audio and visual m e d i a t o p r o v i d e i n t e r a c t i v e v o i c e communications and television pictures. The images include anything that can be captured by a television camera. Though full motion video (such as that transmitted on home television) is the most familiar technology, a number of options exist, including freeze-frame television, compressed video systems, and full motion video s y s t e m s . I t i s a s e t o f i n t e r a c t i v e telecommunication technologies which allows two or more locations to interact via two-way video and audio transmissions simultaneously. It has also been called visual collaboration and is a type of groupware. Video teleconferencing has become the most viable solution for distance education.
Computer conferencing permits two or more people to communicate with each other via computer terminals in a non-real-time mode. It is like "electronic mail" because the user can put a message into the computer and have it retrieved and answered later. But conferencing technology goes further. Specific software programs have been developed that permit members of a conference to interact with each other and to access a wide variety of stored information relevant to their objectives. Computer conferencing adapts to course teaching, student counseling, and informed information exchange. Interactive television (ITV) is emerging as a new media and a tool for conferencing, training and education. ITV is a television with interactive content. It refers to two way electronic communication between two or more groups or three or more individuals who are in separate locations. It combines traditional TV watching with interactivity of the internet and the personal computer. (Madhu Parhar, 2006)
Multiplier effect of Teleconferencing system
Every teleconferencing offers multiplying benefits. The recordings of all these sessions can also be made into a learning material repository. All the teleconferencing sessions are recorded and copied onto CD/VCD's, which are made available at the study centers. This helps in repeated use of the material by learners, who might have missed the session, or for may repeat
it, for better understanding and future references of the study material. The reactions and ideas of the learners that are collected serve as inputs for fur ther systemat ic evaluat ion of the teleconferences. “The ODL system has to collaborate and cooperate without reinventing the wheel. Therefore, it is necessary to provide space for innovation in diversity. There is a need to encourage competition in collaboration and one of the ways would be to create a pool of best materials so that these are available off the shelf with due recognition to the contributing institutions. Moreover, moving towards e-learning and creating national repositories will enable us to compete globally in consortia mode”. (V.Venkaiah, 2006).
Teleconferencing enables dispersal of the learning resources, simultaneously among several geographically dispersed learners in minimal time. The multiplier effect is observed by training the trainers with uniform content. Also, the biggest advantage is the repeatability of training courses/materials and their updating and dissemination despite of the geographic diversity. The increased interaction capability naturally results in increased learning gains. Various user groups share the network it is also possible to organize specific video conferencing sessions for a separately identified group with different needs. All these advantages result in tremendous cost-cutting in travel, logistics and in repetition of teaching infrastructure. (Madhu Parhar, 2006). Another advantage of the multiplier effect is that it contributes to the repository of digital learning material/ knowledge and enhances the learning process of the learners of the institution.
ICT usage in ODL in India
In India, a number of initiatives aimed at promoting the use of ICT have been taken up. According to World Bank report, almost all the states in the country are implementing central schemes such as ICT @ Schools, SSA, Mission on Education through ICT and have significant number of students enrolled in open learning systems at the school and college levels. There is a diffusion of ICTs in Indian Universities and colleges to meet the educational requirements of
today. A number of ODL Institutions in India have been using ICT and media to improve effectiveness of teaching-learning processes. In the following paragraphs, an attempt is made to analyse the use of ICT and teleconferencing, in particular, in two leading ODI institutions in India, Indira Gandhi National Open University (IGNOU) and Dr.B.R.Ambedkar Open University (BRAOU).
Indira Gandhi National Open University – The People's University of India
With the inspiration and support from the UKOU and Japan, the Indira Gandhi National Open University (IGNOU) was established on September 20, 1985 by an Act of Parliament, for development of higher education in the country through the Open and Distance Learning (ODL) method. The “People's University” as it is aptly called, has currently over 228 programs of study through 2,000 courses with staggering 3 million students. IGNOU offers need based academic, professional, vocational generating and skill oriented programmes, leading to certificates, diplomas and degrees (Bachelor's, Master's and Doctoral). The focus of the programmes is to meet various academic and employment needs of the people, especially those of the disadvantaged sections of the society.
Multimedia Approach at IGNOU
IGNOU, a leader in the field of ODL, has adopted a multimedia approach for reaching out to its learners. Different communication technologies are used in IGNOU's instructional system though with technological developments over time there have been significant changes in the use of different media. The instructional packages for learners include self-instructional print and audio/video materials, radio and television broadcasts, interactive radio counselling, face-to-face counseling, laboratory and hands-on e x p e r i e n c e , t e l e c o n f e r e n c i n g , videoconferencing, CD-ROMs, and Web-based content delivery. IGNOU has taken certain major initiatives towards the development of interactive multimedia content and learner support through web-based platforms for the distance learners
IGNOU currently offers a range of programs in different disciplines and at different levels (Certificate, Diploma, PG Diploma, Bachelors degree, post-graduate degree and Doctorate). All the academic programmes of the university have multi-media support with facilities for audio, video, radio, television, interactive radio and video counseling, and teleconferencing. IGNOU runs a 24-hour educational TV channel Gyan Darshan in collaboration with other institutions of higher learning. Gyan Vani is a huge cooperative network of FM radio stations, exclusively devoted to education.
IGNOU adopts a “Blended Learning” approach, which is essentially a judicious blend of two different learning environments, traditional face-to-face classroom methods and the modern state-of-the-art-technology video teleconferencing sessions. (Murthy & Satyanarayana, 2006). IGNOU has established a training unit, Staff Training and Research Institute of Distance Education (STRIDE), which offers programmes not only to its staff but also to other ODL institutions. STRIDE uses both face to face and modern technology like Edusat and others in providing training to their own widespread network of Regional Centres (RCs) and Study centres (SCs) and other ODL institutions.
Collaboration between IGNOU and ISRO
ISRO experimented with Training and Development Communication Channel (TDCC) which supports one-way video-two way teleconferencing interactive networks for education and training to introduce interactivity in teaching instructions. TDCC Proposed to utilize exclusively for distance education and Interactive Training Programmes (ITPs) by states like Karnataka and Orissa. Nevertheless, to enhance the interactivity with the learners, one - way video, two - way audio communication facility is being offered by EMPC-IGNOU jointly with Indian Space Research Organization (ISRO). This satellite based communication in real time is made available on the extended C-band transponder of INSAT 2C. It is a multiple-user facility being shared with other educational and training organizations in the country. IGNOU uses the facility for following activities: Tele-
Vol. 2, No. 1, May 2014IUJ Journal of Management16

counseling to student groups: Training Study C e n t r e C o u n s e l l o r s / C o - o r d i n a t o r s Administrative interaction with Regional Centre functionaries Extended Contact Programmes (ECP) with students.
eGyanKosh
Open educational resources (OER) are digital materials that can be re-used for teaching, learning, research and more, made available for free through open licenses, which allow uses of the materials that would not be easily permitted under copyright alone. Online video is a flexible learning resource aimed to enhancing teaching and learning with digitalized resources, which can be used in a wide spectrum of teaching spaces. It allows peer groups to interact with each other and allows for more accessibility. IGNOU's portal, eGyanKosh, shares digital learning resources, print and audio-video content developed by open and learning institutions in India. The learner has better opportunity to access the required material (the recorded and edited teleconferencing sessions) at any time from any place from the eGyankosh
Dr.B.R.Ambedkar Open University - the first open university at the state level
Dr.B.R.Ambedkar Open University (BRAOU), previously known as Andhra Pradesh Open University, was the first Open University at the state level, established in Hyderabad in August 1982. The university, with its motto "Education at Your Doorstep”, operates with over 206 study centers across the state. The special feature of BRAOU is that it offers equal access to higher education; especially to the socially disadvantaged, the geographically isolated with no access to higher education , women and working people who are aspiring to improve their academic and professional skills. As with any open university, BRAOU offers flexibility in terms of admission, choice of programmes, duration and age requirements, teaching methods and evaluation procedures. (BROU profile 2011). It offers undergraduate, postgraduate and research programmes in a range of disciplines.
Multi-media teaching-learning approach at BRAOU
BRAOU follows a multi-media teaching-learning approach comprising of self-learning print material, supported by audio, video lessons and regular broadcast of lessons through All India Radio. The University started Telecast of Video lessons through Doordarshan Regional Channel from 1999. “Since 2002, BRAOU has been delivering telelectures ( three hours a week) through interactive channel of Mana TV, a Ku band channel on INSAT -3C owned by the Government of Andhra Pradesh. BRAOU has also been organizing teleconferencing on Doordarshan Kendra Hyderabad's regional transmission (five days a week) to ensure deeper coverage.
What technologies to use in Open Distance Learning?
Today, a plethora of Information and
Communications Technologies are available that
can be deployed to make teaching-learning more
effective in an ODL Institution. A question arises
as to which technologies are to be selected in a
specific instance, as profile of learners, type of
the course, course objectives, duration etc may
vary. Tony Bates (1995) created a framework
for selecting learning technologies, which is still
relevant today. One of his main concerns,
prompting the development of ACTIONS, was
the way face to face course material was adapted
for web or other distance learning approaches.
Bates felt the traditional remote instructor
concept is nothing more than face-to-face
instruction, without direct interaction. Bates also
felt that these specific scenarios often fail to take
advantage of the unique benefits that are
available through the specific technology being
used. The organizing framework that Bates
created is called ACTIONS, which stands for
Access, Cost, Teaching and learning
Vol. 2, No. 1, May 2014IUJ Journal of Management17

implications, Interaction, Organizational issues,
Novelty and Speed. These criteria, however, need
to be contextualized before application. The
following is a brief description of these criteria,
with reference to Tele Conferencing.:
Access:
Easy accessibility of media and technology to the
teachers as well as the learners is the most
important variable. The learners must be able to
easily comprehend both the language and the
technology.
Cost:
It is the cost which decides upon the choice of the
technology and the media. However, in
teleconferencing, development, delivery and
interaction is a simultaneous process. The unit
cost, i.e., the cost per leaner is a critical deciding
factor.
Teaching and Learning:
In order to achieve the specific teaching-learning
objectives, media may be used as a
supplementary independent complementary or in
an integrated manner.
Interactivity and User-friendliness:
Another critical factor is the ability of the media
used to facilitate interactivity. Also, both, the
teaching and learning community must be at each
to use the technology.
Organizational Issues:
The strengths and weakness of the organization
will obviously determine the quality production,
sustainability of media and use.
Novelty:
Novel and state of the art technology and its
adaptation in the teleconferencing sessions is
another critical factor.
Speed:
The preparedness of the teaching faculty in order
to adapt integrate the new technology at hand
contributes greatly to the success of
teleconferencing session.
How can a teleconference system be used effectively?
In order that Teleconferencing is effective, meticulous planning is of vital importance. It is important to understand the needs and the aptitudes of the participating learners, before content and duration of the session are decided. There is need for effective co-ordination among the staff involved in the operation of the teleconferencing. Preparatory material like printed guides, including charts and diagrams, must reach the students well in advance to enable them to effectively participate in the session. The p r in ted mate r ia l enr iches the v ideo teleconferencing session. It is very important for the learner to be prepared well in advance about the content, the learning objectives of the session and about the teleconferencing system as a whole. The learner must be psychologically prepared to interact with the teacher through the audio system. The instructor / facilitator may adopt a friendly and informal attitude to add the human touch to the discussion and must speak directly into the camera with a clear audible voice. It is imperative for the teacher to possess sound communication skills. Adequate time must be allocated for interactive discussions, which may also include question-answer sessions.
Parameters for evaluation of effectiveness Following parameters are used to judge the usage, interactivity and its effectiveness in using video-conferencing technology in teaching /learning process in ODL. Usage: ODL Institutions made a humble attempt to use the state of the art technology which includes multi media packages for teaching and learning process to impart knowledge to isolated learner in the ODL institutions. While accessing
Vol. 2, No. 1, May 2014IUJ Journal of Management18

the usage the interactivity design its teleconferencing sessions are taken as important parameters, this is to be studied in this work as effective tool to judge its usage, however, the experience is an important parameter in any media multiple media educational system.
Interactivity: While studying the usage of media the important parameter is its interactivity, the interactivity between teacher and leaner ends. A Videoconference (also known as a video teleconference) is a set of interactive telecommunication technologies which allow two or more locations to interact via two-way video and audio transmissions simultaneously. It has also been called visual collaboration and is a type of groupware interactivity is otherwise linked with the usage of video conferencing by its effectiveness is to be judged.
Effectiveness: effectiveness is another parameter to judge the video conference usage, interactions and its effectiveness. The gambit of ODL is sad to be the gambit of learners support system.Where the satisfaction and achievement in times of understanding knowledge status is very important in such process. The ODL learner levels of participation also judged beside experts' comments/opinions on (exposed factor) playback recorded video conferencing sessions are also viewed from the general public point of view.
How to Evaluate Effectiveness?
In order to evaluate effectiveness of video conferencing in ODL Institutions, a survey must be conducted , which consists of questionnaires prepared covering a range of pedagogic, content, access, and effectiveness issues related to teleconferencing. In-depth interviews need to be conducted - informal as well as formal – with experts who are associated with teleconferencing system at present and past schedules. In addition, observation method will be used during the scheduled teleconferencing sessions of the ODL Institutions.
Sourcing of DataThe following means are adopted for sourcing data and information for the study:· Feedback from teachers
Feedback from learners·Interviews with senior officials and other prominent persons those are associated with the video teleconferencing at present or in the past.
· Researcher 's own first-hand experience
Conclusion
Teleconferencing systems, if used effectively, can be an enabler of effective teaching-learning processes in ODLs. More so, in a vast country like India, it can be a powerful tool in delivery of education to any one, anywhere, any time, and cost effectively. However, it needs meticulous planning and impeccable implementation to realize its benefits. Also, there is need for periodic evaluation of such systems so that issues, if any can be addressed. References
· Archer, W. (1999) , Del iver ing univers i ty- level communicat ion programs at a distance: Benefits, costs, and disruptions, Canadian Journal of Educational Communication, 24, pp. 369-383.
· Baker, R.A., & Hansford, B.(1990) Evaluation of a cross-campus interactive video teaching trial. Distance Education 11 (2), pp. 286-307 ,1990
· Bates, Tony (1995), Technology, Open Learning and Distance Education, Routledge Publishers.
· David sewart, Desmond Keegin and Borje Halmberg (1983), Distance Education, International Perspective, , P.235, St. Martin Press Inc., New York , U.S.A.
· Faure et al. (1973), P.2 , A.P. Giri, School Broadcast Programmes , Problems and prospects, 1991, Deep and Deep Publications , New Delhi.
· Graham, M. (1984) New Technologies in Canadian Education. Toronto: Ontario Education Communication Authority, Paper 14.
· Gunter, B. (1979) Recall of brief television news items: effects of presentation mode, picture content and serial position. Journal of Educational Television 5, (2), P.57-61.
Vol. 2, No. 1, May 2014IUJ Journal of Management19

· Idrus, R. (1993) Collaborative learning through teletutorials. British Journal of Educational Technology 24 (3), pp. 179-184
· Kumar, K.L. (1996) Educational Technology, New Age Int Publisher, N e w D e l h i , 1 9 9 6 ·Murthy&satyanarayana(2006),. Four Decades of Distance Education in India, Non-Teaching and Professional Staff Development Viva Books Pvt Ltd, New Delhi. P. 428
· Rampelli Satyanarayana,(2004), Student Support Services And Open Learning in an Open University, p.195, Counselling Services Mittal Publications, New Delhi, 2004.)
· Rumble, G. (1992) The competitive vulnerability of distance teaching universities, Open learning 7 (2), pp. 31 – 45
· S.K.Waghmore (1992), Metropolitan Book and Co., New Delhi.
· Santosh Panda, (2006) STRIDE Handbook, Media and Technology in Distance Education, P.61., IGNOU, 2006
· Satellite in Education, Madhu Parar, Shipra Publications, P.83 , New Delhi, 2006
· Sinha A, Kishore D, & Hashmi J.N., ( ! 9 9 4 ) R e p o r t o f Tr a i n i n g & Development Communication Channel Experiment , EMPRC: Indira Gandhi National Open University
· Suresh Garg, V.Venkaih, Chambi puranik, Santosh Panda (2006), Four Decades of Distance Education in India, Viva Books Pvt Ltd, New Delhi. Technology and Teacher Education International Conference 2001(1),
· Venkaih.V (2005). Educational Media in Dr. Ambedkar Open University with special refernce to teleconferencing in Reddi,U &Mishra, S. (eds)., Educational M e d i a i n A s i a . Va n c o u v e r : Commonwealth of Learning.
· Waghmer, S.K., (1992) Audio Video Education, P.53, Metropolitan book Co. Pvt. Ltd., New Delhi, 1992.
· Walsh, J., & Reese, B. (1995) Distance learning's growing reach. Technological
Horizons in Education Academic Publishers,1995
· Yost, N. “Lights, Camera, Action: Videoconferencing in Kindergarten.” Society for Information
· Abstract , (1995 ) Evaluation of Interactive Video Conferences as Medium for Professional Continuing Education, Journal of the American Dietetic Association, Volume 95, Issue9, Supplement, Page A17, September 1995
· AIOU News 2001, p.22, Allama Iqbal Open University,Islamabad, Allama Iqbal Open University (AIOU). (1999). V i c e C h a n c e l l o r ' s A n n u a l Report.Islamabad
· Allama Iqbal Open University (AIOU). (1999). Vice Chancellor's Annual Report.Islamabad: AIOU Report No. 40, June (2001) Fifth Generation Distance Education, Department of Education, the potential impact of e-business on Training and Youth Affairs, Higher Education Division Australia, www. highereddetya.gov.au
· IGNOU (2000). Course ES-318: Communication Technology for Distance Education, Post Graduate Diploma in Distance Education programme, New Delhi: IGNOU
· IGNOU Profile (2002), Indira Gandhi National Open University, New –Delhi, India pp 51.
Vol. 2, No. 1, May 2014IUJ Journal of Management20

Vol. 2, No. 1, May 201421
Information Technology Initiative at Life Insurance Corporation (LIC) of India
Tulsi Modi1 and Dipak kr. Shukla2
A major technology initiative at Life Insurance Corporation (LIC) of India started in the year 2012-13 being on a high note for online sale of policies. In addition to the process of eFEAP implementation which was done in all the offices, e-audit had also been developed and released. The completion of Enterprise Document Management System (EDMS) project was a vital job done and the gearing up the Enterprise Portal Solution (EPS) in the Internet was a major success. More services for the convenience of the policy holders were introduced. LICMobile, an android based smartphones was deployed for the general public. Datawarehouse, such as LIC's CADW that stores customers databases for the decision making processes have also been deployed being the largest life insurance customer databases in the world. A huge savings in cost has also been brought about by utilizing the video conferencing units at all divisions of LIC. This study depicts the key success factors of information technology initiatives done at LIC of India. Keywords: Technology, eFEAP, EDMS, project, EPS, smartphones, datawarehouse.
Introduction
Life Insurance Corporation (LIC) of India, established under LIC Act, 1956, is the largest insurer in India and has spearheaded the financial and infrastructure development of the nation. The performance of LIC has been exemplary, as it has been growing from strength to strength, be it customer base, agency network, branch office network, and the like. LIC has played a significant role in spreading life insurance among the masses and mobilization of people's money for people's welfare. Even after the entry of private insurers for almost a decade now, LIC continues to be the frontrunner in the industry in terms of market share in life insurance.LIC today renders service to its customers through 8 Zonal offices located at Mumbai, Delhi, Kolkata, Chennai, Hyderabad, Kanpur Bhopal and Patna. There are 113 Divisional Offices, 2048 branches, 1275 Satellite Offices (SOs), over 1.16 lakh employees and 11.72 lakh agents. Besides life insurance, through its various subsidiaries, it is involved in providing various financial services viz. Pension (LIC Pension Fund Ltd.), HousingFinance (LIC HFL Ltd), Mutual Fund (LIC Nomura MF), Credit cards (LIC Card
Services Ltd), Financial Products distribution (LIC HFL Financial Services Ltd) and LIC HFL Care Homes Ltd. It also provides insurance services in several countries abroad through branch offices, Joint Ventures (JVs) and a wholly owned subsidiary.
The Information Age is a global phenomenon that is reshaping economies and blurring geographic borders. IT significantly increases the range of potential activities for businesses, enabling organizations to become leader in the global economy. The year 2012-13 had been important for LIC of India as major information technology initiatives had been taken to render the various services not only to its customers but also to all the stakeholders. A major technology initiative that started in the year 2012-13 on a high note was the launch of the systems for online sale of policies. The process of eFEAP implementation that was done in all the offices and e-audit had also been developed and released as a part of software development endeavor. The completion of EDMS project was a vital job done and the gearing up the
1 Former Head - University Department of Commerce and Business Management, Ranchi University, Ranchi. 2 Faculty member, FMS, IUJ, Ranchi, E-mail ID: [email protected]

Vol. 2, No. 1, May 201422
Enterprise Portal Solution (EPS) in the Internet was a major success. LIC has strategically provided this web-based self-service interface to all the stakeholders. More and more services for the convenience of the policy holders were introduced. LICMobile, LIC's official in-house and an android based smartphones was deployed for the general public. Datawarehouse which stores the customers databases for the decision making process has also been deployed in the name LIC's CADW being the largest life insurance customer databases in the world. A huge savings in cost has been brought about by utilizing the video conferencing units at all divisions of LIC of India. The key success factors of information technology initiatives are being depicted here.
All the branches and units are computerized and connected with other offices of the Corporation through a Wide Area Network. Corporation has also launched portals for customers and agents. The Corporation has provision for premium calculator, premium payment gateway and online underwriting (limited) already available on its website www.licindia.in.
2. Objectives of the Study(1) To understand the initiatives done in the
field of information technology by LIC
of India in the recent years.
(2) To analyse the effect of information
technology initiatives from customer's
perspective.
3. Research MethodologyThe present study is based on secondary data. Data and information have been extracted from Annual Reports of IRDA and LIC of India. The information so collected has been classified, and analysed as per the objectives of the study.
4. Key success factora. eFEAPeFEAP, Enterprise Front End Application
Package, is the core application that has been
developed in MF Cobol with data storage in
MySQL is centralized through Linux
operating System. The application is J2EE
compliant and Glassfish is the web server.
eFEAP is an end to end application taking
care of all operational activities, that is, from
proposal data capture to all types of policy
exits. The system has the main data source
and feeds other systems like ODS/Portal and
CADW (Corporate Active Data Warehouse)
in real time as well as batch processing. It is
also integrated with document management
system and with Tibco as the messaging
layer.
The year 2012-13 was one of consolidation,
with the eFEAP, that is, LIC's core insurance
systems, stabilizing and growing in scope.
The process of eFEAP implementation in all
offices was completed during the year. Zonal
offices and central offices also have adopted
the eFEAP packages with the flow of data
have become more efficient and smooth. The
113 divisions that have data centres are
enhanced with all infrastructure facilities
with fine tuning resulting into minimal
chances of failure. Besides, e-audit concept
has been thoroughly developed and released
as a part of software development process.
All types of policy holders and management
payments have got the NEFT facility. As
Hindi is our national language and LIC
operates in many parts of India where various
other regional languages prevail so efforts
are also being done to use Hindi and other
Indian languages into eFEAP. SMS
messaging is also being utilized for passing
information to customers. Claim monitoring
is one of the vital things that is being
monitored from central office and the facility
given for it is supposed to be the best ever
claim settlement performance in recent
times. For the overseas branches, the eLife
package that is implemented in Sri Lanka and
Nepal has been aligned to the Singapore
office requirement for product design and
service.
IUJ Journal of Management

b. Enterprise Document Management System
(EDMS)
An electronic document management system (EDMS) is a software system for organising and storing different kinds of documents. This type of system is a more particular kind of document management system, a more general type of storage system that helps users to organize and store paper or digital documents. EDMS refers more specifically to a software system that handles digital documents, rather than paper documents, although in some instances, these systems may also handle digital scanned versions of original paper documents. An electronic document management provides a way to centrally store a large volume of digital documents. Many of these systems also include features for efficient document retrieval. All efforts have been taken to speed up the completion of EDMS project by tracing all missing/ excess policies and incremental documents.
c. Enterprise Portal Solution (EPS)
Enterprise Portal Software (EPS) is a
prepackaged software kit used by the
enterprise to integrate its information and
processes. Organizations use portals primarily
to aggregate information from a number of
different sources, including disparate systems,
and provide this information to authorized
users in a neatly managed single screen or
system. EPS usually offer a Web-based
interface to provide a secure unified access
point through which information is aggregated
to application-specific portlets. Enterprise
Portal Software lets authorized users access
Web services, and portals can be combined to
form portal networks which can cover an
organization's entire enterprise system.
EPS is the internet face of LIC since November
2005 and well geared to handle all e-business
initiatives in the years to come. LIC has
strategically provided this web-based self-
service interface to all stakeholders, that is,
policyholders, agents,
development officers, etc. to get relevant
information from a single point. Currently, the
focus is on providing alternative channels for
premium collections using the online
transaction processing capabilities.
d. Channels for Premium Payment
It has been the constant endeavor of LIC to
introduce more and more services for the
convenience for its policy holders. Facilities
such as Premium Points, Life Plus centers,
Online Premium payments, Axis Bank
Counters, franchisees namely Suvidhaa,
APOnline, MP online, EasyBill, etc. are
available throughout India to facilitate renewal
of premium payments. At these offices,
policyholders can pay renewal premiums and
get an authorized receipt for the payment done,
being round the clock. Nearly 30,000
empowered agents and business associates and
5,000 franchisees are involved in this work.
The share of such alternative channels of
premium payment rose from 27% of all India
premium collection transactions during the
financial year (FY) 2011-12 to nearly 35% in
the FY 2012-13 and more than 12.77 crore
policy holders are benefiting from these
facilities. SMS based enquiry services have
been introduced which customers are using for
gathering information relating to the due date
of the next premium, nomination, bonus, loan
and revival details, etc., by sending a simple
SMS message: "ask lic policy number
premium/ nom/ bonus/ loan/ revival" to the
number 56767877 and 9664996649.
e. Mobile Application and HTML5 Microsite
Mobile application is application software
designed to run on smartphones, tablet
computers and other mobile devices.
LIC's official in-house developed mobile
application for Android based smartphones
was deployed for the Android market for
Vol. 2, No. 1, May 2014IUJ Journal of Management23

general public in the year 2011-12. LICMobile
has been downloaded and installed by more
than 2,05,711 users and about 73,000 of them
are actively using it. The app is targeted for
both customers as well as company's
marketing personnel. The app provides
options for viewing LIC insurance plans,
premium calculation, checking policy details,
and applying for a new policy. The app also
serves notifications for due premium, matured
and lapsed policies, and due survival benefits.
This has enabled LIC to reach the young
customers and agents and it has opened up
more channel for providing customer service.
For LIC agents, the app provides a customer
directory and their premium calendar with
notifications for due premium, lapsed policies,
customer birthdays, and official circulars.
There's also a branch locator feature, which
gives you locations of LIC branches in a
particular region with complete address and
contact details.
Customer can view enrolled policies, policy status and premium calendar after entering their customer portal user-id and password. Agents can view policy enquiry and premium calendar after entering their agency portal user-id and password. Features such as, view policy details, premium calculator, information about LIC's various plans, compare premium for plans, payment of renewal premium, apply for a product and branch locator are available in the mobile app for customers.
LIC has also provided an HTML5 micro-site for mobile handsets, smartphones, tablets, etc. on Symbian, Windows mobile, IOS (Apple), RIM (Blackberry) and Java MIDP operating systems. Here access is possible using any HTML5 compliant browser and connectivity to internet on the mobile handset, smartphones, tablet, etc. and no application is required to be downloaded and installed on the handset.
If one is a LIC customer, there's no reason s/he shouldn't install this very well designed and utility app. One can download it for free for Windows Phone 8 devices from the Windows
simple menu-based program, easy to install and run. All reports generated through this LIC application match with LIC's reports.
f. Corporate Active Data Warehouse (CADW)
A data warehouse is a relational database that is
designed for query and analysis rather than for
transaction processing. It usually contains
historical data derived from transaction data,
but it can include data from other sources. It
separates analysis workload from transaction
workload and enables an organization to
consolidate data from several sources. In
addition to a relational database, a data
warehouse environment includes an extraction,
transportation/transformation, and loading
(ETL) solution, an online analytical processing
(OLAP) engine, client analysis tools, and other
applications that manage the process of
gathering data and delivering it to business
users.
TERADATA, a d iv i s ion o f NCR
Corporation, will be providing data
warehousing solutions to Life Insurance
Corporation. The Corporate Active Data
Warehouse will cater to the 160 million
policies held by 130 million policyholders
and the large volumes of cash transactions
that take place. This will enable LIC to
understand various usage profiles of the
customers and policies in order to customize
offerings and bundles and effectively
manage them.
Mr T. S. Vijayan, Managing Director of LIC
said ,"We envisage Teradata's data
warehousing solutions will empower LIC
with tremendous analytical capabilities and
help in designing customer-oriented
insurance products,"
LIC's CADW is one of the largest life
insurance customer databases in the world. The
warehouse has enabled LIC to launch various
customer focused campaigns like the
Vol. 2, No. 1, May 2014IUJ Journal of Management24

Vol. 2, No. 1, May 2014IUJ Journal of Management25
Interactive voice response (IVR) is a technology that allows humans to interact with computers using voice or a dual-tone multi frequency (DTMF) signaling keypad. IVR allows customers to find answers to their own inquiries by speaking (using the company's speech recognition software) or giving inputs via a telephone keypad. IVR uses prerecorded and dynamically generated audio to interact with customers. The key benefit to IVR systems is that they can handle large volumes of calls, where only simple interactions are required. IVR is also known as a telephone menu or voice response unit.
At LIC Integrated Voice Response System
(IVRS) are operating 24x7 from 15 cities
providing information to the customers. Any
customer can contact the IVRS by dialing
Universal Access Number (UAN) 1251.
i. In-house Software
In the financial year 2012-13, LIC introduced
the following in-house software jointly
developed by ITSD/ITBPR and direct
marketing-
Online engagements of Direct Sales
Executives (DSEs).
Cash flow management wherein the units
are sensitized about the importance of
receiving renewal premium.
Corporate business module where the
employer has been given an opportunity
to get the details of the premium paid by
the employee through LIC website for
direct integration into income-tax
calculation.
Besides above the full-fledged call centre at Ville Parle, Mumbai has the following benefits from information technology-
All online leads get validated
immediately.
All the proposals registering on online
site are navigated through the system
seamlessly.
Validation of all leads received through
portal/SMS.
customer contact programs and various
targeted marketing campaigns. A major
achievement has been to send a single notice
for premium falling due in the same month for
various policies of an individual customer. The
project is also successfully used for generating
marketing leads. All these initiatives launched
have not only generated huge Return On
Investment (ROI) but have also made LIC more
visible in the eyes of the customers. Various
dashboards for different offices and
departments are created by the project and
made available to various users.a.
g. Video Conferencing
a.
h. Integrated Voice Response System (IVRS)
It is a technology that allows users in different
locations to hold face-to-face meetings without
having to move to a single location. This
technology is particularly convenient for
business users in different cities or even
different countries because it saves the time,
expense and hassle associated with business
travel. Uses for video conferencing include
holding routine meetings, negotiating business
deals and interviewing job candidates. The
main advantage of video conferencing over
teleconferencing is that users can see each
other, which allows them to develop stronger
relationships. When a video conference is held
for informal purposes, it is called a video call or
video chat.
All divisions of LIC are provided with video
conferencing units, enabling a seamless flow of
information between offices from divisional
office inwards. This has also brought about
huge savings in costs and cut down the delay
which could have occurred compared to the
travel expenses and time consumption where
the interaction required by different
participants are face to face at the meeting
place.

Vol. 2, No. 1, May 2014IUJ Journal of Management26
In addition, the direct marketing channel of
LIC started with 138 direct sales executives
(DSEs) and 6 units as on 01.08.2009 and today
LIC DIRECT is the fastest growing and highly
productive channel. This channel drives with
the values of Passion, Performance and
Professionalism. These values and committed
professional sales force provide excellent
buying experience to customers with enhanced
use of IT.
5. Conclusion
After privatization, insurance industry has seen
significant growth not only in terms of their
business done but also in the initiatives taken to
make information technology operational from
the stakeholders' point of view. In order to be
competitive, LIC has taken new initiatives for
the implementation of information technology
through eFEAP, EDMS, EPS and LICMobile
for smartphones having more than 73,000
active users. A major breakthrough can be seen
through the implementation of data warehouse,
CADW that can help in efficient and effective
reporting and cater to the need of 160 million
policy holders. Video conferencing facility has
helped in huge savings in cost and time which
is a vital issue for any company for its
economic purpose. The IVRS and the in-house
software developed by the ITSD/ITBPR and
direct marketing will make the information
flow smooth for the benefit of customers. It can
be concluded that the information technology
initiatives by LIC of India catered to the
various needs of different segments of its stake
holders
References
· Barathi, C., D. Balaji and Ch. Ibohal
Meitei (2011), “Innovative Strategies To
Catalyse Growth Of Indian Life
Insurance Sector-An Analytical
Review”, Indian Journal Of Commerce
And Management Studies, Vol. Ii, Issue
IV, May 2011.
· Kimball, R. The data Warehouse Toolkit (Wiley Computer Publishing, John Wiley & Sons, Inc.).
· Silberschatz, K., Sudarshan, Database t hSys tem Concep t s , 4 Ed i t ion ,
McGrawHill· Inmon, W. H., Claudia Imhoff, and Ryan
Sousa, Corporate Information Factory (New York, NY: Jonh Wiley & Sons, Inc.).www.bimaonline.com
· www.economictimes.com
· www.insuringindia.com
· www.irdaindia.org
· www.licindia.com
http://docs.oracle.com/cd/B10500_01/
server.920/a96520/concept.htm
· http://www.investopedia.com/terms/v/
video-conferencing.asp· http://www.rkimball.com/html/articles _search/articles1997/9708d15.html· http://www.techopedia.com/definition /12769/electronic-document-
management -system
· www.bimadeals.com/life-insurance-
india

Introduction
Processing of paper based cheques constitutes an important segment of the payment and settlement scenario of the India. Settlement of cheques is arrived on the basis of the physical presentation of paper based cheques to the clearing houses of the country for transmission to thedrawee banks and for payment thereafter. In view of the need to transport the paper based cheques and the time involved in their processing at various intermediary levels, the total time taken for realisation of cheques has tended to be rather long. The problem gets compounded when cheques are tendered for collection by customers at a branch in a city which is not the actual place
of the drawee branch. These are called outstation cheques and these cheques typically take longer realisation periods especially in a geographically large country like India and cases of delays in credit – by more than a fortnight are not uncommon.
The entire processing of cheques and their payment are all governed under the covenants of the Negotiable Instruments Act, 1881, which necessitate that these instruments are in writing and have to be physically presented for payment in due course. The attendant delays on account of not being able to exploit technological alternatives available have been engaging the attention of
Vol. 2, No. 1, May 2014
National Payments Corporation of India (NPCI) - Introduction of Bank’s Cheque Truncation System - Key Features of CTS-2010 & e-Cheques –
effective from 1st July 2013
Firdos T.Shroff1
Cheque Truncation is one of the ways to compress the clearing cycle to provide faster clearances of local and intercity cheques. Cheque truncation, very loosely defined, is the process in which the physical movement of cheque within a bank, between banks or between banks and the clearing house is curtailed or eliminated, being replaced in whole or in part, by electronic records of their content (with or without the images) for further processing and transmission. The entire processing of cheques and their payment are all governed under the covenants of the Negotiable Instruments Act, 1881, which necessitate that these instruments are in writing and have to be physically presented for payment in due course. After the passage of amendments to the Negotiable Instruments Act 1881 and the IT Act 2000 in the last quarter of 2002 to provide a legal framework for the implementation of cheque truncation and e-cheques in India, the Governor of the Reserve Bank of India, in the midterm review of the Monetary and Credit Policy Statement of October, 2002 had suggested that a Working Group on Cheque Truncation be constituted to suggest an appropriate model suitable to Indian conditions, in view of various models of truncation available the world over. This article focuses on entire processes of introduction of Bank’s Cheque Truncation System in India and the mechanism.
Key Words: Cheque Truncation, NI Act, e-Cheques,
1 Director, Sir M.Visvesvaraya Institute of Management Studies & Research,Wadala, Mumbai; Director, ZCBL & LICHFL Care Homes; Senate
Member,Pune University; Fellow IIBF; (ex-Union Bank of India), E-Mail: [email protected]
27
the Reserve Bank of India for some time. After the passage of amendments to the Negotiable Instruments Act 1881 and the IT Act 2000 in the last quarter of 2002 to provide a legal framework for the implementation of cheque truncation and e-cheques in India, the Governor of the Reserve Bank of India, in the midterm review of the Monetary and Credit Policy Statement of October, 2002 had suggested that a Working Group on Cheque Truncation be constituted to suggest an appropriate model suitable to Indian conditions, in view of various models of truncation available the world over.
These apart, it was also felt necessary to consider several operational aspects relating to the processing cycle, technology requirements and the approach to implementation for the introduction of cheque truncation in the country. Further, in order to facilitate debit transfers also in electronic mode, feasibility of e-cheques was also required to be studied.
Cheque Truncation System
“Cheque” - A “cheque” is a bill of exchange drawn on a specified banker and not expressed to be payable otherwise than on demand and it includes the electronic image of a truncated cheque and a cheque in the electronic form.
(a) “a cheque in the electronic form” means a cheque which contains the exact mirror image of a paper cheque, and is generated, written and signed in a secure system ensuring the minimum safety standards with the use of digital signature (with or without biometrics signature) and asymmetric crypto system;
(b) “a truncated cheque” means a cheque which is truncated during the course of a clearing cycle, either by the clearing house or by the bank whether paying or receiving payment, immediately on generation of an electronic image for transmission, substituting the further physical movement of the cheque in writing.The cheque is currently the most visible and significant mode of payment in India. In view of the importance of cheque to the retail segment, Magnetic Ink Character Recognition (MICR) technology was introduced by the Reserve Bank of India. MICR technology enabled the banking
system to handle the growth in the cheque volumes and to provide faster and efficient clearing services to customers and to do straight through processing using MICR data. Over a period of two decades, a number of MICR Clearing Houses have evolved.
The entire clearing cycle is dependent on the movement of the physical paper cheque from the presenting bank to the drawee bank (branch) as was mandated by the Negotiable Instruments Act prior to its amendment. This bottleneck had an overriding impact on any consideration for improvements or reduction in the cycle time for clearing.
Until very recently, legal covenants in India required the cheque to be presented to the paying branch for payment. The paying branch is the last node in the clearing cycle as it exists in the country, and thus the paper cheque is on the move through the entire cycle from the bank-branch of the collecting bank where it is first deposited to the service branch of the collecting bank, onward to the Clearing House, which acts as a focal point for the cheques of all the banks, and from the Clearing Centre to the paying bank service branch and lastly the paying branch. If the cheque is returned unpaid, it has to re-trace the entire path back to the presenting branch.
Cheque Truncation is one of the ways to
compress the clearing cycle to provide faster
clearances of local and intercity cheques. Cheque
truncation, very loosely defined, is the process in
which the physical movement of cheque within a
bank, between banks or between banks and the
clearing house is curtailed or eliminated, being
replaced in whole or in part, by electronic records
of their content (with or without the images) for
further processing and transmission.
International Scenario
Truncation straddles many countries across the globe on either side of the hemisphere. These include countries like Denmark and Belgium which were the pioneers in the truncation process, having introduced complete cheque
Vol. 2, No. 1, May 2014IUJ Journal of Management28

truncation (dokumentiase clearings) in the early 1980s itself to the island state of Singapore which is in the final phase of implementation.
Retail payment analysts make a two-fold classification – countries like England, US and France where cheque has always dominated non-cash payments on one hand and the others like Sweden, Norway where giro transfers have been the dominant modes of non-cash payments. Cheque volumes in the second group have historically been low and from the point of view of truncation,manageable, and these countries have been successful in introducing truncation in the clearing process. Sweden is the extreme example of achievement of complete truncation where all cheques can be presented and encashed at any bank branch, irrespective of the bank on which they are drawn.
Secondly, the implementation of truncation has invariably been preceded by either the amendment of the existing laws governing cheques and other payment instruments or by the introduction of new laws.
Many countries such as Spain, Italy and Luxemburg have an amount ceiling for the cheques that can be truncated. Cheques which are considered low value are eligible for truncation whereas the higher value instruments still follow the traditional clearing route.
Under most implementations the cheques are truncated early on in the clearing cycle, typically at the collecting branch level or the collecting bank level.Ireland stands out as an example of late truncation, where 95% of the chequesare truncated at the paying bank stage.
International experiences with cheque truncation show that the geographically smaller countries are the ones that have been able to implement the process of truncation, be it Greece or Singapore or Belgium. Cheque truncation has been less than a complete success in larger countries. USA, for example, is still a laggard in this respect despite having the maximum number of cheques written (237 per head in a year). Nonetheless, it is making progress towards implementation of cheque truncation.
Cheque Truncation Model in India
Therefore, the Group recommended that in India the cheques should be truncated at the Presenting Bank itself and within the Presenting Bank it should be left to the individual banks whether cheque is truncated at the branch or at the service branch or whether the truncation process is outsourced, depending upon the individual efficiency, resources, facilities and cost considerations of the bank.
As payment based on the MICR code line exchange would not provide opportunities for signature verification (which is a legal requirement as on date), the Group recommended electronic image based cheque truncation.
On the storage location, the Group debated on the idea of the cheque images being stored at by a Central Image Warehousing Agency or by the presenting banks/drawee banks themselves. As per the amended Negotiable Instruments Act, it is the drawee bank that has to certify the printout of the image of the cheque as a proof of payment.
Risks in Cheque Truncation
The introduction of the truncation process will change the roles and the responsibilities of the various participants in the truncation process and may lead to introduction of certain risks that will have to be mitigated. These are mentioned below.
At the presenting bank level, the responsibility to verify the genuineness of the cheque based on the apparent tenor or the visible features of the cheque presented for collection may lead to banks refusing to accepting a genuine cheque or accepting a forged cheque based on a manual scrutiny. Images and MICR data to be sent to the clearing house have to be matched before they arereleased to the Clearing House.
The Clearing House will have to assume that the data given by the banks is the data meant for that day's clearing and will have to arrive at the settlement based on this assumption. If the MICR data given by the bank is not that matching with the day's image the bank has sent for collection, it may lead to erroneous settlement and large returns.
Vol. 2, No. 1, May 2014IUJ Journal of Management29
Truncating cheques entails additional operational risks. Banks will have to take adequate measures to ensure that all necessary safeguards are provided for – in consonance with legal requirements and banking practice while making payments, especially for high value instruments.
The drawee bank has to verify the signature on the image of a cheque. If a drawee bank chooses to verify signatures on the images of cheques above a cutoff amount only, then it runs the risk of paying some forged instruments.
The Warehousing Agency for images and physical storage of cheques might not be able to produce the image or the physical cheque demanded by the bank. This may lead to legal complications and assignment of liabilities. These will have to be covered by suitably drafted agreements and service level agreements between the banks and the Warehousing Agency.
Committee on Cheque Truncation – Study Visit – Singapore
I. Discussions with the officials of the Monetary Authority of Singapore (MAS)
Rationale for Cheque Truncation
- Government of Singapore, being the big user of payment system, decided 10 years ago to bring in electronic mode of payments. A Committee on Electronic Payments, headed by the Government charted a plan and monitored the implementation of it. The country achieved 80% of the target two years ago.
- The same Committee was reconvened to bring efficiency in the GIRO System. Consequent to its recommendations, EasyLink Cards(a kind of contact less cards) and CashCards have been introduced.
- Though the volume of cheques in Singapore (300,000 a day) is not growing and the stated objective is to move towards more electronic mode of payments, the Committee recognised that cheque usage is likely to be one of the preferred mode of payment and therefore the
Committee also made recommendations for improving efficiency in the cheque processing systems by way of cheque truncation.
- The business case for Cheque Truncation was a difficult one as it is a high cost affair. Investments required at the SCH and the preferred security features (viz., the PKI) meant high costs.
- The real benefits were seen to come from leveraging the electronic structure created for the cheque truncation for other strategic and economic benefits.
- For the customers, immediate benefit will be the cut-off time for presentation would be elongated from the current 2.00 pm to a later time. Though currently the value is on T+1 basis, later this could be brought down to T+0.
- For the Singapore USD Cheque Clearing, the clearing cycle will be reduced to T+1 from the current T+2.
Model Adopted
- Singapore studied cheque truncation models around the world and decided for truncating the cheques at the presenting bank level, as it brings ultimate efficiency.
-Imaging, as an optional feature, was already available in the country and three large banks have the experience of clearings based on images.
- As for the exact location of truncation, Singapore has adopted a flexible model. Most of the small banks, having one or a few branches, truncate cheques at the branch level using a desk-top reader-scanner.
-Big banks truncate cheques using a service bureau either in-house or outsourced.
- All the cheques are to be truncated irrespective of value. (Hong Kong
and Canada have adopted truncation up to a cut
off value only).
Vol. 2, No. 1, May 2014IUJ Journal of Management30

Challenges faced
- A Big-bang approach was adopted for implementation. (Hong Kong has adopted an incremental model). Therefore, the project moved as fast as the slowest member.
- New specifications for cheques (both for quality of paper and format) meant elaborate arrangements for manufacturing and printing of new cheques and lead time (6 months) for replacing old cheques. Banks had to resort to some kinds of incentives or the customers to return the old cheques in their possession.
Technical Standards
- SCH determines the technical standards for cheques(paper and format), imaging equipments, image quality, connectivity and archiving.
- There is a certification process. Banks will have to get their systems at branches and service bureaus and the operator of the clearing house have to periodically get their systems audited by the approved information systems auditors like PWC, KPMG and Deloitte.
Return of unpaid images
- Image return when unpaid is valid.Warehousing of physical cheques
- Centralised warehousing of physical cheques was adopted as a convenient mode and to have common industry practice.
- Charging mechanism has been adopted to discourage demands for physical cheques by the paying bankers.
- It was decided to warehouse the physical cheques for one year. Intends to bring it down later to 6 or even 2 months.
Legal aspects
- Laws amended to legalise cheque truncation.- Images of cheques valid for payment and return.- Image processing is to be certified.- Liabilities for verification of cheques truncated will be with the presenting banks.
Archiving of images
- Centralised archiving has been adopted.- Images to be available for 7 years.
II. Discussions with BCSIS Ltd., the operator of the Singapore Clearing House - Rationale for Cheque Truncation
- Inefficiencies in collection of cheques are bankers' delight (because of availability of float funds) and customers' nightmare.
- C h e q u e T r u n c a t i o n i s a l o g i c a l progression/evolution of cheque processing from hand sorting to MICR to Imaging.
- e-Cheque is a technology driven project whereas cheque truncation is customer-oriented project.
- Expected savings (as per a 1998 study) is Singapore Dollars 70 million a year.
Model & Features Adopted
- Covers all the four clearing legs viz., Outward Presentation, Inward Presentation, Return Outward and Return Inward.
- Unique Identifier(25 character including date, bank, machine id and serial number) for each truncated cheque printed on the backside while reading-scanning.
-Common Physical Cheques' Warehouse
- Image Return Document(IRD) a legal instru- ment- National Image Archive
- Broadband connectivity and VPN adopted. Dial-up, Leased Line and Asynchronous Transmission Mode(ATM) for transmission of Magnetic Ink Characters Recognition (MICR) Codeline and images.- Operator's Data Centre General Controls, network architecture, server and OS controls and penetration testing verified/audited through approved IS Auditors.
Vol. 2, No. 1, May 2014IUJ Journal of Management31

Vol. 2, No. 1, May 2014IUJ Journal of Management32
-Shoe-box desktop reader-scanners or Reader-scanners, Front end, Backend and Archival Web applications at banks' end; CTS host system and National Image Archival system at the Clearing House end.
- Cheques redesigned and reformatted to suit imaging. Common Watermark on the cheques.
- MICR line redesigned to include a check digit to facilitate better quality reading/verification of M I C R l i n e d e s p i t e l o w - e n d desktopreader/scanners.
- Cheques scanned on both sides in a single pass.
-Grey Scale image(100 dpi) good for human eye; but adopted Bitonal scale(200 dpi) to facilitate automated signature verification.
- Contingencies whether of single bank or multiple bank failure to be tackled through images on CDs with the help of friendly/guest banks/service bureaus and at CH for operator, through DRS Site.
- Certified authority to review the entire process right from capture to archive including transmission.
- A Steering Committee, an Operations and Legal Committee and an IT and Security Committee.
III. Discussions with the Operations and Legal Committee of the SACH
- Presenting Bankers' new liabilities / responsibilities include verification of physical cheques for apparent alterations, modifications and cheque quality.
-Cheques were redesigned to suit truncation. Design includes equality of paper, watermark, restricted zone for date, amount and signature, and check digit on MICR line.
- Security features on cheques include quality of paper, watermark and cheque digits.
- Empanelled vendors for paper manufacturing, cheque printing and reader-scanners
- Truncation process auditing to include control exercised, machine specification and calibration, no image-change capability and network control.
- Cheque Warehousing charges to be paid by the Paying bankers as the cheques are their property.
- Account opening terms and conditions modified to facilitate truncation, Image Return Documents.
- Images can be retained by the presenting and paying bankers, but for their own internal use; have no legal validity post payment/archiving.- Post payment/archiving, only a certified image from the Negotiable Instruments Act has legality. Images from the National Archive can be requested for by the presenting and paying bankers. Certified images will be on security paper with watermark.
- Warehousing is merely a safe custody. Only the presenting banker can make a request (only they know the unique cheque).
-Bilateral image exchange was rejected because of problems of sorting physical cheques and images, archiving at multiple locations and certified images from multiple locations.
Committee on Cheque Truncation – Study Visit – Sweden
Major Features of the payment systems in Sweden:
Swedish payments function under the overall
aegis of the central bank of Sweden – Svergis
Riksbank, which has as its main objectives
the following:
Safeguarding the value of money – which is
achieved through inflation targeting and the
effective use of the Repo rate
Promoting a safe and efficient payment
system
The Payment Systems Division, functioning
under the Market Operations Department of
the Riksbank looks after
Vol. 2, No. 1, May 2014IUJ Journal of Management33
payment systems in general;specifically the
followong:Customer support and sales developmentM o n i t o r i n g o f p a y m e n t o p e r a t i o n s , including the RTGS operationsSupporting functions are provided by the Financial Stability Department,which looks over the analysis and assessment over banks and financial institutions. The IT department looks is responsible for the computer systems of the Riksbank including the IBM-S/390 mainframe system which is the backbone for the RTGS system of Sweden.
The entire RTGS system of Sweden – called the RIX System (comprising of two systems – the K-RIX for settlement denominated in Swedish Kroner, and the E-RIX System – for settlement denominated in Euro) was developed in house by the Riksbank which also has dedicated staff for the management and maintenance of these systems. Operating in the mainframe, the RTGS system which was developed in COBOL and using DB2 as the database, with CICS as the transaction handler, MQ Series for the messaging middleware and IBM's MERVA for interfacing with banks.
· Cheque truncation was introduced in
Sweden in the seventies, with data based
processing of the cheques and the
generation of the settlement thereof.
· Banks had migrated to the process of
'universal' payment processing –
whereby a customer could present a
cheque at any bank in Sweden and
receive payment. This is facilitated by
means of -
o A unique identification for each
account holder, related to the
national id for people (banks
were the conduit for issue of
national ids)
o Verification of the presentor
details at the bank of payment
for amounts up to SEK 2500,
with telephonic confirmation on
funds availability from the
drawee bank for amounts greater
than SEK 2500.
o The details of the cheque are
then converted into data – by
keying in at the paying bank and
then the data is sent for clearing
and settlement.
o All banks enter into the
agreement for 'universal '
processing
o The fees for such transactions
are low and each bank is free to
decide its own fees for its
customers.
o The cheques are stored at the
paying bank – for a period of ten
years as required by law. The
data is also preserved for the
same period.
Conclusion
The Committee on Cheque Truncation under chairmanship of Dr.R.B.Barman, studied various issues at international scenario on CTS vis-a-vis Indian banking system before implementation of CTS. The commencement CTS-2010 and issuance of new cheque books was indicated by
stRBI till 31 December 2012. Thereafter, it was to
stcommence from 1 April 2013 and presently its
steffective date of commence extended upto 1 July2013. Reserve Bank of India and National Payments Corporation of India, deserves appreciation for the enormous task undertaken up by esteemed Committee.
Reference
· Automation of non-MICR Clearing Houses –
Implementation of a new Clearing Software –
Express Cheque Clearing System – RBI
Circular No. RBI/2010-11/423 /DPSS
(CO) CHD No.2099 / 03.02.03 / 2010-11
March 14, 2011
· Barman, R. B. (2003) Working Group
Report on Cheque Truncation and e-
Cheques – Reserve Bank of India – July
· I F S C C o d e -
http://www.ifsccodebank.com

· National Payments Corporation of India
circular letter No. NPCI/ ECCS/2011-
12/0807 dated 7th July, 2011 on
Express Cheque Clearing System
(ECCS) -Implementation Timeline and
Requirements
· National Payments Corporation of India
-
· Reserve Bank of India –
· Shroff, F.T., (2007 - Reprint 2010) -
Modern B@nk ing Techno logy ,
Foreword by Dr.R.B.Barman, ED, RBI
with message& blessings from H.E.Shri
S.C.Jamir, Governor of Maharashtra,
Published by Northern Book Centre,
4221/1, Ansari Road, Daryaganj, New
D e l h i - 1 1 0 0 0 2 –
( ).
www.npci.org.in
www.rbi.org.in
www.northernbook.com
· T h e N e g o t i a b l e I n s t r u m e n t s (Amendment and Miscellaneous Provisions) Bill,2002 - A bill further to amend the Negotiable Instruments Act, 1881, the Bankers' Books Evidence Act, 1891 and the Information Technology Act, 2000.
· The Payment and Settlement Systems
Act, 2007 – Published by Authority –
Ministry of Law and Justice (Legislative th
Department) – 20 December 2007 – The
Gazette of India Extraordinary
Vol. 2, No. 1, May 2014IUJ Journal of Management34
Vol. 2, No. 1, May 2014
A Framwork for Requirement Prioritization for Software Products
Sita Devulapalli1 and Akhil Khare2
A new Framework is proposed for requirements prioritization for successive releases of Software products based on the concept of ABC classification, at successive levels based on relevant parameters. There are high cost and low value requirements, where cost and value relate to different parameters at different levels. It is proposed to link the development process methodology to the outcome of Prioritization analysis. The framework helps and provides clear visibility and traceability across Software development life cycle and helps guide quality efforts. Impact of change of release plans can be understood with minimal effort.
Keywords: Requirement Prioritization; Engineering Software; Successive Releases; Framework
1 Ph. D. Scholar, ICFAI University, Jharkhand, Ranchi, E-mail ID: [email protected] 2 Professor, Dr. D Y Patil Institute of Engineering & Technology, Pune, E-mail ID: [email protected]
35
Introduction
Software Products utilized in Engineering Applications are complex and related to specific domains, whose core principles undergo changes less frequently. Typically Software products falling under this type start their life with a specific domain application/customer in mind and grow around that application and/or similar applications. And add similar or aligned customers to the products usage. The products mature in terms of stability and reliability as they are used by different customers for different applications in different environments. At the same time, products undergo modifications to meet further requirements of existing customers and new customers. Products undergo changes to incorporate benefits of advanced technologies. Providing the customers with ever enhancing products is made possible by successive releases of products at varied intervals. Typically successive releases are planned once or twice a year. In the intervening time there are alphas, beta programs, or even frequent interactions with stakeholders – customers, for fine tuning and
refining the release at different intervals. The fundamental questions that need to be addressed are - What will be available in the next release? How are the requirements evaluated? Can all the requirements we gather be incorporated or we have cost and time implications, which require us to prioritize the requirements?
This paper makes an attempt to emphasize the nature of applications and requirements related to Engineering domains in section II, III and propose a new framework for requirements prioritization. While defining the framework, the fundamental premise has been that we have requirements of high value and/or cost that need close monitoring and also requirements of medium or low value and/or cost that may require relatively less attention.
Methods frequently referred in literature are described in the section IV. The methods range from simple to complex and are evaluated and compared for varied projects.
The proposed framework and process of prioritization is presented and discussed further

in section V, VI. Section VII discusses the benefits of the framework
2. Nature of Applications
Dwelling over the nature of applications, Software Products developed for complex Engineering Domains survive for decades as the fundamental domain knowledge changes not so rapidly. Computer aided design for Plant building, Ship building has not changed so much in core design concepts. Coordinate systems have not changed for map making. Core concepts and product cores of Databases, Application Development Platforms and Operating Systems remain intact. Leading software companies in these domains have products surviving for more than 3 decades and mostly meta morphing into different forms but keeping the core stable. In addition, adoption of changes in Software products is risky in terms of huge disruptions and validations and time taken in Production Environments and some of the production cycles run into years. Like the auto industry has been surviving on diesel and petrol engines for long, only changing some parameters and external appearances, quite a few software companies have the core engines intact and tweak related parameters and change the interface aspects.
3. Nature of Requirements
Coming to the nature of requirements, Technology changes and the ease of use - parameters influence the requirements, in addition to additional complex domain related requirements. It may not be feasible to completely specify the requirements a priori. Every requirement may have an extent to which it may be sufficient to meet and it may not be necessary to completely implement in a release. Since the same product gets used by customers for different applications in different industry segments in varied geographical regions, not all requirements are applicable to all customers. It is possible that some of the requirements end up
requiring major changes in the core engine of the product while some of the requirements are at usage level – this aspect influences the difficulty of implementation and impacts.
Hence it is imperative that evaluation of sets of requirements that go into successive releases of products with respect to Return On Investment –ROI is undertaken. While there are different aspects or steps to the products release – Road maps, Release planning, Requirements Prioritization - the goal is evaluation for ROI.
4. Methods in Literature
Significant Research and empirical studies have taken place in the area of requirements prioritization and release planning. Methods have evolved for prioritizing requirements based on different parameters - Value and Cost being prominent among them. Analytical Hierarchy Process- AHP is based on pair wise comparison of requirements relative to each other on a scale at successive levels of hierarchy. The method grows in complexity and difficulty for large number of requirements.
Cost-Value approach by Karlsson takes the cost of implementation and value of requirements in to consideration in pair wise comparison. Wiegers method takes in to account value, penalty, cost and risk and proposed weighted value/cost ratio for determining priority. Priority Groups method groups requirements based on different parameters – mostly importance of requirements.
Davis advises simplifying the process and advises Triage at successive levels, taking into account market realities. Industry specific studies for products meeting certain specific base parameters seem to have been very few. This makes the conclusions and comparisons difficult to be applicable or reliable. Other methods frequently discussed in literature are Planning Game, Planning Game combined with AHP, 100 point method or Cumulative Voting. Comparison
Vol. 2, No. 1, May 2014IUJ Journal of Management36

of various methods is taken up systematically in.
5. Proposed Framework Considerations
The following assumptions are in order with the premise of the framework proposed -
· The purpose of getting a set of requirements implemented for the next release (time bound) is to maximize the business value of the release.
· A strict ordering of requirements may not be the need. Need is more for a near optimal set of requirements.
· Activities on requirements do not start in serial order, but in parallel in a distributed way.
Three most important factors for determining the release requirements set are
· Realizable Business Value· Cost of implementation · Constraints
1) Realizable Business Value: is determined based on following understanding -
· Inputs from sales/marketing/executive management/product dev/test/maintenance teams
· A Requirement may satisfy multiple customers
· Specific segments -High Value/medium Value/low Value realizable customers
· Realizable over short/medium/long durations
· Reduces test/maintenance cost· Marginal development cost · Opportunity costs
Business value depends on different industries and life cycle stage (new, growing, mature, declining) of the products. It is possible to have many parameters, weighing factors, analysis done to arrive at business value [9]. Methods from any non-software product features' business value determination can be adopted.
Customer Base can be the current or existing customer base requesting for additional features or it could be the ne customers that are likely to get added, given a set of features implemented.
2) Cost of Implementation: needs to take into account the following major factors -
Nature of requirements - Core model changes/Business Logic changes/UI changes.· ·Marginal cost – base model exists/ incremental changes needed to implement the requirementsCross impacts & verifications costs of implementing a new requirement.Resources – availability of development resourcesO p p o r t u n i t y c o s t s – d u e t o n o n implementation of other requirements
3) Constraints: Since a release is always timed to meet customers expected needs, the following Constraints need to be considered for prioritization of requirements -Time /duration – minimum time required/ time to marketR e s o u r c e s – k n o w l e d g e a b l e i n domain/technology/skillImpacts – on existing customersUncertainties – changes imminent
It is best to do some preprocessing of the RAW Requirements in terms of Broad understanding of the collected requirements Removing duplicatesMerging somewhat similar requirements
As Software products are mostly modularized and can be specified by modules/components, grouping requirements with respect to modules helps in determining marginal costs or values easily. Giving way for some amount of approximation is appropriate in the aggregation of many requirements and evaluating with respect to many other parameters – like time and resources required to implement the requirement, time available, compatibility with current product, feasibility of implementation, etc. , especially, in the initial stages.
6. FrameworkThe Framework is defined as 5 sets based on most used parameters in the sequence of priority determination..
Vol. 2, No. 1, May 2014IUJ Journal of Management37

Vol. 2, No. 1, May 2014IUJ Journal of Management38
• S1. Business Value(BV) in conjunction with Customer Base (CB) – with classes - • A:20% of CB with 70% BV • B:30% of CB with 25% BV • C:50% of CB with 5% BV
• S2. Requirements Applicability with respect to product – with classes • A:70% UW, 30% BI, 0% CP • B:50% UW, 40% BI, 10% CP • C:30% UW, 50% BI, 20% CP
Where UW: User Interface/ Workflow Specific/ Specific Customer Set, BI: Business Logic/particular Industry vertical, CP: Core/data model level /across the portfolios
• S3. Implementation Cost– • A: 70% MI,25% NI,5% IR • B: 50% MI,40% NI,10% IR • C: 30% MI, 50% NI, 20%IR
Where MI: Marginal Implementation, NI: Ne Implementation, IR: Impact Recovery.
• S4. Time Requirement – • A: 10% L,20% M, 70% S • B: 15% L, 25%M,60%S • C: 20% L, 30% M, 50% S
Where L: 8 to 16 person weeks, M: 4 to 8 person weeks, S: 2 to 4 person weeks
• S5. Resource Requirement – • A:10%RC,20%RI,70%RT • B:15%RC,25%RI,60%RT • C:20%RC,30%,50%RT
Where RC: Resources - Core aware (6y) - domain/ architecture / design/ technology RI: Resources - Industry aware (4y) – domain/ design/ technology RT: Resources – Technology aware (2y) – Technology/ Skill
Each set is defined by three classes defined by % value of the respective set parameters. Requirements are grouped in to the classes in the sets in the process of prioritization The % bands may vary from industry to industry and organization to organization to some extent. Prioritization sets – S1 to S5 and classes/bins – A, B, C within are described in Fig. 1.The process of applying the Framework is planned to be a layered approach with the following steps-
Step 1: Evaluate requirements with respect to set 1 and put them in A, B, C bins. Treat each bin separately.
Step 2: Evaluate requirements in the above bins with respect to set 2 and put them in A, B, C bins. The process can continue only for the bin A also. Step 3: Evaluate Next with respect to set 3. Step 4: Arrive at time durations with respect to 4 Step 5: Verify availability of resources with respect to set 5.
The order of preference emerges for the requirements Set through the filtering process.

Vol. 2, No. 1, May 2014IUJ Journal of Management39
R eq Filter3 bins 9 bins 2 7 b ins 81 bins 2 43 b ins
Re quire m
e nts
S 1: CB-
BV
S2 : UW-
BI-CP
S3: MI-
NI -IR
S 4: L-M-
S
S5 :RC-
RI -RT
A:20-7 0 A:70-3 0-0 A:70-2 5-5 A:10-30-7 0 A:10-2 0-70
B:15-25-6 0
C:20-30-5 0
B:15 -2 5-60 A:10-2 0-70
B:15-25-6 0
C:20-30-5 0
C:20 -3 0-50
B:50-40-1 0
C:30-50-2 0
B:50-40-1 0
C:30-50-2 0
B:30-25 A:70-3 0-0
B:50-40-1 0
C:30-50-2 0
C:50-5 A:70-3 0-0
B:50-40-1 0
C:30-50-2 0
A sample classification template of requirements using an excel sheet is given in Fig.2.
Fig. 2 Classification Template
7. Benefits of the Framework
A. Link to Development processIn addition to arriving at the prioritized requirements set, the suggested process of requirements classification can be extended to determine the development process most suitable for implementation of the requirements as described below.
When all sets are used for classification, we will arrive at 243 bins of requirements. Based on the constraints and release theme, the bins can be selected in the order of preference.
Agile/Iterative/Waterfall –no one process may be suitable for all requirements.
· Follow Agile for requirements emerging through A across Sets
· Follow Iterative for requirements emerging through AB combinations
· Follow Water fall for requirements emerging through ABC combinations.
Not all sets may require to be used. And once the selected requirements set is arrived at each step, marginal values of benefits and costs of requirements may get modified and feeding this information back and re-evaluating bins may be required.

Vol. 2, No. 1, May 2014IUJ Journal of Management40
B. Effective Quality Planning · Requirements classification into 243 bins
enables test planning appropriately.· Level and importance of testing a
requirement can become a function of the bins.·
Nature of testing can be determined based on the bins.
· A priori information available to test team
C. Flexible Release Planning · Effects of Adding/removing requirements
during the release cycle will be clearly visible.··Uncertainties can be accommodated in re-planning easily.
· With the 243 bins available modular release planning becomes feasible.
8. Conclusion
Literature study points to simple to complex methods being researched and gap between research and practice due to difficulties in implementing the research methods. The proposed framework enables simple and effective methodology for Requirements Prioritization for successive releases and leads to better understanding and planning of releases. It helps build traceability and visualize effects of plan changes and helps in informed quality planning.
While the framework is proposed based on the experience across organizations, an empirical study with the product companies is required for validation of the framework. It is planned to Develop a tool based on the framework for requirements classification and dynamic planning through the product development cycle.
References
International Requirements Engineering Conference,2008.
· Carlshamre, P. “Release Planning in Market-Driven Software Product Development: P r o v o k i n g a n U n d e r s t a n d i n g ” , Requirements Engineering, Volume 7, Issue 3, Sep 2002, Pages 139 – 151.
· Davis, A.M., “The Art of Requirements Triage”, IEEE Computer 36(3), Mar 2003, pp 42- 49.
· Donald , F. (2004) “Pr ior i t i z ing
Requirements”, Journal of Object
Technology, vol. 3, no. 8, September-
O c t o b e r 2 0 0 4 , p p . 3 5 - 4 7 .
http://www.jot.fm/issues/issue_2004_09/co
lumn4.
· Moisiadis, F. (2002) “The Fundamentals Of
Prioritising Requirements” Systems
Engineering, Test & Evaluation Conference,
Sydney, Australia, October 2002
· Hubert, F. and Hofmann, F. L. “
Requirements Engineering as a Success
Factor in Software Project”, IEEE
SOFTWARE July/August 2001.
· Karlsson, J. Ryan K.: “ A cost-value
approach for prioritizing requirements”
IEEE Software 1997;14(5):67–74
· Karlsson, J. Wohlin C, Regnell B: “An
evaluation of methods for prioritizing
software requirements”, Inform. Software
Technol.1998, 39(14-15): 939-947
· Krzysztof, W. (2012) “Understanding and
Supporting Large-Scale Requirements
Management”, Doctoral Thesis, 2012.
Department of Computer Science, Lund
University Faculty of Engineering, Sweden.
· Lehtola, L. and Marjo Kauppinen: “
Suitability of Requirements Prioritization
Methods for Market-driven Software
Product Development”, Software Process
Improvement Practice 2006; 11: 7–19.
Published online in Wiley Inter Science
(www.interscience.wiley.com). DOI:
10.1002/spip.249
· Alan, M. Davis, Ed Yourdon, Ann S. Zweig: “ Requirements Management Made Easy”. 39-947. www.omni-vista.com
· Andrea, H. and Maya Daneva “ Requirements Pri(2008) oritization Based on Benefit and Cost Prediction: An Agenda for Future Research” 16th IEEE

· Lipika, B., Goel, Sanjeev Thakur (2013)
“Requirement Prioritization: A Study and
Proposed Framework”, International
Journal of Emerging Technology and
Advanced Engineering Volume 3, Issue 6,
June 2013. Website: www.ijetae.com
· Manju, K. and Nikunj Kumar (2013)
“Comparison Of Six Prioritization
Techniques For Software Requirements”,
Journal of Global Research in Computer
Science, Volume 4, No. 1, January 2013.
Available Online at www.jgrcs.info
· Ramzan, M. Arfan Jaffar and Arshad Ali
Shahid (2011) “Value Based Intelligent
Requirement Prioritization (Virp): Expert
Driven Fuzzy Logic Based Prioritization
Technique” International Journal of
Innovative Computing, Information and
Control, Volume 7, Number 3, March
2011pp. 1017–1038
· Regnell, B., H¨ost, M., Natt och Dag, J.,
Beremark, P., Hjelm, T.: “ An Industrial Case
Study on Distributed Prioritization in
Market-Driven Re quirements Engineering
for Packaged Software”, Requirements
Engineering 2001, vol 6, no 1, pp 51-62· Thamer, A., Guenther Ruhe, and Mahmood
Moussavi (2006) “ Lightweight Replanning o f S o f t w a r e P r o d u c t R e l e a s e s ” , International Workshop on Software Product Management 2006 (IWSPM'06).
· Thomas, L. S. (2008) “Decision making with analytic hierachy process” Int. J. Services S c i e n c e s , Vo l . 1 , N o . 1 , 2 0 0 8 . ·Vakkalanka, S. and Ranjit Engu (2012) “Requirements Triage - Challenges And Solutions”, International Journal of Software Engineering & Applications (IJSEA), Vol.3, No.2, March 2012.
· Wiegers, K. E. (1999) “First Things First:
Prioritizing Requirements”, Software
Development, Sept. 1999.
Vol. 2, No. 1, May 2014IUJ Journal of Management41

1 Faculty Member, Asian School of Business Management, Bhubaneswar, E-mail: [email protected]
Introduction
The iron and steel industry has the trait of becoming a leading industry in India's economy as well as in the progress of India's industrialization era. With the recession showing its impacts in almost all the commodities' market, it becomes imperative for us to discuss about one of the important growth drivers of any country i.e steel. From 1997 onwards, mergers and acquisitions became commonplace in the steel industry. The past record shows that before 1997, mergers and acquisitions were very rare in heavy industries such as steel but based on financial performance, over-capacity and the worldwide economy that began showing signs of improvement, the steel industry started consolidating after a prolonged period. And so it becomes crucial for us to discuss about mergers and acquisitions. We will be focusing on two very important acquisitions of the decade i.e the Arcelor-Mittal deal and the Tata-Corus deal.
By definition, we have always viewed commodities as products and services that
customers perceive to be exactly the same. But with so many steel-makers competing with each other, it becomes important for one steel-maker to differentiate their steel from others. And here begins the story of the branding of one of the most lackluster commodities called steel. We will focus on the companies like TATA, SAIL etc who have been able to brand steel and what benefits does the branding of steel bring to a steel-making company.
We have seen how with the coming of the recession, all the sectors have been hit with no exception. And so the project will discuss the steel industry's current trends in the face of the economic slowdown and what are the survival strategies in such a scenario. We will also try to find out what does the future hold in store for the global steel markets.
Steel's one of the most unaware-of properties is that it is environmental friendly. Being recyclable steel can be resmelted from scrap and formed into different shapes instead of manufacturing it from the raw materials. Hence steel is truly a commodity for Sustainable development.
Vol. 2, No. 1, May 201442
Merger and Acquisitions in Indian Steel Industry: Atypical cases of Tata-Corus
and Arcelor-Mittal
Susan Das1
One of the important growth drivers of the Indian steel industry, which has seen tremendous growth in its capacity during post-liberalization period, is the trend of mergers and acquisitions, whose significance becomes many-fold because of the recent slowdown that the economy was facing. The companies go for acquisition deals for various purposes like curtailing down competition by acquiring competitor with premium price, easy admittance to overseas market etc. Hence the article gives some basics about mergers and acquisitions before it moves on to discuss two of the most important deals in the Indian steel industry –TATA-CORUS deal and ARCELOR-MITTAL deal, that made it clear to the rest of the steel-makers around the world that India has arrived on the global platform.
Key Words: Merger and Acquisition, Indian Steel Industry, Tata-Corus, Arcelor-Mittal

The objective of this paper is to highlight two of the most important deals in the Indian steel industry –TATA-CORUS deal and ARCELOR-MITTAL deal that made it clear to the rest of the steel-makers around the world that India has arrived on the global platform.
2. Indian Steel Industry: An Overview
The Indian iron and steel industry's journey during the post- Independence years has been eventful. At the time of independence, India had only three steel plants- Tata Iron & Steel Company, Indian Iron and Steel Company and Visvesvaraya Iron & Steel and a few electric arc furnace based plants and these operated in a capacity of about 1million ton. But today India
thhas made its way up to the 5 place among the crude steel producers of the world and the largest producer of sponge iron. As per official estimates today the Iron and Steel industry contributes about 2% of the Gross Domestic Product (GDP).
During its journey through the last 60 years the Indian steel industry has responded to the highs and lows of business cycles. Major changes in the industry occurred when during the first three five-year plans the steel industry came under the state control. From the mid 50s to the 70s, the setting up of large integrated steel plant in the public sector by the government at Bhilai, Durgapur, Rourkela and Bokaro created large scale capacity which made India the 10th largest steel producer in the world as crude steel production grew markedly to nearly 15 million tons in the span of a decade from a mere 1 million ton in 1947. But the trend could not be sustained from the late 70's onwards, as the economic slowdown adversely affected the pace of growth of the Indian Steel Industry. However, this phase was reversed in 1991-92, when the country replaced the control regime by liberalization and deregulation in the context of globalization. The provisions of the New Economic Policy initiated in the early 90's impacted the Indian Steel Industry in many ways:
· Large scale capacities were removed from the list of industries reserved for the public sector.
· Licensing requirement for additional capacities was also withdrawn subject to locational restrictions.
· Private sector came to play a prominent role in the overall set up.
· Pricing and distribution control mechanisms were discontinued.
· Iron and Steel industry was included in the high priority list for foreign investment, implying automatic approval for foreign equity participation up to 50% subject to the foreign exchange and other stipulations governing such investments in general. This limit has since been increased to 100%.
· Freight equalization scheme was replaced by a system of freight ceiling.
· Peak import tariff rates were reduced from more than 100% to about 30% average, which has since been reduced to 5%.
· Quantitative import restrictions were largely removed. Export restrictions were withdrawn.
With the opening up of the economy steel makers had better access to global manufacturing techniques. This, along with the pressures of a competitive global market, increased the need to enhance efficiency levels so as to become internationally competitive. This in turn eventually led to emergence of the private sector with the creation of around 9 million tons of steel capacity based on state-of-the-art technology and rapid growth in net production of finished steel: from about 16.1 million tons in 1992-93 to 25.2 million tons in 1996-97 (12% growth per annum).
After 1996-97, with the steady decline in
domestic economy's growth rate, Indian steel
industry's pace of growth slowed down and in
terms of all the performance indicators –
capacity creation, production, consumption,
exports and price/ profitability – the
performance of the industry fell below average.
However, from the year 2002, the steel industry
made a comeback helped by the growing
demand in China and its spectacular economic
growth. At the same time, with recoveries took
place in major markets, reflected by increase in
production, recovery of prices, return of
profitability, emergence of new markets, lifting
Vol. 2, No. 1, May 2014IUJ Journal of Management43

of trade barriers and finally, rise in steel
demand – globally.The rejuvenated Indian steel industry was clearly in its matured phase with a lot of mega expansion plans coming its way. For example- the decision of POSCO, South Korea to set up their 12 million tons integrated steel plant in Orissa has given the Indian steel industry a feel of what 'globalization' is all about.
Today when again the world stands in recession, all the sectors are trying to come out of it better and bigger. The Indian steel industry is no different. The uncertainties looming over the global business environment and the absence of a clear trend in the business cycle have resulted in uncertainties in demand and no clear price signal from the steel industry. Considering the nature of the industry where supply cannot be immediately controlled to influence the price, there is need for price stability for the steel producers to expand capacities. And this is where mergers and acquisitions play an important role by helping a business to consolidate. Moreover, Orissa Sponge Iron and Steel Limited has formed a strategic partnership, a subtle form of merger with Mount Everest Trading & Investment Limited (“MTIL”), an associate company of Monnet Ispat & Energy Limited and part of the Monnet Group (“Monnet Group”) promoted by Mr. Sandeep Jajodia. And so discussions on mergers and acquisitions become all the more important in this case.
3. Merger and Acquisitions in Steel Industry
Mergers and Acquisitions form a big part of the corporate finance world. One plus one makes three: well, this equation is the special alchemy of a merger or an acquisition. The key principle behind buying a company is primarily to create shareholder value over and above that of the sum of the two companies involved. When times are tough, companies often go for mergers and acquisitions. Bigger, better and stronger companies often go for buying other companies to create a more competitive, cost efficient company. Companies come together with the hope of getting greater market share or to achieve greater efficiency.
Although the terms Mergers and Acquisitions are uttered under the same breath which almost makes them synonymous to each other, both have slightly different meanings.
When one company takes over another company and then clearly establishes itself as the new owner, the purchase is called an acquisition. If we look from a legal point of view, the target company ceases to exist and the buyer's stock continues to be traded.
Now let us take a look at two of the most talked about mergers: TATA-CORUS followed by ARCELOR-MITTAL.
3.1. Tata-Corus Deal:
In the face of globalization, mergers and acquisitions in the recent times have surfaced as the apex strategic moves of business units' world over. Not only for existence and growth, such strategies have now been the preferred options even for establishing and/or expanding international presence of the onward looking corporate giants. India witnessed the largest ever overseas acquisition in April 2007 when Tata Steels Limited acquired the Anglo Dutch steel producer Corus Group Plc (Corus) for US $12.11 billion. After this acquisition Tata Steel emerged as the fifth largest steel producer in the world.
Corus:
The Corus was created by the merger of British Steel and Dutch steel company, Hoogovens. Corus was Europe's second largest steel producer with a production of 18.2 million tons and revenue of GDP 9.2 billion (in 2005). The product mix consisted of Strip steel products, Long products, Distribution and building system and Aluminum. With the merger of British Steel and Hoogovens there were two assets: the British plant asset which was older and less productive and the Dutch plant asset which was regarded as the crowning jewel by everyone in the industry. They had union issues and were burdened with more than $ 13 billion of pension liabilities. The Corus was making only a profit of $ 1.9 billion from its 18.2 million tons production per year (compared to $ 1.5 billion from 8.7 million tone capacity by Tata).The Corus was having leading
Vol. 2, No. 1, May 2014IUJ Journal of Management44

market position in construction and packaging in Europe with leading R&D. It was the 9th largest steel producer in the world. It opened its bid for 100 % stake late in the 2006. Tata (India) & CSN (Companhia Siderurgica Nacional, Brazil) emerged as the most powerful bidders.
CSN (Companhia Siderurgica Nacional):
CSN (Companhia Siderurgica Nacional) was incorporated in the year 1941. The company initially focused on the production of coke, pig iron castings and long products. The company was having three main expansions at the Presidente Vargas Steel works during the 1970's and 1980's. The first completed in the year 1974, increased installed capacity to 1.6 million tons of crude steel. The second completed in 1977, raised capacity to 2.4 million tons of crude steel. The third completed in the year 1989, increased capacity to 4.5 million tons of crude steel. The company was privatized by the Brazilian government by selling 91 % of its share.
The mission of CNS was to increase value for the shareholders, maintain position as one of the world's lowest-cost steel producer, maintain a high EBITDA and strengthen position as a global player. CNS had fully integrated manufacturing facilities. The crude steel capacity was 5.6 million tons. The product mix consisted of Slabs,
Hot and Cold rolled Galvanized and Tin mill products. In 2004 CSN sold steel products to customers in Brazil and 61 other countries. In 2002, 65 % of the steel sales were in domestic market and operating revenues were 70 %. In 2003, the same figures were 59 % and 61 % and in 2004 the same figures were 71% and 73 %.
The principal export markets for CSN were North America (44%), Europe (32%) and Asia (11%).
Tata Steel:
Tata steel, India's largest private sector steel company was established in the 1907.The Tata steel which falls under the umbrella of Tata sons has strong pockets and strong financials to support acquisitions. Tata steel was the 55th in production of steel in world. The company had committed itself to attain global scale operations.
Production capacity of Tata steel, at the time of the Tata-Corus deal is given in the table below:
The product mix of Tata steel consist of flat products and long products which are in the lower value chain. The Tata steel had a low cost of production when compared to Corus. The Tata steel was already having its capacity expansion with its indigenous projects to the tune of 28 million tons.
Vol. 2, No. 1, May 2014IUJ Journal of Management45
Exhibit 1: Production Capacity of Tata Steel during the Tata-Corus Deal
Existing Capacity 1 Tata Steel Jamshedpur 5 MT 2 Nat Steel Singapore 2 MT 3 Millennium Steel Thailand 1.7 MT
8.7 MT New Addition in India
4 Tata Steel Jamshedpur 5 MT
5 Tata Steel Jharkhand 12 MT 6 Tata Steel Orissa 6 MT 7 Tata Steel Chhatisgarh 5 MT 8 MT 8 Acquisition of Corus 19 MT Total 55.7 MT
Source:http://2.bp.blogspot.com/_sSRhT24M0wQ/SNXjPgws79I/AAAAAAAAAAU/4qCIQRUTAY4/s1600- h/tata1.bmp

Reasons Why Corus Decided to Sell It?
The motive behind the decision of getting offered for sale is;
o Total debt of Corus was 1.6bn GBPo Corus needed supply of raw material at
lower costo Though Corus had revenues of
$18.06bn, its profit was just $626mn (Tata's revenue was $4.84 bn & profit $ 824mn)
o Corus facilities were relatively old with high cost of production
o Employee cost was 15 % (whereas that of Tata steel was 9%)
Reasons Why Tata Decided to Bid?
The reasons for Tata's decision to bid are;
o Tata was looking to manufacture finished products in the mature markets of Europe.
o It manufactured low value long and flat steel products while Corus was known for producing high value stripped products.
o A diversified product mix would lead to reducing risks while higher-end products would add to bottom line.
o Corus held a number of patents and R & D facility.
o Cost of acquisition was lower than setting up a green field plant and marketing and distribution channels
o Tata is known for efficient handling of labor and it aimed at reducing employee cost and improving productivity at Corus
o It had already expanded its capacities in India.
o With the Corus deal in its bag, TATA would move from 55th in world to 5th in production of steel globally.
Tata Steel Vs CSN: The Bidding War:
There was a heavy speculation surrounding Tata Steel's proposed takeover of Corus ever since Ratan Tata had met Leng in Dubai, in July 2006.
deal at US$ 7.6 billion. Corus responded positively to the offer on October 20, 2006.Agreeing to the takeover, Leng said, "This combination with Tata, for Corus shareholders and employees alike, represents the right partner at the right time at the right price and on the right terms." In the first week of November 2006, there were reports in media that Tata was joining hands with Corus to acquire the Brazilian steel giant CSN which was itself keen on acquiring Corus. On November 17, 2006, CSN formally entered the foray for acquiring Corus with a bid of 475 pence per share. In the light of CSN's offer, Corus announced that it would defer its extraordinary meeting of shareholders to December 20, 2006 from December 04, 2006, in order to allow counter offers from Tata Steel and CSN.
Financing the Acquisition
By the first week of April 2007, the final draft of the financing structure of the acquisition was worked out and was presented to the Corus' Pension Trusties and the Works Council by the senior management of Tata Steel. The enterprise value of Corus including debt and other costs was estimated at US$ 13.7 billion.
The Integration Efforts
Industry experts felt that Tata Steel should adopt a 'light handed integration' approach, which meant that Ratan Tata should bring in some changes in Corus but not attempt a complete overhaul of Corus' systems. N.Venkiteswaran, Professor, Indian Institute of Management, Ahmedabad said, “If the target company is managed well, there is no need for a heavy-handed integration. It makes sense for the Tatas to allow the existing management to continue as before.”
The Synergies
Most experts were of the opinion that the acquisition did make strategic sense for Tata Steel. After successfully acquiring Corus, Tata Steel became the fifth largest producer of steel in the world, up from fifty-fifth position. There were many likely synergies between Tata Steel, the lowest-cost producer of steel in the world, and Corus, a large player with a significant presence
Vol. 2, No. 1, May 2014IUJ Journal of Management46

in value-added steel segment and a strong distribution network in Europe. Among the benefits to Tata Steel was the fact that it would be able to supply semi-finished steel to Corus for finishing at its plants, which were located closer to the high-value markets.
The Pitfalls
Though the potential benefits of the Corus deal were widely appreciated, some analysts had doubts about the outcome and effects on Tata Steel's performance. They pointed out that Corus' EBITDA (earnings before interest, tax, depreciation and amortization) at 8 percent was much lower than that of Tata Steel which was at 30 percent in the financial year 2006-07.
The Road Ahead
Before the acquisition, the major market for Tata Steel was India. The Indian market accounted for sixty nine percent of the company's total sales. Almost half of Corus' production of steel was sold in Europe (excluding UK). The UK consumed twenty nine percent of its production. After the acquisition, the European market (including UK) consumed about 59 percent of the merged entity's total production.
3.2. Arcelor-Mittal Deal:
cooperation and economic revival, with operations that spanned Luxembourg, Belgium, France and Spain and a fast growing conglomerate that was the brain-child of the Indian-born Lakshmi Mittal who built for himself turning around sick steel plants in rapidly expanding markets from Trinidad to Kazakhstan.The deal valued at $33.1 billion made it clear that shareholders activism has entered into the once staid and sleepy boardrooms of Europe. The agreement to pair with Mittal caps a wrenching turnaround for Arcelor's management, which once dismissed Mittal as a "company of Indians" but was forced to backtrack after shareholders threatened to revolt.Politicians in Europe who once criticized Mittal remained mum and the merger brought hope that the protectionist barriers against such deals may be eroding in Europe.Mittal paid €40.37 per share for Arcelor, which was almost doublewhat the
company was trading at, when Mittal first made an offer in January. The new company was re-christened as Arcelor-Mittal and it got headquartered in Luxembourg. The chairman of Arcelor-Mittal is Mr. Mittal himself at present, after the retirement of Joseph Kinsch, who was the chairman of Arcelor even before the merger had taken place.
The deal brought along with it not just a global leadership in terms of tons but also in terms of value.Getting to this point has involved a bruising fight for both sides. Mittal first made an unexpected €18.6 billion offer for Arcelor and was swiftly and harshly rebuked by Arcelor management and a chorus of European politicians who criticized everything from his grammar to his Indian origins to the quality of his company's steel. Arcelor's bare-knuckled defense strategy included refusing to meet with Mittal until a string of demands were met, and simultaneously orchestrating a €13 billion deal with Severstal of Russia to keep him away.
How the story of Arcelor-Mittal unfolded? - A summary.
· In January 2006, Mittal made a surprise bid of €18.6 billion for Arcelor.
· Arcelor management announced large dividend
· Arcelor came out with a very positive profit report, which was later found to be inflated.
· Arcelor made a rosy forecast for the future, in terms of performance
· Arcelor management and European politicians did not refrain from criticizing Mittal
· Arcelor placed, in front of Mittal, a string of demands and refused to meet Mittal until and unless the same were fulfilled
· Arcelor held talks with the Luxembourg government regarding writing a takeover law that would shut Mittal out.
· The unions of Arcelor also had their own fears of losing jobs and a reduction intheir social status
· The managers of Arcelor feared that Mittal will shift towards short-term goals from long-term goals, once it acquires
Vol. 2, No. 1, May 2014IUJ Journal of Management47

Arcelor. · In an attempt to bring anti-trust problems
for Mittal, Arcelor committed to buy North American Steel Company.
· The agreement contained a clause that made it difficult to go through with the sale.
· Arcelor made €13 billion deal with Severstal of Russia, including break-up fee of €140 million
· Arcelor, Mittal, and Severstal engaged in heavy advertising, meetings with investors and politicians
· Arcelor arranged a meeting with shareholders where Severstal would be approved, unless about 50% plus one of the shareholders voted the deal the down. This was an unusually high percentage. The meeting was stalled advertently till the Severstal deal got almost finalized
· Mittal raised offer to €26.5 billion, and agreed to cede some management control and family voting rights. This was nearly double the price per Arcelor share, at which Arcelor was trading at, prior to Mittal's bid in January.
· The Severstal deal was highly disapproved by the institutional shareholders and hedge funds, at the same time supporting the Mittal deal. Arcelor management feared that the shareholders would go against the buyback of shares which was a necessity to go through with the Severstal deal. Shareholders show unrest and threaten to oust Arcelor management and sue Arcelor board.
· The Arcelor board was sued by 6% of the Arcelor shareholders for selling at a very low price. And Arcelor found itself unlikely to succeed, given a very high premium on Arcelor shares, relative to pre-takeover battle price.
· Finally on June 25, 2007, Arcelor agreed to merge with Mittal steel, thereby putting an end to the five months battlebetween the two. The new company was then on known as Arcelor-Mittal.
The Tata-Corus and Arcelor-Mittal deals were two of the most important deals in the history of Indian steel industry. They put India on a global platform.
Active mergers and acquisitions (M&As) among players indicate the consolidation dynamics within the steel industry globally.
Consolidation among top steel companies would continue since industry players are engaged in an unfettered rush for scale. By doing so, the steelmakers are pursuing two main objectives: by purchasing additional production capacity they aim to both improve their cost structure and increase their market clout. The merger of the world's two biggest steelmakers Mittal Steel (Netherlands) and Arcelor (Luxembourg) created an industry giant whose output is nearly four times as much as that of the next biggest player (Nippon Steel) and eight times as much as SAIL's. If it continues like this, 35% of steel production will remain confined in the top 10 companies in the coming years. Consolidation among industry players would be driven by strategic fits between companies, rather than financially centered deals. A company can be a good strategic fit for merger if it has, among other things, attractive access to raw materials, production capabilities, proven success in complementary markets, new technologies or patented products and a successful global supply network.
In India the three biggest steelmakers, whose combined output is almost 20 million tons, have a market share of 51%. Their domestic competitors are numerous medium sized and small companies. One of these, for example, is Ispat with an output of 2 million tons. More mergers can be expected between companies of this size as these firms need to improve their position with regard to the powerful suppliers of raw materials. As different major global steel producers like Arcelor-Mittal, Posco and others are setting up plants in India, competition in the future will increase. In that case several mid-size domestic companies may go for mergers. But if we see from the current position of the industry we can
Vol. 2, No. 1, May 2014IUJ Journal of Management48

say that in future Indian steel industry will remain oligopoly or can become a competitive one.
4. Impact of Mergers
Mergers have a universal impact, practically everyone from society, shareholders, employees, and directors to financial institutions. Society can benefit from the merger if it results in producing goods at low costs due to economies of scale or improved management. The acquiring shareholders usually get poor returns and therefore very small average gains. However, target shareholders usually gain from mergers, as the acquirers have to pay a substantial premium over the pre-bid share price to convince target shareholders to sell. Employees may gain or lose from a merger activity. Mergers generate significant gains to the target firm's stockholders and buyers generally break even, there are positive benefits from mergers. The yardstick to measure a successful merger is the profit level. Profitability is the only overall significant identifier.
Value-Creation by Arcelor-Mittal Following points hint towards the value creation during post acquisition period.
· There was strong financial performance in the second half of 2006
· Full-year Earnings before interest, taxes, deprecia t ion , and amort iza t ion (EBITDA) rose 2.1% to $15.27 billion from $14.96 billion in 2005
· Combined sales slightly decreased in 2006 but had a quantum jump in 2007
· Sales figure for Mittal Steel was more than doubled after the merger
· Net income of the Company has risen from $3.36 billion to $6.10 billion in 2006 and $11.8 billion in 2007
· Venture into new businesses and markets like Luxembourg, Senegal, Libaria
· Enlarged brand portfolio
Value-Creation by Tata-Corus:
Following points hint towards the value creation during post acquisition period.
· Full-year Profit before Depreciation, Interest and Taxes (PBDIT) rose 21.3% to Rs. 8830.95 cr. from Rs. 7275.87 cr. In 2008
· Combined sales increased 12.61% to Rs. 19654.41 cr.
· Profit of the Company has risen from Rs. 3506 cr. To Rs. 4222 cr.
· Economies of scale· Forward integration for Tata Steel· Increased presence in global markets
Comparison between Tata-Corus and Arcelor-Mittal:
· In the Arcelor-Mittal deal, the Enterprise Value (EV)/EBITDA was 6.2 times while it was 9 times in case of Tata-Corus.
· In terms of EV/tonne too, Tata Steel's price (at $700 – 710 per tonne) was higher than what Arcelor commanded at $586 per tonne.
· In case of Arcelor-Mittal, the deal involved a share swap along with cash while Tata Steel had to shell out hard cash for Corus.
5. Conclusion
The liberalization of industrial policy and other initiatives taken by the Government have given a definite impetus for entry, participation and growth of the private sector in the steel industry. Whi l e the ex i s t ing un i t s a r e be ing modernized/expanded, a large number of new/Greenfield steel plants have also come up in different parts of the country based on modern, cost effective, state-of-the-art technologies. Indian steel players, now, concentrate on the global market as they know the trend of world market of steel. The rapid progress of the Indian automobile, engineering and construction industries means that the country will need more and more high-quality steel. Access to Corus technology will, in course of time, allows Tata Steel to move up in the value chain and in that case it will be win-win situation for TATA.
Mergers and acquisitions play important role in the Indian steel industry and they have helped put the industry on the global platform. As the world
Vol. 2, No. 1, May 2014IUJ Journal of Management49
today faces a recessionary phase, the steel industry should take this as an opportunity to improve operational efficiency and effectiveness so as to come better off after this phase is over. Mergers and acquisitions are an ideal way to make headway in production and especially in this recessionary phase they will help cut cost.
References
· Mantrawadi, P. and A. Vidyadhar Reddy (2007), “Relative Size in Mergers and Operat ing Performance: Indian Experience,” Economic and Political Weekly, Septermber 29, Pp. 3936-42.
· Mishra, A. K., and Rashmi Goel (2005), “Returns to Shareholders from Mergers: The Case of RIL and RPL Merger,” IIMB Management Review, September, Pp.69-79.
· Shrimali, Vijay and Karunesh Saxena (2004), “Mergers and Acquisitions: Sun is Shining Brightly”, Indian Journal of Accounting, Vol.xxxv(1), December.
· Ramakrishnan, K. (2008), “Long-term Post-Merger Performance of Firms in India”, Vikalpa, Vol. 33, No. 2, June.
· Annual Report of Tata Steel, 2006-07, 2007-08 and 2008-09.
· www.crisil.com/· www.ibef.org· www.ieindia.org· www.indiaprwire.com/· www.jpcindiasteel.nic.in· www.scribd.com· http://steelnews.com/· http://steel.nic.in/· http:// www.steelworld.com/· www.tatasteel.com· http://www.worldsteel.org/
Vol. 2, No. 1, May 2014IUJ Journal of Management50

Vol. 2, No. 1, May 2014
Rationale of Need and Gap Analyses in the Context of Corporate Social
Responsibility Activities Initiated by Coal Mining Industry
A. Surendra Babu1 and Sukanta Chandra Swain2
As per the Mines and Minerals (Development & Regulation) Bill 2011, Mining operations to be
conducted in accordance with Mining plan which should include scheme for Corporate social
responsibility (CSR) and Sustainable development, comprising of annual expenditure by the lessee on
socio – economic activities in and around the mine area for the benefit of the host population in the
panchayats adjoining the lease area and for enabling and facilitating self employment opportunities,
for such population and the lease holder shall, at the end of each financial year, publish in his annual
report and display on the website, the activities undertaken during the year and the expenditure
incurred there on. Owing to legal obligations, coal mining industry is persistently implementing
varieties of CSR initiatives. However, if the CSR initiatives are not exactly in line with the necessities
of the projected beneficiaries, there may arise a gap between the real benefits and the intended
benefits felt by the beneficiaries. Keeping this in mind, this article tries to put forth the justification of
Need analysis in order to avoid mismatch of CSR initiatives needed by the projected beneficiaries and
initiatives provided by the company and Gap Analysis pertaining to real benefits and the intended
benefits felt by the beneficiaries.
Key Words: CSR initiatives, Need Analysis, Gap Analysis, Coal Mining Industry
1 General Manager (Mining), SECL, CIL and Research Scholar of IUJ, E-mail: [email protected] 2 Asst. Dean, ICFAI University Jharkhand (IUJ), E-mail: [email protected]
51
Introduction:
Although the core objective of any business or
corporate is to maximize profit and maintain it on
a sustainable basis, as an artificial citizen of the
country it belongs, every business house has
certain sets of responsibilities towards the society
not just for obligatory ground but for fulfilment of
its core objective as well. As a gesture of these
sets of responsibilities, the concept of Corporate
Social Responsibility (CSR) has gained
momentum now a days' and has been the talk of
the business world in recent times. It refers to
conducting business with transparent business
practices that are based on ethical values,
compliance with legal requirements, respect for
people and communities, and concern for
environment. Thus beyond making profits,
companies are responsible for the totality of their
impact on 'People and Planet'. People constitute
shareholders, investors, employees, business
partners, clients, customers, suppliers, vendors,
civil society groups, government, non-
government organizations, and the community.
Planet covers concern for environment.
In short, Corporate social responsibility is a
company's commitment to its stakeholders to
conduct business in an economically, socially,
and environmentally sustainable manner that is
transparent and ethical. Thus corporate social
responsibility is all about “Doing well for society
and environment by doing well out of profits
through social innovation for building
everlasting social connectivity
The role of Corporate Social Responsibility
(CSR) in specially coal mining industry is vital
because of the fact that the public perception
about the organizational culture of coal mines is
required to be

Vol. 2, No. 1, May 2014IUJ Journal of Management52
changed for their acceptance as a good corporate
citizen by adopting best business practices which
are eco-friendly, transparent and ethical. The
public perception of coal mining industry can be
improved with innovative approaches in
discharging corporate social responsibility for
improving standard of life of under developed
and marginalised communities by providing
various facilities for community welfare,
infrastructure development, water supply,
educat ion, heal th, environment , ski l l
development, sports and culture etc. As the era is
passing through evolution of transparency,
Reporting and Disclosure's are virtually
obligatory.
2. Legal Provision of CSR Activities:
The Salient Features of Company's Bill, 2013
On CSR (Sec 135):
· Every company having net worth of
rupees five hundred crore or more, or
turnover of rupees one thousand crore or
more, or a net profit of five crore or more
during any financial year shall constitute
a CSR committee of the Board consisting
of three or more directors, out of which at
least one director shall be an independent
director.
· The Board's report under subsection (3)
of section 134 shall disclose the
composition of CSR committee.
· The CSR committee shall:
o Formulate and recommend to
the Board, a CSR policy which
shall indicate the activities to be
undertaken by the company as
specified in schedule VII.
o Recommend the amount of
expenditure to be incurred on the
activities referred in clause
(i),and
o Monitor the CSR policy of the
company from time to time.
· The Board of every company referred to
in subsection (1) shall:
o After taking in to account the
recommendations made by CSR
committee approve the CSR policy for
the company and disclose contents of
such policy in its report and also place it
on the company's website, and
o Ensure that the activities as are
included in CSR policy of the
company are undertaken by the
company.
· Board of every company shall ensure
that the company spends, in every
financial year, at least 2% of the average
of net profits of the company made
during the three immediately preceding
financial years, in pursuance of its CSR
policy, provided that the company will
give preference to the local area and
areas around it where it operates, for
spending the amount earmarked for CSR
activities, provided further that if the
company fails to spend such amount, the
Board shall, in its annual report specify
the reasons for not spending the amount.
Mines and Minerals (Development &
Regulation) Bill, 2011(Sec26 & Sec43):
· SEC26: Mining operations to be
conducted in accordance with Mining
plan which should include scheme for
Corporate social responsibility and
Sustainable development, comprising of
annual expenditure by the lessee on socio
– economic activities in and around the
mine area for the benefit of the host
population in the panchayats adjoining
the lease area and for enabling and
f a c i l i t a t i n g s e l f e m p l o y m e n t
opportunities, for such population and
the lease holder shall, at the end of each
financial year, publish in his annual
report and display on the website, the
activities undertaken during the year and
the expenditure incurred there on.
SEC 43: The holder of Mining lease shall
annually pay to the District Mineral

by the employees at all levels and it
should permeate into all the activities,
processes, operations and transactions of
the enterprise.
6. The Board level CSR Committee and the
designated nodal officer's team of
officers together will constitute the two-
tier organizational structure to steer the
CSR & Sustainability agenda of the
company.
7. The companies should disclose their
CSR & Sustainability initiatives on their
official websites. A brief summary of
CSR & Sustainability activities should
also be included in their Annual Report.
8. CPSE's would take up the following
initiatives for displaying their social
responsibility :
· Promote organizational integrity
and ethical business practices
th rough t ransparency in
disclosure and report ing
procedures,
· Leverage green technologies,
processes and standards to
produce goods and services that
contr ibute to social and
environment sustainability,
· Contribute to inclusive growth
and equitable development in
society through capacity
b u i l d i n g m e a s u r e s ,
e m p o w e r m e n t o f t h e
m a r g i n a l i s e d a n d
u n d e r p r i v i l e g e d
sections/communities,
· Promote welfare of employees
a n d l a b o u r ( c a s u a l o r
contractual), by addressing their
concerns of safety, security,
professional enrichment and
healthy working conditions,
whether mandated or otherwise.
However, expenditure on
mandated activities cannot
qualify for CSR's financial
Vol. 2, No. 1, May 2014IUJ Journal of Management53
Foundation, an amount equal to 26% of the
profit to be called as profit sharing percentage
(after deduction of tax paid) of the immediately
preceding financial year from mining related
operations in · respect of the lease; shall allot
free shares equal to 26%, through promoter's
quota in case the holder of lease is a company.
Guidelines on CSR and Sustainability for
Central Public Sector Enterprises:
CSR voluntary guidelines were issued in 2009 by Ministry of corporate affairs and for central public sector enterprises, guide lines were issued already on CSR in April 2010 by Department of Public enterprises, under Ministry of Heavy Industries & Public enterprises, GOI. And also guide lines on Sustainable Development were issued by DPE in September 2011.In supersession to all previous guidelines now revised guide lines on CSR and Sustainability for Central Public sector enterprises have been issued
stwith effect from 1 April 2013. These guide lines will stand modified by the provisions of the new Companies Act and updated SEBI guide lines as and when these are in place and made enforceable. The salient features of these guidelines are as under:
1. Public sector enterprises are required to
have a CSR and Sustainability policy
approved by their respective Boards of
Directors.
2. CPSE's should integrate and align their
CSR and Sustainability policies and
activities with their business goals, plans
and strategies.
3. CPSE's are expected to adhere to the
global standards in this regard and keep
in mind the UN Global Compact and the
UN Millennium Development Goals.
4. Mandatory compliance with legal
requirements/rules/regulations/laws in
letter and spirit will be covered under
CSR and Sustainability activity.
5. The philosophy and spirit of CSR and
sustainability should get embedded in
the core values of all CPSE's, be imbibed

Vol. 2, No. 1, May 2014IUJ Journal of Management54
Profit After Tax (PAT) of CPSE in the previous year
Range of budgetary allocation for CSR & Sustainability activities(as % of PAT in previous year)
(i) Less than Rs 100 crore 3% - 5% (ii) Rs 100 crore to 500 crore 2% - 3% (iii) Rs 500 and above 1% - 2%
components.
9. Every year ,each CPSE shall with the
approval of its Board of Directors make a
budgetary allocation for CSR and
Sustainability activities/projects and the
budgetary allocation will be based on the
profitability of the company in the
previous year as shown in Table 2.1.
However, sick or loss making companies
or those having a negative Net worth are
not mandated to earmark specific funds
for CSR & Sustainability activities.
10. Sustainability reporting and disclosure
of all CSR and Sustainability activities
undertaken by a CPSE is mandatory.
3. Major CSR Activities under CSR in Coal India Limited:
In coal mining industry, there is lot of positive
impact due to CSR initiatives, because mining of
coal has profound impact on the people living in
and around the areas where mines are established.
The obvious impacts of the introduction of any
production activity in such areas are; change in
the traditional lifestyle of the original inhabitants
and indigenous communities and also change in
the socio-economic profile of the area. Coal
companies were already having a culture in
involving community development activities to
mainta in harmonic re la t ionship wi th
neighbouring communities. Now with
mandatory CSR policy, Coal India and its
subsidiaries are actively indulged in taking care
of society, environment by not only taking care of
its internal stakeholders(specially employees)
,but also extending helping hand to adjacent
communities through various CSR initiatives
concerning community welfare, education,
health, drinking water, infrastructure, skill
development, environment, empowerment
of women, sports & culture, etc. The details
of CSR spending by Coal India Ltd and
SECL during 2009 -2012 are given below:
1) Education: Financial assistance to schools,
scholarships, adult literacy, cycles to needy
girl students.
2) Water Supply Including Drinking
Water:Installation and repair of hand
pumps, dug wells, bore wells, laying
pipelines.
3) Health Care: Organizing health awareness
camps on AIDS, TB, Leprosy, diet,
nutrition, family planning, facilities of
mobile medical vans etc.
4) Social Empowerment: Training and
Development in different fields such as
welding, fabrication, tailoring, farming etc
for weaker section of the community for self
employment.
5) Sports And Culture: Promotion of sports of
different events in coalfields including
nearby villages.
6) Infrastructure Support: Construction of
Community buildings, roads, culverts,
repairing and supply of furniture for
educational institutions.
7) Generation of Employment: By setting up
cooperative societies, construction of
shopping complex etc.
8) Relief of Victims against natural calamities.
9) Adoption of Villages: For carrying out
activities like infrastructure development
such as providing solar light, pavan chakki,
construction of roads etc.
10) Financial Assistance To Ngo's: For
undertaking different activities towards
uplifting of the under privileged, backward,
Table 2.1 Budgetary allocation for CSR by CPSE

Vol. 2, No. 1, May 2014IUJ Journal of Management55
physically and mentally challenged children.
11) Financial Support: For organizing medical
camps, free consultation, distribution of
medicines awareness for under privileged
and slum dwellers in association with local
community.
12). Various Activities Towards Protection of
Environment: The impact on the
environment due to extraction of coal is
being monitored constantly by the CIL
subsidiaries and adequate measures for
control of air, water, and noise pollution,
land degradation, deforestation etc are
being undertaken in accordance with the
provisions of all statutory norms, acts and
rules on a regular basis by way of the
fol lowing environment protect ion
activities:
PLANTATION – Massive plantation is
being carried out in command areas by
state forest department every year to
mitigate all sorts of pollution. Further the
following measures are being undertaken
to mitigate environment pollutions:
· Air pollution control measures.
· Water pollution control measures.
· Land reclamation/Restoration and
General cleanness.
· Noise pollution control measures.
· Environment Management Plan
monitoring.
· Executing statutory requirements of state
pollution control boards.
4. Rationale of Need and Gap Analysis:
Too often the community views the business
organization's aims as selfish gain rather than
advancement of the general welfare. This
impression can be removed only if corporations
are fully alive to their social responsibilities and
helps our society to function in harmony. There is
every possibility of perceiving the concept of
CSR activities in a wrong way owing to
traditional and rigid mind set of the projected
beneficiaries and making propaganda against the
efforts of the business houses in this regard by the
vested interest-group people and community. At
the same time, because of some additional
expenses of the business houses for CSR
activities and being unaware of the exact benefits
accrued to both the parties, very often the
business houses do CSR activities just for their
duty-sake keeping their whole-hearted
involvement aside from the project. By doing so,
not only they cheat the society but also they get
cheated by their own deeds. In fact, they do not
put their sincere effort in implementing CSR
initiatives with regard to the actual requirement
of target group of community, and then such
attempts would go in vain. Had the projected
benefits been assessed properly, probably every
business house would have preferred to adopt the
CSR activities as strategy for their growth and
CSR Spending in Coal India Ltd:
2009-10 2010-11 2011-12 S. No.
Company Budget
(Rs cr) Actual (Rs cr)
Budget (Rs cr)
Actual (Rs cr)
Budget (Rs cr)
Actual (Rs cr)
1 Coal India Ltd 43.81 40.14 262.28 152.33 553.33 77.00
2 South Eastern Coalfields Ltd
9.49 8.78 20.33 11.34 44.47 18.37

Vol. 2, No. 1, May 2014IUJ Journal of Management56
development. Thus there is a gap between what
potential impacts the CSR activities bring forth
and what the stakeholders perceive on it. There
should be proper assessment of the impact of
CSR activities on the society as a whole, which
requires Impact Assessment Study and that in
turn helps strengthening the social bonding
between coal producing company and adjacent
communities or villages.
• Had the projected benefits been assessed
properly, probably every business house
would have preferred to adopt the CSR
activities as strategy for their growth and
development. (Urge for Impact Analysis)
• Thus there is a gap between what actual
positive impacts the CSR activities bring
forth and what the hosts (coal
companies) perceive on it. (Urge for
Gap Analysis)
• Sometimes there may be mismatch of
CSR initiatives needed by the projected
beneficiaries and initiatives floated by
the business houses. (Urge for Need
Analysis).
For impact analysis, on the basis of secondary
data we can easily find out changes in two time
elements – before the launch of CSR initiatives
and after a period of time (about one year to five
years) since the launch of CSR initiatives -
pertaining to;
– Percentage of people living BPL
– Incidence and depth of diseases
– Ambience of the village
–Enrolment ratio in primary, secondary and
higher level of education
– Infant mortality rate
– Use of modern gadgets by the villagers
– The Primary data collected through in-depth
interview, questionnaire/schedule and
observation will be made use of to know the
feel good ratio of the villagers in the same two
time elements.
Pertaining to Gap Analysis, while the data to be
collected for Impact analysis will yield the actual
positive impacts of any CSR initiative, the data
related to the host's perception on it could be
collected through direct personal interview
method.
As Need Analysis is to be done before launching
any CSR activity, for this,
The secondary data will be used
– to know the facilities the villagers are
already accessing, and
– the necessary facilities they are deprived
of.
The primary data will be collected with the
help of questionnaire/schedule from the
projected beneficiary to know their priority
towards the set of facilities they are deprived
of.
By making use of the following quantitative
techniques the rationale of Need, Impact and Gap
Analyses can be established.
(a) For Need Assessment, Cluster Analysis
will be done so as to identify groups or
segments that are more like each other than
they are like members of other groups or
segments. It will help the Companies to find
out the cluster carrying the needy
respondents and their prioritized CSR
initiatives are to be taken up first
(b) For Impact Assessment, the technique of
correlation and Regression will be in use to
know whether there is any such association
between the CSR initiatives and the
parameters identified to know the changes.
(c) For Gap Analysis, the technique of
Dispersion will be in use so that both the
parties involved will come to know whether
the efforts are getting channelized properly
and, in fact, it will necessitate the future
courses of action on picking up CSR
initiatives. .
5. Conclusion:
CSR in Coal India means it is not just spending; it
is all about developing social bond between Coal
Company and local communities. In order to
create an effective social connectivity with
society, Coal companies are taking up long

gestation and high impact projects based on need
assessment through a transparent base line data
survey. However, for valuable outcome with
optimal societal welfare, there is a very need of
analysing the aspects as mentioned above. On the
basis of Need, Impact and Gap analyses, the
stakeholders involved in CSR initiatives will
come to know the real benefits of such activities
and hence will be aware of their rights and
responsibilities. Not only the beneficiaries will be
keen to take the advantages of the CSR activities
provided by Coal Company but also the
management who feel these activities
burdensome and tasking may get motivated to
adopt such activities as a strategy for their
growth. In fact, this study will help
understanding the role of CSR in strengthening
the social bond.
References: · Atkinson, G. (2000) Measuring
Corporate Sustainability. Journal of
E n v i ro n m e n t a l P l a n n i n g a n d
Management, 43,2, pp235-252
· Clarkson, M.B.E. (1995) A Stakeholder
Framework for Analys ing and
E v a l u a t i n g C o r p o r a t e S o c i a l
performance. Academy of Management
Review, Vol20, No.1, pp92-117.
· De Gues, A. (1997) The Living
Company. Harvard Business Review.
March-April, pp51-59.
· Doane, D. (2005) Beyond Corporate
Social Responsibility: minnows,
mammoths and markets. 37 pp215–229
· Holme, R. & Watts (2000) Corporate
Social responsibility: making good
business sense. WBCSD, available at
www.wbcsd.ch
· Hopkins, M. (1999) The Planetary
B a r g a i n : C o r p o r a t e S o c i a l
responsibility Comes of Age. London,
MacMillan.
· Martin, R.L. (2002) The Virtue Matrix:
Calculating the Return on Corporate
Social Responsibility. Harvard Business
Review, March
· Mellahi, K & Wood, G. (2002) The
Ethical Business – Challenges and
Controversies. Basingstoke, Palgrave.
· Mirvis, P. & Coocins, B. (2004) The Best
of the Good. Harvard Business Review,
December
· Sen, S. & Bhattacharya, C.B. (2001)
Does Doing Good Always Lead to Doing
Better? Consumer Reactions to
Corporate Social Responsibility. Journal
of . Vol XXXVlll, pp225-243
· www.coalindia.in
· www.globalissues.org
· www.iisd.org
· www.secl.gov.in
Vol. 2, No. 1, May 2014IUJ Journal of Management57

Vol. 2, No. 1, May 20141 Visiting Professor in Management Studies; Management Consultant, and Director,
Manna Centre for Ethics Research,Email: [email protected]
58
Introduction
The chairman of the Board of Deloitte & Touché, USA LLP said this: “Corporate leaders have a duty to build and foster a value-based culture that thrives on high ethical standards and makes corporate and social responsibility a top priority. Only by instilling these values in our respective organizations will we be able to bestow a promising future to the next generation”.
The senior management has to play a major role in instilling such ethical standards & values in any organization. This paper will indicate some of the ethical roles to be played by the senior management. These are not exclusive roles, but are of routine nature and have to be exercised, followed and course corrections carried out to make the organization a success.
Review of Literature
Human beings in to-day's world are bothered about perpetual conflicts, challenges and chaos in the society. Environmental problems are adding up to the sad scenes. Such strife is due to I
mbalances in mind and heart and not due to the marvelous development in technology and its application. Opportunities exist in the society to reduce such dilemmas which can be achieved by coupling development in all spheres along with humanism.
Lala (2006) says that an ethical leadership consists of “Communication, compassion, competence, coverage, decision making, humility, integrity, management, purpose, stamina, teamwork, training and vision”. He stresses the importance of 'compassion' in ethical leadership and quotes Churchill who calls compassion as 'deathless glory'.
Kaul (2007) quotes from 'Dhammapada', “It was not outward appearance of modesty or purity that made one noble but the purity of one's thoughts, purged of all defilements and established in the eternal Dhamma that made one noble”
The Old Testament says, “He who walks with the integrity walks securely”
Intellectuals of the recent past have this to say on ethical values:
Role of Senior Management in Ethical Related Actions
K. S. Naik1
The most critical issue in ethics management on one hand is the continual conflict between the economic performance of the firm, measured by revenues, costs & profits, stockholders’ interest and on the other hand the social performance of the firm, which is difficult to measure but represented by obligations to employees, customers, creditors, suppliers, distributors and members of the public in general. The paper presents the role of the Senior Management in inculcating the concepts of ‘Ethical Related Actions’ and the importance of such concepts in the ethical management of organizations.
Keywords: Ethical Related Actions (ERAs), Values, Cultures
· Rabindranath Tagore says, “What is
valuable to a man when he is bad
becomes worse than valueless when he
is good”.
· Vivekananda says, “Great error of all
ethical systems is failure to teach means
to refrain from doing evil”.
· Mahatma Gandhi says, “In the path of
morality, there is no such thing as
reward for moral behavior”.
· Sri Aurobindo says, “The kernel of true
ethical being remains always the same
– will, character, self-discipline, self
mastery – these are almost the first
conditions for human self perfection”.
In the 'Perspectives in Business Ethics' Hartman (2003) brings out various Ethical Theories and Approaches and indicates applications of Traditional Theories to Modern Business Making. She suggests that in corporate & business levels, the moral decision making processes can be regulated through the publication of code of conduct, code of ethics and corporate values of the company.
In the book 'Swami Vivekananda on Universal Ethics and Moral Conduct' by Swami Ranganathananda, the author says that ethics & morality are the “Real Basis of Life”. He adds: “All knowledge is within us. All perfection is there already in the soul but this perfection has been covered by nature; layer after layer of nature is covering this purity of the soul. We simply take the veil off; and the soul manifests itself in its pristine purity, its natural, innate freedom”.
Shekhar (2002) in his book, 'Ethical Choices in Business' states that ethics could have a descriptive aspect (D), a normative aspect (N) and an analytical aspect (A) which is called DNA of ethics. He puts all of them in six bundles of ethical lessons from history to improve our integrated understanding.
Chakraborty (2005) in his book, 'Ethics in Management – Vedantic Perspectives' leads us to a different direction which he terms as 'Moral Business Ashram'. The word “Ashram stands for a serene and calm, sacred and simple locale in a
wooded surrounding where individuals can practice self discipline and austerity for the consummation of a vow”. He says that, “it reflects the ingrained Indian ethos most of our managers secretly nurse”. Probably, “the ultimate idea is that an individual in Indian culture is the holyman”.
Sharma (2007) in his book, 'New Mantras in Corporate Corridors' says the foundation of Indian corporate model is based on Indian Ethics and the Spirit of Development. He says, that “in sharp contrast to the western model of 'Protestant Ethics' and the 'Spirit of Capitalism', the Indian ethics model with its emphasis on holistic development provides us a new model for future development of human society”, in which 'spirit of capital' or the 'artha' dimension of life is not negated but is driven by 'dharma or the ethics'. He further says that the “dharma driven 'artha' or the 'spirituality guided materialism' represents a balanced approach to development”. He adds, that, “Western ethos are rooted in individualism or the primary of self interest; eastern ethos favour 'lokasangraha' or the primary of collective interest and altruism; what required is a balance between the two”
Under the auspices of Global Ethics Foundation, Tubingen University, Germany, the former Prime Minister of England, Tony Blair, on 30-06-2000, gave a clarion call as “community within a nation, interfaith understanding, and community as an international idea”. He emphasized on “free trade is the key to prosperity for poor nations, debt relief and solidarity with poor nations, fight against crime and drug abuse on an inter nation basis, non destruction of environment, non-proliferation of nuclear threats and finally a great stress on revolution of information and biotechnology”.
Austin (1961), in his article 'Code of Conduct for
Executives' suggests a simple code of ethics for
executives. He says; “Business Ethics,
Corporate Morality, Corporate Ethics and similar
phrases mean nothing. The public's opinion of
the ethics of business and of the corporation is
based entirely on the actions of individual
business managers”. He adds that code of
conduct and other statutes only create an attitude
Vol. 2, No. 1, May 2014IUJ Journal of Management59

of suspicion. If business management is to be a
profession, it must meet the basic requirements of
the professions. One of these requirements is an
internally developed code of conduct that can be
and is professed as the code by which the
members of the profession will live. In his
opinion, the code should call on the executive to
assume the duty of: a) Placing the interests of this
company before his private interests; b) Placing
the interests of society before his own and his
company's interests; and c) Revealing the truth in
all cases of involvement.
Objectives of the Study
· To establish the role of the Senior
Management in ethical related actions
of a company.
· To find out as to who has the major role
in ethical related actions of a company.
The Senior Management? The Middle
Management? Or, The staff and
employees?
· To establish graphical relationships
between the roles Senior Management,
Middle Management and staff &
Actions.
Research Methodology
Five MNCs and five similarly placed Indian engineering companies were chosen. All the ten are Bangalore based. The chosen five MNCs comprise one from each country viz., Japan, USA, Germany, Sweden and Switzerland.The questionnaire prepared for different functional areas like Senior Management, Middle Management and Staff & Employees was different even though a few commonalities existed. From each company five numbers of senior managers, ten numbers of middle level managers and fifteen numbers of staff and employees were chosen. The feedback data obtained is indicated under the heading 'Research Findings'.
Ethical Landscapes
The National Business Ethics Survey, 2005, made by Ethics Resource Centre, USA, suggests eighteen critical elements of an organizational culture. These are the Ethical Related Actions pertaining to different levels of management and workers.They are as follows:
Vol. 2, No. 1, May 2014IUJ Journal of Management60
Management Levels Ethical Related Actions
Top Management • Communicates ethics as a priority • Sets a good example of ethical conduct • Keeps promises and commitments • Provides information about what is going on • Employees perceive that top managers are held accountable
Middle Management • Communicates ethics as a priority • Sets a good example of ethical conduct • Keeps promises and commitments • Employees perceive that middle managers are held
accountable for ethics violations Supervisors • Communicates ethics as a priority
• Sets a good example of ethical conduct • Keeps promises and commitments • Support employees in following organizational standards
Co-workers • Consider ethics while making decisions • Sets a good example of ethical conduct • Talks about importance of ethics • Support employees in following organizational standards • Employees perceive that non-managers are held accountable
for ethics violations.

Vol. 2, No. 1, May 2014IUJ Journal of Management61
The Ethics & Workplace survey made by Deloitte & Touché, USA 2007 throws up interesting data on the ethical scenarios in US workplaces. The survey shows a strong relationship between ethics and work-life balance. The employees at all levels are more likely to behave ethically at work when they have a good work-life balance. The statistics indicates the need and importance of providing employees with the means to attain a healthy work-life balance. Some of the salient features from the survey are given below:
The Ethics Resource Centre's (USA) National Business Ethics Survey 2009 highlights the following important findings:
· Misconduct at work is down from 57% in
2007 to 49% in 2009.
· Whistle blowing is up; more employees
said they had reported misconduct when
they observed. It was 58% in 2007 and
63% in 2009.
· Ethical cultures are stronger. The
strength of ethical culture increased from
53% in 2007 to 62% in 2009.
Balancing of Quality of work Life: % in agreement
• I think workers are more likely to behave ethically at work when they have good work life balance.
91%
• My employer is very supportive of any personal needs outside the workplace.
74%
• My job does not offer me sufficient opportunity to meet my work life balance needs.
30%
• I wish I had more time outside of work to spend with my friends and family.
60%
• I am very dissatisfied with my current work life balance. 26% What are the top factors promoting an ethical workplace environment?
• Behaviour of management 42%
• Behaviour of direct supervisor 30%
• Positive reinforcement of ethical behaviour 30%
• Compensations 29%
• Behaviour of peers 23% Why do people make unethical decisions in the workplace?
• Lack of personal integrity 80%
• Job dissatisfaction 60%
• Financial rewards 44%
• Pressure to meet goals 41%
• Ignorance of code of conduct 39% Can a company’s values promote an ethical workplace environment?
• My company’s values promote an ethical environment. 87%
• My company’s values emphasize a healthy work-life balance. 70%
• I personally agree with my company’s values. 85%
• I do not know what my company’s values are. 16%
• My company does not make its values clear to employees. 18%

Pressure to cut corners is lower. The
overall perceived pressure to commit an
ethics violation to cut corners, or worse –
declined from 10% in 2007 to 8% in
2009.
· Retaliation against those who reported
misconduct increased – which is a
negative trend.
To improve the ethical practices in an
organization, OCEG, Open Compliance and
Ethics Group, a consultant company in USA,
suggests in their 'OCEG on Time/Ethics' as
follows:
· Determine your organization's current
cultures.
· Learn whether your management and
employees have the same view of ethical
conduct.
· Align 'tone at the top' with real examples
of ethical leadership.
· Develop and encourage ethical thinking
in your organization.
· Establish organizational values around
ethical conduct.
· Evaluate your efforts and know what to
improve or change.
In the European Business Ethics Network's
Research conference in June 2003 at Oslo,
Norway, Prof.Joanne Ciulla founding faculty
member of the Jepson School of Leadership Studies, USA, gave a talk on 'Leadership as Morally Dignified'. She asked “Why is it ethically difficult to be a leader? What are the sets of problems that leaders face?” She said that what answers to these is ethical leadership. She said “Some we call moral luck (the ability of leaders to know whether their action will turn out to be perceived 'moral' or not), moral consistency, ethics of the means, ethics of the ends and blind morality”.
David Gebler in his article “Is Your Culture a Risk Factor', states that there are seven levels of an ethical organization namely: Financial Stability, Communication, Systems & Processes, Accountability, Alignment, Sustainability and Social Responsibility. While 'financial stability' is at the root and 'social responsibility' is at the top, a satisfactory co-existence of all the seven levels is equally important.
Research Findings
There are a few Ethical Related Actions (ERAs)
which every ethically managed company has to
observe. The degree of shouldering of such
responsibilities varies among employees, mid
managers and senior managers. The degree of
response of the employees, mid managers and
senior managers from MNCs and Indian
companies for shouldering such responsibilities is
indicated in the tabulations and the graphs shown
below:
Vol. 2, No. 1, May 2014IUJ Journal of Management
Table-1
Employees M id M anagement Senior
M anagement Ethical Related Actions
Indian Cos
M NCs Indian
Cos M NCs
Indian Cos
M NCs
Communicating ethics as a priority 7% 7% 5% 2% 95% 94% Sets a good example of ethical conduct 11% 13% 10% 15% 90% 94% W ho keeps promises and commitments?
11% 16% 10% 15% 90% 59%
W ho provides information about what is going on in ethics?
4% 7% 12% 15% 65% 65%
W ho are held accountable for ethics violations?
20% 20% 26% 17% 75% 76%
W ho supports in following organizational ethical standards?
5% 16% 14% 17% 85% 88%
W ho considers ethics as a priority while making decisions?
5% 2% 7% 15% 80% 82%
W ho talks more about importance of ethics?
0% 2% 7% 15% 99% 82%
Source: Primary Data
62

Vol. 2, No. 1, May 2014IUJ Journal of Management
Source: Primary Data Graph-2
63
Source: Primary Data
Analysis & Findings
· For all the eight ERAs, the major
responsibility for observance of the ERAs
is resting with the senior management of
both MNCs & Indian Companies.
· 20% each of employees from Indian
Companies and MNCs and 26% & 17%
Graph-1

Vol. 2, No. 1, May 2014IUJ Journal of Management
Table-2
Responses of Employees Mid Management ERAs of senior management
Indian Cos MNCs Indian Cos MNCs
Sets examples of ethical conduct 69% 76% 81% 83%
Keeps promises & commitments 64% 80% 64% 68% Top management held accountable for ethics violations
44% 64% 43% 79%
Communicates importance of ethics 67% 76% 69% 72%
Considers ethics while making decisions 69% 73% 74% 79% Supports mangers/employees in following organizational standards
69% 80% 76% 70%
Source: Primary Data
Graph-3
64
of mid managers from Indian Companies and
MNCs respectively agree that they are 'held
accountable for ethics violations'.All the
employees and mid managers may not be
satisfied with the ERAs of the senior
management in the organization. The percentage
of such satisfactions is indicated below:
Source: Primary Data should be held accountable for ethics
violations'.
· 64% & 79% of employees & mid
Analysis & Findings
A very high percentage of employees and mid management of Indian Companies & MNCs are satisfied with the observance of ERAs by the senior management. 44% & 43% of employees and mid managers respectively of Indian Companies opine that 'management

managers respectively of MNCs view that 'Top
Management should be held accountable for
ethics violations'.
Conclusions
Based on the responses of the employees, mid managers and Sr.Managers of the companies surveyed, and as indicated above, the following conclusions have been arrived at and suitable suggestions have been made: Ethical Related Actions is a 'Top Down' Approach:
For all the 'Ethical Related Actions' cited in the survey, from 'communicating ethics as a priority' to, 'who talks more about importance of ethics', the respondents from Indian companies and MNCs are of the unanimous opinion that 'senior management' has to shoulder more degree of responsibilities. This is a top down approach wherein the decisions are taken by the top management/senior management and percolated down to the bottom rung of management, workers and employees for implementation.
The employees & mid managers are satisfied
with the 'Ethical Related Actions (ERAs) of the
top/senior management:
From 'setting examples of ethical conduct' to
'supporting managers in following organizational
standards', the employees and mid managers of
the surveyed Indian Companies and MNCs are
generally satisfied with the ERAs of the
top/senior management. In the area of 'top
management held accountable for ethics
violations', the acceptance level of employees
and mid managers of Indian Companies are only
44% & 43% respectively. It is suggested that top
managers in both the MNCs and Indian
Companies should be held more accountable for
violation of ethical norms.
References
· Austin, W R. 'Code of Conduct for
Executives', Harvard Business Review,
September – October 1961
· Bajaj, P. S. (Col) & Agarwal Raj Dr.,
'Business Ethics', P7, Biztantra, 2009.
· Blair, T. 'Global Ethics Foundation',
Lecture at Tubingen University,
Germany, 2000
· Chakrabor ty, S . K. 'E th ics in
Management – Vedantic Perspectives',
PP26, 61, Oxford University Press,
2005.
· Deloitte & Touché, USA, 'Ethics &
Workplace Survey', 2007
· Hartman, L. P. 'Perspective in Business
Ethics', PP 6-36, Tata McGraw Hill,
2003.
· Kaul, K. 'Verses from the Dhammapada',
P218, Indialog Publications, 2007.
· Lala, R.M. 'In Search of Ethical
Leadership', P12, Vision Books, 2006.
· Sharma, S. 'New Mantras in Corporate
Corridors', PP66-87, New Age, 2007.
· Shekhar, R.C, 'Ethical Choices in
Business', PP26-50, Response Books,
2002.
· Swami Ranganathananda, 'Swami
Vivekananda on Universal Ethics &
Moral Conduct', Bhavan's Eternal
Values, Booklets PP1, 54,57,68-78,
Bharatiya Vidya Bhavan, 1995.
· The Ethics Resource Centre, USA,
'National Business Ethics Survey 2005'.
· The Ethics Resource Centre, USA,
'National Business Ethics Survey 2009'.
· The Author's Thesis, 2011
· www.European Business Ethics
Network.com, Ciulla Joanne, Research
Conference, June 2003.
· www.OCEG.com on 'Time/Ethics',
USA, 2002.
· www.working values ltd.com, Gebler
David, 'Is Your Culture – a risk factor'.
Vol. 2, No. 1, May 2014IUJ Journal of Management65

Vol. 2, No. 1, May 20141 Faculty Member, Department of Business Administration, SMI College of IT and Management, Kolkata and Research Scholar of IUJ
66
Factors Influencing Preferences for Green Products
Sudipta Majumdar1
Green products have less impact on the environment and less damaging to human health than traditional
products and are formed from recycled components, manufactured in a more energy-conservative way, or
supplied to the market in more environment friendly way. Traditional products are manufactured in the
traditional way. They are not being produced keeping environmental considerations in mind. Now, the
green products have started competing with the traditional or regular products, but there are barriers.
The two most important barriers are knowledge and awareness about the products. In this paper, we
intend to examine the impact of individual attributes of customers towards marketing of green products.
In the Indian context, green products are still consumed by a very small subset of customers and the
consumption is largely dependent on individual attributes, i.e. demographic and psychographic
characteristics.
Key words: Green products, environmental consciousness, psychographics, Green marketing
Introduction:
From the last decade onwards people became more concerned about their health as a result of which they are using more of green products. Now, green products can be stated as having less of an impact on the environment and are less damaging to human health than traditional products. Hence they are also called as sustainable or environment friendly product. Green products are formed from recycled components, be manufactured in a more energy-conservative way, or be supplied to the market in more environmental friendly way. So, people are becoming more aware about the concept of environmental consciousness. This reduces the usage of traditional or conventional products. Traditional products are those manufactured in the traditional way. They are not being produced keeping environmental considerations in mind. In today's competitive scenario green products are competing with the conventional or regular products (products produced by traditional methods).But, this usage pattern is not applicable
to all parts of the society. Knowledge and awareness about the green products play a very vital role in enabling the customers to use them. But, this awareness and knowledge do not exist, thus restricting the usage of the green products. From the last decade onwards, we have started using the green products and it will take time before it penetrates to all parts of the society. In comparison to the conventional products, green products are generally biodegradable, non-toxic in nature and more environment-friendly. In their book “The Green Consumer”, John Elkington, Julia Hailes, and John Makower discussed several characteristics that a product must have, to be regarded as a "green" product. They contended that a green product should not endanger the health of people or animals, damage the environment at any stage of its life, including manufacture, use, and disposal, consume a disproportionate amount of energy and other resources during manufacture, use, or disposal, cause unnecessary waste, either as a result of excessive packaging or a short useful life, involve the unnecessary use of or cruelty to animals and use materials derived from threatened species or environments.

The concept of green products is becoming more popular with the aspect of food items. Since people are becoming more health conscious, they are giving more importance to the consumable products. People started using more green products to minimize their health risk. But, here also like normal green products knowledge and awareness is not there in all parts of the society. So, these are more being used by the more knowledgeable parts of the society. Also, organizations and government are incapable of promoting the concept of “Green”. But the best part is, the concept has started and it is penetrating to the society at a very fast pace. If all the factors which contribute to the popularity of green products, such as price of the product, its quality, customer's perception about the products, awareness about them, are being handled carefully by the government and the organizations, then they will become more popular in the society. The concept of green products, specifically green food items can be popular only if organizations understand the concept of green marketing. But to define green marketing is not an easy task. While green marketing came into prominence in the late 1980s and early 1990s it was first discussed much earlier. The American Marketing Association (AMA) held the first workshop on "Ecological Marketing" in 1975. The proceedings of this workshop resulted in one of the first books on green market ing ent i t led "Ecological Marketing".
"Green or Environmental Marketing consists of all activities designed to generate and facilitate any exchanges intended to satisfy human needs or wants, such that the satisfaction of these needs and wants occurs, with minimal detrimental impact on the natural environment.”
Green marketing is a business practice that takes
into account customer concerns about the natural
environment. Green marketing campaigns
highlight the different environmental protection
characteristics for a company's products and
services. The green marketing strategies include
reduced waste in packaging (Elkington and
Makower 1988; Wasik 1996), increased energy
efficiency of the product in use (Metcalf ,2008 ;
Sue Wing 2008), reduced use of chemicals in
farming, or decreased release of toxic emissions
and other pollutants in production (Sumathi &
Hung, 2006). Organizations have responded to
the growing customer demand for environment-
friendly products in several ways, thus making
the various components of green marketing.
These include: 1) promoting the environmental
characteristics of products; 2) introducing new
products for the consumers concerned with
energy efficiency, waste reduction, sustainability,
and climate control, and 3) redesigning existing
products to satisfy these same consumers
Theories behind the Study:
In this paper, we intend to examine the impact of individual attributes of customers towards marketing of green products. In the Indian context, green products are still consumed by a very small subset of customers and the consumption is largely dependent on individual attributes, i.e. demographic and psychographic characteristics (Harper and Makatouni, 2002; Ahmed and Juhdi, 2010). Impact of these characteristics is more evident for green food product segment (Davies et al. 1985; Lea and Worsley, 2005). In the following section, we summarize the findings by published literature on these issues.
The demographic variables are related to the
basic characteristics of a person such as age,
gender, income etc. which affect the consumer
buying behavior. With respect to green products,
the various demographic variables which affect
customer's attitude towards green food products
are age, gender, household income, education,
social class, etc. The age of the customers
affected significantly the purchasing of organic
food products (Davies et al. 1985). Similar
observations were reported in some other papers
(e.g. Lea and Worsley, 2005) where impact of age
on customer's belief about the organic food
products was established. Middle-aged persons
have a strong positive belief about the effects of
organic items which they consider as an
alternative of conventional food products (Lea
and Worsley, 2005). Household income also
Vol. 2, No. 1, May 2014IUJ Journal of Management67

positively influences consumption and
purchasing of organic foods as reported in several
papers (Davies et al. 1995; Lea and Worsley
2005; Chinnici et al. 2002). Also it was examined
that the composition of a family infer that
households with children and specifically women
members of those families prefer buying more
green food items than that of the household
without children(Davies et al, 1985). The higher
formal educational level also positively
influences the purchasing behavior for organic
food items (Lockie et al. 2002; Ahmed and Juhdi,
2010). This is because more education makes the
consumers more aware about the environment
which will ultimately influence their purchasing
behavior.
We have found from the above discussion that, green food product consumption is being studied based upon some basic demographic variables. Since income of the consumer plays a pivotal role in green food product consumption, it can be further studied along with the effects of occupation. This aspect was examined on the consumers buying behavior but not on green food products (Cline et al. 2006). Also, no study has been made regarding the impact of cultural aspects (Razzaque, 1995) on green food product consumption. So, the study can be made in f inding out the relat ionship between consumption of green products and foods items with respect to occupation and cultural background of the customers.
From the existing literature, psychographics is being defined as the study of personality, values, attitudes, interests, and lifestyles (Senise, 2007). This mainly focuses on interests, activities and opinions (IAO) of the customers. Hence psychographic variables can be interpreted as combinations of demographic and psychological variables which impact customer's attitude in an overall manner.
It was observed that there is a general perception about organic food products catering mainly for higher social classes (Harper and Makatouni, 2002). It is further stated in the same paper that people from those classes have an affordability as well as consciousness regarding organic products, thus resulting in green food product
consumption. Few authors have also discussed about people's tendency towards safe and healthy organic products intake influencing positively the customers' intention to purchase them (Ahmed and Juhdi, 2010). Also, (Davies et al. 1995; Lea and Worsley 2005) in their paper referred that green consumers prefer buying organic food products for their health concern. So, health is an important factor driving the customers for green food product consumption. Contradictory results are also published in a paper by Pickett-Baker and Ozaki (Pickett-Baker and Ozaki, 2008), where authors fail to conclude any positive correlation between positive environmental beliefs and propensity of the customers to go for buying more green products.
Environmental knowledge and attitude play a significant role in customers' tendency for green food product purchasing as reported in several papers. Many authors stated that environmental consciousness generates more interest of the cus tomers towards o rgan ic p roduc t s (Schlegelmilch et al. 1996). Kaiser et al. (1999) in their paper reported that environmental values and environmental knowledge are important factors which affect ecological behavior intention ultimately helping in building customer's attitude towards organic products. Also Ahmed and Juhdi (2010) referred that customers are positively inclined towards environment friendly farming because of their environmental consciousness and it leads to positive customer intention to buy organic products. Lockie et al. (2002), said that the consumers' familiarity with the green products, generate more interest to consume them. This is common to conventional consumer's behavior. They also stated that the mood of the consumers, i.e., to keep him relax is positively correlated with organic food consumption. The customers believe that consuming organic food items make customers stress-free.
Apart from health consciousness and
e n v i r o n m e n t a l b e l i e f , s e v e r a l o t h e r
psychographic variables are also tested in
literature like customers belief towards
information authenticity, political motivation,
skepticism etc. Kozup et al. (2003) said that more
proper information from credible sources
Vol. 2, No. 1, May 2014IUJ Journal of Management68

increase the consumption of organic food
products because of customers' environmental
belief and authenticity of the information
provided. Similar observation was reported by
Schlegelmilch et al. (1996), by inferring that
more knowledge, i.e., detail factual information
about the organic products improves the chance
of customers' buying them. Also, it was said that
the customers' previous experience of using some
environmental brands i.e., the brands which
produce the products in environment- friendly
way have an impact on their chances of selecting
those brands only for repeated usage (Pickett-
Baker and Ozaki, 2008). In another paper, it is
being stated that recycling activities positively
influences pro-environmental purchasing
behavior for those customers who can dedicate
more time and effort (Schlegelmilch et al. 1996).
Same papers also stated that politically motivated
activities act positively only for those customers
who are environmentally conscious. In the paper
by Chang (Chang , 2011), it is being discussed
that perceived higher price, lower quality and
skepticism negatively and perceived emotional
benefits acting positively will create more
ambivalence attitudes of the customers towards
buying green products.
From the above discussion we conclude that the r e l a t i o n s h i p b e t w e e n e n v i r o n m e n t a l consciousness, beliefs, knowledge and green product usage had been studied, but not for green food products. So, research can be made to study the role of the above mentioned factors in creating customer's attitude towards green food products. Also the effect of information level about the food items in forming green product consumer behavior is also an interesting research area. No study had taken place to find out the impact of lifestyle, religion, social responsibility, risk taking characteristics (Razzaque, 1995) of the customers towards green product consumption, although these variables are applied in other fields. So, this study can be further extended to find out the effect of the above mentioned variables on building customers' behavior towards green products consumption.In addition to demographic and psychographic
variables, the different product specific variables affect the customers' attitude towards green products. The various variables discussed in the literature are environmental brands, brand name, product type (Green vs. non-green),preferences for green attributes for the products, green technology, energy savings .Whereas, with respect to green food products, Heart healthy claim on food products, nutritional information about the food products, nutritional content of the alternative products, price, product types (fresh fruit, fresh vegetables, meat, milk and dairy products, cereals and cereal products) were discussed in the literature.
In the paper by Pickett-Baker and Ozaki (2008), the author stated that environmental brands, i.e., the brands which produce the products in environmental-friendly manner will positively influences customers green product purchase decision. In his paper, Mobley et al. (1995) reported that only branded green products create positive impression in the minds of the customers. Lin and Chang, 2012) had said that green or non-green products affect the environmental conscious customers' usage amount for the products. Olson (2012) stated that using green technology consumers use more products with energy efficiency. He also stated that energy savings characteristics of the products positively influences customers attitude towards green products.
Kozup et al. (2003) stated in their paper that heart healthy claim, nutritional information on the food products partially affects consumer's evaluation of the packaged food products. Also, nutritional content of the alternative food items negatively influences consumer's evaluation of packaged food items. In other papers the authors discussed about the negative effect of price towards organic food consumption. So, price is a significant barrier for customer's attitude formation towards green food products consumption (Lockie et al. 2002).
From the above discussion, we find out that only environmental branded products impact customers' attitude. But no work had been done studying the role of environmental brands on green food product consumption and how unbranded green products impact customers’
Vol. 2, No. 1, May 2014IUJ Journal of Management69

attitude towards green products consumption. Also an interesting research area can be finding the role of price in green product consumption.
In addition to the demographic, psychographics and product specific variables, there are various external, i.e., environmental variables which leads to specific customer behavior. From the reviewed literature it was found that customer's attitude towards green food products s being affected by information people have about organic products, tasty, availability, expensive, food value , natural content, animal welfare, convenience, environmental protection, food production method, source of information, purchasing place(hypermarket, supermarket, o rg a n i c s t o r e s , f a r m s ) , p u r c h a s i n g difficulties(difficult to find, high prices, poor range of choice), word of mouth, marketing communications, information about green products, claim Type.Ahmed and Juhdi (2010) had discussed that information people have about organic food products negatively influences customer's purchase intention towards the products. But in another paper, the authors had reported that more information people have about the products, the more customers will be interested to consume them (Chinnici et al. 2002).Again,Lin and Chang (2012) stated that only the positive information about the products influences positively user's perception of the effectivity of the green products . Also, Pickett-Baker and Ozaki (2008) stated that effective marketing communications, i.e., communicating all the desired information about the product influences positively consumers' green product purchase decision. He had also reported that word of mouth communication is the most effective tool to convince the customers about the positive aspects of green products. Chang (2011) had stated that the claims organizations make about the products have a positive impact towards ad believability only if they are from authorized sources. Lea and Worsley (2005) had reported that organic food products tastes better than conventional products and availability and expense customers have to bear for these acts as barriers towards creating consumers belief about organic food items. Harper and Makatouni (2002) have concluded that more environmentally friendly food production method generates positive customers' perception about the products. Again more food
value creates more positive belief about the products. More natural content for the organic food items, concern for animal welfare and environmental protection creates more customers' interest towards these products (Lockie et al. 2002). And the customers were buying more organic food items from hypermarket, organic stores and farms where they are more motivated towards buying them by the overall environment.
Conclusion:
From the above discussion, we can see that different papers have reported varied roles of information in creating customers attitude towards green products. So, this inconsistent relationship can be tested with respect to green food items. Also, study can be done to find out the most effective way the organizations can use to convince the customers about green products. Some papers find out that taste sometimes positively and sometimes negatively influences green food product consumption. So, studying the impact of taste in case of green food product consumption will be an interesting research area
References:
· Ahmad, S. & Juhdi, N.Organic Food: A Study on Demographic Characteristics and Factors Influencing Purchase Intentions among Consumers in Klang Valley, Malaysia International Journal of Business and Management, 2010, Vol. 5(2), pp. 105-118
· Bamberg, S. How does environmental c o n c e r n i n f l u e n c e s p e c i f i c environmentally related behaviors? A new answer to an old question Journal of Environmental Psychology, 2003, Vol. 23, pp. 21–32
· Chang, C. Feeling Ambivalent About Going Green Implications for Green Advertising Processing The Journal of Advertising, 2011, Vol. 40(4), pp. 19-31
· Chinnici, G.and D'Amico, M. & Pecorino, B. A multivariate statistical analysis on the consumers of organic products British Food Journal, 2002, Vol. 104(3/4/5), pp. 187-199
· Davies, A., Titterington, A. & Cochrane,
Vol. 2, No. 1, May 2014IUJ Journal of Management70

C. Who buys organic food? A profile of the purchasers of organic food in Northern Ireland British Food Journal, 1995, Vol. 97(10), pp. 17-23
· Harper, G. & Makatouni, A. Consumer perception of organic food production and farm animal welfare British Food Journal, 2002, Vol. 104(3/4/5), pp. 287-299
· Kaiser, F., Wolfing, S. & Fuhrer, U. Environmental attitude and Ecological behavior Journal of Environmental Psychology, 1999, Vol. 19, pp. 1-19
· Kozup, J., Creyer, E. & Burton, S. Making Healthful Food Choices: The Influence of Health Claims and Nutrition Information on Consumers' Evaluation of Packaged Food Products and Restaurant Menu Items Journal of Marketing, 2003, Vol. 67, pp. 19-34
· Lea, E. & Worsley, T. Australians' organic food beliefs, demographics and values British Food Journal, 2005, Vol. 107(11), pp. 855-869
Lin, Y. & Chang.C.A. Doubie Standard: T h e R o l e o f E n v i r o n m e n t a i Consciousness in Green Product Usage Journal of Marketing, 2012, Vol. 76, pp. 125-134
· Lockie, S., Lyons, K., Lawrence, G. & Mummery, K. Eat ing 'Green ' : Motivations Behind Organic Food Consumption in Australia European Society for Rural Sociology, 2002, Vol. 42(1), pp. 23-40
· Mobley, A., Painter, T., Untch, E. & Unnava, H. Consumer Evaluation of
Recycled Products Psychology & Marketing, 1995, Vol. 12(3), pp. 165-176
· Moisander, J. Motivational complexity of green consumerism International Journal of Consumer Studies, 2007, Vol. 31, pp. 404-409
· Olson, E. It's not easy being green: the effects of attribute tradeoffs on green product preference and choice J. of the Acad. Mark. Sci., 2012
· Pickett-Baker, J. & Ozaki, R. Pro-environmental products: marketing influence on consumer purchase decision Journal of Consumer Marketing, 2008, Vol. 25(5), pp. 281-293
· Raghunathan, R., Naylor, R. & Hoyer, W. The Unhealthy = Tasty Intuition and Its Effects on Taste Inferences, Enjoyment, and Choice of Food Products Journal of Marketing, 2006, Vol. 70, pp. 170-184
· Razzaque, M. (1995), 'Demographics, Psychographics and Consumer Value Dimensions: a Study of Consumers in a Traditional Asian Society', European Advances in Consumer Research 2, 183-192.
· Schlegelmilch, B., Arizona, B., Bohlen, G. & Diamantopoulos, A. The link between green purchasing decisions and measures of environmental consciousness European Journal of Marketing, 1996, Vol. 30(5), pp. 35-55
· h t t p : / / w w w . e n v i r o -news.com/glossary/green_products.html
· http://escholarship.org/uc/item/49n325b7· http://www.inc.com/encyclopedia/green-
marketing.html
Vol. 2, No. 1, May 2014IUJ Journal of Management71

Introduction
Data mining can be defined as a process that uses a variety of data analysis tools to discover patterns and relationships in data that may be used to make valid predictions. Data mining tools are based on highly automated search procedures. In present era various insurance companies are producing enormous amounts of information regarding medical facilities provided by them which are difficult to select. So, there is a need of powerful automated data mining tools for analysis and interpreting the useful information from this data. This information is very valuable for a customer to understand the cause of diseases and the benefits provided by the companies in order to cost effective treatment to patients. Data mining offers novel information regarding healthcare which in turn helpful for making financial as well as medical decision. We describe our framework, problem formulation, evaluation metrics, and experimental results on the basis of data from a large range of health insurer providedby different banking sectors like Bank of India, Punjab national bank, State bank of India
with collaboration with national insurance, the oriental insurance company limited.
Because of the rapid progress of information technology, the amount of information stored in insurance databases is rapidly increasing. These huge databases contain a wealth of data and constitute a potential goldmine of valuable business information. Health insurance becomes a major field for insurance companies now a days. Different companies are providing different lucrative scheme to fetch the customer's attention. These schemes are full with medical benefits. This article addresses the selection of the health insurance plan in customer point of view. We first propose a table to gather various medical services (facilities) provided by different banks and insurance companies. Then, with this table, we applied data mining technique to extract best medical information for the customer. The outcome shows several interesting results, which suggest that the reuse of stored data will give a powerful tool to improve the decision quality taken by the customer.
Vol. 2, No. 1, May 2014
Modeling Health Insurance Selection in IndianMarket using Data Mining Approach
Pratik Biswas and Partha Sarathi Bishnu
Health insurance costs across the world have increased alarmingly in recent years, just as the number of insurance companies and their health care schemes have also gone up. In view of high expense in medication, health insurance policy is very essential for individuals today. These policies are provided by both insurance companies and banking sectors with different medical plans. The selection of appropriate medical insurance plan by a customer has been becoming a difficult task day by day. Perhaps this is the reason why a web site like policybazar.com is so popular from customer's point of view. In this paper, authors made an attempt to health insurance policy selection using Data mining approach.
Keywords: Data mining, Customer satisfaction, Healthcare.
model
1 Faculty Member, FST, IUJ , E-mail ID: [email protected] 2 Assistant professor, BIT, Ranchi, E-mail ID: [email protected]
72
1 2
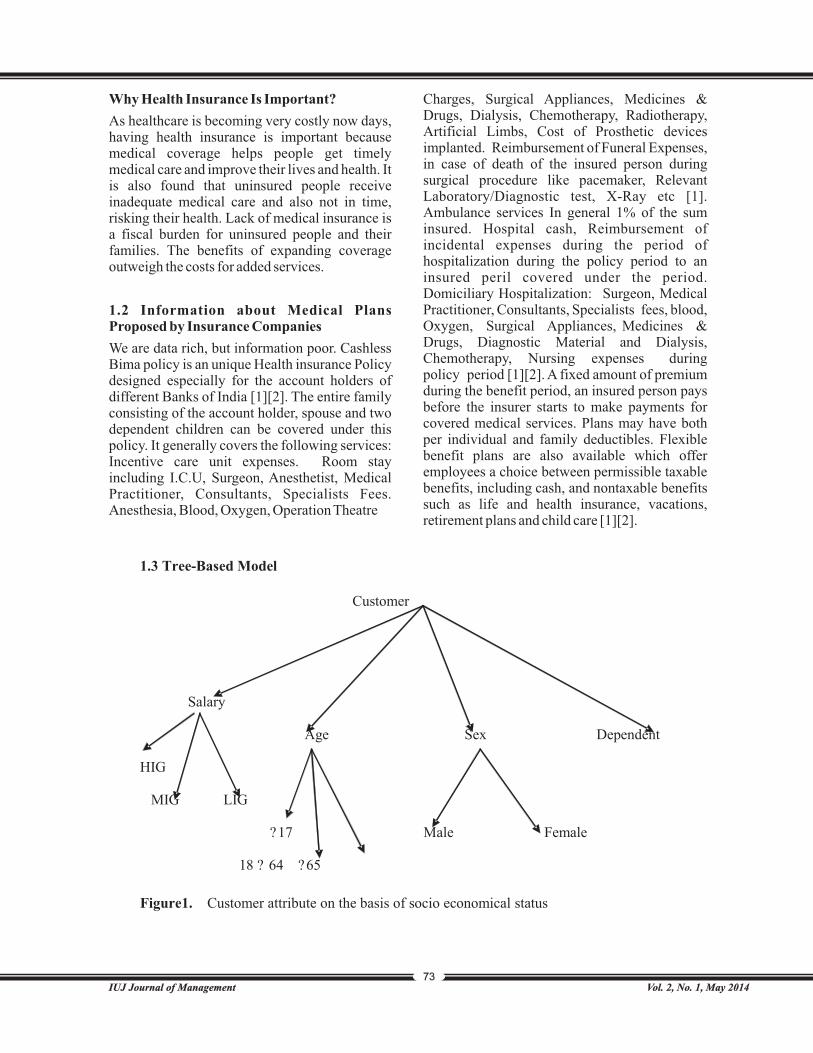
Vol. 2, No. 1, May 2014IUJ Journal of Management
1.3 Tree-Based Model
Customer
Salary
Age Sex Dependent
HIG
MIG LIG
?17 Male Female
18 ? 64 ?65
Figure1. Customer attribute on the basis of socio economical status
73
Why Health Insurance Is Important?
As healthcare is becoming very costly now days, having health insurance is important because medical coverage helps people get timely medical care and improve their lives and health. It is also found that uninsured people receive inadequate medical care and also not in time, risking their health. Lack of medical insurance is a fiscal burden for uninsured people and their families. The benefits of expanding coverage outweigh the costs for added services.
1.2 Information about Medical Plans Proposed by Insurance Companies
We are data rich, but information poor. Cashless Bima policy is an unique Health insurance Policy designed especially for the account holders of different Banks of India [1][2]. The entire family consisting of the account holder, spouse and two dependent children can be covered under this policy. It generally covers the following services: Incentive care unit expenses. Room stay including I.C.U, Surgeon, Anesthetist, Medical Practitioner, Consultants, Specialists Fees. Anesthesia, Blood, Oxygen, Operation Theatre
Charges, Surgical Appliances, Medicines & Drugs, Dialysis, Chemotherapy, Radiotherapy, Artificial Limbs, Cost of Prosthetic devices implanted. Reimbursement of Funeral Expenses, in case of death of the insured person during surgical procedure like pacemaker, Relevant Laboratory/Diagnostic test, X-Ray etc [1]. Ambulance services In general 1% of the sum insured. Hospital cash, Reimbursement of incidental expenses during the period of hospitalization during the policy period to an insured peril covered under the period. Domiciliary Hospitalization: Surgeon, Medical Practitioner, Consultants, Specialists fees, blood, Oxygen, Surgical Appliances, Medicines & Drugs, Diagnostic Material and Dialysis, Chemotherapy, Nursing expenses during policy period [1][2]. A fixed amount of premium during the benefit period, an insured person pays before the insurer starts to make payments for covered medical services. Plans may have both per individual and family deductibles. Flexible benefit plans are also available which offer employees a choice between permissible taxable benefits, including cash, and nontaxable benefits such as life and health insurance, vacations, retirement plans and child care [1][2].

Vol. 2, No. 1, May 2014IUJ Journal of Management74
Pi Dj = 1,When policy (Pi ) covers disease (Dj) ---(1)
Pi Dj = 0 , policy (Pi) does not covers disease (Dj)
For, i = 1,2, …,n and j = 1,2,…,m.
n is no. of policies and m is no. of diseases.
In figure1 customer's attribute is shown on the basis of socio economical status, here customers are broadly divided into four categories, Salary: High income group. Middle income group and lower income group. Age: below 17, years in between 18 to 64 years and senior citizen that is above 65. Sex: whether male or female and at last dependent or not. It is made because health insurance policies are also following certain rules .A customer can have the maximum benefit only when the match between the policy and requirement is perfect.
2. Methodology
We now discuss about the selection of medical insurance by applying data mining technique.
2.1. Data acquisition: The first step is to gather information about the benefits given by the various insurance companies either by verbal communication or from webpage of the company. We construct an initial table, “Table1”, where summary information regarding policies and diseases are plotted with the following conditions [12]:
2.2. Customer Preference Data: Customers are divided in to four groups on the basis of their socio economical status, and then the data (information) are processed on the basis of their priorities. Here we construct another table on the basis of distance calculation (d ) [k = 1, 2, ... n] k
between policies and customer preference using formula [12]:
d(i,j) = v ( xi1 - xj1 )2 + (xi2 - xj2 )
2 + ………………
…..+ (xin - xjn )2 ---(2)
Where i = (xi1, xi2, … xin) and j = (xj1, xj2 ,…xjn)
are two n dimensional data object .
We had selected min (dk) for k = 1, 2, …….n., the kth
policies will be best selection for the customer.
Table 2 indicates customer's preferences towards
coverage of dieses by”1” and dissatisfaction by
“0”. Here selection is done by one particular set of
customers, which may change according to the
change in priority of the customer.
2.3 Selection Method:
In figure2 collection of information and their
comparison is shown, next we select the best one
on the basis of the distance formula using
equation2 and the minimum distance indicates
the customer's preference and plotted in table 2 .
3. Conclusion:
It may be noticed that there are anomalies in the
selection of policies since expectations of
different types of customers from health
insurance are different. For some, it may be only
healthcare benefits whereas for some it is tax
benefit that is more important. It is found that
whether it is a private insurance company or a
government organization, facilities given are
similar, with the only difference being in their
terms and conditions and premium amount.
However, each person would like to take only one
policy. Hence, the suggested technique is useful
for appropriate policy selections by different
profiles of customers
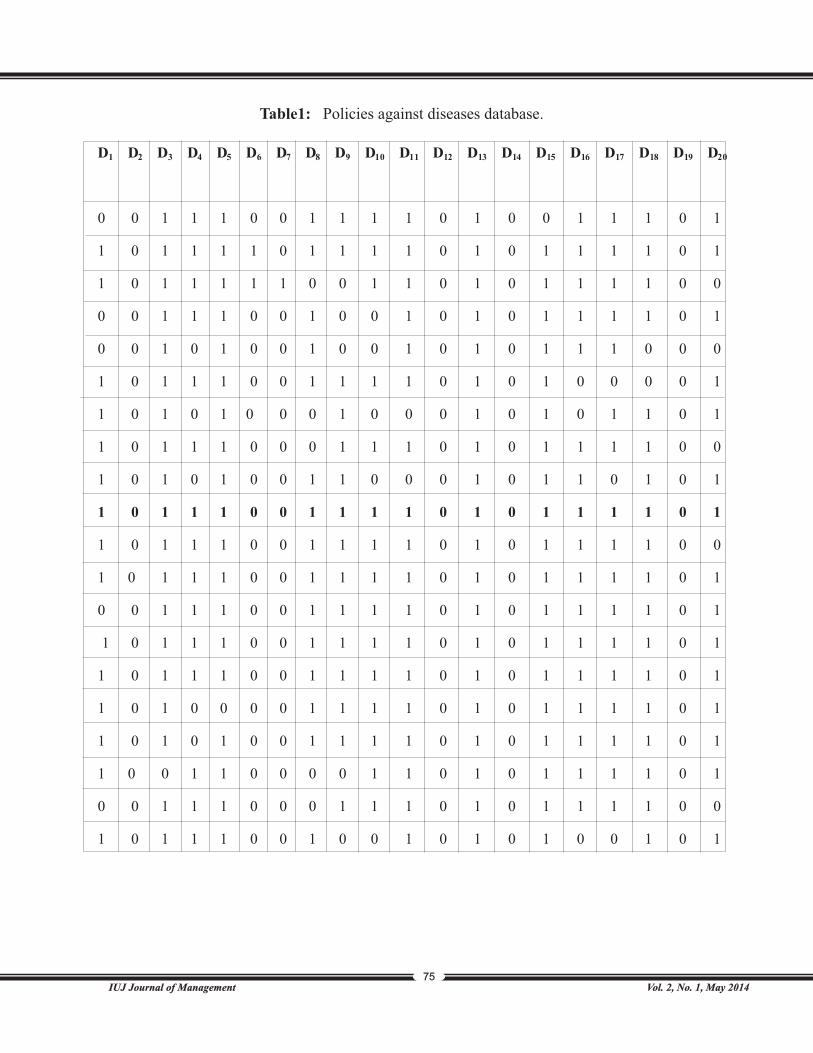
Vol. 2, No. 1, May 2014IUJ Journal of Management
D1 D2
D3
D4
D5
D6
D7
D8
D9
D10
D11
D12
D13
D14
D15
D16
D17
D18
D19
D20
P1 0 0 1 1 1 0 0 1 1 1 1 0 1 0 0 1 1 1 0 1
P2 1 0 1 1 1 1 0 1 1 1 1 0 1 0 1 1 1 1 0 1
P3 1 0 1 1 1 1 1 0 0 1 1 0 1 0 1 1 1 1 0 0
P4 0 0 1 1 1 0 0 1 0 0 1 0 1 0 1 1 1 1 0 1
P5 0 0 1 0 1 0 0 1 0 0 1 0 1 0 1 1 1 0 0 0
P6 1 0 1 1 1 0 0 1 1 1 1 0 1 0 1 0 0 0 0 1
P7 1 0 1 0 1 0 0 0 1 0 0 0 1 0 1 0 1 1 0 1
P8 1 0 1 1 1 0 0 0 1 1 1 0 1 0 1 1 1 1 0 0
P9 1 0 1 0 1 0 0 1 1 0 0 0 1 0 1 1 0 1 0 1
P10 1 0 1 1 1 0 0 1 1 1 1 0 1 0 1 1 1 1 0 1
P11 1 0 1 1 1 0 0 1 1 1 1 0 1 0 1 1 1 1 0 0
P12 1 0 1 1 1 0 0 1 1 1 1 0 1 0 1 1 1 1 0 1
P13 0 0 1 1 1 0 0 1 1 1 1 0 1 0 1 1 1 1 0 1
P14 1 0 1 1 1 0 0 1 1 1 1 0 1 0 1 1 1 1 0 1
P15 1 0 1 1 1 0 0 1 1 1 1 0 1 0 1 1 1 1 0 1
P16 1 0 1 0 0 0 0 1 1 1 1 0 1 0 1 1 1 1 0 1
P17 1 0 1 0 1 0 0 1 1 1 1 0 1 0 1 1 1 1 0 1
P18 1 0 0 1 1 0 0 0 0 1 1 0 1 0 1 1 1 1 0 1
P19 0 0 1 1 1 0 0 0 1 1 1 0 1 0 1 1 1 1 0 0
P20 1 0 1 1 1 0 0 1 0 0 1 0 1 0 1 0 0 1 0 1
75
Table1: Policies against diseases database.

Vol. 2, No. 1, May 2014IUJ Journal of Management76
D 1 2 3 4 5 6 7 8 9 10 11 12 13 14 15 16 17 18 19 20
Customer[Cj] 1 0 1 1 1 0 0 1 1 1 1 0 1 0 1 1 1 1 0 1
START
Collection of information about
policy
Comparison with customer performance
using distance calculation Select the best one
STOP
Figure2. The Workflow of Decision Model.
Table2: Customer pereference table

Vol. 2, No. 1, May 2014IUJ Journal of Management77
References
· Abdullah Al- M. Farrukh Saleem, Zahid Ullah(2009) . ” Efficient implementation of data mining: improve customer's behavior” IEEE 978-1-4244-3806-8/09/ PP. 7-10.
· Han, J. Kamber, M.(2006) Data Mining: Concepts and Techniques, 2nd edition,, Morgan Kaufmann.
· Krzysztof J. Cios, G. William Moore (2002). ”Uniqueness of medical data mining “Artificial Intelligence in Medicine” 26 .PP 1–24.
· Lijia, G. A.S.A. Applying Data Mining Techniques in Property~Casualty Insurance” University of Central Florida. PP. 1- 25.
· Marisa S. Viveros, John P Nearhos, Michael J. Rothman.( 1996) “Applying Data Mining Techniques to a Health Insurance Information System”. Proceedings of the 22nd VLDB Conference Mumbai (Bombay), India, PP. 288 – 294.
· Randall R. Bovbjerg and Jack Hadley(2007) “Why Health Insurance Is Important”. D DC SPG-SDC SPG no.1 November.pp.1 – 3.
· Sadh, A. and Chitale, S. (2001) “Customer Relationship Management a n d T h e B a n k i n g I n d u s t r y ” , Productivity, Vol. 42 (1) pp. 65-81.
· Steinberg Dan, Ph.D.(2008)“Data
Mining Opportunities in Health
Insurance, Methods Innovations and
Case Studies” Salford Systems , PP1 -
39.
· www.aegonreligare.com
· http://www.bankofindia.co.in/english/sw
asthya.aspx
· http://www.bharti-axagi.co.in/
· www.cholainsurance.com
· http://www.cignattkinsurance.in
· https://epolicy.sbilife.co.in
· www.hdfcergo.com
· http://www.medguideindia.com/medicali
nsurance/health-insurance-product-list.ht
ml
· http://www.medindia.net/patients/insura
nce/health-insurance-companies/health-i
nsurance-companies-united-states.htm
· http://www.royalsundaram.in/Health-Ins
urance.aspx
· www.starhealth.in
· www.theorientalinsurance.com
· http://www.webcrawler.com/info.wbcrwl
.302.03/search/web?q=health+insurance
+providers+list

Vol. 2, No. 1, May 2014
Mall Shopping in Small Cities: Mania or Necessity?
Nidhi Kumari1
Mall shopping is fast mesmerizing the residents of small cities like Patna, with a rising progression of classy malls that gives an opportunity to do effective and efficient shopping and spare quality time with family and friends. Shopping from mall has become a status symbol. Mall shopping is fascinated because of the attraction in the looks and the comfort it caters. Mall comfort, good economic condition and busy life style of consumers have become the three main drivers of mall shopping. This study specifically explores the ideas across necessity of shopping and mania for shopping towards shopping mall. The results explain different traction of the trend of Mall shopping in small cities.
Key Words:Mall Shopping, Small Cities,
1 Research Scholar, ICFAI University Jharkhand, Ranchi, E-mail ID: [email protected]
78
Introduction
Bihar's capital, Patna, is the most populous and the largest city of Bihar. Patna retail market has undergone a major image change in the last few years. The economic condition of Patna has seen a sustained growth. Shopping is one of the favorite entertaining activities in Patna. The market of organized retail industry has been steadily rising in Patna. The importance on infrastructure, facilities and the services provided under one top has allowed an improved version of shopping hub.
It can be stated undoubtedly that the growth of retail organized chains, branded shopping malls is the proof that consumer behavior is changing positively towards Mall shopping. Basically shopping mall abbreviated “one stop service” means a super market which provides varieties and range of products e.g. households, clothes, kid's corner, fun zone, food & coffee corner, theatre and education all within one campus. Thus shopping mall has become a fashion mall.
In India, Mall shopping has been in practice for the past 12 years, but for many people in Patna this is still an unfamiliar activity. Therefore as far as the real shopping for goods and products is concerned, this is not wrong to say that old and traditional shopping centers like Patna Market, Hathwa Market, Lalji Market, and Kurji Market etc. have also positioned their trust in the mind and heart of customers since many years. The
customer's loyalty with this trust ensures steady sales in unorganized retail market as well. Therefore in circumstances, where new model of retailing, specially shopping malls, are increasing at a rapid pace in Patna and also, due to limited success of major outlets of these upcoming malls, it is necessary for managers of malls to identify the factors behind consumer behavior towards mall shopping.
Objective:
1. To understand the shopping orientation towards mall shopping in small cities.
2. To identify the impact of demography like age, income, occupation on mall shopping in small cities.
3. To understand the retailers perception towards mall shopping.
Plan of the Study
In order to analyze the motive behind mall shopping, a survey on opinion towards mall shopping through a conversation between married couples is undertaken. In this study, both primary and secondary data are used. Secondary data are collected via internet from different sites. For collecting primary data by interview method, two sample groups were taken. One sample size of 10 respondents are chosen for interviewing retailers of shopping mall and another sample size of 20 respondents are chosen randomly from the shoppers of Shopping Mall.

Vol. 2, No. 1, May 2014IUJ Journal of Management
Some of the trendy shopping malls in the Patna retail market are:
Name of the mall
Location Description
P&M Mall Near Patliputra Industrial Area, Patliputra Kurji Road, sheikhpura, Patna – 800014
The objective of this mall is to supply a unique shopping experience, i.e. Family Entertainment Centers at single-point. This multi-utility shopping mall can meet the changing needs of new-millennium consumers.
UFO Mall Anisabad, Patna – 800004 This Mall is positioned at the main location of Patna. The Mall is a type of business complex with all modern and hi-tech amenities, as well as regular security check.
79
The article concludes with precise solutions for the shopping orientation towards and power of shopping and fascination of shopping malls.
Theoretical Framework
According to Business Dictionary.com, the definition of shopping is “The process of browsing and/or purchasing items in exchange for money”. Shopping is an activity that is essential for our lives. Almost all people spend some part of their life in shopping for food or other essentials. We have many different formats of shops. We can go to:
· A shopping Mall· A big departmental store· A smaller local shops· An outdoor market etc.
Shopping Mall: A shopping mall, shopping center/centre, shopping arcade, shopping precinct, or simply mall is one or more buildings forming a complex of shops representing merchandisers, with interconnecting walkways enabling visitors to walk from unit to unit, along with a parking area – a modern, indoor version of the traditional marketplaces. (qtd.in Wikipedia, the free encyclopedia). It has a variety of sections where we can buy a mixture of goods – clothes for men, women and children, footwear, electronics, books and stationary, furniture, perfume, cosmetics and of course food. Generally it is preferred once a week.
D e p a r t m e n t a l S t o r e : L a r g e r e t a i l establishments with an extensive assortment in variety and range of goods, organized into separate departments. All departments are housed under the same roof tofacilitate buying, customer service, merchandising, and control (qtd.in Business
Dictionary.com). According to Thomas, "a departmental store is a large retail establishment having in the same building a number of departments each of which confines its activities to one particular kind of trade and forms a complete unit in itself."
A smaller local shops: This type of shops are generally well-liked by older people in the villages or places where there aren't any shopping malls. They often have a familiar behavior with their customer, know each other in that shop, and talk about daily problems. Generally owners of such shops often live on top floor of the same building. It's their life.
An outdoor market: Outdoor markets are deliberately set into the places over lots of people habitually walk in e.g. from their jobs. It is a place of huge combination of goods: fruit, vegetable, also clothes.
Consumer Buying BehaviorThe process by which individuals search for, select, purchase, use, and dispose of goods and services, in satisfaction of their needs and wants. (qtd.in businessdictionary.com). It is the behavior of customer that inclines them towards specific buying habit to fulfill their actual and desired needs.
Factors Influencing Consumer Behavior Culture: Culture, Sub-Culture, Social ClassSocial: Reference Groups, Family, Roles and Status, friends.Personal: Age and Life-Cycle Stage, Occupation, Economic Situation, Lifestyle, Personality and Self – ConceptPsychological: Motivation, Perception, Learning, Beliefs and Attitudes.
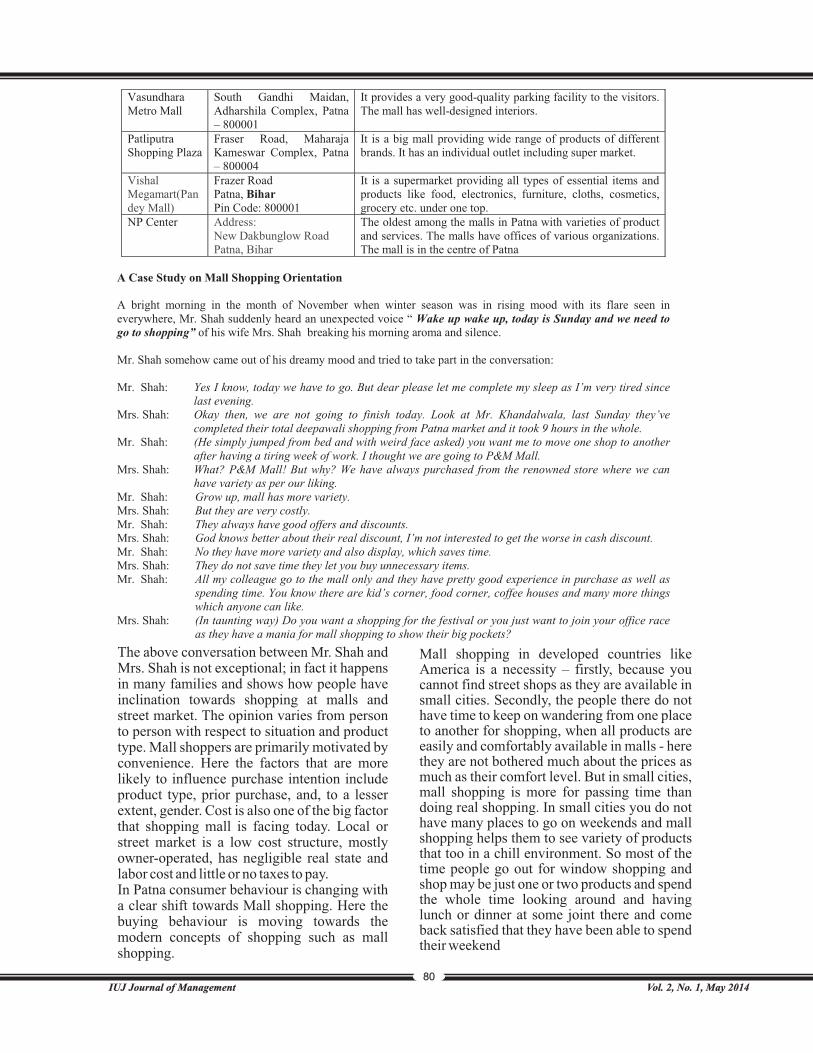
Vol. 2, No. 1, May 2014IUJ Journal of Management
A Case Study on Mall Shopping Orientation A bright morning in the month of November when winter season was in rising mood with its flare seen in everywhere, Mr. Shah suddenly heard an unexpected voice “ Wake up wake up, today is Sunday and we need to go to shopping” of his wife Mrs. Shah breaking his morning aroma and silence. Mr. Shah somehow came out of his dreamy mood and tried to take part in the conversation: Mr. Shah: Yes I know, today we have to go. But dear please let me complete my sleep as I’m very tired since
last evening. Mrs. Shah: Okay then, we are not going to finish today. Look at Mr. Khandalwala, last Sunday they’ve
completed their total deepawali shopping from Patna market and it took 9 hours in the whole. Mr. Shah: (He simply jumped from bed and with weird face asked) you want me to move one shop to another
after having a tiring week of work. I thought we are going to P&M Mall. Mrs. Shah: What? P&M Mall! But why? We have always purchased from the renowned store where we can
have variety as per our liking. Mr. Shah: Grow up, mall has more variety. Mrs. Shah: But they are very costly. Mr. Shah: They always have good offers and discounts. Mrs. Shah: God knows better about their real discount, I’m not interested to get the worse in cash discount. Mr. Shah: No they have more variety and also display, which saves time. Mrs. Shah: They do not save time they let you buy unnecessary items. Mr. Shah: All my colleague go to the mall only and they have pretty good experience in purchase as well as
spending time. You know there are kid’s corner, food corner, coffee houses and many more things which anyone can like.
Mrs. Shah: (In taunting way) Do you want a shopping for the festival or you just want to join your office race as they have a mania for mall shopping to show their big pockets?
Vasundhara Metro Mall
South Gandhi Maidan, Adharshila Complex, Patna – 800001
It provides a very good-quality parking facility to the visitors. The mall has well-designed interiors.
Patliputra Shopping Plaza
Fraser Road, Maharaja Kameswar Complex, Patna – 800004
It is a big mall providing wide range of products of different brands. It has an individual outlet including super market.
Vishal Megamart(Pandey Mall)
Frazer Road Patna, Bihar Pin Code: 800001
It is a supermarket providing all types of essential items and products like food, electronics, furniture, cloths, cosmetics, grocery etc. under one top.
NP Center Address: New Dakbunglow Road Patna, Bihar
The oldest among the malls in Patna with varieties of product and services. The malls have offices of various organizations. The mall is in the centre of Patna
80
The above conversation between Mr. Shah and Mrs. Shah is not exceptional; in fact it happens in many families and shows how people have inclination towards shopping at malls and street market. The opinion varies from person to person with respect to situation and product type. Mall shoppers are primarily motivated by convenience. Here the factors that are more likely to influence purchase intention include product type, prior purchase, and, to a lesser extent, gender. Cost is also one of the big factor that shopping mall is facing today. Local or street market is a low cost structure, mostly owner-operated, has negligible real state and labor cost and little or no taxes to pay.In Patna consumer behaviour is changing with a clear shift towards Mall shopping. Here the buying behaviour is moving towards the modern concepts of shopping such as mall shopping.
Mall shopping in developed countries like America is a necessity – firstly, because you cannot find street shops as they are available in small cities. Secondly, the people there do not have time to keep on wandering from one place to another for shopping, when all products are easily and comfortably available in malls - here they are not bothered much about the prices as much as their comfort level. But in small cities, mall shopping is more for passing time than doing real shopping. In small cities you do not have many places to go on weekends and mall shopping helps them to see variety of products that too in a chill environment. So most of the time people go out for window shopping and shop may be just one or two products and spend the whole time looking around and having lunch or dinner at some joint there and come back satisfied that they have been able to spend their weekend

Vol. 2, No. 1, May 2014IUJ Journal of Management
Reasons of customer visit Reasons for choosing mall against
local market Reasons for not choosing Malls
against local market 1 Food & Beverages 30% 1 Nearness to house/
locality 0% 1 High Cost of product 10%
2 Fun & Entertainment 30% 2 Friendly shopkeeper/ good relation
10% 2 Poor Communication with sales people
20%
3 Latest fashion and clothing
10% 3 Good range available 40% 3 Lack of personalized service
60%
4 Consumer durables 30% 4 Good ambience 30% 4 Lack of credibility 10% 5 Special offers and
discount 20%
81
in comfort. If we look at the other perspective also, in small cities, sometimes people do not want to have a cumbersome task of buying things from small shops as they are not satisfied by the quality of the product, but in malls since the products are made very attractive by wonderful clean packing, people are tempted to go and buy products there.
Retailers' Perspective on Mall Shopping· “Consumer behavior towards mall
shopping is extremely different than expected” says Mr. Ajit Kumar (Store Manager) Blackberry P N Mall.
· “Higher customer traffic to the malls is just because of restaurant and entertainment” says Mrs. Sherin Siddiqui (Floor Manager) Wills Life Style P & N Mall.
· “Our perceived profit has been far away than real profit” says Mr. Harsh raj (Floor Manager) UCB P&M Mall.
· “Patna's customers are at very nascent stage as far as modern retail is concerned. So they are very eager to do shopping in malls.” Says Mr. Abhishek Kumar Mishra (Department Manager) Big Bazaar.
"The mall management should arrange some special program all the time so that there will be more crowd to increase the sale.” Says Mr. Manish Kumar, VIP LOUNGE, P&M Mall.
On the basis of above opinions from different retailers it is clearly understood that retailers have to work out very hard to gather crowd for real shopping in order to obtain substantial portion of Patna retail trade.
Consumers' Perspective on Mall Shopping Consumer familiarity is the big advantage of traditional market. The niche of the traditional shopping is well present in the market of Patna where friendly rather homely treatment to customer makes them realize that the seller knows and understands better about their liking and choice, that too, in consumer affordable price. In case of Mall shopping the attraction comes with the display and the ambience of the mall. The customer is independent to choose as per their choice which make them feel delighted.
Findings and Results
As per Retailers:
· 100% retailers agreed about positive change in the buying behavior of consumer in recent time towards mall shopping.
· Retailers believe that still shopping malls have not been able to occupy substantial portion of the retail trade.

Vol. 2, No. 1, May 2014IUJ Journal of Management
•
Shopping Orientation Analysis
82
•Basic attraction of mall shopping is due to consumer durables, food and entertainment with equal acceptance by retails i.e. 30% with total of 90%.
· Retailers believed that the attraction towards mall shopping is due to good range, good ambience and the discount options. It is opinion of almost 100% of the Retailers.
· Local market is acceptable to consumer because of the personalized service available in those markets. 60% of the retailers are of this belief.
· Retailers have strong belief that Patna trend towards mall shopping will be giving strong threats to local market in coming time.
As per consumers:-· Inclination towards shopping at Malls is
very high stating 95% of crowd likes mall shopping...
· Mall shopping is majorly populated by the age group of 20-35 yrs and 35-50yrs,
includes 75% of the crowd.· Service holders , Homemaker, and
Professionals are the frequent visitor to Mall comprising 85% of total populations visiting mall. In respect to source of family income, it was observed that Dual Income and Multiple Income generating families have more craze towards mall shopping which includes 65 % of the crowd. Bachelor crowd holds good number with having 25 %. It is found that 70% of the mall shoppers belong to the category of more than 50k income per month and 25% of the crowd comes under to 25k-50k income per month.·Individual Sections in all categories and convenience with good shopping experience with time factor
importance are the major reason which attracts shoppers towards mall. These three factors comprise 65% of the populations.
· In response towards favorable shopping time, 60% consumers ' preference is on holidays/Sunday Usually the visiting frequency of the .
Favourable time Preference factor in mall Purpose of visit Frequency of mall visit
1 On sunday/
holiday 60% 1 Time factor
25% 1 Fun &
entertainment 30% 1
Everyday 0%
2 While going to
work place 0% 2 Discount scheme 15% 2 Family outgoing 20% 2
Once in a week 25%
3
While coming from work
place 5% 3 Adequate parking
space 10% 3 Shopping 20% 3
Twice a
month 65%
4 In lunch break 0% 4 Individual sections for all categories 20% 4 Eating
30% 4 Other 5%
5 Other 5% 5
Good shopping experience with convenience and
variety 20%
6 Organised shop with international
ambience and a.c. All around 10%

Vol. 2, No. 1, May 2014IUJ Journal of Management
Money Spend Per Visit Sections (Spend More
Money) Company In Mall Visit Time Duration
1 Below Rs.200 10% 1 Apparels 15% 1 Family 50% 1 Less than 1 hr 15%
2 Rs. 200 – Rs. 500
30% 2 Food & Beverages 35% 2 Spouse 5% 2 1hr – 2 hrs 35%
3 Rs. 500 – Rs. 2000
40% 3 Movies & Entertainment
10% 3 Friend 30% 3 2hrs – 3hrs 40%
4 Rs. 2000 & above
20% 4 Consumer Durables
40% 4 Alone 15% 4 More than 3 hrs
10%
5 Gifts & Electronics
0%
83
crowd is twice a month which is 65% of the crowd.
· Mall has a basic attraction of fun zone and food outlets i.e. 60% and other aspects are not on priority including shopping
· Expenditure in the mall comes under the range of Rs.500-Rs.2000 which is the average amount of expenditure made per visit; around 40% of crowd comes under this category.
· Consumer's durable and food & beverages have major attraction in mall shopping comprising 75% of crowd in the Mall.
· Patna people prefer to visit mall with family and then with friends
· Generally the time spent by the consumer at mall is more than 1 hr, as per data 75 % of the crowd spend 1-2 hrs or 2 -3hrs in mall.
Conclusion
The study reveals that the consumers in the shopping mall are not serious buyers; generally they come twice a month for fun & entertainment, food & beverages and usually shop for the consumer durables. Mostly youth and middle age people, having either dual or multi-income source with the monthly income of more than 25K are the main shoppers in the shopping malls
of Patna and spend about Rs. 500to Rs. 2000 per visit.
The organized shopping is getting acceptance in the market and people are moving towards mall shopping with their own liking and with the liking of peer groups as well due to the ambience, discount offers and the wide varieties of products available in individual sections.
Mall shopping is the future in the small cities as the attraction towards mall is increasing day by day and it is believed that with more of personalized touch and offers the mall shopping can be easily positioned in the mind of consumers.
It can be analyzed from the retailers and consumers responses towards mall shopping that the attraction towards mall shopping is at naïve stage. The mania towards shopping is the outcome of recent development and upcoming of new malls in Patna. Therefore, to affect the both the consumers as well retailers, it will definitely take some more time. In order to tap the situation and popularize the concept of mall shopping, it is recommended that the retailers are;
· To come up with activities and offers at Malls.
· To provide personalized services to

customers.· To have products in affordable range for
Patna Market.· To provide feel good factor or at home
feeling to the customer to ease customers' shopping.
· To hire store manager who are able to do the perceptual mapping with the customer to close the sale.
· To get better communication with the consumers in order to do clear perceptual mapping with consumers.
At the end, it can be concluded that the main magnetism of mall shopping is not the need for shopping but it is the craze of going shopping malls to feel delighted.
References
· Cooper,D., Schindler, S., and Sharma, J.K. (2012) Business Research
thMethods,11 edition,New Delhi: McGraw Hill Education (India) Private Limited.
· Dave, S. and Sondhi, S. (2011) An empirical analysis of the determinants of customer conversion: A cross sectional study of organized retailers in Chattisgarh. Journal of Retail & Leisure Property [Online]. Available from: http://
. [Accessed: 14th September 2013].
· Dwivedi, P.R. (2010) Saturation of malls in metros: prospects in tier II and III cities. Available from:
[Accessed: 12th September 2013].
· IBEF.(SEPTEMBER 2013) Retail Industry in India. Industry [Online]. Available from:
www.palgrave-journals.com
http://www.indiaretailing.com
. [Accessed: 25th September
2013]. · Khare, A. (2010) Mall shopping
behaviour of Indian small town consumers. Journal of Retailing and Consumer Services [Online]. Available from: http:// [Accessed: 13th September 2013].
· KPMG. (2009) Indian retail: time to change lanes. Available from:
. [Accessed: 10th September 2013].
· Loudon, L., & Bitta, J. (2002) Consumer behavior, fourth edition, New Delhi: Tata McGraw-Hill Publishing Company Limited.
· MLA,.(2009) MLA Handbook for writers of research papers, seventh edition, New Delhi:Affiliated east- west press pvt ltd.
· Rajagopal. (2009) Growing shopping malls and behaviour of urban shoppers. Journal of Retail & Leisure Property [Online]. Available from: http://
. [Accessed: 10th September 2013].
· Schiffman, G., and Kanuk, L.(2004) Consumer Behaviour, eighth edition, Delhi: Pearson Education.
· Sinha, R.(2010) Small towns lead the league for marketers. Available from: http:// . [Accessed: 11th September 2013].
· Taneja, K.(2007) Mall Mania in India – Changing Consumer Shopping Habits. [Online]. Available from:
. [Accessed: 16th September 2013].
http://www.ibef.org/industry/retail-india.aspx
www.sciencedirect.com
http://www.in.kpmg.com
www.palgrave-journals.com
www.merinews.com/article
http://edissertations.nottingham.ac.uk/1007/1/Kanika_Dissertation.pdf
Vol. 2, No. 1, May 2014IUJ Journal of Management84

Vol. 2, No. 1, May 2014
Diagnostic Study of Handloom Cluster in Jharkhand
Priya Srivastava1
Handloom is a labour intensive cottage industry sector, which provides employment to weavers with minimum investment. This sector provides employment opportunities to vast sections of the society, which mainly comprises of the weaker sections, the minorities and the women. It represents the continuity of the age-old Indian heritage of hand weaving. This sector is highly decentralized and dispersed and handloom weavers can be found in over 400 clusters across the country. Although it employs large number of people, the handloom sector is considered a sunset industry and there is an air of inevitability given the relentless march of mechanization, modernization and sophistication. Still, there are many advocates of handloom for reasons like, ideology, philosophy, sheer love for handloom products and economic reasons. However, irrespective of the policies, projects and aspirations arising out of various quarters, the handloom sector is undergoing changes that are adversely impacting the livelihoods of handloom weavers. The broad objective of this study is to make an in-depth assessment of the various problems faced by the handloom clusters in Jharkhand and suggest relevant measures to overcome the same. Key Words: socio-economic, cluster, handlooms
1 Sr. Faculty Member, ICFAI University Jharkhand, Ranchi, E-mail ID: [email protected]
85
Introduction:Handloom sector faces extensive cost disadvantages as compared to mills and power looms due to its manual nature of production. Today power looms dominate textile production in India and have encroached upon the traditional market of the handloom sector. If many handloom weavers do not have enough raw materials, it is probably because the raw materials are being diverted to the power looms. Steep rise in cotton yarn prices without a corresponding increase in handloom products prices has meant that production in several places had to be suspended, destroying the livelihoods of handloom weavers and the laying off handloom wage workers. Handlooms have an umbilical linkage with cotton farmers and the rural farm economy. Agricultural labour gets employment in handloom sector during the non-agricultural season. The sector has self-sustaining mechanism, including training for young weavers, irrespective of gender differences. The inheritance of skills, resources and capacities has remained beyond the realm and reach of any modern training and educational institution. The sustaining of the weaving skill itself has not been
dependent on the Government or any modern formal institution. There is also inherent flexibility for all types of communities to take up handloom production as a profession.
By some estimates, there are 32 other sectors that are benefiting from the handloom sector, including, transportation, financial services, marketing services, service & maintenance services and hotels. Many handloom centers are well known tourist spots, drawing visitors from far places of India and also the foreign countries. Thus, the tourism industry's fortunes are also, in part, influenced by the handloom sector and its fame. In fact, the handloom sector has an edge over the power loom and mill sector in its ability to commercially produce the goods in small volumes, openness to innovation, quick to switch over to new designs, adoptability to suppliers requirements and creation of exquisite designs. It has also the comparative advantage in terms of availability of skill base across the country, abundance of local raw materials and labour intensity. Yet this sector has not been able to fully harness its potential.

The Government has in the recent past, introduced a number of schemes aimed both at the welfare of the weavers involved in this sector, as well as, for strengthening the various associated components, such as, quality & prices of raw materials, development of marketing channels , infrastructural investments , improvement & patenting of designs, etc. Some of the major schemes introduced by the Government for strengthening the handloom sector in the country are enumerated below —
(i) Development Schemes1. Deen Dayal Hathkargha Protsahan
Yojana (DDHYP)2. Integrated Handloom Training
Project (IHTP)
(ii) Marketing Schemes1. Handloom Export Scheme (HES)2. Marketing Promotion Program
(MPP)
(iii) Input Related Schemes1.Mill Gate Price Scheme
(iv) Welfare Schemes1. Work shed-cum-Housing Scheme
(WCH)2. Weavers' Welfare Scheme, including
– (a) Thrift Fund Scheme (TFS); (b) New Insurance Scheme for Handloom Weavers.
(v) Scheme for Central Assistance to State Governments
1. Setting up of Enforcement Machinery.
(vi) Other Schemes1. Integrated Handloom Cluster
Development Program2. Mahatama Gandhi Bunkar Bima
Yojana (MGBBY).3. Health Insurance Scheme (HIS)4. Handloom Mark Scheme
2. Integrated Handloom Cluster Development Program:
In the face of growing competitiveness in the textile industry both in the national and
international markets and the free trade opportunities emerging in the post MFA environment, a growing need has been felt for adopting a focused yet flexible and holistic approach in the sector to facilitate handloom weavers to meet the challenges of the globalized environment. Need has also been felt to empower weavers to chart out a sustainable path for growth and diversification in line with the emerging market trends.
The Integrated Handloom Cluster Development Program is an attempt to facilitate the sustainable development of handloom weavers located in identified clusters into a cohesive, self managing and competitive socio-economic unit. The Office of the Development Commissioner (Handlooms) is the nodal agency for the implementation of the Integrated Handloom Cluster Development Program.
The main objectives of this scheme are as follows
1. To empower handloom weavers and build their capacities to meet the challenges of the market and global competition in a sustainable and self reliant manner;
2. To facilitate collectivization of handloom weavers and service providers for procurement, production, marketing and other support activities to promote sustainable growth and diversification;
3. To provide for common infrastructure and activities in a viable format in the cluster;
4. To provide for development of handloom clusters in an inclusive and holistic manner in an environment of empowered and participative decision making; and
5. To encourage convergence of schematic assistance and support services from various schemes and programs of various Government and other agencies in the cluster to optimize resource utilization for betterment of the livelihood and quality of life of handloom weavers.
As part of the scheme, it is proposed to take up an initial batch of twenty handloom clusters. These clusters would be such where there is a large concentration of handlooms, producing fabrics of niche varieties on handlooms which are in demand in the market.
Vol. 2, No. 1, May 2014IUJ Journal of Management86

In its efforts to strengthen and improve the efficacy of the delivery mechanism of the scheme, it is now proposed to initiate a grassroot level study by the Office of the Development Commissioner (Handlooms), wherein the emphasis would be on understanding the problems afflicting these clusters. In doing so, we had taken initiative to undertake a Diagnostic Study in the Handloom Cluster of Irba-Chuti in district Ranchi of Jharkhand.
3. Scope, Objectives and Methodology
Scope:
The study is confined to the handloom clusters in Jharkhand. There are a total of 162 registered Primary Weaver's Cooperative Societies in Jharkhand, with majority of them being located in 5 districts, namely, Ranchi (55), Godda (29), Dumka (17), Hazaribagh (17) and Palamu (16).
Amongst these 162 Primary Weaver's Cooperative Societies in Jharkhand, only 50-55 Primary Societies are currently functional. The remaining have ceased to function due to one reason or another.
There are a total 11,167 handlooms in Jharkhand in which variety of handloom products are prepared. Some of the prominent places where presently handloom products are prepared, with their areas of specialization is presented in Table 3.1
Objectives:
The specific objectives of the study are as enumerated below —
1. To study and delineate the current socio-economic status of the handloom cluster;
2. To understand the entire production process in the selected cluster;
3. To estimate the numbers of handlooms in the cluster;4. To s t u d y t h e a v a i l a b l e infrastructure in the cluster. This would include — raw material procurement, availability of dyeing facilities, product mix, kind of marketing linkages available, etc;
5. To study the benefits that might have accrued to the cluster due to various schemes related to the handloom sector;
6. To assess the problems that may be adversely affecting the handloom cluster; and
7. To assess the financial assistance that would be needed for the overall development of the cluster.
Methodology:(A)Approach
In order to conduct this diagnostic study, it was
imperative to get feedbacks from the various
stakeholders involved with the Project at different
levels. For the qualitative assessment of the issue,
we collected data through in-depth interviews and
focused group discussions using a semi-
structured questionnaire.
To reach at a qualitative result detailed discussions with various people were conducted who were closely linked with this sector. We also visited the office of the Primary Weavers Cooperative Society, Irba-Chuti, in Chuti village and conducted in-depth interview of Chairman, of this Society. We also conducted a focused group discussion of the weavers associated with the Primary Weaver's Cooperative Society, to assess their condition, views, constraints and aspirations.
(B)Research Instruments Used
It was a descriptive type research study. A semi-structured questionnaire was prepared for conducting the indepth interviews of various functionaries.
Vol. 2, No. 1, May 2014IUJ Journal of Management87
District Yarn Final Products Produced
Ranchi
Cotton Traditional Indian dress materials like, lungi, dhoti, gamchha, towel
Jamtara Cotton Traditional Indian dress materials like, lungi, dhoti, gamchha, towel
Seraikela Silk Shirtings, dress Materials Pakur Silk Sari
Table 3.1
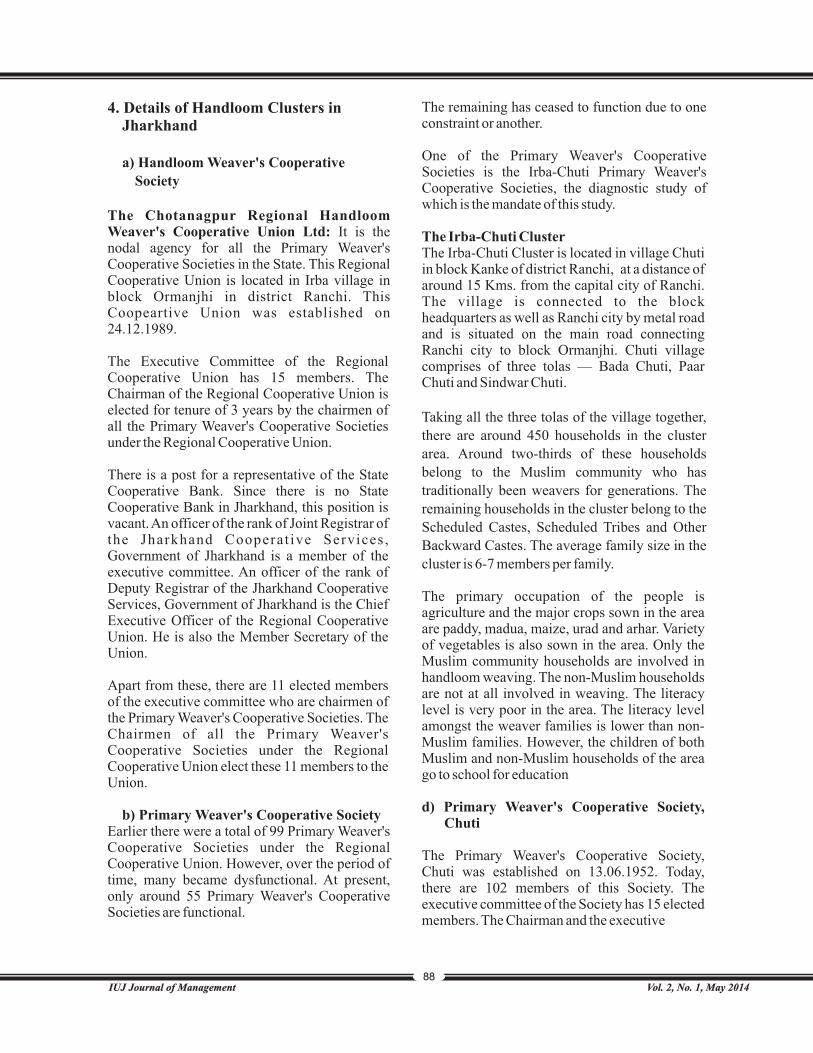
4. Details of Handloom Clusters in Jharkhand
a) Handloom Weaver's Cooperative
Society
The Chotanagpur Regional Handloom Weaver's Cooperative Union Ltd: It is the nodal agency for all the Primary Weaver's Cooperative Societies in the State. This Regional Cooperative Union is located in Irba village in block Ormanjhi in district Ranchi. This Coopeartive Union was established on 24.12.1989.
The Executive Committee of the Regional Cooperative Union has 15 members. The Chairman of the Regional Cooperative Union is elected for tenure of 3 years by the chairmen of all the Primary Weaver's Cooperative Societies under the Regional Cooperative Union.
There is a post for a representative of the State Cooperative Bank. Since there is no State Cooperative Bank in Jharkhand, this position is vacant. An officer of the rank of Joint Registrar of the Jharkhand Cooperat ive Services , Government of Jharkhand is a member of the executive committee. An officer of the rank of Deputy Registrar of the Jharkhand Cooperative Services, Government of Jharkhand is the Chief Executive Officer of the Regional Cooperative Union. He is also the Member Secretary of the Union.
Apart from these, there are 11 elected members of the executive committee who are chairmen of the Primary Weaver's Cooperative Societies. The Chairmen of all the Primary Weaver's Cooperative Societies under the Regional Cooperative Union elect these 11 members to the Union.
b) Primary Weaver's Cooperative SocietyEarlier there were a total of 99 Primary Weaver's Cooperative Societies under the Regional Cooperative Union. However, over the period of time, many became dysfunctional. At present, only around 55 Primary Weaver's Cooperative Societies are functional.
The remaining has ceased to function due to one constraint or another.
One of the Primary Weaver's Cooperative Societies is the Irba-Chuti Primary Weaver's Cooperative Societies, the diagnostic study of which is the mandate of this study.
The Irba-Chuti ClusterThe Irba-Chuti Cluster is located in village Chuti in block Kanke of district Ranchi, at a distance of around 15 Kms. from the capital city of Ranchi. The village is connected to the block headquarters as well as Ranchi city by metal road and is situated on the main road connecting Ranchi city to block Ormanjhi. Chuti village comprises of three tolas — Bada Chuti, Paar Chuti and Sindwar Chuti.
Taking all the three tolas of the village together,
there are around 450 households in the cluster
area. Around two-thirds of these households
belong to the Muslim community who has
traditionally been weavers for generations. The
remaining households in the cluster belong to the
Scheduled Castes, Scheduled Tribes and Other
Backward Castes. The average family size in the
cluster is 6-7 members per family.
The primary occupation of the people is agriculture and the major crops sown in the area are paddy, madua, maize, urad and arhar. Variety of vegetables is also sown in the area. Only the Muslim community households are involved in handloom weaving. The non-Muslim households are not at all involved in weaving. The literacy level is very poor in the area. The literacy level amongst the weaver families is lower than non-Muslim families. However, the children of both Muslim and non-Muslim households of the area go to school for education
d) Primary Weaver's Cooperative Society, Chuti
The Primary Weaver's Cooperative Society, Chuti was established on 13.06.1952. Today, there are 102 members of this Society. The executive committee of the Society has 15 elected members. The Chairman and the executive
Vol. 2, No. 1, May 2014IUJ Journal of Management88

committee members are elected for a tenure of 3 years by the members of the Society. One of the executive committee members is designated as the Paid Member of the Society whose prime responsibility is to maintain the books of account and other records of the Society. Anybody from Chuti village can become a member of the Society by paying an entry fee of Rs. 5/- and a sum of Rs. 100/- which is the share holding price for lifetime to become a member of the Society.
At the time of formation of the Society, there was a loom in almost all the households of the village. In fact, it was reported by the Chairman of the Society that at that time, to become a member of the Society, it was imperative to have a loom in the household. Now, hardly 40 households have a loom in their house and even these households do not weave on their household looms.
Status of Basic Amenities in the Primary Society
The Primary Society, Chuti is housed in a semi-pucca building. The walls are made of bricks and cement, while the roof is of asbestos sheets. The floor is of mud. There is proper ventilation facility and sunlight for the weavers in the building. The hall where the looms, bobbin machine and other equipments are installed is of 25 feet x 60 feet size. There are two separate rooms each of 12 feet x 10 feet size for keeping the stock of finished goods and a small varandah where 2-3 Charkhas can be worked on.There is sufficient open space for preparing drums. There is a well in the compound of the building which also has a water pump. The pump is used to draw water from the well which is used for processing the yarn. Sufficient space is also available in the building campus for dyeing and drying of yarn.
The dyeing process is not taken up on a large scale in the Society. Traditional dyeing is practiced for dyeing the yarns. The building haselectricity connection and an adequate arrangement for light is there for weavers to work in the night time as well.
Looms & Machineries
In the Primary Weaver's Cooperative Society,
Chuti, there are a total of 13 looms, 1 bobbin machine, 5 Charkhas and 1 Krill machine. Earlier, all the 13 looms were used for weaving purposes but now due to reduced work in comparison to earlier times, only 5 looms are used in the Society. The remaining is lying unutilized. The total equipments and machineries that are available in the Primary Weaver's Cooperative Society, Chuti is presented below.
Employment Status
In the Primary Weaver's Cooperative Society, Chuti, there are a total of 102 members, all of whom belong to the village Chuti. There are no regular employees in the Society. All the members are eligible to work on the looms of the Society. Non- members are not permitted to work on the looms of the Society.
Availability of Trained Manpower
Weaving has been the traditional occupation of the residents of the Cluster for several generations. Although, gradually the families have dissociated themselves from this occupation, trained manpower is still available in the Cluster.
Salaries & Wages
As there are no regular employees of the Society, there is no salaried person attached with the Society. Wage rates have been fixed by the Society for weaving on per piece or on length of weaving basis. The weavers are job workers who receive the yarn and the design and hand over the woven products to the Society and receive wages.
The average number of working days for a weaver on the looms is only around 90-100 days in a year. There was a time when all the adult members of the Cluster were engaged in weaving activities. In fact each household had a loom in their house. But due to the dwindling market for the handloom products, high degree of uncertainty of job works and lack of adequate institutional support, large number of families whose erstwhile primary occupation was weaving have now turned towards agriculture or even as wage labours.
Vol. 2, No. 1, May 2014IUJ Journal of Management89
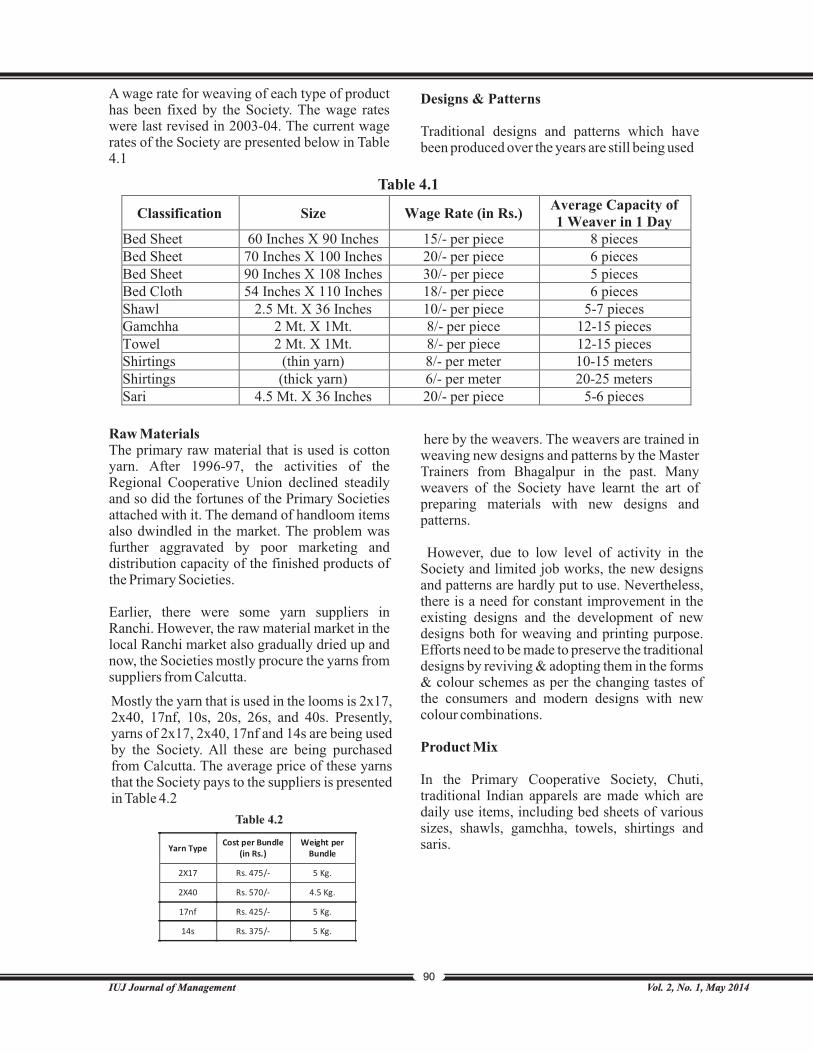
Vol. 2, No. 1, May 2014IUJ Journal of Management90
A wage rate for weaving of each type of product has been fixed by the Society. The wage rates were last revised in 2003-04. The current wage rates of the Society are presented below in Table 4.1
Raw MaterialsThe primary raw material that is used is cotton yarn. After 1996-97, the activities of the Regional Cooperative Union declined steadily and so did the fortunes of the Primary Societies attached with it. The demand of handloom items also dwindled in the market. The problem was further aggravated by poor marketing and distribution capacity of the finished products of the Primary Societies.
Earlier, there were some yarn suppliers in Ranchi. However, the raw material market in the local Ranchi market also gradually dried up and now, the Societies mostly procure the yarns from suppliers from Calcutta.
Classification Size Wage Rate (in Rs.) Average Capacity of 1 Weaver in 1 Day
Bed Sheet 60 Inches X 90 Inches 15/- per piece 8 pieces Bed Sheet 70 Inches X 100 Inches 20/- per piece 6 pieces Bed Sheet 90 Inches X 108 Inches 30/- per piece 5 pieces Bed Cloth 54 Inches X 110 Inches 18/- per piece 6 pieces Shawl 2.5 Mt. X 36 Inches 10/- per piece 5-7 pieces Gamchha 2 Mt. X 1Mt. 8/- per piece 12-15 pieces Towel 2 Mt. X 1Mt. 8/- per piece 12-15 pieces Shirtings (thin yarn) 8/- per meter 10-15 meters Shirtings (thick yarn) 6/- per meter 20-25 meters Sari 4.5 Mt. X 36 Inches 20/- per piece 5-6 pieces
Table 4.1
Yarn Type Cost per Bundle
(in Rs.) Weight per
Bundle
2X17 Rs. 475/- 5 Kg.
2X40 Rs. 570/- 4.5 Kg.
17nf Rs. 425/- 5 Kg.
14s Rs. 375/- 5 Kg.
Table 4.2
Mostly the yarn that is used in the looms is 2x17, 2x40, 17nf, 10s, 20s, 26s, and 40s. Presently, yarns of 2x17, 2x40, 17nf and 14s are being used by the Society. All these are being purchased from Calcutta. The average price of these yarns that the Society pays to the suppliers is presented in Table 4.2
Designs & Patterns
Traditional designs and patterns which have been produced over the years are still being used
here by the weavers. The weavers are trained in weaving new designs and patterns by the Master Trainers from Bhagalpur in the past. Many weavers of the Society have learnt the art of preparing materials with new designs and patterns.
However, due to low level of activity in the Society and limited job works, the new designs and patterns are hardly put to use. Nevertheless, there is a need for constant improvement in the existing designs and the development of new designs both for weaving and printing purpose. Efforts need to be made to preserve the traditional designs by reviving & adopting them in the forms & colour schemes as per the changing tastes of the consumers and modern designs with new colour combinations.
Product Mix
In the Primary Cooperative Society, Chuti, traditional Indian apparels are made which are daily use items, including bed sheets of various sizes, shawls, gamchha, towels, shirtings and saris.

Vol. 2, No. 1, May 2014IUJ Journal of Management91
Cost of Finished Products
The consolidated cost of the finished products made by the Society after incorporating all expenses (including cost of yarn, transportation, processing, weaving charges, etc.) is presented below in Table 4.3
Availability of Markets for Finished Products
Till 1996-97, in the Regional Cooperative Union, there were 7 mobile vans (mini-bus), which were used as shops on wheels by the Regional Cooperative Union at various locations. These vans were also used to transport the finished goods to their destinations. However, lately due to reduced activity of the Union, now only 3 mobile vans were being used. The remaining have been sold out by the Regional Cooperative Union.
Earlier there were a total of 33 retail outlets across the State, which reduced to 24 in 1997, from where the finished goods were marketed. Now, there is only 1 retails outlet (in Ranchi), for the products of the Regional Cooperative Union. Now, the finished goods of the Primary Cooperative Society are partly sold in the roadside shops/footpaths by the persons of Chuti village deputed by the Society. Occasionally, the finished products are also sold door to door from one locality to another in Ranchi with the help of bicycles.
Financial Resources
Earlier, since majority of the yarn was provided by the Regional Cooperative Union, there was not much problem of finance for the Primary
Cooperative Societies. The payments were also released by the Regional Union within 15-30 days of the delivery of the finished products by the Primary Societies to the Regional Union. However, with the lowering of the scale of activities of the Regional Union, the Primary Societies have to procure raw materials (yarns) for self production. The yarns that are purchased from Calcutta are procured on payment of 50 percent advance money to the supplier. Since there is no cooperative bank in Jharkhand, the sources of funding are also limited for the Primary Societies.
Turnover &Profits
The turnover of the Primary Cooperative Society, Chuti in the last four has increased from Rs. 18.19 Lakhs to 32.64 Lakhs. Year-Wise Turnover figures for the 4 years, is presented alongside.
The gross profit and the net profit earned by the Primary Cooperative Society, Chuti in the four years in presented in Table 4.4
Competition in the Sector
The handloom sector has been facing stiff competition from the power loom sector. To keep pace with the changing fashions/trends, it is necessary for the handloom sector to revive its technique/technology. Keeping this in view, the weavers need to be equipped with techniques like the computer aided textile designing, so that the handloom sector could compete with the power loom sector in the areas of weaving as well as designing.
Classification Size Cost of Production (in Rs.)
Bed Sheet 60 Inches X 90 Inches 75/- per piece Bed Sheet 70 Inches X 100 Inches 100/- per piece
Bed Sheet 90 Inches X 108 Inches 150/- per piece
Bed Cloth 54 Inches X 110 Inches 65/- per piece Shawl 2.5 Mt. X 36 Inches 60/- per piece Gamchha 2 Mt. X 1Mt. 30/- per piece Towel 2 Mt. X 1Mt. 30/- per piece Shirtings (thin yarn) 24/- per meter Shirtings (thick yarn) 20/- per meter Sari 4.5 Mt. X 36 Inches 70/- per piece
Table 4.3
Table 4.4
Financial Year Turnover
2002-03 Rs. 1819227/-
2003-04 Rs. 2261853/-
2004-05 Rs. 2108209/-
2005-06 Rs. 3264274/-

Vol. 2, No. 1, May 2014IUJ Journal of Management92
It is also essential to popularize the designs developed for the handloom sector through periodical display-cum-exhibition of the designs and samples being produced by this sector. Also, to be able to compete with their rivals, the skills of the weavers need to be upgraded to enable them to switch over from low value added to high value added products.
Support Mechanism
The Jharkhand Government in the State Industrial Policy has pledged to undertake measures to facilitate assistance to the handloom sector in the State. Marketing of products has been recognized as the weakest link for this sector particularly those in the rural areas. The policy of the State Government is to ensure that State Government departments and various agencies under its control would purchase their requirement of store items from this sector. In order to achieve this, the product of industries located within the State will be eligible for the facilities of preferential purchase by State Government departments and the agencies under its control.
Various departments of the State Government and the various agencies under its control would ensure, without compromising the quality, that minimum 75 percent of the total order placed with respect to any such tendered item be supplied exclusively by the manufacturing industrial units located within the State. It would
also be ensured that 33 percent of the total annual purchase by any department/agency should be exclusively supplied by the manufacturing small scale industrial units located within the State.In order to provide the price preference facilities, with respect to certain identified item(s) being manufactured by the small scale industries located within the State, with the objective of providing competitiveness to such items (s), a high level committee would be constituted by the State Government, which shall duly assess the competitiveness of such items as referred and make recommendat ions . The Centra l Government, its various agencies and private/joint sector industries located within the State will be persuaded to accord similar facilities to the products of local industries. New industrial units coming up in the State will be persuaded to pa t ron i ze l oca l i ndus t r i e s / f i rms fo r construction/supply of materials.
Local small scale industrial units registered with DIC/IADA shall have to deposit only 50 percent of the earnest money while submitting tenders with the State Government departments and various agencies under its control. The problem of delayed payment to small scale industrial units by the Government department s/corporations /boards or large industrial undertakings creates severe financial constraints to these units. To tackle this problem, the State Government would constitute an "Industrial Facilitation Council" at Ranchi as per the provisions of the "Interest on Delayed Payments to Small Scale and Ancillary
Net Profit Earned
Rs. 5,444
0
10 0 0
2 0 0 0
3 0 0 0
4 0 0 0
5 0 0 0
6 0 0 0
2 0 0 2 - 0 3 2 0 0 3 - 0 4 2 0 0 4 - 0 5 2 0 0 5 - 0 6
Gro
ss P
rofi
t (i
n R
s.)
0
5 0 0 0
1 0 0 0 0
1 5 0 0 0
2 0 0 0 0
2 5 0 0 0
3 0 0 0 0
3 5 0 0 0
2 0 0 2 - 0 3 2 0 0 3 - 0 4 2 0 0 4 - 0 5 2 0 0 5 - 0 6
Rs. 4,020
Rs. 4,040 Rs. 2,486
anc ear
Gro
ss P
rofi
t (i
n R
s.)
Financial Year
Rs. 32,401 Rs. 26,909
Rs. 22,992
Gross Profit Earned
Rs. 19,976
Graph 4.1

Vol. 2, No. 1, May 2014IUJ Journal of Management93
Industrial Undertaking Act, 1993".The State Government would additionally take the following initiatives:
1. Develop a strong data base to provide trade and export related information.
2. Purchase of ISO/ISI certified products would be given preference.
3. The Government will assist NGOs and other such agencies, which facilitate marketing of products in rural areas.
4. Organize buyer sellers meet involving public sector/private sector enterprises.
5. Organize trade fairs/melas for marketing assistance inside and outside the country.
6. Encourage e-commerce in the rural areas.The raw material generating units shall be persuaded to give purchase preference to the local industries for supply of such raw material, whose production is dependent upon the supply of such raw materials. Similarly, the public sector/private sector large industries, located within the State would be persuaded to give purchase preference to the products of the local industries while making purchases of raw materials and other items required by it.
Value Chain Analysis
As per the value chain analysis of the Primary Weaver's Cooperative Society, Chuti, the weavers are heavily dependent on the Regional Cooperative Union at all stages of production. The Regional Cooperative Union has been the major supplier of raw material, buyer of most of the finished products, marketing agent for the Primary Society and the biggest and the most reliable payer of the sale proceeds.Although, there is an alternative source for procuring the raw materials (open market), but due to isolation of the handloom sector from the mainstream activities of entrepreneurship (regular and bulk demand of raw materials, outdated designs and patterns, change in the priorities of the consumers, poor marketing strategies, lack of display outlets), the local traders of Ranchi have also restricted their activities in the sector. This resulted in extremely reduced supply of yarns locally. The weavers do not get choice of quality and variety in the yarn they buy and their bargaining capacity is also limited. The nearest destination is the suppliers of Calcutta, who is
located around 500 Km. away from the loom site. It is not feasible for the located around 500 Km. away from the loom site. It is not feasible for the weavers to frequently visit Calcutta for procuring yarn of their choice because of obvious reasons their business do not support frequent travelling expenses. Moreover, due to being in the unorganized sector, their buying capacity in term of quantity is also limited. Consequently, all they do is book their orders with the suppliers in Calcutta on telephone, who dispatches the yarns through road transport agencies to Ranchi. The transportation cost adds on to the production cost of the finished products.
Once the yarn reaches the Primary Weaver's Cooperative Society, all the processing is done inhouse (caring, dyeing, starching and weaving). If the work order is given by the Regional Cooperative Union, the yarn is purchased by the Regional Cooperative Union and the Primary Weaver's Cooperative Society collects the yarn from the Union's stores which is located around 2 Km. from the loom site. If the production is done for the Regional Cooperative Union, the finished products are prepared as per the specifications given by them (shape, size, pattern). The Regional Cooperative Union pays the Primary Weaver's Cooperative Society on the basis of number of pieces of finished products prepared. The rate for each type of product is fixed as mentioned above. Over and above this payment, the Regional Union also pays the Primary Weaver's Cooperative Society an additional 5 percent of the total payable amount for compensating the operating loss incurred while processing the yarn to prepare the finished products.
If the Primary Weaver's Cooperative Society buys the yarn from the open market to produce traditional household items, the finished products are sold door to door from one locality to another in Ranchi with the help of bicycle or through makeshift roadside shops.
5. Diagnosis of the Situation
There are a total of 162 registered Primary Weaver's Cooperative Societies in Jharkhand. Amongst these, only 55 Primary Societies are currently functional. The remaining has ceased to

Vol. 2, No. 1, May 2014IUJ Journal of Management94
function due to one constraint or another. At the time of the formation of the Primary Weaver's Cooperative Society in Chuti, there was a loom in almost all the households of the village. In fact, to become a member of the Society, it was imperative to have a loom in the household.
Weaving has been the traditional occupation of the residents of the Cluster for several generations. Although, gradually the families have dissociated themselves from this occupation, trained manpower is still available in the Cluster. There was no paucity of trained manpower that could work on the looms or undertake other activities related to weaving. Nevertheless, today hardly any household is solely dependent on weaving.
The average working days for a weaver on the looms are only around 90-100 days in a year. There was a time when all the adult members of the Cluster were engaged in weaving activities. In fact each household had a loom in their house. But due to the dwindling market for the handloom products, high degree of uncertainty and lack of adequate support, large number of erstwhile families whose primary occupation was weaving are now turning towards agriculture or even wage labours.
The primary raw material that is used is cotton yarn. Till around 1996-97, the Society received almost all their requirement of yarn from the Regional Cooperative Union. In any case, the Primary Society, Chuti, was then working mostly for the Regional Cooperative Union, which procured the orders, purchased the yarns as per the specifications and provided it to the Primary Societies.
After 1996-97, the activities of the Regional Cooperative Union declined rapidly. The demand of handloom items also dwindled in the market. The problem was further aggravated by poor marketing and distribution facilities of the finished products of the Primary Societies. Earlier, there were some yarn suppliers in Ranchi. However, the raw material market in the local Ranchi market also gradually dried up and now, the Societies procure the yarns from suppliers from Calcutta.
Traditional designs and patterns which have been produced over the years are still being used here by the weavers. There is a need for constant improvement in the existing designs and the development of new designs both for weaving and printing purpose. Efforts need to be made to preserve the traditional designs by reviving and adopting them in the forms and colour schemes as required by the market of the day. Keeping the changing tastes of the consumers, modern designs with new colour combinations of the designs are the need of the time.
It is also essential to popularize the designs developed for the handloom sector through periodical display-cum-exhibition of the designs and samples being produced by this sector. Also, to be able to compete with their rivals, the skills of the weavers need to be upgraded to enable them to switch over from low value added to high value dded products. The handloom weavers do not have enough raw materials and the steep rise in cotton yarn prices without a corresponding increase in handloom product prices has resulted in reduced production. It has resulted in the disappearance of their traditional livelihood due to laying off handloom wage workers.Till 1996-97, in the Regional Cooperative Union, there were 7 mobile vans (mini-bus), which were used as shops on wheels by the Regional Cooperative Union at various locations. However, lately due to reduced activity of the Union, now only 3 mobile vans were being used. The remaining have been sold out by the Regional Cooperative Union.
Earlier there were a total of 33 retail outlets across the State, which reduced to 24 in 1997, from where the finished goods were marketed. Now, there is only 1 retails outlet (in Ranchi), for the products of the Regional Cooperative Union. Now, the finished goods of the Primary Cooperative Society are partly sold in the roadside shops/footpaths by the persons of Chuti village deputed by the Society. Occasionally, the finished products are also sold door to door from one locality to another in Ranchi with the help of bicycle.
Earlier, since majority of the yarn was provided by the Regional Cooperative Union, there was not much problem of finance for the Primary

Vol. 2, No. 1, May 2014IUJ Journal of Management95
Cooperative Societies. The payments were also released by the Regional Union within 15-30 days of the delivery of the finished products by the Primary Societies to the Regional Union.
However, with the lowering of the scale of activity of the Regional Union, the Primary Societies have to procure raw materials (yarns) for self production. The yarns that were purchased from Calcutta are procured on payment of 50 percent advance money to the supplier. Since there is no cooperative bank in Jharkhand, the sources of funding are also limited for the Primary Societies.
The handloom sector today requires institutional support for modernization of production, steady and regular supply of inputs like yarn, dyes and chemicals at reasonable prices, training in design and innovative patterns of weaving. There is also a need to empower weavers to chart out a sustainable path for growth and diversification in line with emerging market trends.The Jharkhand Government under the State Industrial Policy has pledged to take measures to facilitate assistance to the handloom sector in the State. However, anything concrete is yet to be done by the State Government. The handloom sector in the State has not received any financial assistance or subsidy from the Central Government for the last decade.
The handloom sector has an edge over the power loom and mill sector in its ability to commercially produce the goods in small volumes, openness to innovation, quick to switch over to new designs, adoptability to suppliers requirements and creation of exquisite designs. It has also the comparative advantage in terms of availability of skill base across the country, abundance of local raw materials and labour intensity.
SWOT Analysis
(A)Strengths1. People of the Cluster have entrepreneurial
temperament.2. There is no dearth of skilled manpower who
have traditionally been weavers for generations.
3. The Cluster is located very near (within 15
Km.) to the capital city of Ranchi and well connected with metalled road.
4. There is proximity and accessibility to banks.
5. The village is electrified.
(B)Weaknesses
1. Problem in availability of yarn locally2. No choice of yarn available3. Traditional looms made of wood have
become obsolete because they get damaged by termites and thus do not have a long life. Also, their use requires more effort and thus, the speed of weaving is also adversely affected.
4. Low level of modernization and up gradation of technology
5. Non adoption of innovative designs with changing market expectations
6. No weaver training institute in the State7. Insufficient working capital8. Lack of market information and knowledge9. Inadequate attempt to produce value added
products10. Lack of marketing skills in the Cluster to
market the finished goods11. Non cooperative attitude of Government
functionaries12. Non cooperative attitude of potential clients
(Government & non-Governmental)
(C)Opportunities1. No dearth of demand2. Availability of cheap and local manpower3. Availability of traditionally skilled labours4. Extensive scope for diversification of
products5. Scope for improvement in product design6. Scope for trainings and skill up-gradation7. Capacity to produce quality products (D)Threats1. No dearth of demand2. Availability of cheap and local manpower3. Availability of traditionally skilled labours4. Extensive scope for diversification of
products5. Scope for improvement in product design6. Scope for trainings and skill up-gradation7. Capacity to produce quality products
Vol. 2, No. 1, May 2014IUJ Journal of Management96
(D)Threats1. Lack of institutional linkages2. Decline in the profit margin due non-
availability of raw materials locally3. Manufacturing process is labour intensive4. No regular work for weavers5. Absence of private public partnership in the
S t a t e t o p r o m o t e r e s e a r c h & development
6. Non-up gradation of process technology may affect sustainability
7. The market is becoming increasingly particular about their choice
8. Increased competition from power looms9. Increased competition from synthetic cloth
materials6. Conclusion and Recommendation
On the basis of diagnostic analysis as mentioned above, the following plan of action is recommended:
(A) Reviving the Regional Cooperative
Union
The Regional Cooperative Union needs to be revived. It is the nodal agency which is approachable to the Primary Weavers' Cooperative Societies and is comparatively better equipped to handle all the business processes on behalf of the Primary Societies, including procuring work orders, raw materials, organizing trade fairs, conducting trainings on skill development and application of new designs and patterns, undertaking promotional and marketing functions.
(B) Assured Markets for the Finished
Products
The State Industrial Policy outlines that the Central Government, the State Government its various agencies and private/joint sector industries located within the State will be persuaded to purchase products from the handloom sector. Since persuasions have not yielded any results, the State and the Central Government should fix a quota for the various Government Departments (hospitals, schools, tourism, state owned hotels & tourist bungalows,
etc.), which should be mandatory for them to purchase handloom products from the Regional Cooperative Union.
(C) Organizing Regular Trade Fairs Locally
for the Finished Products
Regular trade fairs (quarterly or even monthly) of the finished products should be organized at different locations in the State. This would provide exposure and publicity to the handloom products as well as create awareness and interest amongst the prospective buyers about the products. Such fairs would provide opportunities to the organizers to explore and develop regular market for their products.
References:
• Arasaratnam,S. (1990): “Weavers
Merchants And Company : The
Handloom Industry In South Eastern
I n d i a , 1 7 5 0 - 1 7 9 0 ” I n
S.Subramanyam(Ed.) Merchants,
Markets And The State In Early Modern
India,Oxford University Press , Delhi.
• Haggblade, Steven, ed.; Peter B. R.
Hazell, ed.; Thomas Reardon, ed. 2007.
Transforming the Rural Nonfarm
Economy: Opportunities and Threats in
the Developing World. Baltimore, MD:
Published for the International Food
Policy Research Institute (IFPRI) by
Johns Hopkins University Press.
• Reardon, T., K. Stamoulis, and P. Pingali.
2007. Rural nonfarm employment in
developing coutnries in an era of
globalization. Agricultural Economics
37 (s1): 173-183.
• Development Data Group. 2008. World
Development Ind ica tors 2008 .
Washington, D.C.: The World Bank.
• Government of India (2010) Milestones:
2009-2010.Textiles: Resurgence.
Ministry of Textiles, New Delhi.
• http://www.indianhandloomscluster-
dchl.net/

Vol. 2, No. 1, May 2014
Inventory Model for Items with Imperfect Quality and Screening at Vendor Site
Abhay Kumar Sinha1
During production, items produced cannot be of perfect quality and some items produced may be defective due to imperfect production. Identification of defective items at early stage and their efficient management is very important to reduce overall loss. Through this paper various ways to dispose defective items have been discussed and a model has been proposedfor screening of defective item from a lot of items at the vendor site in a single-vendor single-buyer situation for a single product. It is also assumed that the screening process itself is not perfect due to human errors. Key Words: Imperfect Quality, Imperfect Screening, Single Vendor, Single buyer, Single product
1 Faculty Member and Research Scholar of IUJ, Ranchi, E-mail ID: [email protected]
97
Introduction
Defective items at production stages of a supply chain directly impact the coordination of the product flow within its supply chain. In response to this concern, production and inventory lot sizing models, which incorporate imperfect items into their formulation of models, have become an important and growing area of research. Items are being produced by the producer in a batch as per market demands and orders. The quality of the production could not be of a perfect quality, so each batch contains some defective items in it. The vender sends items produced to the consumer through its dealers(buyer) as soon as the lot size become equals to the Economical Lot Size determined by a Supply Chain Inventory Models. The dealer starts screening of the items as soon as it arrives. The dealer can have different types of screening.
Salameh and Jaber (2000) first gave Economic Order Quantity (EOQ) model. As per their paper assumptions used for economic order quantity (EOQ) models needs to be justified. They gave emphasis to include more factors that contribute
to the cost of the inventory. They had given a situation where an item is of imperfect quality; not necessarily defective; could be used in other production/inventory where these items can be utilized. The paper extended traditional EOQ model by accounting for imperfect quality items.The paper also considers that poor-quality items could be sold as a single batch by the end of the 100% screening process.
Goyal&C´ardenas-Barr´on (2002) published a Note, whichpresented a simple approach with the optimal methodfor determining the economic production quantity for an item with imperfect quality.
Wee et al. (2007) had developed optimal inventory model as shown in figure 1 for items with imperfect quality and shortage back ordering with a view of the fact that poor-quality items do exist during the production. Defective items are filtered during the screening process and removed from the stock. It may lead to shortage of the items in the supply chain system and buyer has to wait for new the lot to arrive and to screen.

Vol. 2, No. 1, May 2014IUJ Journal of Management98
After arrival of a lot t time is required for screening process. At the end of the screening process py items found defective from y items received from the vendor and inventory level of the dealer drop by it (i.e., py). During the period t 1
the inventory meets the market demand. After the time t the inventory of the item becomes zero and 1
buyer have to wait for the arrival of new lot. There are backorder of B items during the period. When the new lot arrives the backorder of B items will be clear.
Maddah&Jaber (2008) rectified Economic Order Quantity (EOQ) Model of Salameh and Jaber (2000) with unreliable supply. They extended the model by allowing for several batches of imperfect quality items to be consolidated and shipped in one lot.
Wahab and Jaber (2010) presented the optimal lot
sizes for an item with imperfect quality based on
Salameh and Jaber (2000),Maddah and
Jaber(2008), and Jaber et al. (2008)where
different holding costs for the good and defective
items are considered. They showed that learning
in the system could reduce the differences
between the lot sizes with and without different
holding costs for the good and defective items.
Hus & Hus (2012) worked on the model proposed by Wee et. al. (2007). They pointed out contradictions between Wee et. al. (2007) model and assumptions used in the model. In Wee et. al. model backorder of B items are cleared as soon as the lot of new items arrived. They did not consider the time needed to screen B items before clearing them. Hus & Hus ((2012)developed a corrected model as presented in figure 2
Figure. 1
Figure. 2

Vol. 2, No. 1, May 2014IUJ Journal of Management99
The model shows that t time is required to clear 3
backorder. During this period the market demand and backorder are cleared and is equal to the screening rate of items. The slop of the above figure during the period represent rate of screening. After this period items are sold in market as per the market demand. This slop is represented in the above figure from t to t and t 3 1 1
to T.
Above all models are based on assumptions that all items are being produced by vendor and supplied to its dealers. A dealer after receiving items from the vendor conduct screening test of items. Items found defective are either sent back to the vendor or sold by the dealer at lower price in the market. The purpose of this paperis to explore alternative ways to deal with defective items found during screening test.
2. Handling Defective Items Found in Screening Test
Items found defective in the screening test are not waste but have some market value. Due to production of defective items, the vendor has to incur some loss. Selection of an appropriate alternative for disposal of defective items reduces the loss to the vendor. The vendor should try to explore alternatives. Following are the ways the defective items could be handled.
1) There are some defects which can be easily rectified by spending some more money on defective items. The vendor has to take decision whether he will go for rectification of items or sell them at discounted price. If the cost of the rectification of items is very less and cost of rectification plus the selling priceof defective items in market is less then selling priceof the item then vendor should go for rectification otherwise items should be sold at discounted price.
2)If the cost of rectification of the item is high or quality of items after rectification is low/unsatisfactory,then it would be better to sell the defective items at discounted price in the market.
3) Defective items which cannot be rectified
and have no market value should be sold as scrap
4) Defective Items not traced during screening can be sold in the market. The user of the items finds defect and getsreplacement by fresh one. These items are returned to the vendor for disposal if it could be rectified otherwise it could be sold in the market as scrap (no market value).
3. The Model that perform screening at the vendor site
In all the above research papers screening of items are done by dealers. Defective items also contribute to the total transportation cost. Screening at vendor site not only reduces the cost of transportation, but also gives more options to deal with defective items in efficient ways.
Assumptions of the model
a. The demand rate is known, constant and continuous
b. The lead time is known and constant
c. The replenishment is instantaneous
d. Screening is performed at vendor site
e. The screening process is not perfect and there is error in screening.
f. The screening process and production proceed simultaneously
g. The defective items exist in the lot size y. h. Single product is considered
i. Single buyer is considered

Vol. 2, No. 1, May 2014IUJ Journal of Management100
The dealer (the buyer) receives items in lot size of y. It sells items in the market. As it has been assumed in the model, there are possibilities of screening errors in the screening process. These errors are of two types
1) Non-Defective item declared as defective items (items are with vendor)
2) Defective items declared as non-defective item.
The first error causes loss to the vendor as fresh items are being sold at discount. If
Here, a model has been proposed as given in figure-3 that performs screening at vendor site and consider that there may be errors in screening process also in single vendor and single buyer situation. The vendor produces items in a lot (y + B ). The screening process starts immediately 1
after the production at the vendor. During the screening B = py items found defective. p is the 1
probability of an item to be found defective. Defective items are removed from the inventory immediately after screening and send for disposal. When screened items level reaches to the lot size y, the lot is transported to the dealer (the buyer) immediately, reducing the inventory level to zero for the vendor. Following fig shows inventory level of the vendor. One cycle completed in T time
Figure-3
Inventory of Vendor
py
Inventory Level
Time
B1
y
Production Rate of items
Production of Rate
of screened Items
T
Time
Inventory Level
Inventory Level of fresh items
Inventory Level of Defective items
y
T
Figure-4

Vol. 2, No. 1, May 2014IUJ Journal of Management101
Khan, M., Jaber, M.Y., Guiffrida, A.L. and Zolfaghari, S. (2011) 'A review of the extensions of a modified EOQ model for imperfect quality items', International Journal of Production Economics, Vol. 132 No. 1, pp. 1–12.
· Maddah, B. and Jaber, M.Y. (2008) 'Economic order quantity for items with i m p e r f e c t q u a l i t y : r e v i s i t e d ' , International Journal of Production Economics, Vol. 112 No. 2,pp. 808–815.
· Salameh, M.K. and Jaber, M.Y. (2000) 'Economic production quantity model foritems with imperfect quality', International Journal of Production Economics, Vol.64 No. 1–3, pp. 59–64.
· Wahab, M.I.M. and Jaber,M.Y. (2010) 'Economic order quantity model for items withimperfect quality, different holding costs, and learning effects: A note. ' , Computersand Industrial Engineering, Vol. 58 No. 1, pp. 186–190.
· Wee, H.W., Yu, J. and Chen, M.C. (2007) 'Optimal inventory model for items withimperfect quality and shortage backordering', Omega, Vol. 35 No. 1, pp. 7–11.
vendor try to rectify defective items as second screening process, it reduces this type of error and gives chance for rectification of items.Due to second type of screening error, defective items reach to the buyer and are sold in the market. User of the item finds defect and get it replaced by a non-defective one immediately from the dealer. The defective items received from the market will also be stored in the inventory of the buyer. It has been denoted by dashed line in the figure. In a cycle it becomes B . Thus total defective items 2
will be B + B . When new lot arrives the stock of 1 2
the defective items all will be sent back to vendor for its disposal. The cycle gets repeated in the time interval T. as given in figure-4
4. Conclusion
Various options for disposal of defective items have been discussed in this paper. An outline of the inventory model which deals with defective items with imperfect production and imperfect screening at vendor site for single vendor and single buyer of single product has been given. Screening has to start with production of items and defective items found could be immediately sent for disposal. Level of the inventory will be reduced by B , (number of defective items found 1
in screening) which resultsinto cost saving. Due to imperfect screening, some items still penetrate into market and their defectsare found by the consumer of the items. Consumer returns them andan inventory of these defective items are maintained at buyer site. These defective items are sent back to the vendor for disposal. A mathematical model of this model is area of further work.
References
· Goyal, S.K. and C´ardenas-Barr´on, L.E. (2002) 'Note on: economic production quantity model for items with imperfect quality – a practical approach', International Journal of Production Economics, Vol. 77 No. 1, pp. 85–87.
· Hsu, J.T. and Hsu, L.F. (2012) 'A note on “Optimal inventory model for items with imperfect quali ty and shortage backordering” ', International Journal of Industrial Engineering Computations, Vol. 3 No. 5, pp. 939–948.

Vol. 2, No. 1, May 2014
Book Review
URBANIZATION IN ASIA: Governance, Infrastructure and the Environment
P. K. Samanta*
The world's urban population is expected to account for two-third of world's total population by 2025. The level of urbanization in Asia, however, has been lower than that of the world since 1950. Across regions, Asia was the least urbanized even less than Africa during 1970-2000. In 1960, only 20.7% of Asia's population was urban versus 33.6%for the world. In 2000, 46.7% of the world's population lived in cities while only 35.5% of the population in Asia did so. In 2010, these shares of urbanization moved to 52% and 43% respectively. In India, the share of urban population in the total population is estimated to increase from 28% in 2001 to nearly 50% by 2020. Currently, while urban population constitute less than one-third of the country's total population, urban areas contribute to half of India's GDP; reflecting their importance in achieving regional and national growth targets.
The book contains 15 chapters contributed by academicians and practitioners and it focuses on urban governance in the developing world; its aim being to bring a holistic perspective to the debate on urban governance not only in Asia and but also around the globe. The discussion in the book has been divided into three sections. The first section deals with rural interventions – which influence urbanization – and provides solutions to some of the existing and emerging issues. The second section focuses on urban governance, infrastructure programs, service delivery reforms and their evaluation. The final section delves into some important aspects in urbanization and the environment.
The first Part of the book focuses on rural-urban
linkages including the programs implemented
in the rural areas which have an impact on the
urbanization process. The programs
implemented in the rural areas such as
Mahatma Gandhi National Rural Employment
Guarantee Act (MNREGA) and Total Sanitation
Campaign has significantly reduced the rural-
urban migration. The first two papers have
highlighted the implementation and sustainability
of the above two programs with the help of useful
case studies. The third paper focuses on the
emerging issue of temporary and short-term
migration. It offers an in-depth study of how an
informal market accommodates and is in turn
shaped by these transient migration flows, taking
the case of the cycle-rickshaw rental market in
Bilashpur (Chattisgarh) in Central India. The
qualitative and quantitative evidences indicate the
close interdependence of informal markets and
mobile workers offer a critical benchmark for
evaluating policy interventions for informal and
multi-locational workers in urban settings.
The second part of the book is concerned about urban governance, infrastructure and service delivery. In the first chapter of the section, the authors have undertaken a review of the country's four major cities – Delhi, Mumbai, Kolkata and Chennai – by developing indicators and benchmarks for six thematic areas that capture the crucial dynamics and potential of urban areas. The thematic areas are: (a) History and governance, (b) Demographics, (c) Economic dimensions, (d) Infrastructure and public services, (e) Resources and (f) Quality of life.
While the urbanization phenomenon is widely accepted as being an inevitable by-product of development, there are many undesirable outcomes that have resulted from urbanization. With rapid increase in urban population and demand for urban infrastructure services, the capacities both in terms of human and financial resources of local governments in many countries are overburdened. The authors in the second chapter have taken the case of the state of Karnataka and found that while centrally funded
*Asst. Professor, National Institute of Construction Management and Research, Pune. India. Email : [email protected]
102

Vol. 2, No. 1, May 2014IUJ Journal of Management
programs are better in drawing and enforcing formal processes, local governments are better at implementation of the state funded urban infrastructure programs. With respect to the state centric urban infrastructure programs cities implemented infrastructure projects with great interest and enthusiasm, since they are eventually locally owned and used and these projects facilitated the mobility of residents and improved the ambience of the neighbourhood. In chapter three, the authors have made an analysis of the evolution of contractual allocation of critical risks for PPP projects in the road sector during the different stages of concession agreements for national and state highways in India. The authors have concluded the chapter with the analysis that over the years, risks relating to revenues and cost overruns have been always passed on to the private party, which reflects the belief of the policy makers that the private party is more capable of mitigating the risk. On the other hand, in the case of risks relating to land acquisition and permits/approvals, there is a shift in the risk allocation towards the government, which might be in the best interest of the projects.
Chapter four discusses about an emerging concept of multimodal public transport system which is an integrated approach for metropolitan cities in India that incorporates all components of urban transport into a single system for efficient use of available transport resources and infrastructure to ensure better mobility within a wide range of modal options. The study reveals that the average time saved due to modal shift from bus to metro along the Delhi metro corridor Line I.
In the fifth chapter the author examines the hidden costs in public infrastructure projects, taking the case of the East-West metro in Kolkata. Using data from surveys, this paper finds a road-blockage of 1.5 km with a diversion of 0.9 – 1.09 km, and finds a loss of Rs 8.4 million per year from extra fuel, subsidy, lost man-hour and pollution (excluding cost for vehicle maintenance and accidents). The next chapter investigates the impact of reforms introduced in Solid Waste Management (SWM) in India, focusing on the informal sector in Delhi, more specifically ragpickers engaged in the management of waste.
In chapter seven, the authors have estimated the welfare loss due to improper municipal solid waste management in Tirunelveli Corporation in Southern India. The welfare loss is estimated using the logit and tobit models with the purpose of discovering willingness to pay for improving the quality of municipal solid waste management. The authors have listed the important determinants such as household income, family size, years of residing, distance from the landfill sites etc of a household's willingness to pay to avoid diseases caused by rampant municipal solid waste.
The last chapter of the part highlights the regulatory compliance difficulties faced by the SME sector in Fiji and to investigate the solutions for efficient enhancement of this sector and its implications for urban governance. The authors have suggested that there should be a “one stop” check list readily available in different languages detailing all the regulatory compliance needed to be fulfilled in opening and maintaining a business.
Part three of the book highlights on different aspects of urbanization and environment. The author in the first chapter of the section highlights land-use statistics at the national level and for major metropolitan regions to explore the direction and scale of land-use changes. The next chapter explores the relationship between urban form and residential energy use in Bandung, Indonesia. The study concludes that combining the concept of compact urban development and energy-efficient housing design will contribute to better solutions for creating a more energy efficient city.
The last chapter of the volume discusses the nexus of urbanization and environment in Asia. Since the subcontinent is urbanizing at a very fast pace than any other region resulting in increased number of densely populated megacities, the region will be confronted with greater environmental challenges such as air pollution, congestion etc. But at the same time urbanization facilitates the rise of middle class and property owners, development of service sector, educational attainment and innovations in green technology. The chapter offers a cautiously optimistic environmental prospect for the region.
103

Vol. 2, No. 1, May 2014IUJ Journal of Management104
The book makes a good reference reading on urban infrastructure management for policy makers and researchers in this area.
Title of Book: URBANIZATION IN ASIA: Governance, Infrastructure and the Environment
Editors of the Book: Kala Seetharam Sridhar and Guanghua Wan
Publisher: Springer India, 2014
Pages: 300

Vol. 2, No. 1, May 2014IUJ Journal of Management
The ICFAI University, Jharkhand About Us The ICFAI University, Jharkhand (IUJ) was established under the provisions of the Institute of Chartered Financial Analysts of India University Act, 2006 (Jharkhand Act No. 08 of 2007), vide Notification dated June 17, 2008 of the Government of Jharkhand. The University is sponsored by the Institute of Chartered Financial Analysts of India (Icfai), a not-for-profit educational society established in 1984 under the Andhra Pradesh (Telangana Area) Public Societies Registration Act, 1350 F (Act No.1 of 1350F) with the objective of imparting training in finance and management to students, working executives and professionals in India The IUJ is included in the list of universities maintained by University Grants Commission (UGC) under section 2(f) of the UGC Act, 1956 vide their letter no F.8-17/2009(CPP-I) dated 01 Dec 2009. The University believes in creating and disseminating knowledge and skills in core and frontier areas through innovative educational programs, research, consulting and publishing, and developing a new cadre of professionals with a high level of competence and deep sense of ethics and commitment to the code of professional conduct. Faculties of the IUJ The IUJ has two faculties; i) Faculty of Management Studies (FMS) and ii) Faculty of Science & Technology (FST). While FMS is committed to provide quality education and training along with research in the field of management by helping the students to develop business and personal competence through their exposure to real business problems, case-based analysis and industrial interaction, FST is devoted to offer advanced industry-oriented education in the field of technology. FMS offers; Ø MBA (Masters of Business Administration), a two year campus based program for
graduate students, Ø MBA-WP (Masters of Business Administration for Working Professionals), a two year
campus based program for working graduates,
Ø BBA (Bachelor of Business Administration), a three year degree program for the students
of Class 10+2,
Ø BCA (Bachelor of Computer Application), a three year degree program for the students
of Class 10+2 on merit basis, and
Ø Ph. D. Programme (Part-Time) in Management, a four year programme for the working
executives and academicians with master’s degree and work experience of three years.
FST offers; Ø B. Tech. (Bachelor of Technology), a four year degree program for the students of Class
10+2 Science (PCM group) on merit basis.

Vol. 2, No. 1, May 2014IUJ Journal of Management
IUJ Journal of Management Vol. 2 No. 1 May 2014
IUJ Journal of Management I/We wish to subscribe to the IUJ Journal of Management.
Name ___________________________________________________
Designation ___________________________________________________
Organization ___________________________________________________
Address ___________________________________________________
___________________________________________________
City _____________________ PIN Code _________ State ______________
Contact No. _______________________ ________E-mail Id __________________________________
Subscription Period: _______________________ Payment mode : DD / NEFT
DD No/NEFT Ref No . _________________________ Dated ______________ Rs./US$ ____________
Drawn on ___________________________________________________________________________
(Banker’s Name and City)
Signature: _______________________________
Subscription Rates: (The Journal will be e-mailed to the subscribers at the e-mail ID given above, in PDF format):
All payments may be made by way of Demand Draft, drawn in favour of “The ICFAI university, Jharkhand - Fee Collection Account” payable at Ranchi or by way of NEFT as per following details:. A/c: ICFAI University Jharkhand-Fee Collection Account, No.: 50200000250955, Bank: HDFC, IFSC: HDFC0000521 Please mail / e-mail to:
Editor, IUJ Journal of Management ICFAI University Jharkhand Grand Emerald Building, Ashok Nagar, Ranchi - 834002 E-mail: [email protected]
Subscription Charge for In Indian Rupees In US Dollars One Issue 200 10 One year 350 18 Two years 650 35 Three years 1000 50
Subscription Form

Vol. 2, No. 1, May 2014IUJ Journal of Management
IUJ Journal of Management ISSN: 2347 - 5080
Vol. 2 Issue No. 1 May 2014
IUJ-JOM
Reader’s Feedback
Please send your Feedback to the Editor, IUJ Journal of Management, ICFAI University Jharkhand, Grand Emerald Building, Between Road No. 1 & 2, Ashok Nagar, Ranchi – 834002 or E-mail the Scanned Copy to [email protected]


![Icfai Final 1[1]](https://static.fdocuments.net/doc/165x107/577d2a4b1a28ab4e1ea8e580/icfai-final-11.jpg)