07 DAKT ANNUAL REPORT - Daktronics
78
DAKT 20 07 SCOREBOARDS. DISPLAYS. VIDEO. SOUND. DAKTRONICS ® ANNUAL REPORT
Transcript of 07 DAKT ANNUAL REPORT - Daktronics

20
07
DAKT
20
07
scoreboards. displays. video. sound. DAKTRONICS
®
AN
NU
AL
REPO
RT

DAKT
200
7 AN
NUAL
REP
ORT
Net sales ............................................................................................................................... Gross profit ...........................................................................................................................Operating expenses ...............................................................................................................Operating income .................................................................................................................Net income ...........................................................................................................................Earnings per share (diluted) ...................................................................................................Cash dividend per share .........................................................................................................
Working capital .....................................................................................................................Total assets ............................................................................................................................Shareholders’ equity ..............................................................................................................Weighted average shares outstanding.....................................................................................
Capital expenditures for property and equipment ...................................................................Product design and development ............................................................................................Backlog ................................................................................................................................Cash flow from operations .....................................................................................................
Gross profit percentage ..........................................................................................................Operating margin percentage .................................................................................................Return on beginning shareholders’ equity ...............................................................................Return on average assets .......................................................................................................Employees as of year end: Full-time .......................................................................................................................... Part-time and students ......................................................................................................Stock price during fiscal year: High ................................................................................................................................. Low ..................................................................................................................................Stock price at fiscal year end ..................................................................................................
Daktronics is recognized worldwide as a leader in the large electronic display industry. We design, manufacture, sell and service a variety of display products in three primary markets: sports, commercial and transportation. Sports customers include schools, colleges and universities, professional teams and facilities, and international events and organizing committees. Commercial customers include financial institutions, hotels and motels, gaming, auto dealers, convenience stores, shopping centers, other retail establishments and outdoor media companies. Transportation applications include display systems for state and city departments of transportation, mass transit systems, airlines and airports, bus terminals, parking facilities and other transportation agencies.
Daktronics was founded in 1968 by two professors from South Dakota State University in Brookings, S.D. We employ approximately 3,200 full-time and part-time employees. As a manufacturer and technical contractor, Daktronics markets standard display products and customized display and sound systems. We believe our engineering capabilities are second to none in the industry. We are committed to on-going product development to find new applications for our products and expand the markets we serve. During the past five years, we have achieved compound annual sales growth in excess of 23 percent and compound annual earnings per share growth of more than 35 percent. Daktronics stock is traded on The Nasdaq Global Market under the symbol DAKT.
(Dollars in thousands, except per share and share price data.)FY 2005$230,346
73,20953,77319,43615,660
0.39-
$62,287151,462103,910
40,274
$13,48310,49973,00022,377
31.8%8.4%
18.2%11.3%
1,120510
$14.979.81
10.18
FY 2003$177,764
59,13139,30619,82512,458
0.32-
$39,700102,52765,30339,030
$5,3406,918
50,00015,844
33.3%11.2%24.2%13.1%
864370
$8.553.657.34
FY 2004$209,907
72,47144,94127,53017,727
0.44-
$51,681126,236
86,26439,872
$9,7798,126
54,00021,031
34.5%13.1%27.1%15.5%
947477
$13.887.10
10.62
23.8%23.0%20.1%32.3%37.9%35.1%
9.7%24.9%24.4%1.4%
49.2%16.0%20.0%(3.3%
38.8%
FY 2007$433,201
126,59789,68236,91524,427
0.590.06
$45,040265,850153,708
41,311
$58,74315,627
127,00014,606
29.2%8.5%
19.5%10.5%
2,290935
$40.0518.3123.92
All per share, shares outstanding and market price data reflect the May 2006 two-for-one stock split. All other figures are as reported.
FY 2006$309,370
94,07462,25931,81520,961
0.520.05
$74,930199,847125,345
40,506
$18,91911,17293,00031,917
30.4%10.3%20.2%19.6%
1,411677
$21.289.60
19.61
FIVE YEAR COMPOUND
ANNUAL GROWTH
RATES
)
COMPANY OveRvIew - fIve YeAR fINANCIAl SuMMARY

1
2003
Mill
ions
of D
olla
rs
$0
$100
$200
$400
$178
2004
$210
2005
$230
2006
$309
2007
$433
$300
$500net sales
2003$0
$.10
$.20
$.32
2004
$.44
2005
$.39
2006
$.52
2007
$.59
$.30
$.40
$.60
earninGs per sHare
$.50
20030%
10%
20%
11.2%
2004
13.1%
2005
8.4%
2006
10.3%
2007
8.5%
40%
30%
operatinG marGins
2003
Mill
ions
of D
olla
rs
$0
$50
$100
$50
2004
$54
2005
$73
2006
$93
2007
$127
$150
backloG at end of fiscal year
$0
$50
2002 2003 2004 2005 2007
$100
$150
$200
$250
$300
$350
$400
2006Daktronics, Inc.NASDAQ U.S. IndexS&P 600 Electronic Equip. Manufacturers(assumes $100 invested April 27, 2002)
$139.80$151.79
$450
$521.04dakt vs. indexed returns
$500
20030%
10%
20%
33.3%
2004
34.5%
2005
31.8%
2006
30.4%
2007
29.2%
40%
30%
Gross marGins

DAKT
200
7 AN
NUAL
REP
ORT
2
leTTeR TO ShARehOlDeRS
A Landmark Year for DaktronicsFiscal 2007 was a phenomenal growth year for Daktronics. We grew our top line 40 percent, which followed 34 percent growth in fiscal 2006, thereby nearly doubling our annual sales over the past two years.
A number of major accomplishments this year allowed us to achieve this success. Many were related to increasing our manufacturing capacity, which was our primary constraint at the beginning of the fiscal year.
Last fall we held a ribbon cutting for the new addition to our existing manufacturing facilities in Brookings and broke ground for the new multi-purpose building on the same day with South Dakota Governor Mike Rounds in attendance.
We launched and began implementing our lean manufacturing program with the help of external consultants. Thinking and implementing “lean” is an ongoing journey that we have only just begun, but we have seen some tremendous success from these efforts already.
We set up our first display module assembly flow line in conjunction with moving into our new electronic assembly area. This revolutionized how we build our display modules and was the first step on our lean journey. By the end of the fiscal year we had four module flow lines operational. We also purchased our first surface-mount assembly line and for the first time manufactured in-house printed circuit assemblies using surface mount electronic components.
New manufacturing facilities in Redwood Falls, Minnesota and Sioux Falls, South Dakota, now help us meet demand for growing product lines. It has been exciting to watch these new facilities come on line and now see them up and running, serving our rapidly growing Commercial market. Both are set up with lean principles in mind.
The digital billboard market continues to grow. We have made significant investments to ensure we have the capacity in both manufacturing and field service to support this rapidly growing part of our business, and we have been favored with significant market share in this niche. As in all areas, it will be essential that we continue to provide great product and service at a competitive price to maintain this favored position.
Another highlight was watching the University of Texas fire up the largest video board in any U.S. sports facility last fall. The interest in high definition displays has become a key driver for our business in the Large Sports Venues niche.
We completed our first full year of operation in China. We built a strong team for sales, service and manufacturing, with offices in Shanghai and Macau. We have been successful in landing several large projects, including the three-dimensional spectacular in front of the Grand Lisboa Casino in Macau, using our ProPixel® technology, which was manufactured largely at our Shanghai facility.
We acquired the Hoffend & Sons rigging and hoist business in Victor, New York. The primary product of this business is the Vortek® rigging system which is sold primarily into theaters, with high schools being a large part of the market. We are happy to have the Vortek® team on board and are excited about the potential of this business.
We have aligned our resources more closely with the markets, thereby creating a more focused business unit structure. This new structure aligns product development, project engineering, manufacturing and customer service more closely with our sales and marketing groups. These areas were previously separate departments informally connected to the markets. The primary purpose of realigning into business units is to better serve our customers while improving financial performance.
We’ve identified three experienced and proven senior business leaders to head up our five business units. Reece Kurtenbach will manage our Live Events and International units, Dan Bierschbach will manage our Schools and Theatres unit, and Brad Wiemann our Commercial and Transportation units. We have been working toward this structure over the past year and we expect the transition to be relatively seamless. Additional information about each business unit follows.

3
LIVEEVENTS 2007 NBA All Star Game - Las Vegas , NV
ProTour® Technology & Scoring/Timing Systems
Live EventsThe Live Events unit focuses on U.S. and Canadian customers that produce live sports and entertainment events, and require video systems and the real time display of information to support these events. The two primary niches in this business unit are Large Sports Venues and Mobile and Modular.
Large Sports VenuesAbout 43 percent of Daktronics fiscal 2007 revenues came from the Large Sports Venues market. The Large Sports Venues market, which includes the larger colleges, municipal arenas and professional sports facilities, had approximately 33 percent growth over the last fiscal year. One of our key strengths is our unmatched ability in the industry to offer a complete integrated system from a single supplier, including scoring, statistics, timing, video display and sound. We also offer a range of services, including marketing services, content creation and event support, along with ongoing maintenance, to help ensure that our clients realize the full potential from their investment.
As high definition television (HDTV) becomes more common, the expectations for professional and college sports venues have changed. Ticket buying fans expect larger, higher resolution displays. Also, the expanding use of LED (light emitting diode) technology in place of traditional static or rotating advertising panels has been proven to simultaneously increase revenue and fan satisfaction. These two changes have driven the project size for a modern venue significantly higher as compared to several years ago. These mega projects have contributed to the growth of this segment, and we believe it will continue to develop in the future.
In fiscal 2007 we developed new products specially tuned for high definition (HD) technology, with our first installations being the HD-16 model for the Pittsburgh Steelers and the HD-12 model at Auburn University’s Jordan-Hare Stadium.
Mobile and ModularOur relationship with the rental and staging industry continues to grow. We had our ProTour® product in use on concert tours, both in the U.S. and in Europe, as well as at numerous other live events. We continue to expand our line of ProTour® portable modular displays and have also developed expertise in outfitting ProStar® video screens on trucks, thereby providing mobile systems which can be used for events with minimal setup, which is sometimes preferred to the modular approach. We have had notable success in the pari-mutuel racing niche, where it is common for customers to transport their displays among several racetracks, and combine video replay with odds information, timing and results. We continue to see demand for integrated systems including video replay, scoring and data interfaces to provide a complete pari-mutuel racetrack display solution.

DAKT
200
7 AN
NUAL
REP
ORT
4
leTTeR TO ShARehOlDeRS (Continued)
SCHOOLS& THEATRES
Willard High School Willard, MO
Tuff Sport® Scoreboard
CommercialOur Commercial business had another excellent year with approximately 53 percent growth in revenue, providing about 37 percent of our revenues for the year. The Commercial business unit serves four primary customer groups in the U.S. and Canada.
ResellersIn fiscal 2007 we sold displays through more than 850 resellers, typically local or regional sign companies. The resellers primarily sell our extensive Galaxy® line of LED displays that are tailored for on-premise advertising for retail and other types of businesses. Galaxy® displays, capable of presenting both text and graphics, are available in either monochrome or full color models. Our high brightness LED technology, combined with easy-to-use control systems, wireless communication, and decreasing unit prices, continues to expand the market for electronic displays as an advertising medium. This year we further expanded our popular GalaxyPro™ line of products, which offers a broader color palette in much larger displays and lower price points. These products have been very well received.
We are seeing an increasing percentage of our Galaxy® display customers purchase full color capability as they opt for the added advertising benefit that full color offers for nominal additional cost. We continued to expand our regional sales and service team to provide better support to commercial resellers and to help them increase their sales of Daktronics products.
Schools & TheatresOur Schools & Theatres business, which includes U.S. and Canadian high schools, municipal park and recreation departments, club sports and theatres, saw revenue growth of approximately 19 percent over last year.
We sell to and service these customers through our local offices and independent dealers. We continued to expand our domestic sales and service presence in the U.S. to allow us to continue to grow and serve this market. Our extensive sports scoring, timing, sound and display product line positions us very well in this market from a product perspective.
Through the course of the year our engineering team continued to add new models of standard scoreboards, with attention to improving features and capabilities while reducing our cost to manufacture. We continue to see more interest in video displays in larger high school sports programs as prices become more affordable to a greater number of schools. Our sound system business, which we entered in fiscal 2006, continues to develop.
Sales will continue to be driven by our customers’ desires to incorporate larger and more capable display systems into their facilities to enhance the fan entertainment experience and generate advertising revenue.
The acquisition of Hoffend & Sons added automated rigging systems and hoists to our product line. We are expecting continued growth in sales of Vortek® systems, primarily to high school theatre venues. The automated Vortek® rigging system allows for the raising and lowering of curtains and moving other set props without climbing ladders and moving dangerous counterweights. New high school construction projects are the primary driver of demand for the Vortek® products, although any theater is a potential customer.

5
TRANSPORTATION
COMMERCIAL Magic Media - Rochester, MN ProStar® Technology
National Accounts (on premise)National account customers are corporate clients who utilize electronic displays as part of their national advertising and signage programs. The Galaxy® product is the primary product for these on-premise signage programs, with the majority in this category still being the less expensive monochrome red displays. We offer our Venus® 1500 Enterprise software to enable national account clients to control the distribution of content across their network of displays located around the country.
Niches served include but are not limited to pharmacy stores, quick service restaurants and the petroleum market. We are seeing rapidly increasing interest in electronic gas price displays and are supplying these digit displays to a number of national accounts that have embraced this new technology to help accommodate rapidly changing petroleum prices.
Digital Billboards
This year we expanded our product offerings to meet the expanding needs of the outdoor business. We also expanded our manufacturing capacity by establishing a dedicated plant to manufacture outdoor digital displays for the billboard market. This new plant, located in nearby Sioux Falls, has been a great addition to our operation. We have been able to significantly reduce manufacturing lead times to better serve the expanding marketplace. We have also continued to invest in product development to further reduce costs, reduce complexities, and maximize our overall product reliability, while reducing operating costs for the billboard operator.
Our new Visiconn® software offers extensive capabilities to outdoor advertising companies as well as to advertising agencies by providing “proof of performance” reports, ease of digital advertising change-outs, and visibility to available time-slots. This is a very dynamic medium that has been well received by the advertising industry.
We believe that the inherent advantages of our technology in this application, and our ability to provide the services and support necessary to this mission critical application, will continue to position us well in this marketplace. It is important to keep in mind that local sign codes and the economics of advertising are constraints on the usage of electronic displays on billboards; however, this past year’s growth has again demonstrated that the outdoor companies are having success in many localities in overcoming these constraints to install our technology.
SpectacularsWe sell ProStar® video displays for advertising and entertainment, including spectaculars in Times Square, and large displays for gaming facilities in Las Vegas. Significant domestic projects this past year include a new Budweiser display in Times Square. The new spectacular replaced our Budweiser sign that was one of the first displays in Times Square to use red, green and blue LEDs, and which had been a landmark on the square for nearly ten years. A few other noteworthy projects include video display systems for The Venetian and South Point casinos in Las Vegas, NBC’s Today Show set, Mann Chinese Theatre, and the Hollywood Bowl.

TRANSPORTATION Pennsylvania TurnpikeGalaxy® Technology
6
leTTeR TO ShARehOlDeRS (Continued)
InternationalWith only 9 percent of our overall revenues coming from outside the U.S. and Canada, there are significant growth opportunities for us internationally. The opening of sales and service offices in Shanghai and Macau, along with our existing offices in the United Kingdom, Germany, France, and Dubai, gives us a significant base for international operations. We combine the resources of our own people with a network of qualified international resellers to develop and nurture our international business.
Our international business is comprised of large projects in our sports and commercial applications, augmented by some standard orders. We see considerable interest in equipment for sports facilities, advertising and spectaculars worldwide and plan to continue to grow our international presence in the years ahead. Significant projects in the last year include the Torch billboard in London, where our display was installed in a unique structure, and an LED video display on a large egg-shaped structure in Macau, which is approximately 200 feet tall and 450 feet wide (shown on opposite page). This unique display received worldwide attention as an icon of the growth in the region. We have also been selected to provide display systems to Wukesong arena in Beijing, the site of the 2008 Olympic basketball competition.
TransportationRevenues from our Transportation business, which includes U.S. and Canadian airports and airlines, city and state transportation departments, road-zone safety, mass transit systems and parking facilities, comprised about 6
percent of fiscal 2007 revenues. Sales in this market were up about 18 percent over fiscal 2006, which was a result of bringing on a dedicated factory to build the products for our transportation business.
Intelligent Transportation SystemsThe largest component of our transportation business is Intelligent Transportation Systems (ITS), which includes state departments of transportation as well as city and county agencies that manage roadways. Our Vanguard® product line is designed specifically to serve this market and includes a variety of displays and control software that meet the National Transportation Communications for ITS Protocol (NTCIP) standards. We have been successful in getting new transportation jurisdictions signed as clients and in getting repeat business from our existing clients. We believe there is opportunity for continued growth in transportation, especially in the road-zone safety and ITS niches, and that increased government spending will continue to drive growth in this business unit.
AviationThe aviation niche continues to grow as airports are shifting money away from passenger and baggage screening and security to improvements in wayfinding, entertainment and advertising. With the variety of displays we offer, we can meet the needs of numerous airport operations, from curbside displays to ramp displays that assist travelers, airline crews and operations personnel.
ParkingIn the parking niche we see opportunities for our display systems as city streets become more congested across the nation and parking space is at a premium. Customer convenience is the main focus of many parking facilities. They are moving into LED signage for its flexibility, reliability and lower operating costs.

7
Sincerely,
James B. MorganPresident and CEO
INTERNATIONAL Grand Lisboa Casino - MacauProPixel® Technology
Investments in the FutureWith the investments in capacity and infrastructure, our selling, general and administrative costs have increased, reducing our operating margins in the fourth quarter of fiscal 2007. We are committed to curtailing the growth of these expenses and reducing them as a percent of revenue.
This past year our capital expenditures totaled $59 million. The primary theme of these investments was to increase our capacity and our ability to support the business at higher revenue levels. This included bringing the Sioux Falls plant on line focused on digital billboards, starting up the Redwood Falls plant focused on Galaxy® displays, adding equipment at our factories in Brookings to support our sports and transportation market growth, investing in information technology, and completing approximately 50 percent of our multi-purpose building in Brookings, which will be a combination of warehouse, factory, and much needed office space.
We anticipate capital expenditures in fiscal 2008 to be about $50 million as we complete the build-up of our capacity in Redwood Falls, complete the building in Brookings, and further invest in IT infrastructure and systems to support our growth.
Fiscal 2007 has been a very exciting year for Daktronics. We are proud of the accomplishments of our people this past year, and excited about moving forward in fiscal 2008, addressing the numerous market opportunities with our new business unit structure. The new structure will help ensure that we improve our focus on serving each and every one of our customers, and help us be more cost effective in doing so.
We want to again thank all those who played a part in our success in fiscal 2007, including our employees, suppliers and resellers. We thank our customers and our investors for their ongoing confidence in Daktronics. With the increased capacity we have brought on line, the organization by business unit and the growth opportunities we see in all of our markets, we look forward to a great fiscal 2008.
Dr. Aelred KurtenbachCo-founder and Chairman

TRANSFER AgENTWells Fargo Bank Minnesota, N.A.Shareowner Services161 North Concord ExchangeP.O. Box 738South St. Paul, Minnesota 55075
Inquiries related to stock transfers or lost certificates should be directed to Wells Fargo Shareowner Services by calling 800-468-9716 or 651-450-4064.
INDEPENDENT AUDITORSErnst & Young LLP, Minneapolis, Minnesota
LEgAL COUNSELWinthrop & Weinstine, P.A., Minneapolis, Minnesota
ANNUAL MEETINgThe annual meeting of shareholders will be held August 15, 2007 at Daktronics headquarters in Brookings, South Dakota, at 7:00 pm central daylight time. Shareholders of record on June 22, 2007 will be eligible to vote at the meeting.
FORM 10-k AND OTHER REPORTSCopies of the Company’s Annual Report on Form 10-K for the year ended April 28, 2007, filed with the Securities and Exchange Commission, is available without charge upon written request to the Investor Relations Dept., Daktronics, Inc., 331 32nd Avenue, Brookings, South Dakota 57006-5128; by calling 800-605-DAKT (3258); or by accessing the Company’s website at www.daktronics.com.
STOCk PRICE HISTORYThe Company’s common stock trades on The NASDAQ Global Market under the symbol DAKT. High and low sales prices of the common stock for fiscal years 2007 and 2006 are presented below.
INVESTOR RELATIONSContact William Retterath, Chief Financial Officer, at 800-605-DAKT (3258) or 605-697-4000, or e-mail [email protected].
ADDITIONAL INFORMATIONVisit the investor relations pages on www.daktronics.com for additional information on upcoming and future projects, product offerings, and other items of interest to shareholders.
8
DAKT
200
6 AN
NUAL
REP
ORT
CORPORATe INfORMATION
Heinz Field - PittsburghInstallation of New HD-16 Video TechnologyFINANCIALS
First quarterSecond quarterThird quarterFourth quarter
$30.46$31.14$40.05$39.50
$18.95$18.31$22.47$21.62
fiscal 2007High low
$11.88$12.13$16.26$21.28
$9.73$9.60
$10.64$13.86
fiscal 2006High low

UNITED STATES
SECURITIES AND EXCHANGE COMMISSION
Washington, D.C. 20549
FORM 10-K (Mark One)
ANNUAL REPORT PURSUANT TO SECTION 13 OR 15(d) OF THE SECURITIES EXCHANGE ACT OF 1934 For the Fiscal Year Ended April 28, 2007
OR TRANSITION REPORT PURSUANT TO SECTION 13 OR 15(d) OF THE SECURITES EXCHANGE ACT OF 1934
For the Transition Period From ___ to ___.
Commission File Number: 0-23246
Daktronics, Inc. (Exact name of Registrant as specified in its charter)
South Dakota (State or other jurisdiction of incorporation or organization)
46-0306862 (I.R.S. Employer Identification No.)
331 32nd Avenue Brookings SD
57006
(Address of principal executive offices) (Zip Code)
(605) 697-4000 (Registrant’s telephone number, including area code)
Securities registered pursuant to Section 12(b) of the Act: None
Securities registered pursuant to Section 12(g) of the Act:
Title of Each Class Name of Each Exchange on Which Registered
Common Stock, No Par Value Nasdaq Global Market Indicate by check mark if the registrant is a well-known seasoned issuer, as defined in Rule 405 of the Securities Act. Yes No Indicate by check mark if the registrant is not required to file reports pursuant to Section 13 or Section 15(d) of the Act. Yes No Indicate by check mark whether the registrant (1) has filed all reports required to be filed by Section 13 or 15(d) of the Securities Exchange Act of 1934 during the preceding 12 months (or for such shorter period that the registrant was required to file such reports), and (2) has been subject to such filing requirements for the past 90 days. Yes No Indicate by check mark if disclosure of delinquent filers pursuant to Item 405 of Regulation S-K is not contained herein, and will not be contained, to the best of the registrant’s knowledge, in definitive proxy or information statements incorporated by reference in Part III of this Form 10-K or any amendment to this Form 10-K. Indicate by check mark whether the registrant is a large accelerated filer, an accelerated filer, or a non-accelerated filer. See definition of “accelerated filer and large accelerated filer” in Rule 12b-2 of the Exchange Act. (Check one): Large accelerated filer Accelerated filer Non-accelerated filer Indicate by check mark whether the registrant is a shell company (as defined in Rule 12b-2 of the Exchange Act). Yes No The aggregate market value of the common stock held by non-affiliates of the Registrant as of October 28, 2006, (which is the last business day at the Registrant’s most recently completed second quarter), computed by reference to the closing sales price of the registrant’s Common Stock on The NASDAQ Stock Market on such date, was approximately $894,076,000. For purposes of determining this number, individual stockholders holding more than 10% of the Registrant’s outstanding Common Stock are considered affiliates. This number is provided only for the purpose of this Annual Report on Form 10-K and does not represent an admission by either the Registrant or any such person as to the status of such person. The number of shares of the registrant’s Common Stock outstanding as of June 20, 2007 was 39,639,873.
Documents Incorporated By Reference
Portions of the Registrant’s Proxy Statement for its Annual Meeting of Shareholders to be held August 15, 2007 are incorporated by reference in Part III hereof.

DAKTRONICS, INC. AND SUBSIDIARIES FORM 10-K
For the Fiscal Year Ended April 28, 2007
PageSPECIAL NOTE REGARDING FORWARD-LOOKING STATEMENTS 1 PART IITEM 1. BUSINESS 1ITEM 1A. RISK FACTORS 12ITEM 1B. UNRESOLVED STAFF COMMENTS 15ITEM 2. PROPERTIES 15ITEM 3. LEGAL PROCEEDINGS 16ITEM 4. SUBMISSION OF MATTERS TO A VOTE OF SECURITY HOLDERS 16 PART IIITEM 5. MARKET FOR REGISTRANT’S COMMON EQUITY, RELATED STOCKHOLDER MATTERS AND ISSUER PURCHASES OF EQUITY SECURITIES 16ITEM 6. SELECTED FINANCIAL DATA 17ITEM 7. MANAGEMENT’S DISCUSSION AND ANALYSIS OF FINANCIAL CONDITION AND RESULTS OF OPERATIONS 18ITEM 7A. QUANTITATIVE AND QUALITATIVE DISCLOSURES ABOUT MARKET RISK 30ITEM 8. FINANCIAL STATEMENTS AND SUPPLEMENTARY DATA 31ITEM 9. CHANGES IN AND DISAGREEMENTS WITH ACCOUNTANTS ON ACCOUNTING AND FINANCIAL DISCLOSURE 57ITEM 9A. CONTROLS AND PROCEDURES 57ITEM 9B. OTHER INFORMATION 60 PART IIIITEM 10. DIRECTORS AND EXECUTIVE OFFICERS OF THE REGISTRANT 60ITEM 11. EXECUTIVE COMPENSATION 60ITEM 12. SECURITY OWNERSHIP OF CERTAIN BENEFICIAL OWNERS AND MANAGEMENT AND RELATED STOCKHOLDER MATTERS 60ITEM 13. CERTAIN RELATIONSHIPS AND RELATED TRANSACTIONS AND DIRECTOR INDEPENDENCE 60ITEM 14. PRINCIPAL ACCOUNTANT FEES AND SERVICES 60 PART IVITEM 15. EXHIBITS AND FINANCIAL STATEMENT SCHEDULES 60 SIGNATURES 63

1
SPECIAL NOTE REGARDING FORWARD–LOOKING STATEMENTS This Annual Report on Form 10-K (including exhibits and information incorporated by reference herein) contains both historical and forward-looking statements that involve risks, uncertainties and assumptions. The statements contained in this report that are not purely historical are forward-looking statements within the meaning of Section 27A of the Securities Act of 1933, as amended and Section 21B of the Securities Exchange Act of 1934, as amended, including statements regarding our expectations, beliefs, intentions and strategies for the future. These statements appear in a number of places in this Report and include all statements that are not historical statements of fact regarding the intent, belief or current expectations with respect to, among other things: (i) our financing plans; (ii) trends affecting our financial condition or results of operations; (iii) our growth strategy and operating strategy; and (iv) the declaration and payment of dividends. The words “may,” “would,” “could,” “will,” “expect,” “estimate,” “anticipate,” “believe,” “intend,” “plans” and similar expressions and variations thereof are intended to identify forward-looking statements. Investors are cautioned that any such forward-looking statements are not guarantees of future performance and involve risk and uncertainties, many of which are beyond our ability to control and that actual results may differ materially from those projected in the forward-looking statements as a result of various factors discussed herein, including those discussed in the section of this Annual Report on Form 10-K entitled “Item 1A. Risk Factors” and “ Item 7. Management’s Discussion and Analysis of Financial Condition and Results of Operations – Business Risks and Uncertainties,” and those factors discussed in detail in our other filings with the Securities and Exchange Commission. PART I. Item 1. BUSINESS General Development of Business
Company Background and Overview. Daktronics, Inc. was founded by Dr. Aelred Kurtenbach and Dr. Duane Sander in 1968 while they were professors of electrical engineering at South Dakota State University (“SDSU”) in Brookings, South Dakota. Our long and close relationship with SDSU and other South Dakota colleges and universities is a key factor contributing to our leadership in the industry. We have been able to experience sustained growth due in part to the capability of the local universities and colleges to provide an important source of highly educated full-time and student employees. Over the years, our products have evolved significantly, from scoreboards and matrix type displays and related software applications, to complex, integrated visual display systems that include full color video, text and graphics displays located on a local or remote network and tied together through sophisticated control systems which entertain and inform. In the mid-nineties, as light emitting diodes (LED’s) became available in red, blue and green colors with outdoor brightness, we pioneered the development of full color LED video displays capable of replicating trillions of colors thereby producing large format video systems with excellent color, brightness, energy efficiency and lifetime. Due to our foundation of developing scoring and graphics display systems, in which we were already a leader, we were able to add video capabilities so all of a customer’s large format display needs could be met in a complete, integrated system. This has proven to be a key factor in us becoming the dominant company worldwide in large electronic displays. Over the years, we have invested millions of dollars in product development to add complementary products and services, such as production services, sound systems, marketing services, maintenance and support and other revenue generating products for our customers.
Business Developments. As a result of our line of LED display systems and software applications, we gained significant market share through designing and manufacturing quality products and providing technical expertise and services. Our products are in use throughout the world, as we are the world’s leader in all display product categories, according to independent research.
In the sports market, our integrated video and scoring systems have been installed at many professional,
collegiate and high schools facilities, particularly in North America and at international sporting events such as the Olympic games.
With commercial applications, our video, digital billboard and graphics displays can be seen in major
destination sites, such as Las Vegas and Times Square, along roadsides in billboard applications, in front of retail establishments and at major stock exchanges across the globe.

2
In the transportation market, our Vanguard displays are in use in numerous jurisdictions across North America, and our customers include many state departments of transportation. One of our core growth strategies is to enter geographic markets by opening a small sales and service office that provides after-sale support to our entire product line, sales of standard products and support on large custom projects. This network of offices, which totals approximately 60 locations throughout the world, has historically been and is expected to continue to be an important growth strategy. We occasionally acquire businesses that provide access to new markets or complement our existing products. In the past five years, we have acquired a number of small companies. Although these acquisitions increased the scope of services and technology that we are able to provide, our primary growth objective is still the increase of sales through organic growth. Financial Information About Segments
Our global business is in a single industry segment – the design, development, marketing and support of visual display solutions for the sports, commercial and transportation markets. Narrative Description of Business
We are the world’s leading supplier of electronic scoreboards, large electronic display systems and related marketing services, digital messaging solutions, software and services for sports, commercial and transportation applications. Our continuing focus is on supporting customers with superior products, integration and services that provide dynamic, reliable and unique visual communication solutions. We offer a complete line of products, from small indoor and outdoor scoreboards and electronic displays to large multi-million dollar video display systems as well as related control, timing and sound systems and related professional services. We are recognized worldwide as a technical leader with the capabilities to design, market, manufacture, install and service complete integrated systems that display real-time data, graphics, animation and video.
We are engaged in a full range of activities: marketing and sales, engineering and design, manufacturing
and professional services. Each of those activities is described below.
Marketing and Sales. Our products have been sold throughout the United States and in many other countries through a combination of direct sales personnel and independent resellers. In the United States and Canada, we use primarily a direct sales force for professional sports, colleges and universities, convention centers and smaller sports facilities, including high schools and transportation applications. In smaller commercial applications, we use a combination of direct sales staff and resellers. The majority of the products sold by resellers are standard catalog products. These are typically moderately priced and relatively easy to install. A limited number of models are built to inventory and available for quick delivery. We support our resellers through national and regional direct mail advertising, trade journal advertising, trade show exhibitions and our sales force support in the field. We believe that we can expand market share by expanding both our direct sales force and resellers. Our direct sales force is comprised of a network of offices located throughout the world supporting all customer types in both sales and service. In addition to supporting resellers as described above, the direct sales staff sells the entire range of our standard products and substantially all of the large video display systems. Our direct sales staff is structured in a way to maximize cross-selling opportunities across markets. Prior to the start of fiscal year 2008, we accomplished this primarily through a matrix structure where the main focus and reporting responsibilities fell into one of our three main markets. A complementary emphasis was then placed on a regional structure to create opportunities in other markets and to support efforts for the organization as a whole. Beginning in fiscal year 2008, we reorganized our business into five business units which tend to add more focus on the market, while maintaining some of the synergies that existed in the prior structure. The business units consist of commercial, live events, schools and theaters, transportation and international. We believe that customers in each area are unique in a number of ways which are conducive to this structure. For example, live events customers usually have a large variety of product tied into a system in a single location that involves much more creative production services and design. The commercial business unit relies more on needs created by large and remote networks of displays connected through various modes of communication. The transportation

3
business unit focuses on the unique needs of governmental contractors and ties into integrated systems of traffic or people management. Finally, the schools and theaters business unit focuses on the increasing level of support and service and limited resources along with all the statistics and related software and communication needs of athletic conferences and leagues. When we target a potential customer for sales opportunities, the prospect is contacted either directly or through a reseller. Frequently, on larger sales opportunities, engineers, technicians and sales personnel jointly participate in site visits to assess site conditions, evaluate the customer’s requirements and assemble and present proposals. Proposals to prospective customers include business and technical presentations as well as product demonstrations and visits to existing installations. We also regularly host customers at our various manufacturing facilities to demonstrate product quality and delivery capability. International sales fluctuate from year to year based on the timing of large system projects. A typical term of sale for international projects includes a letter of credit or partial payment in advance. We believe that in addition to the growth we expect domestically, we will also achieve growth in the international markets. During fiscal years 2007, 2006 and 2005, approximately 10%, 10% and 11% of our net sales, respectively, were derived from international sales. Since 2000, we have acquired or opened international office locations in Canada, China, France, the United Arab Emirates, Germany and the United Kingdom. We also are a 49% owner in a joint venture in Malaysia. Much of our marketing and sales success in the past was based on our ability to create new products and product enhancements for customers by understanding their needs and opportunities. We have developed and continue to develop this understanding through active participation in the sales cycle by engineers and various other personnel, and through attendance at trade shows, conventions and seminars and fostering a culture of teamwork throughout the organization.
Engineering and Product Development. The large screen electronic display industry is characterized by ongoing product innovations and developments in technology and complementary services. To remain competitive, we must continue to anticipate and respond to changes and developments in the industry. We will continue our tradition of applying engineering resources throughout our business to help achieve more effective product development by investing approximately 4% of our net sales into product design and development. We employ engineers and technicians in the areas of mechanical and electrical design, applications engineering, software design and customer and product support. We use primarily in-house engineering to anticipate and respond rapidly to the product development needs of customers and the marketplace. We assign product managers from our engineering staff to each product or product family to assist our sales staff in training, implement product improvements and ensure that each product is designed for maximum reliability and serviceability. We also invest in new creative technologies and in companies developing new technologies. Our engineering staff consists of four product development groups – sports, video, commercial and transportation. Beginning in fiscal year 2008, these product development groups became more closely aligned with the five business units described above. The sports product development group focus is aligned with the sports and theater business unit, the video group is focused on live events and international and the commercial and transportation group is more closely aligned with the commercial transportation business units.
Until fiscal year 2008, each engineering group was autonomous to allow it to focus on one product family, although the engineering groups also were closely tied with each other to facilitate sharing ideas and technology. This organizational structure positioned us for effective product development because of our concentrated focus on standardization, which reduces the amount of engineering time allocated to one-time custom design. Beginning in fiscal year 2008, with the focus on aligning each engineering group more closely with a business unit, we believe that we can still maintain the tie between the engineering groups and at the same time generate a stronger focus on customers’ needs which are unique to that business unit.
Manufacturing and Technical Contracting. As a vertically integrated manufacturer of display systems, we perform most sub-assembly and substantially all final assembly of our products. We also serve as a technical contractor for customers who desire custom hardware design, installation or other technical services.

4
Our manufacturing operations include component manufacturing and system manufacturing (metal fabrication, electronic assembly, sub-assembly and final assembly.) We augment our production capacity with the use of outside resources primarily due to capacity constraints, although we have also used outside providers when it was more cost effective. We use a modular approach for manufacturing displays. Standard product modules are designed to be used in a variety of different products. This modular approach reduces parts inventory and improves manufacturing efficiency. We inventory a limited supply of standard products. Custom projects are built according to the customer’s specifications. Product modules are designed so that a custom product may include a significant percentage of standard components to maximize reliability and ease of service. We are also taking additional action to decrease the number of projects that are considered custom in terms of the equipment, such as products sold to the billboard niche and increasing overall standardization within video products. In scheduling and manufacturing, production employees work to ensure quality and timely delivery while minimizing inventories. Our order entry, production, customer service and many other functions are also consolidated through an enterprise resource planning system to facilitate communication among employee teams throughout the entire sales, design, production and delivery process. During fiscal year 2006, we began significant expansion of our facilities and throughput to respond to the increasing customer demands for our products. Prior to that time, substantially all of our products were manufactured in our main facility in Brookings, South Dakota. During fiscal year 2007, we expanded our production facilities in Brookings and brought into service manufacturing capabilities in Sioux Falls, South Dakota and Redwood Falls, Minnesota. We also deployed a limited amount of manufacturing in China. It is expected that for the long term, the majority of our manufacturing will continue to be in Brookings, although other locations now produce a material amount of our products. During fiscal year 2007 we began reorganizing our plants to more closely align them with the five business units described above. This resulted in significant investment in replicating processes which in prior years were centralized. This was extremely important given the rapid growth of the business and the resulting unique needs of our customers in each business unit. Our goal was to align sales, marketing, engineering and manufacturing into a cohesive business unit with a focus on customers while not giving up the synergies of shared resources.
Technical Contracting. We serve as a technical contractor for larger display system installations that require custom designs and innovative product solutions. The purchase of scoreboards and other state-of-the-art display systems for large installations typically involves competitive proposals. As a part of our response to a proposal request, we may suggest additional products or features to assist the prospective customer in analyzing the optimal type of display system. If requested by a customer or if necessary to help secure a bid, we will include as a part of our proposal the work necessary to prepare the site and install the display system. In such cases, we may serve as the general contractor and retain subcontractors. We are licensed in a number of domestic jurisdictions as a general contractor.
Professional Services. Our professional services are essential to continued market penetration and growth. To enhance the level of service available to our customers, we provide maintenance and support services and technical contracting in all of our offices throughout the world. We plan to open other offices in the future to supplement our service capabilities. In addition, we use a network of authorized service companies to service and maintain our products.
Professional services we provide in addition to technical contracting include event support, content
creation, product maintenance, marketing assistance and display rentals. Our creative production staff provides a variety of services to customers, including video content, event support, control room design, on-site training (hardware and software) and continuing technical support for operators of complicated display systems.
Our Daktronics Sports Marketing™ division provides customers with a complete display system, funded in part through value-added marketing services. These marketing services extend beyond the marketing potential of the equipment in the facility to other facility-related components. Typically, these services are limited to facilities that do not have in-house marketing programs and staff.

5
Customer Service and Support. Our prompt and reliable customer service distinguishes us from our competitors. This service includes limited warranties for most of our products against failure due to defective parts or workmanship for periods generally ranging from one to five years after the first sale or installation, depending on the product or type of customer. We also provide help-desk access, parts repair and replacement and programming support for video, animation and other displays. We staff our help desk with experienced technicians who are available on-call 24 hours a day to support events and sites. Our repair center is staffed with trained technicians who promptly repair and return components that require service and we offer a component exchange program for same-day shipment of replacement parts. Our modular approach to the design and production of products enhances our ability to provide effective customer service and support. Customers can attend our training and maintenance seminars held throughout the world, including at our headquarters and can also contract for on-site training and maintenance. Beginning in fiscal year 2007, we began deploying professional and hardware support service personnel in each of our business units so that, like other areas described above, the business unit could better focus on the unique needs of its customers. We maintain a central staff to help coordinate and maximize the synergies between the service groups. General Description of Our Products and Technologies Our display technologies have changed significantly since the mid-1990s when incandescent lamps were the primary display element. Presently, LED and liquid crystal display (“LCD”) technologies are the primary display elements. The invention and availability of the blue and green LED in the mid-1990s, along with the already available red LED, allowed the introduction of full-color video displays using LEDs as the primary colors to form all other colors in the video display. The decreasing costs of LCD components along with the drive for more numerous smaller displays have led to the addition of LCD displays. Finally, driven by customer demand, we have enhanced our video display technology into mobile and modular technologies and high definition capabilities for various applications. We offer primarily LED products across our entire product line. The cost, performance and availability of various LEDs has made them the preferred display element for large displays as compared to alternatives such as incandescent and reflective technologies, most of which are obsolete or unproven. The cost effectiveness, life and performance of LCDs have made them the preferred indoor small display solution. The vast majority of displays we sell today utilize LED technology. The two principal components of many of our systems are the display and the display controller. The display controller uses computer hardware and software to process the information provided by the operator and other integrated sources and then compiles the information, graphics or animation to be presented on the display. Data can be transferred between the display controller and local or remote displays. Local connections may use wire cables, fiber optic cables, infrared links or radio links. Standard and cellular telephone connections and satellite transmissions are used to connect to remote displays. The display controller controls each of the pixels (which are the dots or picture elements that make up the image) on the display to present the message or image.
Most of our display technologies rely on one or more of our software products to manage and provide
content for the display. These software products range in complexity from scoring consoles, to the Venus® 1500 display control software that allows the creation, display and scheduling of dynamic text and basic graphics content on electronic displays and to the Venus® 7000 display control system that controls multi-color displays and video boards, providing the ability to create graphics and animation as well as interfacing with third-party software for content. Additionally, our VisiconnSM control software is used to display targeted messages to specific audiences and to control large networks of digital displays. Complementary software, such as our DakStats® and interfacing software, is also available and can be fully integrated into the control software.
Our display systems range from small scoreboards and digit displays priced at under $1,000 to large complex display systems priced in excess of $20 million. Generally, our product sales are either custom products or standard catalog scoreboards or displays. Historically, these standard catalog sales have accounted for approximately 24% of our total annual revenues. Our custom products are customized in terms of size, configuration and installation type but are generally built using standard technology platforms.

6
Within each product family, we produce both standard and custom displays that vary in complexity, size and resolution. The physical dimensions of a display depend on the size of the viewing area, the distance from the viewer to the display and the amount and type of information to be displayed. Generally, the light source, or pixels, are spaced farther apart for longer distance viewing. The type of the display may also depend on the location of the viewing audience. For example, arena scoreboards may have a viewing angle nearly as wide as 180 degrees, compared with roadside displays, which typically are viewed from a passing vehicle only within a narrow angle from the display. We customize our products according to the design specifications of the customer and the conditions of the environment and setting. Product Families and Technologies
Our products are comprised of the following four major product families: 1. Sport and Theater Products, primarily All Sport®, Tuff Sport® and OmniSport® scoreboards, Vortek®
hoists and related controllers and timing systems; 2. Video Products, primarily ProStar®, ProTour® and ProAd® displays and associated control systems; 3. Commercial Products, primarily Galaxy® displays and Venus® 1500 control systems; and 4. Transportation Products, primarily Vanguard® displays.
Each of these product families is discussed below.
Sport and Theater Products. The Sport and Theater Products family includes a full line of indoor and outdoor scoreboards, timing systems, digit displays, sound systems, statistics software, hoist systems and other related products. The indoor products range in complexity from two-digit shot clocks and small scoreboards to large, center-hung scoreboards incorporating message centers, advertising panels and hoist systems. Outdoor scoreboards range in complexity from two-digit game timers and small scoreboards to large scoring systems incorporating message centers and advertising panels. The sizes of displays can vary significantly depending on the needs of the customer, taking into account such things as viewing angles and spectator distances.
We expect that Sport and Theater Products sales in the future will continue to focus on the use of LED technology due to its lower power consumption, longer life and resulting lower maintenance costs as compared to other technologies. Because most of the products within the Sport and Theater Products group have significant standardization, we have been able to make progress on our goal of delivering the highest quality products while maintaining consistent margins. We offer a variety of internally developed controllers complementing our scoreboards and displays, which vary depending on the type of sport and complexity of the system. These controllers vary in price and complexity from the All Sport® 100, which is a controller for portable scoreboards, to the All Sport® 5000, which is designed for more sophisticated scoring systems, allowing for more user-defined options. These controllers can be interfaced with the scoreboards through radio frequencies, fiber optic connections or other means.
We also offer timing systems for sports events, primarily aquatics and track competitions. These timing systems include our OmniSport® 2000 timing system. The system has the capability to not only time and rank the competitors, but also to interface to event management software created by other third parties to facilitate the administration of the sporting event.
As a key component of an integrated system, we market sports statistics and results software under the
DakStats® trademark. The software allows entry and display of sports statistics and other information displays. It is the leading application of its type in professional, collegiate and high school baseball and other sports.
Vortek® automated rigging systems complement our arena center hung scoreboard/display systems for
both small and large sporting facilities. Additionally, the Vortek® hoist provides automated rigging for theater applications, primarily smaller theaters, such as in high schools and similar venues. The strengths of the Vortek® automated rigging systems include safety and ease of operation. Video Products. The Video Products family consists primarily of displays, which are comprised of a large number of pixels capable of creating various levels of video, graphics and animation and controllers, which manage the operation of the display. Video display products are based on red, green and blue LEDs arranged in

7
various combinations to form pixels or picture elements. The electronic circuitry which controls the pixels allows for variances in the relative brightness of each LED to provide a full color spectrum, thereby displaying video images in striking, vibrant colors. We offer a wide range of video display products for different applications and budgets. Variables in typical video displays include the spacing of the pixels (pixel pitch) the brightness of the displays, the number of discrete colors that the display is able to produce (color resolution) and the viewing angle. In addition, modular design allows the product to be readily configured in custom sizes to meet each customer’s specific requirements, with no maximum to the size of display that can be built. In general, the more pixels and the more color resolution, the better the video image on the display.
Our ProStar® video display systems offer specifications second to none in the industry. At the high end,
the product is capable of producing 4.3 trillion colors and is available with pixel spacing as close as three millimeters. Currently, we offer a wide range of pixel spacing, ranging from three millimeter to 89 millimeter. The three-millimeter application provides the user with the greatest pixel density and shortest viewing distance, spacing and the 89-millimeter is the most cost effective for physically large displays with maximum viewing distances. In addition, the uniformity of colors across the display is important to the quality of the video image. Our unique display control circuitry along with our proprietary manufacturing and calibration procedures provide uniform colors across the display. We have adapted our ProStar® technology into our ProAd® digital advertising and information display system, the ProTour® modular display system, the ProRail® display systems and our ProPixelTM display systems. ProAd® technology uses red, green and blue LED modules configured in different height-to-width ratios to give arena and stadium facilities the ability to install long, narrower bands of displays in various locations in the facility. This application generally serves as a revenue generation source for facilities through advertising as well as a location to display information such as scoring, statistics and video. ProTour® display systems are comprised of lightweight individual modules or panels less than a square meter in size that are assembled together to form a display in a customizable height and width. These panels are focused in what we refer to as the mobile and modular application, such as touring shows and the events market. ProRail® display systems incorporate our ProAd® displays into a patented cabinet designed to serve as a replacement for the fascia of an upper deck in a stadium or arena, which in some cases improves the sight lines of the fans. ProPixel® displays serve as architectural accents and channel lettering. Our main controller for these video displays is our Venus® 7000 controller, which is built on the Windows® operating system. This high-end controller provides advanced capability for controlling large video displays. The V-Play® event management software provides facilities with integrated and sophisticated event program management capabilities with integration to video equipment. It provides instant replays, live action and overlays of information and it allows for the organization and playback of digital video and audio clips. Other video products controllers include the VisiconnSM, V-Tour® and V-Show® controllers. Each of these controllers is designed with unique features and functionality for unique market niches. Our V-Tour® design interfaces between our display systems and other systems allowing, for example, scoreboard and video systems to receive and display information from computers used for statistics, timing or scoring. These interfaces allow the display controller to send information back to a statistics system or customer computer and can automatically report continually updated sports scores and information from national wire services. Commercial Products. The key product lines in the Commercial Products family are our Galaxy® and GalaxyPro® product lines, which include various indoor and outdoor applications intended primarily as graphics and text-based displays. All of the current product offerings within the Commercial Products group use LED technologies. Galaxy® displays, available in both indoor and outdoor models, are our leading product line for commercial applications and are expected to be a key product line for growth in the future. Galaxy® displays are red, amber or full color, with pixel spacing ranging from 7.6 millimeter to 89 millimeter depending on size and viewing distance. They are used primarily as message centers to convey information and advertising to the consumers and the public. This product line has become one of our fastest growing product lines. The modular

8
design of the product allows us to configure a display to readily meet the size requirements of each customer. Within the Galaxy® line, we offer various price points for similar sized displays of the same pixel spacing. GalaxyPro® displays are full-matrix outdoor displays capable of displaying pre-recorded video, text, graphics and animation. GalaxyPro® displays are offered in full color with pixel spacing from 20 millimeter to 34 millimeter. GalaxyPro® displays are capable of producing 68 billion colors, have excellent color uniformity across the display and are fully compatible with our Venus® 1500 display control software. The modular design of the product allows us to configure a display to readily meet the size requirements of each customer. Other product lines within the Commercial Products group include our DataTime®, DataMaster®, DataTrac™, DakTicker® and InfoNet™ displays. The DataTime® product line consists of outdoor time and temperature displays in various character sizes. The DataTime® displays feature a programmable time and temperature display and use a remote sensor for temperature data input. The DataMaster® product line consists of outdoor rate, gas price, generic counting/timing and lottery displays in various character sizes. The DataTime® products are offered in red or amber while the DataMaster® products are offered in red, amber and green. The DataMaster® product line is one of our fastest growing product lines and has very high growth potential in the petroleum market niche. The DataTrac™ product lines consist of indoor LED displays comprised of discrete characters. Each character is spaced evenly horizontally and vertically from the adjacent character. This provides the least expensive display per character for the display of text messages only. DakTicker® displays are used primarily in financial institutions for ticker displays and to display other financial information. The InfoNet™ product line includes line-oriented displays for indoor use that are available as single or multi-line units. All DataTrac™, DakTicker® and InfoNet™ products have a controller in the display that is capable of receiving a downloaded display program and then operating independently to display that program until a new program is downloaded to it. The majority of our Commercial Products group’s products utilize our proprietary Venus® 1500 display control software to control the creation of messages and graphic sequences for downloading to the display. This software is designed to be useable without any special training and it is applicable to all general advertising or message presentation applications. We also provide software that allows OEM customers (system integrators) to write their own software using the Venus® 1500 software developer’s kit to communicate to displays supplied by us. Several system integrators have implemented the Venus® 1500 protocol into their specific applications, resulting in additional display sales. Transportation Products. The Transportation Products family includes a wide range of LED-based products for road management, parking, mass transit and aviation applications. The Vanguard® family of electronic displays, which lead transportation product sales, are typically used to direct traffic and inform motorists. The Vanguard® line includes both permanently mounted and portable displays. We have also developed a software control system for these displays to help transportation agencies manage large networks of displays. Our digit and directional displays are primarily marketed under the DataMaster® name and sold for use in parking facilities. Several of the transportation products are also routinely sold into our commercial and sports markets. Most of the transportation products are designed and tested to rigorous transportation industry standards. Our personnel routinely work with standards development organizations to assist in writing standards that benefit the public and take advantage of the latest display technologies. Sources of Raw Materials We source some of our raw materials, including LEDs, from a limited number of suppliers. We do so because of the high level of quality we require. The loss of any single supplier, however, would not have a material effect on us. In addition, to reduce our inventories and enhance product quality, we limit our suppliers to those who are willing to provide components on an “as needed” basis. From time to time, we enter into pricing

9
agreements or purchasing contracts under which we agree to purchase a minimum amount of product in exchange for guaranteed price terms over the length of the contract, which generally does not exceed one year. Intellectual Property We develop patentable technology on a continuing basis. We hold a number of U.S. and foreign patents and have a number of patent applications pending. The patents pertain primarily to our display technologies and product features. We rely on trademarks, in addition to patents, to help establish and preserve limited proprietary protection for our products. Our trademarks are registered in the United States and several other countries. We also have numerous trademark applications pending. These trademarks are used to establish brand recognition and distinction in our various markets. Product drawings, software and other works of authorship are also subject to applicable copyright law protections. We provide software to our customers in object code to help preserve our intellectual rights. We also rely on nondisclosure and license agreements with our employees. Despite these intellectual property protections, there can be no assurance that a competitor will not copy the functions or features of our products. Seasonal Nature of the Business Our sales and profitability historically have fluctuated due to the impact of large product orders, such as display systems for facilities where professional and major college sports events take place and large commercial systems and networks. The seasonality of the sports market has also played a part in our sales and profit fluctuations. As a result, sales and net income in the first and second quarters of a fiscal year tend to be higher than in the third quarter of that fiscal year, followed by higher levels in the fourth quarter, leading into the first quarter of the following year. This seasonality is caused by sales related to facilities for football and other fall sports in the summer and early fall, followed by sales generally related to facilities for basketball and hockey in the fall and finally facilities for baseball and other spring and summer sports in the early to late spring. This seasonal effect is generally compounded by large product orders in the sports markets and by the effects of holidays during the third quarter. The effects of seasonality not related to holidays are generally not found in our commercial and transportation markets, although the impact of large orders in those markets can cause significant fluctuations in sales and profits. We believe that with the mix of business favoring more emphasis on outdoor advertising applications, we could see more seasonality in the commercial business unit in the future, with sales slowing in our winter months. Approximately 54% of our orders are in the sports markets, 39% percent are in the commercial market and the remaining approximately 7% are in transportation. Gross margins on large orders tend to fluctuate more than the gross margins on smaller, standard orders. Large product orders that involve competitive bidding and substantial subcontract work for product installation generally have lower gross margins with greater variability in margins. Although we follow the percentage of completion method of recognizing revenues for these larger orders, we nevertheless have experienced fluctuations in operating results and expect that our future results of operations will be subject to similar fluctuations. Working Capital Items On large product orders, the time between order acceptance and project completion may extend up to and exceed 18 months depending on the amount of custom work and the customer’s delivery needs. We often receive down payments or progress payments on these orders. To the extent that these payments are not sufficient to fund the costs and expenses associated with these orders, we use working capital and bank borrowings to finance these cash requirements.

10
Customers
The primary markets we serve, along with types of customers, are as follows: Markets Types of Customers
Large Sports Venues Large colleges and universities, professional sports teams and facilities, Olympic games, national and international sports federations, civic arenas and convention centers and motor racing.
Schools and Theaters Elementary and secondary schools, small colleges and universities, local recreation centers and theaters, primarily high school.
Commercial Retailers, outdoor advertisers, hospitality providers, quick-serve restaurants, financial institutions, casinos, pari-mutuel racing and other similar businesses.
Transportation State and local departments of transportation, airlines, airports and related industries, parking facilities and transit authorities.
We have a large and diverse customer base. As a result, the loss of a major customer would not have an adverse impact on us. One customer accounted for approximately 10% of our revenue in fiscal year 2007. Backlog Our backlog consists of customer sales agreements or purchase orders that we expect to fill within the next 24 months and was approximately $127 million as of April 28, 2007 and $93 million as of April 29, 2006. Because sales agreements and purchase orders are typically subject to cancellation or delay by customers with a limited or no penalty, our backlog is not necessarily indicative of future net sales or net income. Although orders for many of our products may be shipped within 90 days, other orders may take longer depending on the customer’s project schedule or other factors. Government and Other Regulation In the United States and other countries, various laws and regulations, including zoning ordinances, restrict the installation of outdoor signs and displays, particularly in the commercial market. These laws and regulations include those that impose greater restrictions on electronic displays due to alleged concerns over aesthetics or driver safety if a display is located near a road or highway. These factors may prevent or inhibit us from selling products to some prospective customers. Some of our products are tested to safety standards developed by Underwriters Laboratories® in the United States, as well as similar standards in other countries. We design and produce our products in accordance with these standards. Our printed circuit board manufacturing operations use certain chemical processes that are subject to various environmental rules and regulations. Our manufacturing operations must also meet various safety related rules and regulations. We believe we are in compliance with all applicable governmental laws and regulations. In some countries we operate in, including primarily China, there are various laws and regulations that restrict or limit our ability to withdraw our capital investment. Competition The large electronic display industry is highly fragmented and characterized by intense competition from a variety of sources. There are a number of established manufacturers of competing products who may have greater market penetration in certain market niches or greater financial, marketing and other resources. Competitors might also attempt to copy our products or product features. Because a customer’s budget for the purchase of a large screen electronic display is often part of that customer’s advertising budget, we may also compete with other forms of advertising, such as television, print media or fixed display signs. Many of our competitors compete in only one or a few of the market niches or product categories we serve. There are generally more competitors in markets that require less complicated display systems, such as the high school scoreboard market and the text and graphics display markets, including displays in banks and

11
small retail stores. As the needs of customers increase and the display systems become more complex, there are generally fewer competitors. However, due to the high profile nature of larger complex display systems, the competition may be more intense. Over the past five years, we have experienced significant changes in our competitive landscape and expect that more changes could occur in the future. These changes included consolidation of competitors, unsustainable pricing pressures from competitors and various other factors. Although these changes have an impact on the market as a whole, we are confident that we can continue to grow and expand our business because of our experience and approach to the market. We compete based on our broad range of products and features, complementary services, advanced technology, prompt delivery and reliable and readily available customer service and support. We also strive to provide cost-effective products and solutions for our customers. Contrary to our focus on technologically advanced products and customer support, some of our competitors compete in some markets by providing lower-cost display systems, which are of a lesser quality with lower product performance or less customer support. If a customer focuses principally on price, we are less likely to obtain the sale. To remain competitive, we must continue to enhance our existing products, introduce new products and product features and provide customers with cost effective solutions to their display needs. Research and Development We believe our engineering capability and experience are unparalleled among our competitors and that our product development capability will continue to be a very important factor in our market position. Product development expenses for fiscal years 2007, 2006 and 2005 were approximately $15.6 million, $11.2 million and $10.5 million, respectively. Environmental Concerns We believe that we do not have any environmental issues that would materially affect capital expenditures, earnings or our competitive position in the marketplace. Employees As of April 28, 2007, we employed approximately 2,300 full-time employees and approximately 900 part-time and temporary employees. Of these employees, approximately 1,200 were in manufacturing, 1,300 were in sales, marketing and customer service, 400 were in engineering and 300 were in administration. None of our employees are represented by a collective bargaining agreement. We believe employee relations are good. Financial Information About Geographic Areas
See Note 1 of the Consolidated Financial Statements for financial data pertaining to our geographic operations.
Available Information
We make available, free of charge, on or through our website (http://investor.daktronics.com), our annual, quarterly and current reports and any amendments to those reports as soon as reasonably practicable after electronically filing such reports with the Securities and Exchange Commission (“SEC.”) The reports are also available through a link to the Commission’s website at http://www.sec.gov. Information contained on our website or linked through it is not part of this report.

12
Directors and Executive Officers of the Registrant
The following sets forth information regarding our officers and directors as of June 23, 2007:
NAME AGE POSITIONAelred J. Kurtenbach 73 Chairman of the BoardJames B. Morgan 60 President, Chief Executive Officer and DirectorWilliam R. Retterath 46 Chief Financial Officer and TreasurerReece A. Kurtenbach 42 Vice President, Live EventsBradley T. Wiemann 44 Vice President, Commercial and Transportation
Aelred J. Kurtenbach, Ph.D. is a co-founder of the Company and has served as a Director and Chairman of the Board since its incorporation. He also served as President of the Company from 1969 until 1999, Chief Executive Officer from 1999 until 2001 and Treasurer from 1972 until 1993. Dr. Kurtenbach holds B.S., M.S. and Ph.D. degrees in electrical engineering from the South Dakota School of Mines and Technology, the University of Nebraska and Purdue University, respectively. James B. Morgan joined the Company in 1969 as a part-time engineer while earning his M.S. degree in electrical engineering from South Dakota State University. Mr. Morgan became our President and Chief Operating Officer in 1999 and Chief Executive Officer in 2001. He served as its Vice President, Engineering, from 1976 to 1999 with responsibility for product development, contract design, project management and corporate information systems. Mr. Morgan has also served as a Director of the Company since 1984. William R. Retterath joined the Company in 2001 as Chief Financial Officer and Treasurer. During 2001, before joining the Company, Mr. Retterath served as the Chief Financial Officer of MQSoftware, Inc. and from 1999 through 2000, he was a Vice President of Finance for Computer Associates, Inc. through its acquisition of Sterling Software Inc. Prior to that time, Mr. Retterath served as the Chief Financial Officer for various public and private companies and worked for a number of years with Deloitte & Touche LLP. Mr. Retterath holds a B.S. in accounting from the University of Minnesota.
Reece A. Kurtenbach joined the Company in 1991 as an applications engineer on large display projects. In 1994, he became the manager of what is today our video products engineering group and, in 2004, was appointed Vice President, Video Systems. In 2007, he was named Vice President, Live Events and International business units. Mr. Kurtenbach received a B.S. degree from South Dakota State University in electrical engineering, with minors in math and computer science. Mr. Kurtenbach is the son of Aelred Kurtenbach.
Bradley T. Wiemann joined the Company in 1993 as an engineer focusing in our commercial and transportation products after spending a number of years with Rockwell International, where he was involved in flight control systems. In 2004, he was appointed Vice President, Commercial and Transportation Markets of the Company, which is an area where he has provided leadership for a number of years and in 2007 was named Vice President, Commercial and Transportation business units. Mr. Wiemann holds an M.S. degree in electrical and computer engineering from the University of Iowa and a B.S. degree in electrical engineering from South Dakota State University. Item 1A. RISK FACTORS A number of risks and uncertainties exist which could impact our future operating results. These uncertainties include, but are not limited to, general economic conditions, competition, our success in developing new products and technologies, market acceptance of new products and other factors, including those set forth below.
Competition could result in lower sales and decreased margins. We operate in highly competitive
markets that, in certain portions of the business, are highly fragmented. In addition, because a customer’s budget for the purchase of an electronic display is often part of that customer’s advertising budget, our products often compete with other forms of advertising, such as television, print media or fixed display signs. Competition could result in not only a reduction in net sales but also in the prices charged by us for our products. To remain competitive, we must be able to not only anticipate and respond quickly to our customers’ needs and enhance

13
and upgrade our existing products and services to meet those needs but also continue to price our products competitively. Our competitors may develop cheaper, more efficient products or may be willing to charge lower prices for strategic marketing or to increase market share. Some competitors have more capital and other resources than we do and may be better able to take advantage of acquisition opportunities or adapt more quickly to changes in customer requirements.
Our business may suffer if we are not successful in our efforts to keep up with a rapidly changing product market. The electronic display industry is characterized by ongoing product improvement, innovations and developments in display and controller technology. Competitors could develop new or superior products to increase their share of the markets. Our future success in addressing the needs of our customers will depend in part on our ability to continue to make timely and cost-effective product improvements, innovations and developments.
We enter into fixed-priced contracts on a regular basis. If our actual costs exceed original estimates on
fixed-price contracts, our profits will be reduced. The majority of contracts we enter into are on a fixed-price basis. Although we benefit from cost savings, we have a limited ability to recover cost overruns. Because of the large scale and long duration of some contracts, unanticipated cost increases may occur as a result of several factors including, but not limited to, increases in the cost or shortages of components, materials or labor; unanticipated technical problems; required project modifications not initiated by the customer; and suppliers’ or subcontractors’ failure to perform or a delay in performing their obligations. These factors could delay delivery of products and contracts may provide for liquidated damages for late delivery. Unanticipated costs that cannot be passed on to customers or the payment of liquidated damages under fixed contracts would negatively impact our profits.
Backlog may not be indicative of future revenue. Customers may cancel or delay projects for reasons beyond our control. Orders normally contain cancellation provisions that permit the recovery of costs expended and a portion of the anticipated profit if a customer cancels an order. If a customer elects to cancel, we may not realize the full amount of revenues included in our backlog. If projects are delayed, the timing of revenues could be affected and projects may remain in the backlog for extended periods of time. Revenue recognition occurs over longer periods of time and is subject to unanticipated delays. If we receive relatively large orders in any given quarter, fluctuations in the levels of the quarterly backlog can result because the backlog in that quarter may reach levels that may not be sustained in subsequent quarters. For these reasons, backlog may not be indicative of future revenues.
Our ability to conduct business outside the United States may be adversely affected by factors outside of our control which could adversely affect net sales and profits from international sales. For fiscal year 2006, revenue outside the United States represented approximately 10% of our consolidated net sales. Our operations and earnings throughout the world have been and may in the future be, affected from time to time in varying degrees by war, political developments, foreign laws and regulations, regional economic uncertainty, political instability, restrictions, customs and tariffs, changing regulatory environments, fluctuations in foreign currency exchange rates and adverse tax consequences. The likelihood of such occurrences and their overall effect on us vary greatly from country to country and are not predictable. These factors may result in a decline in net sales or profitability and could adversely affect our ability to expand our business outside of the United States.
Our financial performance may vary significantly from quarter to quarter, making it difficult to estimate future revenue. Our quarterly revenues and earnings have varied in the past and are likely to vary in the future. Contracts we enter into generally stipulate customer-specific delivery terms and may have contract cycles of a year or more, which subjects them to many factors beyond our control. Furthermore, because significant portions of our operating costs are fixed, an unanticipated delay or cancellation of orders in backlog may have a significant negative impact on our quarterly operating results. Therefore, quarterly operating results may be subject to significant variations and operating performance in one quarter may not be indicative of future performance.
Our products are covered by warranties. Unanticipated warranty and other costs for defective products could adversely affect our financial condition and results of operations and reputation. We provide warranties on our products generally for terms of five years or less in the case of standard products and one year or less in the case of custom orders. In addition, in response to customer needs, we regularly offer extended warranties. These warranties require us to repair or replace faulty products and meet certain performance standards, among other customary warranty provisions. Although we continually monitor our warranty claims and provide a reserve for

14
estimated warranty issues on an on-going basis, an unanticipated claim could have a material adverse impact on operations. In some cases, we may be able to subrogate a claim back to a subcontractor or supplier if the subcontractor or supplier supplied the defective product or performed the service, but this may not always be possible. The need to repair or replace products with design or manufacturing defects could temporarily delay the sale of new products, reduce profits and adversely affect our reputation.
Product liability claims not covered by insurance could adversely affect our financial condition and results of operations. We may be subject to product liability claims involving claims of personal injury or property damage. Although we maintain product liability insurance coverage to protect us in the event of such a claim, our coverage may not be adequate to cover the cost of defense and the potential award. Also, a well-publicized actual or perceived problem could adversely affect our reputation and reduce the demand for our products.
Large contracts with significant customers represent a significant portion of our accounts receivable and costs and estimated earnings in excess of billings. We closely monitor the credit worthiness of our customers and have not, to date, experienced significant credit losses. Significant portions of our sales are to customers who place large orders for custom products. We mitigate our exposure to credit risk, to some extent, by requiring deposits, payments prior to shipment, progress payments and letters of credit. However, because some of the exposure is outside of our control, unanticipated events could have a material adverse impact on our operating results.
The amounts of our orders and net sales and our financial results will be substantially affected by whether
we are awarded large contracts and the size and timing of large contracts. The amounts of our orders and net sales and our financial results will be substantially affected by whether we are awarded large contracts, primarily in the professional and major college facilities market and the outdoor advertising niche, and the amounts and timing of these contracts. Whether we are awarded large contracts and their timing and amount could also cause material fluctuations in our net sales and earnings. Awards of large contracts and their timing and amount are difficult to predict and are outside of our control.
The terms and conditions of our credit facility impose restrictions on our operations and we may not be
able to raise additional capital, if needed. The terms and conditions of our $45 million revolving credit facility impose restrictions that limit, among other things, our ability to incur debt, merge, sell assets, make distributions and create or incur liens. The availability of the credit facility is also subject to certain covenants as explained later in “Item 7 – Management’s Discussion and Analysis of Financial Condition and Results of Operations.” Our ability to comply with the covenants may be affected by events beyond our control and we cannot assure that we will achieve operating results meeting the requirements of the credit facility. A breach of any of these covenants could result in a default under the credit facility. In the event of a default, the bank could elect to declare any outstanding principal amount of the credit facility and term debt, any and all accrued interest thereon and any and all other amounts payable under the credit facility, to be immediately due and payable. As of April 28, 2007, we were in compliance with all financial and other covenants of our credit facility.
Our ability to satisfy any debt obligations will depend upon our future operating performance, which will be affected by prevailing economic, financial and business conditions and other factors, some of which are beyond our control. It is anticipated that borrowings from the existing credit facility and cash provided by operating activities should provide sufficient funds to finance capital expenditures, working capital and otherwise meet operating expenses and debt service requirements as they become due. However, if additional capital is required, there can be no assurance that we will be able to raise such capital when needed or on satisfactory terms, if at all.
Our business is partially subject to risks of terrorist acts and, to a lesser degree, acts of war. Terrorist acts and, to a lesser degree, acts of war may disrupt our operations as well as the operations of our customers. Such acts have created an interruption of orders and delays in orders already booked primarily in sports facilities and destination sites. Any future terrorist activities and, to a lesser degree, acts of war, could create additional uncertainties forcing customers to further reduce or delay their spending or cancel or delay already planned projects, which could have a material adverse impact on our business, operating results and financial condition.
Our common stock has at times been thinly traded, which may result in low liquidity and price volatility. The daily trading volume of our common stock has at times been relatively low. If this were to occur in the future, the liquidity and appreciation of our common stock may not meet shareholders’ expectations and the prices at which it trades may be volatile. The market price of our common stock could be adversely impacted as a result of

15
sales by existing shareholders of a large number of shares of common stock in the market or by the perception that such sales could occur.
We may fail to continue to attract, develop and retain key management and other key employees,
including technical engineering talent, which could negatively impact our operating results. We depend on the performance of our senior management team and other key employees. The loss of certain members of our senior management, including our Chief Executive Officer, could negatively impact our operating results and ability to execute our business strategy. Our future success will also depend in part upon our ability to attract, train, motivate and retain qualified personnel. We do not have employment agreements with the executive officers or other employees, but we do maintain key person life insurance on the lives of our Chairman of the Board and our Chief Executive Officer.
Provisions in our charter documents and under South Dakota law and our shareholder rights agreement might deter acquisition bids for us. There are provisions in our charter and other provisions under South Dakota law that could make it more difficult for a third party to acquire us, even if doing so would benefit our shareholders. Our articles of incorporation provide for a classified board consisting of three classes of directors. A classified board generally makes it more difficult to replace directors and to acquire our company. In addition, we are governed by the provisions of the current South Dakota Business Corporation Act (“SD Act”), which may deny shareholders the receipt of a premium on their common stock, which in turn have a depressive effect on the market price of the common stock. In general, shares of a corporation acquired in a “control share acquisition,” as defined in the SD Act, have no rights unless voting rights are approved in a prescribed manner. There are also provisions that prohibit a public South Dakota corporation from engaging in a “business combination,” as defined in the SD Act, with an “interested shareholder,” as defined in the SD Act, for a period of four years after the date of the transaction in which the person became an interested shareholder unless the business combination is approved in a prescribed manner. In addition, we have adopted a shareholder rights agreement designed to protect against unsolicited attempts to acquire our company.
We may be unable to protect our intellectual property rights. We rely on a variety of intellectual property rights that we use in our products and services. We may not be able to successfully preserve these intellectual property rights in the future and these rights could be invalidated, circumvented or challenged. In addition, the laws of some foreign countries in which our products and services have been or may be sold do not protect intellectual property rights to the same extent as the laws of the United States. A failure to protect proprietary information and any successful intellectual property challenges or infringement proceedings against us could materially and adversely affect our competitive position. In addition, even if we are successful in protecting our intellectual property rights or defending ourselves against a claim of infringement, any related dispute or litigation could be costly and time-consuming. We maintain inventory that is subject to obsolescence and write downs to the extent it is replaced through product enhancements or advances in technology. As a result of our products being subject to continuous enhancements and design changes, inventory held by us is subject to the risk of obsolescence and excess levels that may not be saleable. Losses incurred as a result could have a material impact on our future profits. Item 1B. UNRESOLVED STAFF COMMENTS None. Item 2. PROPERTIES We currently own and occupy a total of approximately 1,000,000 square feet of space located in Brookings, South Dakota. We also own and occupy approximately 33,000 square feet of office space and production facilities in Clearwarter, Florida, approximately 100,000 square feet of primarily manufacturing space in Redwood Falls, Minnesota and approximately 120,000 square feet of primarily manufacturing space in Sioux Falls, South Dakota. Star Circuits, Inc. is located at a separate site in Brookings and occupies approximately 20,000 square feet in a facility owned by that subsidiary. Daktronics Canada, Inc. occupies approximately 21,000 square feet in a sales and manufacturing facility in Montreal, Quebec under a lease agreement. The majority of our sales and service offices located throughout the United States, Europe and China are small offices, generally consisting of less than 10,000 square feet leased under operating leases.

16
Item 3. LEGAL PROCEEDINGS We are involved in a variety of legal actions relating to various legal matters that arise in the normal course of business. Although we are unable to predict the ultimate outcome of these legal actions, it is the opinion of management that the disposition of these matters will not have a material adverse effect on our consolidated financial statements taken as a whole. Item 4. SUBMISSION OF MATTERS TO A VOTE OF SECURITY HOLDERS No matters were submitted to a vote of shareholders through a solicitation of proxies or otherwise during the fourth quarter of fiscal 2007. PART II
Item 5. MARKET FOR REGISTRANT’S COMMON EQUITY, RELATED STOCKHOLDER MATTERS AND ISSUER PURCHASES OF EQUITY SECURITIES Our common stock currently is quoted on The NASDAQ Global Market under the symbol “DAKT.” As of June 4, 2007, we had 495 shareholders of record. Following are the high and low sales prices for our common stock for each quarter within the last two fiscal years. All amounts have been adjusted for the two-for-one stock split declared by the Board of Directors on May 25, 2006.
High Low High Low1st Quarter 30.46$ 18.95$ 11.88$ 9.73$ 2nd Quarter 31.14$ 18.31$ 12.13$ 9.60$ 3rd Quarter 40.05$ 22.47$ 16.26$ 10.64$ 4th Quarter 39.50$ 21.62$ 21.28$ 13.86$
Fiscal Year 2007 Fiscal Year 2006
On May 24, 2007, our Board of Directors declared an annual dividend payment of $0.07 per share on our common stock for the fiscal year ended April 28, 2007. On May 25, 2006, our Board of Directors approved a two-for-one stock split of our common stock in the form of a stock dividend. Stockholders of record at the close of business on June 8, 2006 received one additional share for each share of common stock on that date of record. Our stock began trading on the split-adjusted basis on June 23, 2006. On that same date, our Board also declared an annual dividend payment of $.06 per share (as adjusted for the two-for-one stock split declared by the Board of Directors on May 25, 2006) on our common stock for the fiscal year ended April 29, 2006. Although we expect to continue to pay annual dividends for the foreseeable future, any and all subsequent dividends will be reviewed annually and determined and declared by the Board in its discretion. In addition, our credit facility imposes limitations on our ability to pay dividends. Performance Evaluation The following graph shows changes during the period from April 28, 2002 to April 28, 2007 in the value of $100 invested in: (1) our common stock; (2) The NASDAQ Stock Market Index for U.S. companies; and (3) the Standard and Poor's 600 Index for Electronic Equipment Manufacturers. The values of each investment as of the dates indicated are based on share prices plus any dividends in cash, with the dividends reinvested on the date they were paid. The calculations exclude trading commissions and taxes.

17
COMPARISON OF CUMULATIVE FIVE YEAR TOTAL RETURN
$0
$50
$100
$150
$200
$250
$300
$350
$400
$450
$500
$550
4/27/2002 5/3/2003 5/1/2004 4/30/2005 4/29/2006 4/28/2007
DAKTRONICS INC
NASDAQ U.S. INDEX
S&P 600 ELECTRONIC EQUIPMENT MANUFACTURERS
Item 6. SELECTED FINANCIAL DATA (in thousands, except per share data) The table below provides selected historical financial data, which should be read in conjunction with the financial statements and the notes to the financial statements and “Item 7 – Management’s Discussion and Analysis of Financial Condition and Results of Operations,” which are included elsewhere in this report. The statement of operations data for the fiscal years ended April 28, 2007, April 29, 2006 and April 30, 2005 and the balance sheet data at April 28, 2007 and April 29, 2006 are derived from and are qualified by reference to, the audited financial statements included elsewhere in this report. The statement of income data for the fiscal years ended May 1, 2004 and May 3, 2003 and the balance sheet data at April 30, 2005, May 1, 2004 and May 3, 2003 are derived from audited financial statements not included in this report.
2007 2006 2005 2004 2003Income Statement Data:
Net sales 433,201$ 309,370$ 230,346$ 209,907$ 177,764$ Operating income 36,915 31,815 19,436 27,530 19,825 Net income 24,427 20,961 15,660 17,727 12,458 Diluted earnings per share* 0.59 0.52 0.39 0.44 0.32
Weighted average diluted shares outstanding* 41,311 40,506 40,274 39,872 39,030
Balance Sheet Data:Working capital 44,904$ 74,930$ 62,287$ 51,681$ 39,700$ Total assets 265,850 199,231 151,462 126,236 102,527 Long-term liabilities 9,060 6,253 5,556 4,675 8,083 Shareholders' equity 153,708 125,345 103,910 86,264 65,303 Cash dividend per share* 0.06 0.05 - - -
___________________________ *Amounts have been adjusted for the two-for-one stock split approved on May 25, 2006.

18
Item 7. MANAGEMENT’S DISCUSSION AND ANALYSIS OF FINANCIAL CONDITION AND RESULTS OF OPERATIONS The following discussion highlights the principal factors affecting changes in our financial condition and results of operations. This discussion should be read in conjunction with the accompanying consolidated financial statements and notes to consolidated financial statements. OVERVIEW We design, manufacture and sell a wide range of display systems to customers in a variety of markets throughout the world. We focus our sales and marketing efforts on geographical regions, markets and products. The primary categories of markets are the sports, commercial and transportation markets. Our net sales and profitability historically have fluctuated due to the impact of large product orders, such as display systems for professional sport facilities and colleges and universities, as well as the seasonality of the sports market. Net sales and gross profit percentages also have fluctuated due to other seasonality factors including the impact of holidays, which primarily impact our third quarter. Our gross margins on large product orders tend to fluctuate more than those for smaller standard orders. Large product orders that involve competitive bidding and substantial subcontract work for product installation generally have lower gross margins. Although we follow the percentage of completion method of recognizing revenues for large custom orders, we nevertheless have experienced fluctuations in operating results and expect that our future results of operations may be subject to similar fluctuations. Orders are booked only upon receipt of a firm contract and, depending on terms, only after receipt of any required deposits related to the order. As a result, certain orders for which we have received binding letters of intent or contracts will not be booked until all required contractual documents and deposits are received. In addition, order bookings can vary significantly as a result of the timing of large orders. We operate on a 52 to 53 week fiscal year, with fiscal years ending on the Saturday closest to April 30 of each year. Fiscal years 2007, 2006 and 2005 each contained 52 weeks. For a summary of recently issued accounting pronouncements and the effects of those pronouncements on our financial results, refer to Note 1 of the notes to our consolidated financial statements or the section of this Item 7 entitled “Recent Accounting Pronouncements,” which are included elsewhere in this report. CRITICAL ACCOUNTING POLICIES AND ESTIMATES The following discussion and analysis of financial condition and results of operations are based upon our consolidated financial statements, which have been prepared in accordance with accounting principles generally accepted in the United States of America. The preparation of these financial statements requires us to make estimates and judgments that affect the reported amounts of assets, liabilities, revenues and expenses and related disclosure of contingent assets and liabilities. On a regular basis, we evaluate our estimates, including those related to estimated total costs on long-term contracts, estimated costs to be incurred for product warranties and extended maintenance contracts, bad debts, excess and obsolete inventory, income taxes, stock-based compensation and contingencies. Our estimates are based on historical experience and on various other assumptions that are believed to be reasonable under the circumstances, the results of which form the basis for making judgments about the carrying values of assets and liabilities that are not readily apparent from other sources. Actual results may differ from these estimates under different assumptions or conditions. We believe the following critical accounting policies require significant judgments and estimates in the preparation of our consolidated financial statements:
Revenue recognition on long-term contracts. Earnings on long-term contracts are recognized on the percentage-of-completion method, measured by the percentage of costs incurred to date to estimated total costs for each contract. Provisions for estimated losses on uncompleted contracts are made in the period in which such losses are capable of being estimated. Generally, contracts we enter into have fixed prices established and to the extent the actual costs to complete contracts are higher than the amounts estimated as of the date of the financial statements, the resulting gross margin would be negatively affected in future quarters when we revise our

19
estimates. Our practice is to revise estimates as soon as such changes in estimates are known. We do not believe there is a reasonable likelihood that there will be a material change in future estimates or assumptions we use to determine these estimates.
Allowance for doubtful accounts. We maintain an allowance for doubtful accounts for estimated losses resulting from the inability of our customers to make required payments. If the financial condition of our customers were to deteriorate, resulting in an impairment of their ability to make payments, additional allowances may be required. To identify impairment in the customer’s ability to pay, we review aging reports, contact customers in connection with collection efforts and review other available information. Although we consider our allowance for doubtful accounts adequate, if the financial condition of our customers were to deteriorate and impair their ability to make payments to us, additional allowances may be required in future periods. We do not believe there is a reasonable likelihood that there will be a material change in the future estimates or assumptions we use to determine the allowance for doubtful accounts. As of April 28, 2007 and April 29, 2006, we had an allowance for doubtful accounts balance of $1.6 million and $1.4 million, respectively. Warranties. We have created a reserve for warranties on our products equal to our estimate of the actual costs to be incurred in connection with our performance under the warranties. Generally, estimates are based on historical experience taking into account known or expected changes. If we would become aware of an increase in our warranty reserves, additional reserves may become necessary, resulting in an increase in costs of goods sold. We do not believe there is a reasonable likelihood that there will be a material change in the future estimates or assumptions we use to determine our reserve for warranties. As of April 28, 2007 and April 29, 2006, we had $10.5 million and $8.1 million reserved for warranty costs, respectively. Extended warranty and product maintenance. We have deferred revenue related to separately priced extended warranty and product maintenance agreements. The deferred revenue is recognized ratably over the contractual term. If we would become aware of an increase in our estimated costs under these agreements in excess of our deferred revenue, additional reserves may be necessary, resulting in an increase in costs of goods sold. In determining if additional reserves are necessary, we examine cost trends on the contracts and other information and compare that to the deferred revenue. We do not believe there is a reasonable likelihood that there will be a material change in the future estimates or assumptions we use to determine estimated costs under these agreements. As of April 28, 2007 and April 29, 2006, we had $5.3 million and $4.1 million of deferred revenue related to separately priced extended warranty and product maintenance, respectively. Inventory. Inventories are stated at the lower of cost or market. Market refers to the current replacement cost, except that market may not exceed the net realizable value (that is, estimated selling price in the ordinary course of business less reasonable predictable costs of completion and disposal) and market is not less than the net realizable value reduced by an allowance for normal profit margins. In valuing inventory, we estimate market value where it is believed to be the lower of cost or market and any necessary charges are charged to costs of goods sold in the period in which it occurs. In determining market value, we review various factors such as current inventory levels, forecasted demand and technological obsolescence. We do not believe there is a reasonable likelihood that there will be a material change in the future estimates or assumptions we use to calculate the estimated market value of inventory. However, if market conditions change, including changes in technology, product components used in our products or in expected sales, we may be exposed to losses or gains that could be material. Income taxes. As part of the process of preparing our consolidated financial statements, we are required to estimate our income taxes in each of the jurisdictions in which we operate. This process involves estimating the actual current tax expense as well as assessing temporary differences in the treatment of items for tax and accounting purposes. These timing differences result in deferred tax assets and liabilities, which are included in our consolidated balance sheets. We must then assess the likelihood that our deferred tax assets will be recovered from future taxable income in each jurisdiction and to the extent we believe that recovery is not likely, a valuation allowance must be established. We review deferred tax assets, including net operating losses and for those not expecting to be realized, we have created a valuation allowance. If our estimates of future taxable income are not met, a valuation allowance for some of these deferred tax assets would be required. We operate within multiple taxing jurisdictions, both domestic and international and are subject to audits in these jurisdictions. These audits can involve complex issues, including challenges regarding the timing and amount of deductions and the allocation of income amounts to various tax jurisdictions. At any one time, multiple

20
tax years are subject to audit by various tax authorities. The United States Internal Revenue Service (IRS) recently completed the process of examining our U.S. federal tax returns for fiscal years 2002 through 2005. We record our income tax provision based on our knowledge of all relevant facts and circumstances, including the existing tax laws, the status of current IRS examinations and our understanding of how the tax authorities view certain relevant industry and commercial matters. In evaluating the exposures associated with our various tax filing positions, we record reserves for probable exposures. A number of years may elapse before a particular matter for which we have established a reserve is audited and fully resolved or clarified. We adjust our tax contingencies reserve and income tax provision in the period in which actual results of a settlement with tax authorities differs from our established reserve, when the statue of limitations expires for the relevant taxing authority to examine the tax position, or when more information become available. Our tax contingencies reserve contains uncertainties because management is required to make assumptions and to apply judgment to estimate the exposure associated with our various filing positions. We believe that any potential tax assessments from various tax authorities that are not covered by our income tax provision will not have a material adverse impact on our consolidated financial position or cash flow. Some of the countries we are located in allow tax holidays or provide other tax incentives to attract and retain business. We have obtained holidays or other incentives where available and practicable. Our taxes could increase if certain tax holidays or incentives are retracted (which in some cases could occur if we fail to satisfy the conditions on which such holidays or incentives are based), or if they are not renewed upon expiration, or tax rates applicable to us in such jurisdictions are otherwise increased. It is anticipated that tax incentives with respect to certain operations will expire within the next four years. However, due to the possibility of changes in existing tax law and our operations, we are unable to predict how these expirations will impact us in the future. In addition, acquisitions may cause our effective tax rate to increase, depending on the jurisdictions in which the acquired operations are located. Stock-based compensation: Effective April 30, 2006, we adopted the fair value recognition provisions of Statement of Financial Accounting Standard (“SFAS”) No. 123(R), using the modified prospective transition method. Under that transition method, we recognized compensation expense for share-based payments that vested during the twelve months ended April 28, 2007 using the following valuation methods: (a) for share-based payments granted prior to but not yet vested as of April 30, 2006, the grant date fair value was estimated in accordance with the original provisions of SFAS No. 123 and (b) for share-based payments granted on or after April 30, 2006, the grant date fair value was estimated in accordance with the provisions of SFAS No. 123(R.) Because we elected to use the modified prospective transition method, results for prior periods have not been restated. In March 2005, the Securities and Exchange Commission issued Staff Accounting Bulletin (SAB) No. 107, “Share-Based Payment,” which provides supplemental implementation guidance for SFAS No. 123(R.) We have applied the provisions of SAB No. 107 in our adoption of SFAS No. 123(R.) See Note 9 of the notes to our consolidated financial statements for information on the impact of our adoption of SFAS No. 123(R) and the assumptions we use to calculate the fair value of share-based compensation. The adoption of SFAS No. 123(R) had a material impact on our consolidated results of operations and the presentation of our consolidated statement of cash flows. However, we believe that stock-based compensation aligns the interests of managers and non-employee directors with the interests of shareholders. As a result, we do not currently expect to significantly change our various stock-based compensation programs. We intend to implement the 2007 Stock Incentive Plan, which is intended to replace the prior plans. The 2007 Stock Incentive Plan offers substantially similar benefits as the current plans as well as restricted stock and similar stock-based compensation. We do not expect that the adoption of the 2007 Stock Incentive Plan will materially change our overall stock-based compensation expense. We use the Black-Scholes standard option pricing model (Black-Scholes model) to determine the fair value of stock options and employee stock purchase rights. The determination of the fair value of the awards on the date of grant using the Black-Scholes model is affected by our stock price as well as assumptions of other variables, including projected employee stock option exercise behaviors, risk-free interest rate, expected volatility of our stock price in future periods and expected dividend yield. We analyze historical employee exercise and termination data to estimate the expected life assumption. We believe that historical data currently represents the best estimate of the expected life of a new employee

21
option. The risk-free interest rate we use is based on the U.S. Treasury zero-coupon yield curve on the grant date for a maturity similar to the expected life of the options. We estimate the expected volatility of our stock price in future periods by using the implied volatility in market traded options. Our decision to use implied volatility was based on the availability of actively traded options for our common stock and our assessment that implied volatility is more representative of future stock price trends than the historical volatility of our common stock. We use an expected dividend yield consistent with our dividend yield over the period of time we have paid dividends in the Black-Scholes option valuation model. The amount of stock-based compensation expense we recognize during a period is based on the portion of the awards that are ultimately expected to vest. We estimate pre-vesting option forfeitures at the time of grant by analyzing historical data and revise those estimates in subsequent periods if actual forfeitures differ from those estimates. If factors change and we employ different assumptions for estimating stock-based compensation expense in future periods or if we decide to use a different valuation model, the expense in future periods may differ significantly from what we have recorded in the current period and could materially affect our net earnings and net earnings per share of a future period. Results of Operations The following table sets forth the percentage of net sales represented by items included in our Consolidated Statements of Income for the fiscal years ended April 28, 2007, April 29, 2006 and April 30, 2005:
Net sales 100.0 % 100.0 % 100.0 %Cost of goods sold 70.8 69.6 68.2
Gross profit 29.2 30.4 31.8Operating expenses 20.7 20.1 23.4
Operating income 8.5 10.3 8.4Interest income (expense), net 0.3 0.6 0.6Other income (expense), net (0.3) 0.0 0.3
Income before income taxes 8.5 10.9 9.3Income tax expense 2.9 4.1 2.5
Net income 5.6 % 6.8 % 6.8 %
April 28,2007
Year EndedApril 29,
2006April 30,
2005
Net Sales Fiscal Year 2007 as compared to Fiscal Year 2006 Net sales increased 40.0% to $433.2 million for fiscal year 2007 as compared to $309.4 million for fiscal year 2006. The increase was across all three of our markets, with the commercial market showing the most significant growth on a percentage basis. Net sales increased both domestically and internationally. As a percent of net sales, standard orders declined to approximately 24% of net sales in fiscal 2007 as compared to 26% in the previous fiscal year. Overall, we believe that orders and net sales will continue to grow in fiscal year 2008, but at a smaller rate. The highest growth rates for fiscal year 2008 are again expected to be in the commercial market: however, as further explained below, the sports market could see greater growth depending on our success in a limited number of very large orders. We also are expecting that international business could experience higher than the corporate average rate of growth. We believe that all areas of our business were impacted by capacity constraints in the first half of fiscal year 2007 as the order volume during this period and the period preceding it exceeded expectations. The constraints were diminished to acceptable levels during the 2007 fiscal year and we do not foresee any long term negative implications as a result of the constraints. The increase in net sales in the commercial market in fiscal year 2007 over fiscal year 2006 was approximately 46% on a worldwide basis. This increase is attributed to both standard and custom projects. The increase in custom projects is due primarily to the increase in orders from outdoor advertising companies and our success internationally, primarily in Asian markets, while the increase in standard product orders is due to the growth in our Galaxy® and GalaxyPro™ displays both within the national account portion of our business and through resellers. Overall, the commercial market continues to benefit from increasing product acceptance, lower

22
cost of displays, our expanding distribution network, international expansion and a better understanding by our customers of the product as a revenue generation tool. For fiscal year 2007, net sales exceeded our expectations set at the beginning of the year. The most significant factor for exceeding these expectations was orders from outdoor advertising companies, which more than doubled. This occurred primarily due to an increase in our customer base and the increasing amount of displays being purchased by existing customers. We believe that the outdoor advertising business has a few important constraints to more rapid deployment, including regulatory and economic constraints which to date our customers have been successful at overcoming. Taking this into account, we expect this portion of our business to be one of the most important drivers of growth into fiscal year 2008. We expect that the growth in the commercial market will continue into fiscal year 2008 but at a lower rate. The overall growth is due to our expanded distribution network, greater product acceptance, international expansion, the development of our resellers and integrated product offerings. Net sales in the commercial market should also expand at rates faster than our other markets and our national account business within the commercial market could grow faster depending on our success in booking major accounts in this niche. We also expect to see growth generated through our new ProTour® line of mobile and modular displays, which we believe will drive improvements in profitability internationally.
As the outdoor advertising business becomes a larger percent of our mix, we believe that seasonality of that business could become a factor as the deployment of displays softens in the winter months. Generally speaking, seasonality is not a material factor in the rest of the commercial business.
As we have reported in prior filings, we made significant investments in digital networks where the display
media is primarily LCD and plasma screens, including investments in Arena Media Networks, LLC and FuelCast Networks LLC. With FuelCast, we have in place one of the largest networks of advertising displays in the United States and we expect to expand this network significantly in fiscal year 2008, which could require additional capital. These affiliates intend to fund their growth with external financing sources. We also intend to decrease our investment in Arena Media during the upcoming fiscal year. Our growth in the commercial market depends to some degree on the state of the economy, which we do not believe had any adverse effects in fiscal year 2007 as opposed to fiscal year 2006.
The increase in net sales in the sports markets of approximately 25% resulted from increases in sales to
large and small sports venues. Net sales increased both domestically and internationally. Our sports market is subject to volatility based on the timing of large orders, especially orders for professional facilities, which can cause net sales to fluctuate year to year. The mid-sized and smaller facilities experience more consistency in growth rates due to the greater number of facilities. The number of major new construction and renovation projects for professional facilities was not a significant factor in increasing net sales in fiscal year 2007 as compared to fiscal year 2006. We are expecting that new construction, primarily with professional facilities, could be a factor in increasing orders and sales in fiscal year 2008 and 2009 as new construction of sports facilities is expected to increase over the next few years. This growth in sales for large and small sports venues was due to a number of factors, including the expanding market, with facilities spending more on larger display systems; our product and services offering, which remains the most integrated and comprehensive offering in the industry; and our network of sales and service offices, which are important to support our customers. In addition, we benefit from the competitive nature of sports teams who strive to out perform their competitors with display systems. This impact has and is expected to continue to be a driving force in increasing transaction sizes in new construction and major renovations. This is also driven by the desire for high definition video displays which typically drive larger displays or higher resolution displays, both of which increase the average transaction size. We believe that the effects of the economy have a lesser impact on the sports market as compared to our other markets because our products are generally revenue-generation tools (through advertising) for facilities and the sports business is generally considered to be a recession-resistant business. Net sales in our sports marketing portion of this business did not perform as well as expected and we do not expect that this portion of the business will grow materially in terms of net sales in fiscal year 2008 over fiscal year 2007. Net sales in this sports marketing were less than 5% of total sales for fiscal year 2007.
An important factor in net sales for fiscal year 2008 will be our success in winning a limited number of
very large contracts expected to be awarded in the sports market in fiscal year 2008. These transactions will generally range in value from $10 million to potentially $25 million and depending on which transactions (if any) we are awarded, we could see a significant variation in the level of net sales, primarily in the second half of the fiscal year and a significant increase in backlog. As a result, the ultimate net sales growth in the sports market is

23
difficult to estimate, but assuming that we prevail in winning projects based on our current market share, net sales to the sports market could expand in excess of 20%.
Orders (as opposed to net sales) in the sports market also performed much better in fiscal year 2007 as compared to 2006. This improved performance is due to the same reasons indicated for the increase in net sales in the sports market. The increase in net sales in the transportation market for fiscal 2007 was approximately 18%, resulting from an increase in spending on state and local transportation projects. This increase, which relates primarily to sales of our Vanguard® product line, was due in part to furthering our penetration with more jurisdictions across the United States. Orders in the transportation market were up over 32% for fiscal year 2007 versus fiscal year 2006. We believe that this increase is due to legislation passed during calendar year 2005 by Congress that provided for increased spending on transportation projects, including large increases associated with intelligent transportation systems and as a result of gaining market share. Going into fiscal year 2008, we expect that sales will continue to grow in excess of 15% as a result of the gains we made in market share in fiscal year 2007 and the increased government spending, which we believe will continue. Fiscal Year 2006 as compared to Fiscal Year 2005 Net sales increased 34.3% to $309.4 million for fiscal year 2006 as compared to $230.3 million for fiscal year 2005. The increase was across all three markets, with the commercial market showing the most significant growth on a percentage basis. Net sales increased both domestically and internationally. As a percent of net sales, standard orders declined to approximately 29% of net sales in fiscal 2006 as compared to 32% in the previous fiscal year.
The increase in net sales in the commercial market in fiscal year 2006 over fiscal year 2005 was 65% on a worldwide basis. This increase is attributed to both standard and custom projects. The increase in custom projects was due primarily to the increase in orders from outdoor advertising companies, while the increase in standard product orders was due to the growth in our Galaxy® displays both within the national account portion of our business and through resellers. Overall, the commercial market benefited from increased product acceptance, lower cost of displays, our expanding distribution network and a better understanding by our customers of the product as a revenue generation tool. For fiscal year 2006, net sales exceeded our expectations set at the beginning of the fiscal year. The most significant factor for exceeding these expectations was orders to outdoor advertising companies. We believe this occurred primarily as a result of the efforts by the outdoor advertising industry to ease the permit process for displays and to gain an understanding as to how to maximize revenue generation on the displays and the reduced price points on the displays.
The increase in net sales in the sports markets of approximately 20% resulted from increases in sales to large and small sports venues. Increases in net sales domestically in sports were partially offset by a decline on an international basis. The number of major new construction and renovation projects for professional facilities in fiscal year 2006 was relatively flat as compared to 2005. The increase in sales to large sports venues for fiscal 2006 was attributable to increases in sales primarily for professional sports facilities. This growth in sales for large and small sports venues was due to a number of factors, including the expanding market, with facilities spending more on larger display systems; our product and services offering, which remains the most integrated and comprehensive offering in the industry; and our network of sales and service offices, which are important to support our customers. Net sales in our sports marketing portion of this business did not perform as well as expected and were less than 5% of total sales for fiscal year 2006.
Orders (as opposed to net sales) in the sports market also performed much better in fiscal year 2006 as compared to 2005. This improved performance is due to the same reasons indicated for the increase in net sales in the sports market. The growth in orders was in the same areas as net sales. On an international basis, orders declined in fiscal year 2006 from fiscal year 2005, which we attribute to its inherent volatility. The increase in net sales in the transportation market for fiscal 2006, which was slightly less than 10%, resulted from an increase in spending on state and local transportation projects. This increase, which relates primarily to sales of our Vanguard product line, was due in part to furthering our penetration with more jurisdictions across the United States. Orders in the transportation market were up over 16% for fiscal year 2006 versus fiscal year 2005. We believe that we benefited from legislation passed during calendar year 2005 by

24
Congress that provided for increased spending on transportation projects, including large increases associated with intelligent transportation systems. Backlog Our backlog at the end of fiscal year 2007 was $127 million as compared to $93 million at the end of fiscal year 2006. The growth in backlog as a percent of fiscal year 2006 backlog was the highest in the commercial market due to increased volume and the timing of order bookings. Backlog also increased over fiscal year 2006 in the sports and transportation markets. Overall, the increase was the result of the order bookings in the most recent quarter as compared to previous quarters. Backlog varies significantly quarter to quarter due to the effects of large orders and significant variations can be expected, as explained previously herein. In addition, our backlog is not necessarily indicative of future sales or net income, also as explained previously. We occasionally sell products in exchange for advertising revenues from the scoreboard or display. These revenues represented less than 5% of net sales for each of fiscal years 2007, 2006 and 2005. The gross profit margin on these net sales has historically been comparable to or higher than the gross profit margin on other net sales of similar sized installations. Gross Profit Fiscal Year 2007 as compared to Fiscal Year 2006 Gross profit increased 34.6% to $126.6 million in fiscal year 2007 from $94.1 million in fiscal year 2006. As a percent of net sales, gross profit decreased to 29.2% in fiscal year 2007 from 30.4% in fiscal year 2006. The increase in gross margin dollars was due to the higher level of net sales discussed above, partially offset by a decline in the gross profit percentage. The most significant factors affecting gross profit margin included the costs of bringing additional capacity on-line which included new facilities in three locations, higher costs of depreciation and inefficiencies in the manufacturing process, the costs associated with implementing lean manufacturing techniques, performance on contracts, the impact of operating at capacity during a significant portion of the year and higher overall warranty costs. Finally, the mix between small orders and large custom orders impacted the gross profit percentage adversely, as the small orders generally have margins in excess of 40% and the large orders have margins of generally less than 30%. We continue to strive towards higher gross margins as a percent of net sales. However, depending on the competitive environment, the actual mix and the level of future sales, the effects of new facilities, continued investment in lean manufacturing concepts and other factors described elsewhere in this report, margin percentages may not increase and could decrease. The negative factors on gross profit are expected to be offset by the effects of process improvements in manufacturing and various other factors. In light of these circumstances, we believe that the gross margin percentages could increase slightly in fiscal year 2008 as compared to fiscal year 2007; however, the impact of the large sports contracts mentioned above to the extent we are successful in winning them could have an adverse impact on the margin percent due to the competitive nature of that business but should drive improvement in earnings per share. Fiscal Year 2006 as compared to Fiscal Year 2005 Gross profit increased 28.5% to $94.1 million in fiscal year 2006 from $73.2 million in fiscal year 2005. As a percent of net sales, gross profit decreased to 30.4% in fiscal year 2006 from 31.8% in fiscal year 2005. The increase in gross margin dollars was due to the higher level of net sales discussed above, partially offset by a decline in the gross profit percentage. The competitive environment year over year was the most significant factor impacting margins. This competitive pressure drove pricing down on custom projects in the second half of fiscal year 2005 and into fiscal year 2006. In addition, gross profit margins were unusually high during the first half of fiscal year 2005 due to the lack of competitive pressures at that time in conjunction with manufacturing cost reductions. The net effect of the competitive changes was a reduction of the margin for the year as a whole. In addition, we believe that we incurred additional costs resulting from the rapid buildup of capacity during the year as we responded to the influx of orders and the increase in personnel required to build up the capacity. Other factors which impacted gross profit percentages were the decline in catalogue product sales as a percentage of net sales and higher costs associated with redesigns of our ProTour® product line.

25
Operating Expenses Fiscal Year 2007 as compared to Fiscal Year 2006 Operating expenses, which are comprised of selling, general and administrative expenses and product design and development costs, increased by 44.0% to $89.7 million in fiscal year 2007 from $62.3 million in fiscal year 2006. The changes in the various components of operating expenses are explained below. All areas within operating expenses were impacted by the implementation of SFAS No. 123(R) as discussed above, higher personnel costs to support our growth and higher benefit costs, consisting primarily of the cost of medical insurance, which increased substantially in fiscal year 2007 as compared to fiscal year 2006. As a percentage of net sales, the increase is attributable in general to the investment we made to position us for the market opportunities we see in the future. In addition, we believe that as we grow, we need to make incremental investments which cause pressure on earnings early on but create leverage over time. We believe that a significant portion of the increases in operating expense growth was necessary to position us for the future. Fiscal Year 2006 as compared to Fiscal Year 2005 Operating expenses, which are comprised of selling, general and administrative expenses and product design and development costs, increased by 15.8% to $62.3 million in fiscal year 2006 from $53.8 million in fiscal year 2005. The changes in the various components of operating expenses are explained below. All areas within operating expenses were impacted by higher personnel costs to support our growth and higher benefit costs, consisting primarily of the cost of medical insurance, which increased substantially in fiscal year 2006 as compared to fiscal year 2005. As a percentage of net sales, the decline is attributable to the incremental net sales in excess of that which was planned during the year and the inherent leverage that higher sales create in operating expenses.
Selling expenses consist primarily of salaries, other employee-related costs, travel and entertainment expenses, facilities-related costs for sales and service offices and expenditures for marketing efforts, including the costs of collateral materials, conventions and trade shows, product demos and supplies. Fiscal Year 2007 as compared to Fiscal Year 2006 Selling expenses increased 34.8% to $54.0 million for fiscal year 2007 as compared to $40.1 million in fiscal year 2006. As a percentage of net sales, selling expenses were 12.5% and 13.0% of net sales in fiscal years 2007 and 2006, respectively. The increase in selling expenses was attributable to higher levels of personnel costs, international expansion, employee benefits, travel and entertainment expenses, depreciation, telephone costs, the increased number of sales and service offices and other costs associated with a higher number of employees. The increase in the number of employees was planned to cover growth expectations across all markets and included the impact of hiring additional personnel to support various other investments made into growing areas, such as our services business, which is a core strategic growth area of the company, commercial sales, transportation sales and international operations. The increase in travel and entertainment expense is due to having more employees in fiscal year 2007 and higher sales. Higher depreciation costs are primarily due to the increased investment in demonstration products and the support needs for the greater number of employees. We expect to continue to invest in organic growth and therefore selling expenses will increase in fiscal year 2008 as compared to fiscal year 2007. However, as a percentage of net sales, we believe that selling expenses could decrease. During the first quarter of fiscal year 2008, we are taking steps to slow the rate of growth of selling expenses and on a quarterly basis, we will reevaluate where we are as a percentage of orders to ensure that we meet our goal of reducing selling expense as a percentage of sales. This expectation could change based on how much investment ultimately we make in current initiatives underway, including our geographical expansion and various other items. We expect that during fiscal 2008 we will continue to invest in our services business within our markets to build the infrastructure to better support our customers for the long term. Fiscal Year 2006 as compared to Fiscal Year 2005 Selling expenses increased 22.1% to $40.1 million for fiscal year 2006 as compared to $32.8 million in fiscal year 2005. As a percentage of net sales, selling expenses were 13.0% and 14.3% of net sales in fiscal years 2006 and 2005, respectively. The increase in selling expenses was attributable to higher levels of personnel costs, international expansion, employee benefits, travel and entertainment expenses, depreciation, telephone costs, rent expense, bad debt expense and other costs associated with a higher number of employees.

26
The increase in the number of employees was planned to cover growth expectations across all markets and included the impact of hiring additional personnel to support various other investments made into growing areas, such as sports marketing, narrowcasting, international operations, the increased number of domestic sales and service offices and other initiatives which existed partially or not at all during fiscal year 2005. The increase in travel and entertainment expense is due to having more employees in fiscal year 2006 and higher sales. Higher bad debt expense is attributable to the higher sales levels. Higher depreciation costs are primarily due to the increased investment in demonstration products. General and administrative expenses consist primarily of salaries, other employee-related costs, professional fees, shareholder relations costs, facilities and equipment related costs for administrative departments, training costs, amortization of intangibles and the costs of supplies. Fiscal Year 2007 as compared to Fiscal Year 2006 General and administrative costs increased 82.2% to $20.0 million in fiscal year 2007 compared to $11.0 million for fiscal year 2006. As a percent of net sales, general and administrative expenses were 4.6% and 3.6% for fiscal years 2007 and 2006, respectively. The increase in general and administrative costs were the result of higher costs of personnel and related infrastructure to support our growth, including international growth; higher travel costs related to new projects undertaken related to growth; higher professional and consulting fees; and significantly higher information technology and human resource related costs designed to position the company for future growth and opportunities. We expect that for fiscal year 2008, general and administrative expenses will decline as a percent of sales and, as with selling expenses, we are taking steps to curtail the rate of growth, which we intend to readdress each fiscal quarter. Fiscal Year 2006 as compared to Fiscal Year 2005 General and administrative costs increased 5.3% to $11.0 million in fiscal year 2006 compared to $10.4 million for fiscal year 2005. As a percent of net sales, general and administrative expenses were 3.6% and 4.5% for fiscal years 2006 and 2005, respectively. The increase in general and administrative costs were the result of higher costs of personnel and related infrastructure to support our growth, including international growth; higher bank fees related primarily to international transactions and letters of credit; greater amortization costs of intangibles; and higher phone costs. These increases were offset by a decline in professional fees due to the one-time costs incurred in fiscal year 2005 related to research and development tax credits, as described below.
Product design and development expenses consist primarily of salaries, other employee-related costs and facilities and equipment-related costs and supplies. Fiscal Year 2007 as compared to Fiscal Year 2006 Product development expenses increased approximately 39.9% to $15.6 million in fiscal year 2007 compared to $11.1 million in fiscal year 2006. As a percent of sales, product development expenses were 3.6% of net sales for fiscal years 2007 and 2006, respectively. Investments in our ProTourTM product line, narrowcasting solutions, our new line of ProStar HD video displays and other display technologies and related items continued to drive increases in investments in new products. In addition, we continued to invest across all other product lines, including display technologies, sound systems and control systems. We developed new products, including our new line of Vanguard roadside display trailers, full-color video displays and a new pixel format for our ProStar display product to address the high definition market and we invested heavily in initiatives designed to improve manufacturing processes and decreasing the costs of the product to us. Fiscal Year 2006 as compared to Fiscal Year 2005 Product development expenses increased approximately 6.4% to $11.1 million in fiscal year 2006 compared to $10.5 million in fiscal year 2005. As a percent of sales, product development expenses were 3.6% and 4.6% of net sales for fiscal years 2006 and 2005, respectively. Investments in our ProTourTM product line and related items continued to drive increases in investments in new products. In addition, we continued to invest across all product lines, including display technologies, sound systems and control systems. We developed new products, including our new line of GalaxyPro, full-color video displays, a new four millimeter center-to-center pixel pitch ProStar display, our line of ProCast LCD displays and a new line of high definition ProStar displays.

27
Interest Income (Expense), net We occasionally sell products on an installment basis, under lease arrangements or in exchange for the rights to sell and retain advertising revenues from displays, which result in long-term receivables. We also invest excess cash in marketable securities and temporary cash investments that generate interest income. Interest expense is comprised primarily of interest cost on our notes payable and other long-term debt. Fiscal Year 2007 as compared to Fiscal Year 2006 Interest income (expense), net, decreased 36.2% to $1.1 million for fiscal year 2007 as compared to $1.7 million for fiscal year 2006. Interest income was less than 1% of net sales for each of fiscal years 2007 and 2006. The decrease was attributable to the reduction of temporary cash investments and marketable securities as a result of the decreased cash flow during the year and an increase in debt outstanding primarily to fund our capacity expansion during the year and media investments. Fiscal Year 2006 as compared to Fiscal Year 2005 Interest income (expense), net, increased 37.0% to $1.7 million for fiscal year 2006 as compared to $1.2 million for fiscal year 2005. Interest income was less than 1% of net sales for each of fiscal years 2006 and 2005. The increase was attributable to the growth of temporary cash investments and marketable securities as a result of the increased cash flow during the year and a decrease in debt outstanding. Income Taxes Fiscal Year 2007 as compared to Fiscal Year 2006 Income taxes decreased 3.3% to $12.3 million in fiscal year 2007 as compared to $12.7 million in fiscal year 2006. The decrease was attributable primarily to the increase in income before taxes which was more than offset by a reduction in the effective tax rate. The effective rate decreased to approximately 34% in fiscal year 2007 from approximately 38% in fiscal year 2006. This decrease in the effective rate is due primarily to the completion of an IRS audit of fiscal years 2002 through 2006 which included primarily the benefits of research and development tax credits. In addition, we benefited from the lower tax rates in Asia, where we were able to generate taxable income which is subject to a tax holiday for a fixed period of time after we began operations there. Finally, we benefited from a retroactive enactment of the research and development tax credit which had previously expired. We expect that the effective rate in fiscal year 2008 will increase because the benefit of the IRS audit and the effect of the retroactive reenactment of the research and development credit were one-time benefits. Fiscal Year 2006 as compared to Fiscal Year 2005 Income taxes increased 120.0% to $12.7 million in fiscal year 2006 as compared to $5.8 million in fiscal year 2005. The increase was attributable primarily to the increase in income before taxes and the effective tax rate. The effective rate increased to approximately 38% in fiscal year 2006 from approximately 27% in fiscal year 2005. This increase in the effective rate was due primarily to the effects of the recognition of research and development tax credits related to prior years in fiscal year 2005 that did not repeat in fiscal year 2006. In addition, due to the expiration of the research and development tax credit at the end of calendar year 2005, we were not able to benefit from this credit for the last four months of fiscal year 2006. Finally, we realized a net benefit related to the implementation of the deduction available for domestic production activities, net of the decrease of extraterritorial income benefits. Liquidity and Capital Resources Working capital was $45.0 million at April 28, 2007 compared to $74.9 million at April 29, 2006. We have historically financed working capital needs through a combination of cash flow from operations and borrowings under bank credit agreements. Cash provided by operations for fiscal year 2007 was $14.6 million. Net income of $24.4 million plus depreciation and amortization of $13.8 million and increases in accounts payable, accrued expenses and warranty obligations were partially offset by increases in inventory, accounts receivable, prepaid expenses, long-term receivables, customer deposits, deferred income taxes, inventories, costs and estimated earnings in excess of billings, billings in excess excess of costs and estimated earnings and advertising rights.

28
The overall changes in operating assets and liabilities is due generally to the impact of the timing of cash flows on large projects, which can cause significant fluctuations in the short term. As a result of various initiatives underway, including changes in manufacturing, purchasing, collections and payment process, we expect to continue improving our cash flow relative to sales and costs of goods. Cash used by investing activities in fiscal 2007 included $58.7 million used to purchase property and equipment. During fiscal year 2007, we invested in excess of $19.0 million in new facilities; $2.9 million in leasehold improvements; $19.7 million in manufacturing equipment, consisting of tooling for new product lines, electronic assembly and metal fabrication equipment and various other items; $13.6 million on information systems hardware and software; $2.3 million in equipment to be used as demonstration equipment; $3.2 million in rental equipment, including our ProTour TM rental units; $2.1 million in transportation equipment; and $1.2 million of office equipment. These purchases were made to support our continued growth, separate plants to support the business unit reorganization described above, finance plant expansions in Redwood Falls, Minnesota and Sioux Falls, South Dakota and to replace obsolete equipment. Other cash provided by investing activities included $8.3 million in proceeds resulting from sales of marketable securities.
In early fiscal 2007, we began construction of a new building in Brookings, South Dakota to be used primarily for office and warehouse space. To date, we have spent approximately $8 million on the building and expect the total cost to be approximately $19 million, including furniture and fixtures. We also are expecting to increase our investment in our Redwood Falls, Minnesota manufacturing facilities primarily as a result of the success we are having with Galaxy® displays and gas price digit displays. We consider these two areas the completion of the major manufacturing capacity expansion efforts we began in fiscal year 2006. In addition, we expect to invest approximately $35 million in other capital expenditures throughout fiscal 2008. We believe that in fiscal year 2008, investments in capital assets will decrease and that over the long term, we will increase our cash and marketable securities, while decreasing the level of debt. Cash provided by financing activities of approximately $25.2 million in fiscal 2007 included $24.6 million borrowed from the line of credit, $1.6 million received for option exercises and $1.4 million from excess tax benefits from stock-based compensation, offset by $2.3 million paid for the dividend to shareholders and $0.1 million of long-term debt principal. Included in receivables as of April 28, 2007 was approximately $0.8 million of retainage on long-term contracts, all of which is expected to be collected in one year. We have used and expect to continue to use cash reserves and, to a lesser extent, bank borrowings to meet our short-term working capital requirements. On large product orders, the time between order acceptance and project completion may extend up to and exceed 18 months depending on the amount of custom work and the customer’s delivery needs. We often receive down payments or progress payments on these product orders. To the extent that these payments are not sufficient to fund the costs and other expenses associated with these orders, we use working capital and bank borrowings to finance these cash requirements. Our product development activities include the enhancement of existing products and the development of new products from existing technologies. Product development expenses for fiscal years 2007, 2006 and 2005 were $15.6, $11.2 million and $10.5 million, respectively. We intend to continue to incur these expenditures to develop new display products and solutions using various technologies to offer higher resolution and more cost-effective and energy-efficient displays, as well as to complement the services and solutions that are provided with the displays. We also intend to continue developing software applications related to our display systems to enable these products to continue to meet the needs and expectations of the marketplace. We have a credit agreement with a bank which provides for a $45.0 million line of credit and includes up to $10.0 million for standby letters of credit. The line of credit is due on November 15, 2008. The interest rate ranges from LIBOR plus 75 basis points to LIBOR plus 125 basis points depending on certain ratios. The effective interest rate was 5.8% at April 28, 2007. Starting January 23, 2007, we are assessed a loan fee equal to 0.1% per annum of any non-used portion of the loan. As of April 28, 2007, $24.6 million was advanced under the line of credit. The credit agreement is unsecured and requires us to comply with certain covenants, including the maintenance of tangible net worth of at least $75 million, a minimum liquidity ratio, a limit on dividends and distributions and a minimum adjusted fixed charge coverage ratio. Daktronics Canada, Inc. has a credit agreement with a bank which provides for a $0.4 million line of credit. The line of credit is due on April 30, 2008.

29
The interest rate on the line of credit is equal to 1.5% above the prime rate of interest and was 6.0% at April 28, 2007. As of April 28, 2007, no advances under the line of credit were outstanding. The line of credit is secured primarily by accounts receivables, inventory and other assets of the subsidiary. We are sometimes required to obtain performance bonds for display installations. We currently have a bonding line available through a surety company that provides for an aggregate of $100 million in bonded work outstanding. At April 28, 2007, we had $11.2 million of bonded work outstanding against this line.
We believe that if our growth extends beyond current expectations or if we make any strategic investments, we may need to increase the amount of our credit facility or seek other means of financing our growth. We anticipate that we will be able to obtain any needed funds under commercially reasonable terms from our current lender or other sources. We believe that our working capital available from all sources will be adequate to meet the cash requirements of our operations in the foreseeable future. Contractual Obligations and Commitments We enter into various debt, lease, purchase and marketing obligations that require payments in future periods. Debt obligations represent primarily bank loans. Operating lease obligations relate primarily to leased office space. Long-term marketing obligations relate to payment due in future periods for payments on sales where we sold and installed our equipment in exchange for future advertising revenue. When certain advertising revenue thresholds are met, all or a portion of excess cash is owed back to the customer. Unconditional purchase obligations represent future payments for inventory and advertising rights purchase commitments. As of April 28, 2007, our debt, lease and purchase obligations were as follows:
Total Less than
1 year 1-3 Years 4-5 Years
After 5 Years
Long-term debt and accrued interest 1,223$ 631$ 592$ -$ -$ Long-term marketing obligations and accrued interest 960 487 448 17 8 Operating leases 7,311 2,230 4,242 529 310 Unconditional purchase obligations 8,711 8,400 311 - - Total 18,205$ 11,748$ 5,593$ 546$ 318$
Other commercial commitments:Line of credit and accrued interest 24,760$ 24,760$ -$ -$ -$ Standby letters of credit 965 918 47 - -
Contractual Obligations
Cash Commitments:
Inflation We believe that inflation has not had a material effect on our operations or our financial condition, although it could in the future. Recent Accounting Pronouncements In June 2006, the Financial Accounting Standards Board (FASB) issued Interpretation No. (“FIN”) 48, “Accounting for Uncertainty in Income Taxes,“ which clarifies the accounting for uncertainty in income taxes recognized in accordance with SFAS No. 109, “Accounting for Income Taxes.” FIN 48 prescribes a recognition threshold and measurement attribute for the financial statement recognition and measurement of a tax position taken or expected to be taken in a tax return. FIN 48 also provides guidance on derecognition, classification, interest and penalties, accounting in interim periods and disclosure. FIN 48 is effective for fiscal years beginning after December 15, 2006 and is required to be adopted by us effective April 29, 2007. We are currently evaluating the impact of FIN 48 on our financial statements.

30
In February 2006, the FASB issued SFAS No. 155, "Accounting for Certain Hybrid Financial Instruments." This Statement amends SFAS No.133, “Accounting for Derivative Instruments and Hedging Activities,” and SFAS No.140, “Accounting for Transfers and Servicing of Financial Assets and Extinguishments of Liabilities.” SFAS No. 155 resolves issues addressed in SFAS No. 133 Implementation Issue No. D1, "Application of Statement 133 to Beneficial Interests in Securitized Financial Assets." SFAS No. 155 is effective for all financial instruments acquired or issued after the beginning of an entity's first fiscal year that begins after September 15, 2006. The fair value election provided for in paragraph 4(c) of SFAS No. 155 may also be applied upon adoption of SFAS No. 155 for hybrid financial instruments that had been bifurcated under paragraph 12 of SFAS No. 133 prior to the adoption of SFAS No, 155. Earlier adoption is permitted as of the beginning of an entity's fiscal year, provided the entity has not yet issued financial statements, including financial statements for any interim period for that fiscal year. Provisions of SFAS No. 155 may be applied to instruments that an entity holds at the date of adoption on an instrument-by-instrument basis. Adoption is not expected to have a material impact on our consolidated earnings, financial position or cash flows. In February 2007, the FASB issued SFAS No. 159, "The Fair Value Option for Financial Assets and Liabilities." SFAS No. 159 permits entities to choose to measure many financial instruments and certain other items at fair value. The objective is to improve financial reporting by providing entities with the opportunity to mitigate volatility in reported earnings caused by measuring related assets and liabilities differently without having to apply complex hedge accounting provisions. SFAS No. 159 is expected to expand the use of fair value measurement, which is consistent with FASB’s long-term measurement objectives for accounting for financial instruments. SFAS No. 159 is effective for financial statements issued for fiscal years beginning after November 15, 2007 and interim periods within those fiscal years. Earlier application is encouraged, provided that the reporting entity has not yet issued financial statements for that fiscal year, including financial statements for an interim period within that fiscal year. Adoption is not expected to have a material impact on our consolidated earnings, financial position or cash flows. In September 2006, the FASB issued SFAS No. 157, “Fair Value Measurement.” SFAS No. 157 provides guidance for using fair value to measure assets and liabilities. SFAS No. 157 clarifies the principle that fair value should be based on the assumptions that market participants would use when pricing an asset or liability and establishes a fair value hierarchy that prioritizes the information used to develop those assumptions. Under SFAS No. 157, fair value measurements would be separately disclosed by level within the fair value hierarchy. SFAS No. 157 is effective for us beginning in fiscal year 2008; however, early adoption is permitted. We have not yet determined the impact, if any, that the implementation of SFAS No. 157 will have on our results of operations and financial condition.
In September 2006, the SEC issued Staff Accounting Bulletin (SAB) No. 108, “Considering the Effects of Prior Year Misstatements when Quantifying Misstatements in Current Year Financial Statements”. SAB No. 108 provides interpretive guidance on how the effects of the carryover or reversal of prior year misstatements should be considered in quantifying a current year misstatement. The SEC staff believes that registrants should quantify errors using both a balance sheet and an income statement approach and evaluate whether either approach results in quantifying a misstatement that, when all relevant quantitative and qualitative factors are considered, is material. SAB No. 108 is effective for fiscal years ending on or after November 15, 2006, with early application encouraged. The adoption of this standard did not have any impact on our consolidated financial statements. Item 7A. QUANTITATIVE AND QUALITATIVE DISCLOSURES ABOUT MARKET RISK Foreign Currency Exchange Rates Through April 28, 2007, most of our net sales were denominated in United States dollars and our exposure to foreign currency exchange rate changes has not been significant. Net sales originating outside the United States for fiscal year 2007 were approximately 10% of total net sales, of which a portion was denominated in Canadian Dollars, Euros, Chinese Renminbi or British Pounds. In fiscal 2008, net sales to international markets may increase as a percentage of net sales and, consequently, a greater portion of this business could be denominated in foreign currencies. As a result, operating results may become subject to fluctuations based upon changes in the exchange rates of certain currencies in relation to the United States dollar. To the extent that we engage in international sales denominated in United States dollars, an increase in the value of the United States dollar relative to foreign currencies could make our products less competitive in international markets. We will continue to monitor and minimize our exposure to currency fluctuations and, when appropriate, use financial

31
hedging techniques, including foreign currency forward contracts and options, to minimize the effect of these fluctuations. However, exchange rate fluctuations as well as differing economic conditions, changes in political climates, differing tax structures and other rules and regulations could adversely affect our financial results in the future. Interest Rate Risks
Our exposure to market rate risk for changes in interest rates relates primarily to our debt and long-term accounts receivable. We maintain a blend of both fixed and floating rate debt instruments. As of April 28, 2007, our outstanding debt was $25.8 million, substantially all of which was in variable rate obligations. Each 100 basis point increase or decrease in interest rates would have an $0.1 million annual effect on variable rate debt interest based on the balances of such debt as of April 28, 2007. For fixed rate debt, interest rate changes affect our fair market value but do not impact earnings or cash flows.
In connection with the sale of certain display systems, we have entered into various types of financing
orders with customers. The aggregate amounts due from customers include an imputed interest element. The majority of these financings carry fixed rates of interest. As of April 28, 2007, our outstanding long-term receivables were $18.0 million. Each 25 basis point increase in interest rates would have an associated annual opportunity cost of less than $0.1 million. The following table provides information about our financial instruments that are sensitive to changes in interest rates, including debt obligations. Weighted average variable interest rates are based on implied forward rates in the yield curve at the reporting date.
There-2008 2009 2010 2011 2012 after
Assets:Long-term receivables,
including current portionFixed-rate 6,831$ 3,110$ 2,428$ 1,703$ 1,569$ 2,401$
Average interest rate 6.7% 7.3% 7.5% 7.9% 7.7% 8.4%Liabilities:Long- and short-term debt
Variable-rate 24,615$ -$ -$ -$ -$ -$ Fixed-rate 556$ 542$ 25$ 25$ -$ -$
Average interest rate 5.5% 5.6% 5.7% 0.0% 0.0% 0.0%Long-term marketing obligations,
including current portionFixed-rate 446$ 237$ 161$ 50$ 17$ 8$
Average interest rate 6.2% 8.4% 8.9% 8.6% 8.6% 7.3%
Fiscal Years
The carrying amounts reported on the balance sheet for long-term receivables and long- and short-term debt approximate their fair values. Substantially all of our cash balances are denominated in United States dollars. Cash balances in foreign currencies are operating balances maintained in accounts of our foreign subsidiaries. These balances are immaterial to us as a whole. Item 8. FINANCIAL STATEMENTS AND SUPPLEMENTARY DATA

32
REPORT OF INDEPENDENT REGISTERED PUBLIC ACCOUNTING FIRM
To the Board of Directors and Shareholders Daktronics, Inc. We have audited the accompanying consolidated balance sheets of Daktronics, Inc. and subsidiaries as of April 28, 2007 and April 29, 2006 and the related consolidated statements of income, shareholders’ equity and cash flows for each of the three years in the period ended April 28, 2007. These financial statements are the responsibility of the Company’s management. Our responsibility is to express an opinion on these financial statements based on our audits. We conducted our audits in accordance with the standards of the Public Company Accounting Oversight Board (United States.) Those standards require that we plan and perform the audit to obtain reasonable assurance about whether the financial statements are free of material misstatement. An audit includes examining, on a test basis, evidence supporting the amounts and disclosures in the financial statements. An audit also includes assessing the accounting principles used and significant estimates made by management, as well as evaluating the overall financial statement presentation. We believe that our audits provide a reasonable basis for our opinion. In our opinion, the financial statements referred to above present fairly, in all material respects, the financial position of Daktronics, Inc. and subsidiaries as of April 28, 2007 and April 29, 2006 and the consolidated results of their operations and their cash flows for each of the three years in the period ended April 28, 2007, in conformity with U.S. generally accepted accounting principals. As discussed in Note 1 to the consolidated financial statements, effective April 30, 2006, the company adopted the provisions of Statement of Financial Accounting Standards No. 123 (Revised 2004), Share-Based Payment. We have also audited, in accordance with the standards of the Public Company Accounting Oversight Board (United States), the effectiveness of Daktronics, Inc.’s internal control over financial reporting as of April 28, 2007, based on criteria established in internal control-integrated framework issued by the Committee of Sponsoring Organizations of the Trading Commission and our report dated June 22, 2007 expressed an unqualified opinion thereon.
/s/ Ernst & Young LLP Minneapolis, Minnesota June 22, 2007

33
DAKTRONICS, INC. AND SUBSIDIARIES CONSOLIDATED BALANCE SHEETS
(in thousands, except share data)
April 28, April 29,ASSETS 2007 2006Current Assets:
Cash and cash equivalents 2,590$ 26,921$ Marketable securities - 8,310 Accounts receivable, less allowance for doubtful accounts 56,692 46,019 Current maturities of long-term receivables 6,831 4,476 Inventories 45,835 31,045 Costs and estimated earnings in excess of billings 22,314 17,375 Prepaid expenses and other 5,044 2,522 Deferred income taxes 7,761 6,213 Income taxes receivable 731 97 Rental equipment available for sale 188 286
Total current assets 147,986 143,264
Property and equipment, net 86,126 40,559 Advertising rights, net 3,830 3,112 Long-term receivables, less current maturities 11,211 8,756 Investments in affiliates 8,762 582 Goodwill 4,408 2,706 Intangible and other assets 3,391 636 Deferred income taxes 136 232
265,850$ 199,847$
LIABILITIES AND STOCKHOLDERS EQUITYCurrent Liabilities:
Notes payable, bank 24,615$ -$ Accounts payable 26,094 20,506 Accrued expenses and warranty obligations 21,849 15,396 Current maturities of long-term debt and marketing obligations 1,002 491 Billings in excess of costs and estimated earnings 18,293 19,760 Customer deposits 5,857 7,777 Deferred revenue 5,333 3,849 Income taxes payable 39 555
Total current liabilities 103,082 68,334
Long-term debt, less current maturities 592 131 Long-term marketing obligations, less current maturities 473 574 Long-term warranty obligations and other payables 5,366 3,864 Deferred income taxes 2,629 1,599
Total long-term liabilities 9,060 6,168
SHAREHOLDERS' EQUITY:Common stock, no par value, authorized
120,000,000 shares; 39,548,938 and 38,931,676 shares issued at April 28, 2007 and April 29, 2006, respectively 21,954 19,551
Additional paid-in capital 7,431 3,480 Retained earnings 124,469 102,381 Treasury stock, at cost, 19,680 shares (9) (9) Accumulated other comprehensive loss (137) (58)
153,708 125,345 265,850$ 199,847$
See notes to consolidated financial statements.

34
DAKTRONICS, INC. AND SUBSIDIARIES CONSOLIDATED STATEMENTS OF INCOME
(in thousands, except per share data)
April 28, April 29, April 30,2007 2006 2005
Net sales 433,201$ 309,370$ 230,346$ Cost of goods sold 306,604 215,296 157,137
Gross profit 126,597 94,074 73,209
Operating expenses:Selling 54,047 40,104 32,840 General and administrative 20,008 10,983 10,434 Product design and development 15,627 11,172 10,499
89,682 62,259 53,773 Operating income 36,915 31,815 19,436
Nonoperating income (expense):Interest income (expense), net 1,086 1,702 1,242 Other income (expense), net (1,219) 152 768
Income before income taxes 36,782 33,669 21,446 Income tax expense 12,355 12,708 5,786 Net income 24,427$ 20,961$ 15,660$
Earnings per share:Basic 0.62$ 0.54$ 0.41$ Diluted 0.59$ 0.52$ 0.39$
Cash dividend paid per share 0.06$ 0.05$ -$
Weighted average shares outstanding:Basic 39,223 38,636 37,954 Diluted 41,311 40,506 40,274
See notes to consolidated financial statements.
Year Ended

35
DAKTRONICS, INC. AND SUBSIDIARIES CONSOLIDATED STATEMENTS OF SHAREHOLDERS’ EQUITY
(in thousands)
Balance, May 1, 2004 $ 16,406 $ 2,274 $ 67,677 $ (9) $ (84) $ 86,264 Net income - - 15,660 - - 15,660 Foreign currency translation
adjustment - - - - 217 217 Net gains (losses) on
derivative instruments - - - - 26 26 Comprehensive income - - - - - 15,903 Tax benefits related to
exercise of stock options - 410 - - - 410 Exercise of stock options 835 - - - - 835 Employee savings plan
activity 498 - - - - 498 Balance, April 30, 2005 17,739 2,684 83,337 (9) 159 103,910
Net income - - 20,961 - - 20,961 Foreign currency translation
adjustment - - - - (206) (206) Net gains (losses) on
derivative instruments - - - - (11) (11) Comprehensive income - - - - - 20,744 Tax benefits related to
exercise of stock options - 796 - - - 796 Exercise of stock options
and warrants 1,186 - - - - 1,186 Employee savings plan
activity 626 - - - - 626 Dividends paid - - (1,917) - - (1,917)
Balance, April 29, 2006 19,551 3,480 102,381 (9) (58) 125,345 Net income - - 24,427 - - 24,427 Foreign currency translation
adjustment - - - - (66) (66) Net gains (losses) on
derivative instruments - - - - (13) (13) Comprehensive income - - - - - 24,348 Tax benefits related to
exercise of stock options - 1,856 - - - 1,856 Share-based compensation
expense - 2,095 - - - 2,095 Exercise of stock options
and warrants 1,565 - - - - 1,565 Employee savings plan
activity 838 - - - - 838 Dividends paid - - (2,339) - - (2,339)
Balance, April 28, 2007 21,954$ 7,431$ 124,469$ (9)$ (137)$ 153,708$
Accumulated Other
Comprehensive Gain (Loss) Total
Common Stock
Additional Paid-In Capital
Retained Earnings
Treasury Stock

36
DAKTRONICS, INC. AND SUBSIDIARIES CONSOLIDATED STATEMENTS OF CASH FLOWS
(in thousands)
April 28, April 29, April 30,2007 2006 2005
CASH FLOWS FROM OPERATING ACTIVITIES:Net Income 24,427$ 20,961$ 15,660$ Adjustments to reconcile net income to net cash provided by operating activities:
Depreciation 13,298 8,915 7,387 Amortization 503 55 40 Gain on sale of property and equipment (148) (65) (2) Stock-based compensation 2,095 - - Equity in earnings and losses of affiliates 2,027 - - Provision for doubtful accounts 239 281 (172) Deferred income taxes, net (422) (2,421) 56 Change in operating assets and liabilities (27,413) 4,191 (592)
Net cash provided by operating activities 14,606 31,917 22,377
CASH FLOWS FROM INVESTING ACTIVITIES:Purchase of property and equipment (58,743) (18,919) (13,483) Cash consideration paid for investment in affiliates (13,779) (165) (1,024) Sales (purchases) of marketable securities, net 8,309 (205) (4,104) Proceeds from sale of property and equipment 215 331 502
Net cash used in investing activities (63,998) (18,958) (18,109)
CASH FLOWS FROM FINANCING ACTIVITIES:Net borrowings (payments) on notes payable 24,615 (88) (154) Proceeds from long-term debt - - 50 Proceeds from exercise of stock options and warrants 1,565 1,186 835 Principal payments on long-term debt (102) (913) (1,493) Excess tax benefits from stock-based compensation 1,411 - - Dividend paid (2,339) (1,917) -
Net cash provided by (used in) financing activities 25,150 (1,732) (762)
EFFECT OF EXCHANGE RATE CHANGES ON CASH (89) (267) 200 INCREASE (DECREASE) IN CASH AND CASH EQUIVALENTS (24,331) 10,960 3,706
CASH AND CASH EQUIVALENTS:Beginning 26,921 15,961 12,255 Ending 2,590$ 26,921$ 15,961$
See notes to consolidated financial statements.
Year Ended

37
DAKTRONICS, INC. AND SUBSIDIARIES NOTES TO CONSOLIDATED FINANCIAL STATEMENTS
(in thousands, except per share data) Note 1. Nature of Business and Summary of Significant Accounting Policies Nature of business: Daktronics, Inc. and its subsidiaries are engaged principally in the design, manufacture and sale of a wide range of electronic display systems and related products which are sold in a variety of markets throughout the world and rendering related services, including content development, marketing and maintenance services. Our products are designed primarily to inform and entertain people through the communication of content. Fiscal year: We operate on a 52 to 53 week fiscal year end, with fiscal years ending on the Saturday closest to April 30 of each year. The years ended April 28, 2007, April 29, 2006 and April 30, 2005 consisted of 52 weeks. Principles of consolidation: The consolidated financial statements include our accounts and our wholly-owned subsidiaries – Daktronics France SARL, Daktronics Shanghai, Ltd., Daktronics GmbH; Star Circuits, Inc.; Daktronics Media Holdings, Inc. (formerly SportsLink, Ltd.); MSC Technologies, Inc.; Daktronics UK, Ltd.; Daktronics Hong Kong, Ltd.; Daktronics Canada, Inc., Daktronics Hoist, Inc. and Daktronics FZE. Intercompany balances and transactions have been eliminated in consolidation. Investments in affiliates are accounted for by the equity method. We have evaluated our relationships with affiliates and have determined that these entities are not variable interest entities and therefore are not required to be consolidated in our consolidated financial statements. Accordingly, our proportional share of the respective affiliate’s earnings or losses is included in other income (expense) in our consolidated statement of income. Reclassifications: Certain reclassifications have been made to the fiscal year 2006 and 2005 financial statements to conform to the presentation used in the fiscal year 2007 financial statements. These reclassifications had no effect on shareholders’ equity or net income as previously reported. We reclassified certain prepayments from accounts payable to prepaid expenses, reclassified certain deferred revenue amounts to accrued expenses and warranty obligations, reclassified equity investments on the balance sheet from intangibles and other assets and combined current maturities of long-term debt and marketing obligations. Use of estimates: The preparation of financial statements in conformity with accounting principles generally accepted in the United States requires us to make estimates and assumptions that affect the reported amounts of assets and liabilities and disclosure of contingent assets and liabilities at the date of the financial statements and the reported amounts of revenues and expenses during the reporting period. Actual results could differ significantly from those estimates. Material estimates that are particularly susceptible to significant change in the near term relate to the determination of the estimated total costs on long-term contracts, estimated costs to be incurred for product warranties, inventory valuation and the reserve for doubtful accounts. Cash and cash equivalents: All highly liquid investments with maturities of three months or less at the date of purchase are considered to be cash equivalents consisting primarily of government repurchase agreements and money market accounts and they are carried at cost that approximates market. We maintain our cash in bank deposit accounts, the balances of which at times may exceed federally insured limits. We have not experienced any losses in such accounts. Marketable securities: We classify investments in marketable securities as “available-for-sale” or “held-to-maturity” in accordance with the provisions of Statement of Financial Accounting Standards (“SFAS”) No. 115, “Accounting for Certain Investments in Debt and Equity Securities.” Any investments that we intend to hold for more than one year are classified as long-term investments. Available-for-sale securities are carried at fair value with the unrealized gain or loss, net of tax, reported in other comprehensive income. Held-to-maturity securities are recorded at amortized cost. Unrealized losses considered to be ”other-than-temporary” are recognized currently in earnings. The cost of securities sold is based on the specific identification method. The fair value of most investment securities is determined by currently available market prices. Where quoted market prices are

38
not available, we use the market price of similar types of securities that are traded in the market to estimate fair value. See Note 5 for a detailed description of our investments in marketable securities. Inventories: Inventories are stated at the lower of cost (first-in, first-out method) or market. Market is determined on the basis of estimated realizable values. Revenue recognition: Multiple-element arrangements: We generate revenue from the sale of equipment and related services, including customization, installation and maintenance services. In some instances, we provide some or all of the above to our customers under the terms of a single multiple-element sales arrangement. These arrangements typically involve the sale of equipment bundled with some or all of the services previously described, but may also involve instances in which we have contracted to deliver multiple pieces of equipment over time, rather than at a single point in time. When a sales arrangement involves multiple elements, the items included in the arrangement (deliverables) are evaluated pursuant to Emerging Issues Task Force (“EITF”) Issue No. 00-21, Revenue Arrangements with Multiple Deliverables, to determine whether they represent separate units of accounting. We perform this evaluation at the inception of an arrangement and as we deliver each item in the arrangement. Generally, we account for a deliverable (or a group of deliverables) separately if the delivered item(s) has standalone value to the customer, there is objective and reliable evidence of the fair value of the undelivered items included in the arrangement and if we have given the customer a general right of return relative to the delivered item(s), delivery or performance of the undelivered item(s) or service(s) is probable and substantially in our control. When items included in a multiple-element arrangement represent separate units of accounting and there is objective and reliable evidence of fair value for all items included in the arrangement, we allocate the arrangement consideration to the individual items based on their relative fair values. If there is objective and reliable evidence of the fair value(s) of the undelivered item(s) in an arrangement, but no such evidence for the delivered item(s), we use the residual method to allocate the arrangement consideration. In either case, the amount of arrangement consideration allocated to the delivered item(s) is limited to the amount that is not contingent on us delivering additional products or services. Once we have determined the amount, if any, of arrangement consideration allocable to the delivered item(s), we apply the applicable revenue recognition policy, as described elsewhere herein, to determine when such amount may be recognized as revenue. We generally determine if objective and reliable evidence of fair value for the items included in a multiple-element arrangement exists based on whether we have vendor-specific objective evidence (VSOE) of the price for which we sell an item on a standalone basis. If we do not have VSOE for the item, we will use the price charged by a competitor selling a comparable product or service on a standalone basis to similarly situated customers, if available. If we cannot account for the items included in a multiple-element arrangement as separate units of accounting, they are combined and accounted for as a single unit of accounting, generally resulting in a delay in the recognition of revenue for the delivered item(s) until we have provided the undelivered item(s) or service(s) to the customer. Long-term contracts: Earnings on long-term contracts are recognized on the percentage-of-completion method, measured by the percentage of costs incurred to date to estimated total costs for each contract. Operating expenses are charged to operations as incurred and are not allocated to contract costs. Provisions for estimated losses on uncompleted contracts are made in the period in which such losses are estimable.
Equipment other than long-term contracts: We recognize revenue on equipment sales, other than long-term contracts, when title passes, which is usually upon shipment and then only if the revenue is fixed and determinable. We record estimated sales returns and discounts as a reduction of net sales in the same period revenue is recognized. Long-term receivables and advertising rights: We occasionally sell and install our products at facilities in exchange for the rights to sell and retain future advertising revenues. For these transactions, we recognize

39
revenue for the amount of the present value of the future advertising payments if enough advertising is sold to obtain normal margins on the contract and we record the related receivable in long-term receivables. On those transactions where we have not sold the advertising for the full value of the equipment at normal margins, we record the related cost of equipment as advertising rights. Revenue to the extent of the present value of the advertising payments is recognized in long-term receivables when it becomes fixed and determinable under the provisions of applicable advertising contracts. At the time the revenue is recognized, costs of the equipment are recognized based on an estimate of overall margin expected. In cases where we receive the advertising rights as opposed to only cash payments in exchange for the equipment, revenue is recognized as it becomes earned and the related costs of the equipment are amortized over the term of the advertising rights, which were owned by us. On these transactions, advance collections of advertising revenues are recorded as deferred income. The cost of advertising rights and deferred costs, net of amortization, was $3,830 as of April 28, 2007 and $3,112 as of April 29, 2006.
Product maintenance: In connection with the sale of our products, we also occasionally sell separately priced extended warranties and product maintenance contracts. The revenue related to such contracts are deferred and recognized as net sales over the term of the agreement, which varies from two to 10 years. Software: We typically sell our proprietary software bundled with our video displays and certain other products, but we also sell our software separately. Pursuant to American Institute of Certified Public Accountants (“AICPA”) Statement of Position (“SOP”) 97-2, “Software Revenue Recognition,” as amended by SOP 98-4, “Deferral of the Effective Date of a Provision of SOP 97-2,” and SOP 98-9, “Modification of SOP 97-2, Software Revenue Recognition with Respect to Certain Transactions,” revenues from software license fees on sales, other than long-term contracts, are recognized when persuasive evidence of an agreement exists, delivery of the product has occurred, the fee is fixed or determinable and collection is probable. For sales of software included in long-term contracts, the revenue is recognized under the percentage-of-completion method for long-term contracts starting when all of the above-mentioned criteria have been met.
Services: Revenues generated by us for services, such as event support, control room design, on-site training, equipment service and technical support of our equipment, are recognized as net sales when the services are performed.
Derivatives: We utilize derivative financial instruments to manage the economic impact of fluctuations in currency exchange rates on those transactions that are denominated in a currency other than our functional currency, which is the U.S. Dollar. We enter into currency forward contracts to manage these economic risks. SFAS No. 133, "Accounting for Derivative Instruments and Hedging Activities, as amended by SFAS No. 137 and No. 138,” requires us to recognize all derivatives on the balance sheet at fair value. Derivatives that are not hedges must be adjusted to fair value through earnings. If a derivative is a hedge, depending on the nature of the hedge, changes in the fair value of derivatives are either offset against the change in the fair value of the hedged assets, liabilities or firm commitments through earnings or recognized in accumulated other comprehensive gain (loss) until the hedged item is recognized in earnings.
To protect against the reduction in value of forecasted foreign currency cash flows resulting from export
sales over the next year, we have instituted a foreign currency cash flow hedging program. We hedge portions of our forecasted revenue denominated in foreign currencies with forward contracts. When the dollar strengthens significantly against the foreign currencies, the decline in value of future foreign currency revenue is offset by gains in the value of the forward contracts designated as hedges. Conversely, when the dollar weakens, the increase in the value of future foreign currency cash flows is offset by losses in the value of the forward contracts.
During the fiscal year ended April 28, 2007, we assessed all hedges to be effective and recorded
changes of value in other comprehensive income. Cash flow hedges were discontinued, causing the recognition of a gain or loss in other income (expense), net, of $11. The fair value of all derivatives is included in prepaid expenses and other in the statement of financial condition.

40
Property and equipment: Property and equipment is stated at cost and depreciated principally on the straight-line method over the following estimated useful lives:
YearsBuildings 7 - 40Machinery and equipment 5 - 7Office furniture and equipment 3 - 5Equipment held for rental 2 - 7Purchased and internally developed software 3 - 5Demostration equipment 3 - 5Transportation equipment 5 - 7 Leasehold improvements are depreciated over the lesser of the useful life of the asset or the term of the
lease. Our depreciation expense was $13,298, $8,915 and $7,387 for the fiscal years ended April 28, 2007, April 29, 2006 and April 30, 2005, respectively.
Software Costs: We capitalize certain costs incurred in connection with developing or obtaining internal-use software. Capitalized software costs are included in “Property, Plant and Equipment” on our consolidated balance sheet. Software costs that do not meet capitalization criteria are expensed immediately.
Goodwill and other intangible assets: We account for goodwill and other intangible assets in accordance
with SFAS No. 142, “Goodwill and Other Intangible Assets,” and we complete an impairment analysis on an annual basis and more frequently if circumstances warrant.
Goodwill was $4,408 at April 28, 2007 and $2,706 at April 29, 2006. We performed an analysis of goodwill as of October 30, 2006 and October 30, 2005. The results of the analysis indicated that no goodwill impairment existed as of these dates. As required by SFAS No. 142, intangibles with finite lives are amortized. Included in intangible assets are non-compete agreements and various patents and trademarks. Amortization expense for the fiscal years 2007, 2006 and 2005 was $503, $55 and $41, respectively. The net value of intangible assets is included as a component of intangible and other assets in the accompanying consolidated balance sheets. Estimated amortization expense based on intangibles as of April 28, 2007 is $315 for fiscal years ending 2008, 2009 and 2010, $288 for fiscal year 2011, $245 for fiscal year 2012 and $1,007 thereafter, respectively. The following table sets forth the gross carrying amount and accumulated amortization of intangible assets by major intangible class as of April 28, 2007:
Gross Carrying Amount
Accumulated Amoritization Net Value
Patents 2,282$ 133$ 2,149$ Non-compete agreements 348 72 276 Registered patents/trademarks 401 - 401 Other 87 27 60
3,118$ 232$ 2,886$
Insurance: We are self-insured for certain losses related to health and liability claims, although we obtain third-party insurance to limit our exposure to these claims. We estimate our self-insured liabilities using a number of factors, including historical claims experience. Our self-insurance liability was $1,070 and $690 at April 28, 2007 and April 29, 2006, respectively and is included in other current liabilities in our consolidated balance sheets.
Foreign currency translation: Our foreign subsidiaries use the local currency of their respective countries as their functional currency. The assets and liabilities of foreign operations are generally translated at the exchange rates in effect at the balance sheet date. The operating results of foreign operations are translated at weighted average exchange rates. The related translation gains or losses are reported as a separate component of shareholders’ equity.

41
Income taxes: We account for income taxes under SFAS No. 109, “Accounting for Income Taxes.” Deferred taxes are provided on an asset and liability method whereby deferred tax assets are recognized for deductible temporary differences and operating loss and tax credit carryforwards and deferred tax liabilities are recognized for taxable temporary differences. Temporary differences are the differences between the amounts of assets and liabilities recorded for income tax and financial reporting purposes. Deferred tax assets are reduced by a valuation allowance when, in the opinion of management, it is more likely than not that some portion or all of the deferred tax assets will not be realized. Deferred tax assets and liabilities are adjusted for the effects of changes in tax laws and rates on the date of enactment. We have a tax holidays in China that will expire in fiscal year 2012. The tax holiday had no effect on fiscal years 2007, 2006, 2005. We are unable to predict how these expirations will impact us in the future.
Comprehensive income: We follow the provisions of SFAS No. 130, “Reporting Comprehensive Income,” which establishes standards for reporting and displaying comprehensive income and its components. Comprehensive income reflects the change in equity of a business enterprise during a period from transactions and other events and circumstances from non-owner sources. For us, comprehensive income represents net income adjusted for foreign currency translation adjustments and net gains and losses on derivative instruments. The foreign currency translation adjustment included in comprehensive income has not been tax effected, as the investments in foreign affiliates is deemed to be permanent. In accordance with SFAS No. 130, we have chosen to disclose comprehensive income in the consolidated statement of shareholders' equity.
The following sets forth the accumulated balances for each item included in the accumulated other comprehensive income:
Balance May 1, 2004 (84)$ -$ (84)$ Net change 217 26 243
Balance April 30, 2005 133 26 159 Net change (204) (13) (217)
Balance April 29, 2006 (71) 13 (58) Net change (66) (13) (79)
Balance April 28, 2007 (137)$ -$ (137)$
Accumulated other
comprehensive income
Foreign currency
translation adjustment
Net gains (losses) on derivative instrument
Product design and development: All expenses related to product design and development are charged to operations as incurred. Our product development activities include the enhancement of existing products and the development of new products. Product development expenses for fiscal years 2007, 2006 and 2005 were $15,627, $11,172 and $10,499, respectively. Advertising costs: We expense advertising costs as incurred. Advertising expenses for fiscal years 2007, 2006 and 2005 were $1,345, $1,624 and $1,067, respectively.
Shipping and handling costs: We record shipping and handling costs as a component of cost of sales at the time the product is shipped. Segment reporting: Our chief operating decision maker reviews financial information presented on a consolidated basis, accompanied by disaggregated information about revenue and certain expenses, by market and geographic region, for purposes of assessing financial performance and making operating decisions. Accordingly, we consider ourselves to be operating in a single industry segment. We do not maintain information on sales by products and, therefore, disclosure of such information is not practical.

42
The following table presents information about us by geographic area:
United States Other areas TotalNet sales for the fiscal year ended:
April 28, 2007 389,210$ 43,991$ 433,201$ April 29, 2006 278,136 31,234 309,370 April 30, 2005 206,009 24,337 230,346
Long-lived assets as of:April 28, 2007 84,746$ 1,380$ 86,126$ April 29, 2006 39,446 1,113 40,559 April 30, 2005 29,597 1,456 31,053
We are not economically dependent on a limited number of customers for the sale of our products and
services because we have numerous customers world-wide. For the year ended April 28, 2007, we had sales to one customer totaling approximately 10% of total sales. We are not economically dependent on a limited number of suppliers for the inventory items because we have numerous suppliers world-wide. For the year ended April 28, 2007, we had purchases from one supplier which approximated 11% of our total cost of goods sold. Earnings per share (EPS): Basic EPS is computed by dividing income available to common shareholders by the weighted average number of common shares outstanding for the period. Diluted EPS reflects the potential dilution that would occur if securities or other obligations to issue common stock were exercised or converted into common stock or resulted in the issuance of common stock that then shared in our earnings. A reconciliation of the income and common stock share amounts used in the calculation of basic and diluted EPS for the years ended April 28, 2007, April 29, 2006 and April 30, 2005 follows.
Net Income SharesPer Share Amount
Basic EPS 24,427$ 39,223 0.62$ Effect of dilutive securities:
Exercise of outstanding stock options - 2,088 (0.03) Diluted EPS 24,427$ 41,311 0.59$
Basic EPS 20,961$ 38,636 0.54$ Effect of dilutive securities:
Exercise of outstanding stock options - 1,870 (0.02) Diluted EPS 20,961$ 40,506 0.52$
For the year ended April 30, 2005:Basic EPS 15,660$ 37,954 0.41$ Effect of dilutive securities:
Exercise of outstanding stock options - 2,320 (0.02) Diluted EPS 15,660$ 40,274 0.39$
For the year ended April 28, 2007:
For the year ended April 29, 2006:
Options outstanding of 332 shares of common stock and weighted average share prices of $34.07 during
the year ended April 28, 2007 were not included in the computation of diluted earnings per share because the exercise price of those instruments exceeded the average market price of the common shares during the year.
Options outstanding of 362 shares of common stock and weighted average share prices of $13.60 during
the year ended April 29, 2006 were not included in the computation of diluted earnings per share because the exercise price of those instruments exceeded the average market price of the common shares during the year.
Options outstanding of 360 shares of common stock and weighted average share prices of $12.84 during
the year end of April 30, 2005 were not included in the computation of diluted earnings per share because the exercise price of those instruments exceeded the average market price of the common shares during the year.

43
On May 25, 2006, our Board of Directors declared a two-for-one stock split in the form of a stock dividend payable to stockholders of record on June 8, 2006. All data related to common shares has been retroactively adjusted based on the new shares outstanding after the effect of the split for all periods presented. Stock-based compensation: Prior to April 30, 2006, we accounted for share-based employee compensation plans under the measurement and recognition provisions of Accounting Principles Board (APB) Opinion No. 25, “Accounting for Stock Issued to Employees,” and related Interpretations, as permitted by SFAS No. 123, “Accounting for Stock-Based Compensation.” Accordingly, we recorded no share-based compensation expense for options granted under our current stock option plans during the twelve months ended April 29, 2006 and April 30, 2005, as all options granted under those plans had exercise prices equal to the fair market value of our common stock on the date of grant. We also recorded no compensation expense in those periods in connection with our employee stock purchase plan, as the purchase price of the stock was not less than 85% of the lower of the fair market value of our common stock at the beginning and end of each offering period. In accordance with SFAS No. 123 and SFAS No. 148, “Accounting for Stock-Based Compensation – Transition and Disclosure,” we provided pro forma net income and net income per share disclosures for each of those periods as if we had applied the fair value-based method in measuring compensation expense for our share-based compensation plans. Effective April 30, 2006, we adopted the fair value recognition provisions of SFAS No. 123(R) using the modified prospective transition method. Under that transition method, we recognized compensation expense for share-based payments that vested during the twelve months ended April 28, 2007 using the following valuation methods: (a) for share-based payments granted prior to but not yet vested as of April 30, 2006, the grant date fair value was estimated in accordance with the original provisions of SFAS No. 123 and (b) for share-based payments granted on or after April 30, 2006, the grant date fair value was estimated in accordance with the provisions of SFAS No. 123(R.) Because we elected to use the modified prospective transition method, results for prior periods have not been restated. In March 2005, the Securities and Exchange Commission (“SEC”) issued Staff Accounting Bulletin (SAB) No. 107, “Share-Based Payment,” which provides supplemental implementation guidance for SFAS No. 123(R.) We have applied the provisions of SAB No. 107 in our adoption of SFAS No. 123(R.) See Note 11 for information on the impact of our adoption of SFAS No. 123(R) and the assumptions we use to calculate the fair value of share-based employee compensation. Recent Accounting Pronouncements: In June 2006, the Financial Accounting Standards Board (“FASB”) issued Interpretation No. (“FIN”) 48, “Accounting for Uncertainty in Income Taxes,“ which clarifies the accounting for uncertainty in income taxes recognized in accordance with SFAS No. 109, “Accounting for Income Taxes.” FIN 48 prescribes a recognition threshold and measurement attribute for the financial statement recognition and measurement of a tax position taken or expected to be taken in a tax return. FIN 48 also provides guidance on derecognition, classification, interest and penalties, accounting in interim periods and disclosure. FIN 48 is effective for fiscal years beginning after December 15, 2006 and is required to be adopted by us effective April 29, 2007. We are currently evaluating the impact of FIN 48 on our financial statements. In February 2006, the FASB issued SFAS No. 155, "Accounting for Certain Hybrid Financial Instruments." SFAS No. 155 amends SFAS No.133, “Accounting for Derivative Instruments and Hedging Activities,” and No.140, “Accounting for Transfers and Servicing of Financial Assets and Extinguishments of Liabilities.” SFAS No. 155 resolves issues addressed in SFAS No. 133 Implementation Issue No. D1, "Application of Statement 133 to Beneficial Interests in Securitized Financial Assets." SFAS No.155 is effective for all financial instruments acquired or issued after the beginning of an entity's first fiscal year that begins after September 15, 2006. The fair value election provided for in paragraph 4(c) of SFAS No.155 may also be applied upon adoption of SFAS No.155 for hybrid financial instruments that had been bifurcated under paragraph 12 of SFAS No. 133 prior to the adoption of SFAS No. 155. Earlier adoption is permitted as of the beginning of an entity's fiscal year, provided the entity has not yet issued financial statements, including financial statements for any interim period for that fiscal year. Provisions of SFAS No. 155 may be applied to instruments that an entity holds at the date of adoption on an instrument-by-instrument basis. Adoption is not expected to have a material impact on our consolidated earnings, financial position or cash flows. In February 2007, the FASB issued SFAS No. 159, "The Fair Value Option for Financial Assets and Liabilities." SFAS No. 159 permits entities to choose to measure many financial instruments and certain other items at fair value. The objective is to improve financial reporting by providing entities with the opportunity to mitigate volatility in reported earnings caused by measuring related assets and liabilities differently without having

44
to apply complex hedge accounting provisions. SFAS No. 159 is expected to expand the use of fair value measurement, which is consistent with FASB’s long-term measurement objectives for accounting for financial instruments. SFAS No. 159 is effective for financial statements issued for fiscal years beginning after November 15, 2007 and interim periods within those fiscal years. Earlier application is encouraged, provided that the reporting entity has not yet issued financial statements for that fiscal year, including financial statements for an interim period within that fiscal year. Adoption is not expected to have a material impact on our consolidated earnings, financial position or cash flows. In September 2006, the FASB issued SFAS No. 157, “Fair Value Measurement.” SFAS No. 157 provides guidance for using fair value to measure assets and liabilities. SFAS No. 157 clarifies the principle that fair value should be based on the assumptions that market participants would use when pricing an asset or liability and establishes a fair value hierarchy that prioritizes the information used to develop those assumptions. Under SFAS No, 157, fair value measurements would be separately disclosed by level within the fair value hierarchy. SFAS No. 157 is effective for us beginning in fiscal year 2008; however, early adoption is permitted. We have not yet determined the impact, if any, that the implementation of SFAS No. 157 will have on our results of operations and financial condition.
In September 2006, the SEC issued SAB No. 108 “Considering the Effects of Prior Year Misstatements when Quantifying Misstatements in Current Year Financial Statements” (SAB No. 108.) SAB No. 108 provides interpretive guidance on how the effects of the carryover or reversal of prior year misstatements should be considered in quantifying a current year misstatement. The SEC staff believes that registrants should quantify errors using both a balance sheet and an income statement approach and evaluate whether either approach results in quantifying a misstatement that, when all relevant quantitative and qualitative factors are considered, is material. SAB No. 108 is effective for fiscal years ending on or after November 15, 2006, with early application encouraged. The adoption of this standard did not have any impact on our consolidated financial statements. Note 2. Acquisitions
During the first quarter of fiscal year 2007, we acquired a 50% equity interest in Arena Media Networks LLC, a company that owns and operates the nation’s largest network of digital flat-panel displays in stadiums and arenas across the U.S. We paid approximately $6,000 for the investment and we account for this transaction under the equity method of accounting.
During the second quarter of fiscal year 2007, we acquired a 50% interest in FuelCast Media
International, the largest pump-top display network in the nation. We paid approximately $4,000 for the investment and we account for this transaction under the equity method of accounting.
During the second quarter of fiscal year 2007, we acquired certain operating assets and liabilities of
Hoffend & Sons, Inc. through a wholly-owned subsidiary. The business operates under the name Vortek, a division of Daktronics Hoist, Inc. Results of the operations of Vortek have been included in the consolidated financial statements since the date of acquisition. We have not made Proforma disclosures, as the results of operations are not material to the consolidated financial statements. Hoffend was the world’s leading supplier of patented hoist systems for theater and sporting facilities and has been a supplier of ours in connection with center hung arena systems. The aggregate purchase price, excluding contingent consideration, was approximately $4,270 and includes $500 due one year from the closing date. Contingent consideration of $1,500 is due over the three calendar years following the closing date to the extent the gross profit on net sales of hoist products exceed predefined thresholds. In addition, contingent payments are due at the end of the fifth calendar year following closing to the extent gross profit on net sales of hoist products exceeds $50,000. The following table summarizes the allocation of the purchase price along with the related amortization periods, if any:

45
Amount Allocated Amortization Period
Patents 2,282$ 10 yearsOrder backlog 300 Based on order ship datesNon-compete agreements 200 5 years
Registered trademarks 401 Goodwill 1,514
Net assets (liabilities) (427) Total purchase price 4,270$
Intangible assets subject amortization:
Intangible assets not subject amortization:
The goodwill is expected to be deductible for tax purposes. During the year ended April 29, 2006, we acquired the assets of two companies. The aggregate cost of
these acquisitions was $240. No goodwill was recognized on these assets. On November 30, 2004, we acquired all of the assets and assumed certain liabilities of Dodge
Electronics, Inc. (“Dodge”) and, on December 14, 2004, we acquired 100% of the outstanding stock of European Timing Systems, Ltd. Our consolidated statements of income include the results of operations of these acquisitions since the respective acquisition dates. Both acquisitions were paid for in cash and the related acquisition agreements contain provisions for contingent consideration based on the gross profit of future transactions connected with each business. The amount of the contingent consideration is not expected to be significant and will be treated as compensation expense as it becomes earned. The aggregate cost of these acquisitions was $1,024. Goodwill in the amount of $1,126 was recognized and $515 of that amount is expected to be fully deductible for tax purposes. Because these transactions are not material to us, no pro forma disclosures have been made. Note 3. Equipment Held for Sale In accordance with SFAS No. 144, “Accounting for the Impairment or Disposal of Long-Lived Assets,” we review long-lived assets to be held and used and long-lived assets to be disposed of, including intangible assets, for impairment whenever events or changes in circumstances indicate that the carrying amount of such assets may not be recoverable. Recoverability of assets to be held and used is measured by comparing the carrying amount of the asset to the future undiscounted net cash flows expected to be generated by the asset. Recoverability of assets held for sale is measured by comparing the carrying amount of the assets to their estimated fair market value. If any assets are considered to be impaired, the impairment is measured by the amount by which the carrying amount of the assets exceeds the estimated fair value.
Impairment of long-lived assets: We recorded a pre-tax asset impairment charge of $340 and $581 for the years ended April 28, 2007 and April 29, 2006, respectively. The impairment charges related to technology changes in our demonstration equipment and tooling equipment. Impairment charges are included in selling expenses and cost of goods sold. As of April 28, 2007 and April 29, 2006, $188 and $286, respectively, consisting primarily of rental equipment, was classified as equipment held for sale.
During the second quarter of fiscal year 2005, we entered into a plan to sell the rental equipment owned by a wholly-owned subsidiary to allow us to focus more on sales of our new line of ProTour® displays and to provide deeper support to the display rental market. As a result, this equipment was classified in the balance sheet as rental equipment held for sale and, based on our analysis of recoverability, no loss had been recognized related to the equipment in accordance with SFAS No. 144. The business of equipment rental was not included within discontinued operations because it does not meet the requirement of SFAS No. 144, as we will continue to have involvement in rental operations through support of other rental companies in a similar fashion, primarily with redesigned products. During fiscal year 2006, the sale and related costs of sales of the equipment were reported in income from operations.

46
Note 4. Selected Financial Statement Data
April 28, April 29,2007 2006
Raw materials 22,830$ 15,841$ Work-in-process 14,503 6,025 Finished goods 8,502 9,179
45,835$ 31,045$
$2,544 and $1,912 as of April 28, 2007 and April 29, 2006, respectively.
April 28, April 29,2007 2006
Land 3,275$ 1,223$ Buildings 36,822 20,470 Machinery and equipment 38,420 22,332 Office furniture and equipment 37,520 22,926 Equipment held for rent 2,600 2,182 Demonstration equipment 5,939 4,899 Transportation equipment 6,669 4,863
131,245 78,895 Less accumulated depreciation 45,119 38,336
86,126$ 40,559$
April 28, April 29,2007 2006
Product warranty 7,711$ 5,305$ Compensation 3,743 5,043 Taxes, other than income taxes 7,513 2,874 Other 2,882 2,174
21,849$ 15,396$
Inventories consist of the following:
Accrued expenses consist of the following:
We report inventories, net of the allowance for excess and obsolete inventory of
Property and equipment consist of the following:
Non-operating expenses consist of the following:
April 28, April 29, April 30,2007 2006 2005
Interest income (expense): Interest income 1,811$ 1,843$ 1,453$ Interest expense (725) (141) (211)
1,086 1,702 1,242
Other income (expenses):Foreign currency transaction income (losses) 398$ (53)$ -$ Equity in earnings and losses of affiliates (2,027) - - Gain on sale of property and equipment 148 65 6 Other 262 164 767
(1,219)$ 152$ 768$
Year Ended

47
Note 5. Marketable Securities The following is a summary of marketable securities:
Cost
Gross Unrealized
Gains (Losses)
Est. Fair Value Cost
Gross Unrealized
Gains (Losses)
Est. Fair Value
Government debtsecurities - non U.S. -$ -$ -$ 8,310$ -$ 8,310$
April 28, 2007 April 29, 2006
Proceeds from sales of available-for-sale securities were $30,160 and $43,450 for the years ended April 28, 2007 and April 29, 2006, respectively. Purchases of available-for-sale securities were $38,460 and $43,655 for the years ended April 28, 2007 and April 29, 2006. The fair value of available-for-sale investments in debt securities by contractual maturity at April 29, 2006 was $8,310, with maturity dates of five to 10 years. Note 6. Uncompleted Contracts
Uncompleted contracts consist of the following:
April 28, April 29,2007 2006
Costs incurred 167,949$ 162,569$ Estimated earnings 60,113 56,053
228,062 218,622 Less billings to date 224,041 221,007
4,021$ (2,385)$
Uncompleted contracts are included in the accompanying consolidated balance sheets as follows:
April 28, April 29,2007 2006
Costs and estimated earnings in excess of billings 22,314$ 17,375$ Billings in excess of costs and estimated earnings (18,293) (19,760)
4,021$ (2,385)$
Note 7. Receivables
We sell our products throughout the United States and certain foreign countries on credit terms that we establish for each customer. On the sale of certain products, we have the ability to file a contractor’s lien against the product installed as collateral. Foreign sales are at times secured by irrevocable letters of credit. Accounts receivable are reported net of an allowance for doubtful accounts of $1,591 and $1,241 at April 28, 2007 and April 29, 2006, respectively. We make estimates regarding the collectability of our accounts receivable, long-term receivables, costs and estimated earnings in excess of billings and other receivables. In evaluating the adequacy of our allowance for doubtful accounts, we analyze specific accounts receivable balances, customer creditworthiness, changes in customer payment cycles and current economic trends. If the financial condition of any customer was to deteriorate, resulting in an impairment of its ability to make payments, additional allowances may be required. We charge off receivables at such time as it is determined that collection will not occur.

48
In connection with certain sales transactions, we have entered into long-term sales contracts and sales type leases. The present value of the contract or lease is recorded as a receivable upon the installation and acceptance of the equipment and profit is recognized to the extent that the present value is in excess of cost. We generally retain a security interest in the equipment or in the cash flow generated by the equipment until the contract is paid. Long-term contract and lease receivables, including accrued interest and current maturities, were $18,042 and $13,232 as of April 28, 2007 and April 29, 2006, respectively. Contract and lease receivables bearing annual interest at rates of 5.0% to 13.5% are due in varying annual installments through April 2017. The face amount of long-term receivables was $22,299 as of April 28, 2007 and $15,591 as of April 29, 2006. Included in accounts receivable as of April 28, 2007 was $843 of retainage on long-term contracts, all of which is expected to be collected in one year. Note 8. Financing Agreements Long-term debt: Long-term debt consists of the following:
April 28, April 29,2007 2006
0% mortgage, due in annual installments of $538, including interest through November 2008, secured by land 1,005$ -$
7.5% note payable due to bank, due in monthlyinstallments of $11, including interest through July 2007, secured by equipment 12 51
Other 131 194 1,148$ 245$
Less current maturities 556 114 Total long-term debt 592$ 131$
The future maturities on long-term debt consist of the following:
Fiscal years ending: Amount 2008 $ 5562009 5422010 252011 25
$ 1,148
Credit agreements: We have a credit agreement with a bank which provides for a $45,000 line of credit and includes up to $10,000 for standby letters of credit. The interest rate on the line of credit ranges from LIBOR plus 75 basis points to LIBOR plus 125 basis points depending on certain ratios. The effective interest rate was 5.8% at April 28, 2007. Starting January 23, 2007, a facility fee equal to 0.1% per annum of any non-used portion of the loan is required under the credit agreement. The line of credit is due on November 15, 2008. As of April 28, 2007, $24,615 was advanced on the line of credit and, as of April 29, 2006, no advances under the line of credit were outstanding. The credit agreement is unsecured and requires us to comply with certain covenants, including the maintenance of tangible net worth of at least $75,000, a minimum liquidity ratio, a limit on dividends and distributions and a minimum adjusted fixed charge coverage ratio. Daktronics Canada, Inc. has a credit agreement with a bank that provides for a $350 line of credit. The line of credit is due on April 30, 2008. The interest rate on the line of credit is equal to 1.5% above the prime rate of interest and was 6.00% at April 28, 2007. As of April 28, 2007 and April 29, 2006, no advances under the line of credit were outstanding. The line of credit is secured primarily by accounts receivables, inventory and other assets of the subsidiary.

49
Note 9. Shareholders’ Equity and Share-Based Compensation Common stock: On August 16, 2006, our shareholders approved an amendment to the articles of incorporation to increase the authorized number of shares from 60,000 to 120,000. Our authorized shares of 120,000 consist of 115,000 shares of common stock and 5,000 shares of “undesignated stock.” Our Board of Directors has the power to issue any or all of the shares of undesignated stock, including the authority to establish the rights and preferences of the undesignated stock, without shareholder approval. During the fiscal year ended May 1, 1999, we declared a dividend of one preferred share purchase right for each outstanding share of our common stock. The dividend was paid on December 9, 1998 to the stockholders of record on such date. Each right entitles the registered holder to purchase from us one one-hundredth of a share of Series A Junior Participating Preferred Stock at a price of $160 per one-hundredth of a preferred share, subject to the terms of the shareholder rights agreement pursuant to which the dividend was declared and paid. The rights become exercisable immediately after the earlier of (i) 10 business days following a public announcement that a person or group has acquired beneficial ownership of 20% or more of the outstanding common shares (subject to certain exclusions) or (ii) 10 business days following the commencement or announcement of an intention to make a tender offer or exchange offer, the consummation of which would result in the beneficial ownership by a person or group of 20% or more of our outstanding common shares. The rights expire on November 19, 2008, which date may be extended by our Board subject to certain additional conditions. Common stock warrants: In connection with the acquisition of a business in fiscal 2000, we issued warrants to purchase up to 88 shares of common stock at an exercise price of $6.32 per share. The warrants were exercisable at any time through December 29, 2006. During fiscal year 2007, warrants to purchase 13 shares of common stock were exercised and, as of April 29, 2006, all of these warrants had been exercised and there were none outstanding. Stock option plans: During fiscal year 2002, we established the 2001 Incentive Stock Option Plan and the 2001 Outside Directors Option Plan (“2001 Plans”) and ceased granting options under the 1993 Incentive Stock Option Plan, as amended and the 1993 Outside Directors Option Plan, as amended (“1993 Plans”.) The 2001 Plans and the 1993 Plans authorize awards of incentive stock options to our employees and nonqualified stock options to non-employees and outside directors as compensation for services rendered. Options granted have a maximum term of 10 years in the case of the 2001 Incentive Stock Option Plan and 1993 Incentive Stock Option Plan and seven years in the case of the Outside Directors Stock Option Plan and the 1993 Director Stock Option Plan. In addition, such options must have exercise prices equal to the market value of our common stock at the date of grant or 110% of market value at the date of grant in the case of an employee who owns more than 10% of all voting power of all classes of our stock then outstanding. The options generally vest ratably over a five-year period in the case of options granted under the 2001 Incentive Stock Option Plans and over a three-year period in the case of options granted under the 2001 Outside Directors Option Plans. Under the 2001 Plans and the 1993 Plans, the actual period of vesting is determined at the time of the grant. The total number of shares of stock reserved and available for distribution under the 2001 Incentive Stock Option Plan and the 2001 Outside Directors Plan are 2,400 and 800 shares, respectively. At April 28, 2007, there were 707 shares available for granting options under the 2001 Plans. The total number of shares reserved under the 1993 Plans was 6,080 shares. Although the 1993 Plans remain in effect for options outstanding, no new options can be granted under the 1993 Plans. A summary of the status of the plans at the end of fiscal years 2007, 2006 and 2005 and changes during the fiscal years then ended follows:

50
Stock Options
Weighted Average Exercise Price per
ShareStock
Options
Weighted Average Exercise Price per
ShareStock
Options
Weighted Average Exercise Price per
ShareOutstanding at beginning of year 3,292 6.31$ 3,451 4.92$ 3,538 3.61$
Granted 381 32.65 416 13.25 408 12.65 Cancelled or forfeited (22) 2.79 (53) 6.20 (9) 1.91 Exercised (561) 12.32 (522) 2.65 (486) 4.18
Outstanding at end of year 3,090 10.13 3,292 6.31 3,451 4.92
Options for 1,973, 2,136 and 2,246 shares were exercisable at April 28, 2007, April 29, 2006 andApril 30, 2005, respectively. The weighted average fair value of options granted were $11.12, $5.37 and $5.06for the years ended April 29, 2007, April 29, 2006 and April 30, 2005, respectively.
Year EndedApril 28, 2007 April 30,2005April 29, 2006
Employee Stock Purchase Plan: We also have an employee stock purchase plan (“ESPP”), which enables employees to contribute up to 10% of their compensation toward the purchase of our common stock at the end of the participation period at a purchase price equal to 85% of the lower of the fair market value of the common stock on the first or last day of the participation period. Common stock reserved for future employee purchases under the plan totals 738 shares at April 28, 2007. Common stock issued under the plan totaled approximately 68 shares in fiscal year 2007, 72 shares in fiscal year 2006 and 62 shares in fiscal year 2005. Impact of the Adoption of SFAS No. 123(R.): See Note 2 for a description of our adoption of SFAS No. 123(R) effective on April 30, 2006. A summary of the share-based compensation expense for stock options and our ESPP that we recorded in accordance with SFAS No. 123(R) for the fiscal year ended April 28, 2007 is as follows:
April 28,2007
Cost of sales 150$ Selling 1,008 General and administrative 576 Product development and design 361
2,095$ Decrease of net income per share to common stockholders 0.05$
Prior to the adoption of SFAS No. 123(R), we presented all tax benefits for deductions resulting from the exercise of stock options as operating cash flows on our statement of cash flows. SFAS No. 123(R) requires the cash flows resulting from the tax benefits for tax deductions in excess of the compensation expense recorded for those options (excess tax benefits) to be classified as financing cash flows. Accordingly, we classified the $1,411 in excess tax benefits as financing cash inflows rather than as operating cash inflows on our statements of cash flows for the year ended April 28, 2007. Valuation and Amortization Method. We estimate the fair value of stock options granted using the Black-Scholes option valuation model. We amortize the fair value of the stock options on a straight-line basis. All options are amortized over the requisite service periods of the awards, which are generally the vesting periods. Expected Term. The expected term of options granted represents the period of time that they are expected to be outstanding. We estimate the expected term of options granted based on historical exercise patterns, which we believe are representative of future behavior. Our estimate of the expected life of new options granted to our employees is five years, consistent with prior periods. We have examined our historical pattern of option exercises in an effort to determine if there were any discernable patterns of activity based on certain

51
demographic characteristics. Demographic characteristics tested included age, salary level, job level and geographic location. We have determined that there were no meaningful differences in option exercise activity based on the demographic characteristics tested. Expected Volatility. In implementing SFAS No. 123(R), we reevaluated our expected volatility assumption used in estimating the fair value of employee options. We estimate the volatility of our common stock at the date of grant based on historical volatility, consistent with SFAS No. 123(R) and SAB No. 107. Our decision to use historical volatility instead of implied volatility was based upon analyzing historical data along with the lack of availability of history of actively traded options on our common stock. Risk-Free Interest Rate. We base the risk-free interest rate that we use in the Black-Scholes option valuation model on the implied yield in effect at the time of option grant on U.S. Treasury zero-coupon issues with equivalent remaining terms. Dividends. We use an expected dividend yield consistent with our dividend yield over the period of time we have paid dividends in the Black-Scholes option valuation model. Forfeitures. SFAS No. 123(R) requires us to estimate forfeitures at the time of grant and revise those estimates in subsequent periods if actual forfeitures differ from those estimates. We use historical data to estimate pre-vesting option forfeitures and record share-based compensation expense only for those awards that are expected to vest. For purposes of calculating pro forma information under SFAS No. 123 for periods prior to fiscal 2006, we estimated forfeitures. We used the following assumptions to estimate the fair value of options granted:
April 28, April 29, April 30,2007 2006 2005
Dividend yield 0.20% - 0.25% None NoneExpected volatility 36% - 39% 39% 38%Risk-free interest rate 4.7% - 4.8% 3.3% - 4.3% 3.1% - 3.6%Expected life of option 5 yr. 5 yr. 5 yr.
Year Ended
The Black-Scholes option-pricing model was developed for use in estimating the fair value of traded options that have no vesting restrictions and are fully transferable. In addition, option valuation models require the input of highly subjective assumptions, including the expected stock price volatility. Because changes in the subjective input assumptions can materially affect the fair value estimate, in our opinion, the existing models do not necessarily provide a reliable single value of our options and may not be representative of the future effects on reported net income or the future stock price of our company. Share-Based Compensation Expense and Stock Option Activity. We recorded $2,095 in share-based compensation expense, which consists of $1,851 for stock options and $243 for our ESPP, for the fiscal year ended April 28, 2007. As of April 28, 2007, there was $6,244 of total unrecognized compensation cost related to non-vested share-based compensation arrangements granted under all equity compensation plans. Total unrecognized compensation cost will be adjusted for future changes in estimated forfeitures. We expect to recognize that cost over a weighted average period of five years. During the fiscal year ended April 28, 2007, we granted options to purchase 48 shares of our common stock under the 2001 Directors Stock Option Plan, which had a fair value of $400 and granted options to purchase 333 shares of our common stock under the 2001 Incentive Stock Option Plan, which had a fair value of $4,141.
A summary of stock option activity under all stock option plans during the fiscal year ended April 28, 2007 is as follows:

52
Stock Options
Weighted Average
Exercise Price per Share
Weighted Average
Remaining Contractual Life (Years)
Aggregate Intrinsic Value
Outstanding at April 29, 2006 3,292 6.31$ 4.91 33,370$ Granted 381 32.65 - - Cancelled or forfeited (22) 12.32 - (305) Exercised (561) 2.79 - (13,139)
Outstanding at April 28, 2007 3,090 10.13 6.06 45,925 Shares vested and expected to vest 2,780 10.15 5.46 41,332 Exercisable at April 28, 2007 1,973 5.27$ 4.78 36,806$
April 28, 2007
We define in-the-money options at April 28, 2007 as options that had exercise prices that were lower than the $23.92 per share market price of our common stock at that date. The aggregate intrinsic value of options outstanding at April 28, 2007 is calculated as the difference between the exercise price of the underlying options and the market price of our common stock for the shares that were in-the-money at that date. There were 1,973 of in-the-money options exercisable at April 28, 2007. We received $1,565 in cash from option exercises under all share-based payment arrangements for the fiscal year ended April 28, 2007. The actual tax benefits that we realized related to tax deductions for non-qualified option exercises and disqualifying dispositions under all share-based payment arrangements totaled $1,856 for the same period. Comparable Disclosure. Prior to April 30, 2006, we accounted for our share-based compensation plans under the recognition and measurement provisions of APB Opinion No. 25 and related Interpretations. No share-based employee compensation cost is reflected in the condensed consolidated statements of operations for the fiscal year ended April 29, 2006 and April 30, 2005, as all options granted under those plans had an exercise price equal to the market value of the underlying common stock on the date of grant. The following table illustrates the effect on net income and net income per share if we had applied the fair value recognition provisions of SFAS No. 123 to share-based employee compensation prior to April 30, 2006:
April 29, April 30,2006 2005
Net income, as reported 20,961$ 15,660$ Deduct: Total stock-based employee compensation
expense determined under fair value based method for all awards, net of related tax effects (778) (650)
Pro forma net income 20,183$ 15,010$ Net income per share:Basic as reported 0.54$ 0.41$ Basic – pro forma 0.52$ 0.40$ Diluted as reported 0.52$ 0.39$ Diluted – pro forma 0.50$ 0.38$
Year Ended
Note 10. Employee Benefit Plans We have an employee savings plan, which provides for voluntary contributions by eligible employees into designated investment funds with a matching contribution by us equal to 50% of the employee’s qualifying contribution up to 6% of such employee’s compensation plus other discretionary contributions as authorized by our Board of Directors. Employees are eligible to participate upon completion of one year of service if they have attained the age of 21 and have worked more than 1,000 hours during such plan year. We contributed $1,532, $1,329 and $1,048 to the plan for the fiscal years 2007, 2006 and 2005, respectively.

53
Our ESPP is intended to qualify under Section 423 of the Internal Revenue Code. It allows employees to purchase shares of our common stock, subject to annual limitations, at a price equal to of 85% of the lower of the fair market value of the common stock at the beginning or the end of each six-month offering period. The total number of shares reserved under this plan is 1,000 shares. We issued 67 and 72 shares during the fiscal years ended April 28, 2007 and April 29, 2006. As of April 28, 2007, participants in the plan had accumulated $613 to purchase our stock. We have unfunded deferred compensation agreements with certain officers and a founding director wherein each year interest is credited to each participant’s account in an amount equal to the five-year treasury note rate as of January 1 of each plan year. Total amounts accrued for these plans as of April 28, 2007 and April 29, 2006 were $619 and $600, respectively. Contributions for each of the fiscal years ending April 28, 2007 and April 29, 2006 were $20 respectively. The amounts accrued under the plans are not funded and are subject to the claims of creditors. Participants may elect various forms of withdrawals upon retirement, including a lump sum distribution or annual payments over five or 10 years. Note 11. Income Taxes Income tax expense consists of the following:
April 28, April 29, April 30,2007 2006 2005
CurrentFederal 11,543$ 13,492$ 4,315$ State 1,896 1,958 1,116
Deferred taxes (credits) (1,084) (2,742) 355 12,355$ 12,708$ 5,786$
Year Ended
The components of the net deferred tax asset are as follows:
April 28, April 29, April 30,2007 2006 2005
Deferred taxes assets:Project warranty accrual 5,713$ 4,252$ 3,090$ Vacation accrual 1,117 869 821 Reserves for excess and obsolete inventory 1,012 761 944 Allowance for doubtful accounts 574 484 376 Amortization of intangible assets 247 275 441 Net operating loss carry forwards 90 101 596 Other accruals and deferrals 41 308 201 Other 354 501 140
9,148 7,551 6,609 Deferred tax liabilities:
Property and equipment 3,880 2,705 4,184$ 5,268$ 4,846$ 2,425$
The following presents the classification of the net deferred tax asset on the accompanying consolidated
balance sheets:
April 28, April 29, April 30,2007 2006 2005
Current assets 7,761$ 6,213$ 5,076$ Noncurrent assets 136 232 782$ Noncurrent liabilities 2,629 1,599 3,433$
5,268$ 4,846$ 2,425$
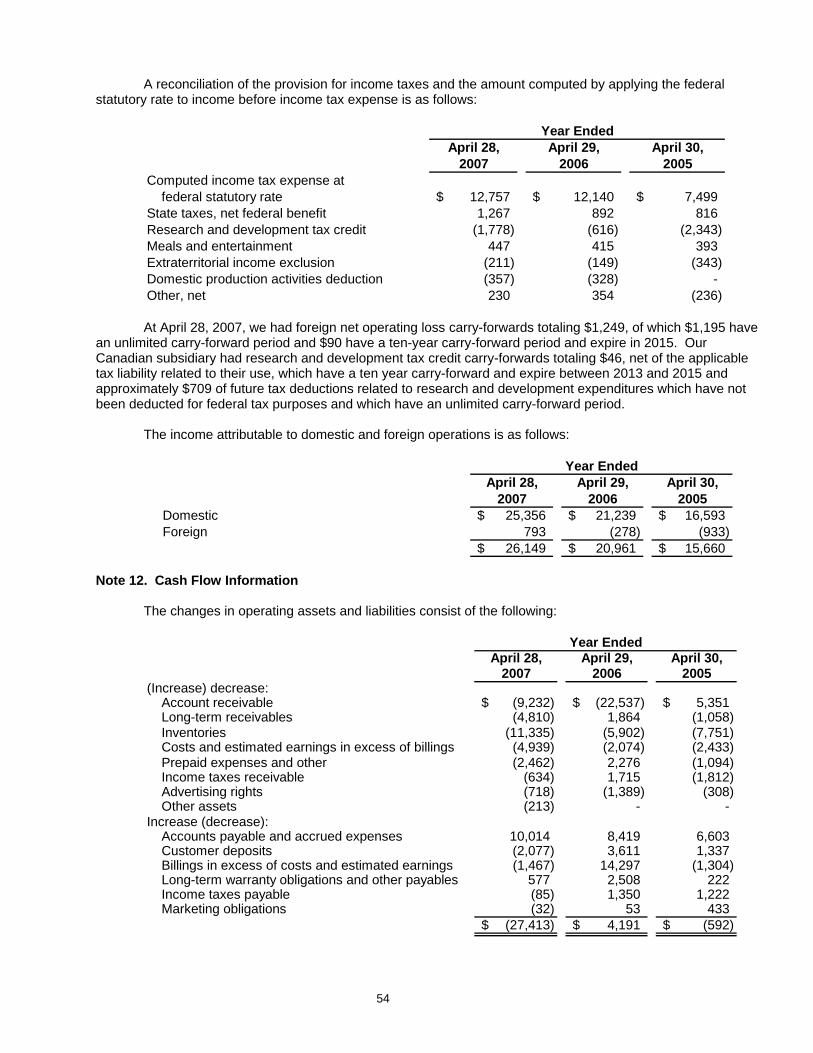
54
A reconciliation of the provision for income taxes and the amount computed by applying the federal statutory rate to income before income tax expense is as follows:
April 28, April 29, April 30,2007 2006 2005
Computed income tax expense at federal statutory rate 12,757$ 12,140$ 7,499$
State taxes, net federal benefit 1,267 892 816 Research and development tax credit (1,778) (616) (2,343) Meals and entertainment 447 415 393 Extraterritorial income exclusion (211) (149) (343) Domestic production activities deduction (357) (328) - Other, net 230 354 (236)
Year Ended
At April 28, 2007, we had foreign net operating loss carry-forwards totaling $1,249, of which $1,195 have
an unlimited carry-forward period and $90 have a ten-year carry-forward period and expire in 2015. Our Canadian subsidiary had research and development tax credit carry-forwards totaling $46, net of the applicable tax liability related to their use, which have a ten year carry-forward and expire between 2013 and 2015 and approximately $709 of future tax deductions related to research and development expenditures which have not been deducted for federal tax purposes and which have an unlimited carry-forward period.
The income attributable to domestic and foreign operations is as follows:
April 28, April 29, April 30,2007 2006 2005
Domestic 25,356$ 21,239$ 16,593$ Foreign 793 (278) (933)
26,149$ 20,961$ 15,660$
Year Ended
Note 12. Cash Flow Information The changes in operating assets and liabilities consist of the following:
April 28, April 29, April 30,2007 2006 2005
Account receivable (9,232)$ (22,537)$ 5,351$ Long-term receivables (4,810) 1,864 (1,058) Inventories (11,335) (5,902) (7,751) Costs and estimated earnings in excess of billings (4,939) (2,074) (2,433) Prepaid expenses and other (2,462) 2,276 (1,094) Income taxes receivable (634) 1,715 (1,812) Advertising rights (718) (1,389) (308) Other assets (213) - -
Increase (decrease):Accounts payable and accrued expenses 10,014 8,419 6,603 Customer deposits (2,077) 3,611 1,337 Billings in excess of costs and estimated earnings (1,467) 14,297 (1,304) Long-term warranty obligations and other payables 577 2,508 222 Income taxes payable (85) 1,350 1,222 Marketing obligations (32) 53 433
(27,413)$ 4,191$ (592)$
Year Ended
(Increase) decrease:

55
Supplemental disclosures of cash flow information consist of the following:
April 28, April 29, April 30,2007 2006 2005
Interest 507$ 116$ 191$ Income taxes, net of refunds 11,846 12,229 6,747
Year Ended
Cash payments for:
Supplemental schedule of non-cash investing and financing activities consist of the following:
April 28, April 29, April 30,2007 2006 2005
Demonstration equipment transferred to inventories 2,729$ 423$ $ -Tax benefits related to exercise of stock options 1,411 796 410 Business acquired through long-term debt - 75 - Contributions of common stock under the employee
stock purchase plan 837 625 498 Purchase of plant and equipment included in accounts
payable and notes payable 2,716 - - Transfer of equipment to affiliates 225 - -
Year Ended
Note 13. Fair Value of Financial Instruments The carrying amounts reported on the balance sheets for cash and cash equivalents approximate their fair values due to the highly liquid nature of the instruments. The fair values for fixed-rate contracts receivable are estimated using discounted cash flow analyses based on interest rates currently being offered for contracts with similar terms to customers with similar credit quality. The carrying amounts reported on the balance sheets for contracts receivable approximate fair value. Fair values for our off-balance-sheet instruments (contingent liability for contracts sold with recourse and the contingent liability for the guarantee of debt) are not significant. The notes payable, bank, are variable rate notes that reprice frequently. The fair value on these notes approximates their carrying values. The carrying amounts reported for variable rate long-term debt approximate fair value. Fair values for fixed-rate long-term debt are estimated using a discounted cash flow calculation that applies interest rates currently being offered for debt with similar terms and underlying collateral. The total carrying value of long-term debt reported on the balance sheets approximates fair value. The fair values of all outstanding derivative instruments were determined using quoted market prices. Note 14. Commitments and Contingencies In connection with the sale of equipment to a financial institution, we entered into a contractual arrangement whereby we agreed to repurchase equipment at the end of the lease term at a fixed price of approximately $1,100. We have recognized a guarantee in the amount of $200 under the provisions of FIN No. 45, “Guarantor’s Accounting and Disclosure Requirements for Guarantees, Including Indirect Guarantees of Indebtedness of Others.” Revenue related to this transaction of $4,774 was recognized during fiscal year 2007. We are involved in various claims and legal actions arising in the ordinary course of business. In the opinion of management, based upon consultation with legal counsel, the ultimate disposition of these matters will not have a material adverse effect on our consolidated financial position. We offer a standard parts coverage warranty for periods varying from one to five years for all of our products. We also offer additional types of warranties that include on-site labor, routine maintenance and event support. In addition, the length of warranty on some installations can vary from one to 10 years. The specific terms and conditions of these warranties vary primarily depending on the type of the product sold. We estimate the costs that may be incurred under the warranty and record a liability in the amount of such costs at the time the

56
product order is received. Factors that affect our warranty liability include historical and anticipated claims costs. We periodically assess the adequacy of our recorded warranty liabilities and adjust the amounts as necessary. Changes in our product warranties during the years ended April 28, 2007 and April 29, 2006 consisted of the following:
April 28, April 29,2007 2006
Balance at beginning of year 8,102$ 5,028$ Warranties issued during the period 11,358 6,566 Settlements made during the period (7,455) (4,618) Changes in liability for pre-existing warranties during
the period, including expirations (1,490) 1,126 Balance at end of year 10,515$ 8,102$
Year Ended
In connection with certain international transactions and long-term contracts, we have entered into various performance guarantees. As of April 28, 2007, we had outstanding $965 in standby letters of credit and $11,227 in outstanding surety bonds. Performance guarantees provided by standby letters of credit and performance bonds are issued to certain customers to guarantee the operation and installation of the equipment and to guarantee our ability to complete a contract. These performances guarantees have various terms, which are generally less than one year.
We lease office space for various sales and service locations throughout the world and various
equipment, primarily office equipment. Rental expense for operating leases amounted to $1,549, $1,311 and $1,201 at April 28, 2007, April 29, 2006 and April 30, 2005, respectively. Future minimum payments under noncancelable operating leases, excluding executory costs such as management and maintenance fees with initial or remaining terms of one year or more, consisted of the following at April 28, 2007:
Amount
2008 2,230$ 2009 1,873 2010 1,267 2011 1,102 2012 429
Thereafter 410 7,311$
Fiscal years ending
From time to time, we commit to purchase inventory and advertising rights over periods that extend over a year. As of April 28, 2007, we were obligated to purchase inventory and advertising rights through fiscal year 2010 as follows:
Amount2008 136$ 2009 88 2010 87
311$
Fiscal years ending
Note 15. Investments in Affiliates and Related Party Transactions
We own a 50% interest in FuelCast International, LLC and Arena Media Networks. FuelCast International, LLC operates a network of message centers at petroleum retailers. Arena Media Networks operates a national network of advertising displays at major league arenas. We also own a 49% interest in Ledtronics SDN BHD, which operates a display manufacturing and sales business utilizing our technology in Malaysia. Our equity investment balance in these investments was $8,762 and $582 as of April 28, 2007 and April 29, 2006, respectively.

57
Equity in earnings (losses) in these joint ventures was ($2,027) for the year ended April 28, 2007 and was immaterial for prior years. At April 28, 2007 and April 29, 2006, we had receivables from these affiliates in the amount of $2,397 and $249, respectively. The receivables result from transactions in the normal course of business and are included within accounts receivable. We also had $1,822 and $13 included in long-term receivables as of April 28, 2007 and April 29, 2006, respectively. During the years ended April 28, 2007, April 29, 2006 and April 30, 2005, we recorded revenues associated with equipment and service deliveries of $4,293, $1,577 and $1,277, respectively, relating to these related parties. We have no payables to these affiliates. However, we purchase inventory items from Ledtronics in the normal course of business. During the fiscal years ended April 28, 2007, April 29, 2006 and April 30, 2005, we purchased inventory items in the amount of $648, $860 and $821, respectively from Ledtronics.
Note 16. Quarterly Financial Data (Unaudited) The following table presents summarized quarterly financial data:
Fiscal Year 2007: 1st Quarter 2nd Quarter 3rd Quarter 4th QuarterNet sales 92,153$ 123,530$ 106,731$ 110,787$ Gross profit 26,375 35,487 32,336 32,379 Net income 4,987 8,891 7,027 3,521 Basic earnings per share 0.13 0.23 0.18 0.09 Diluted earnings per share 0.12 0.22 0.17 0.09
Fiscal Year 2006: 1st Quarter 2nd Quarter 3rd Quarter 4th QuarterNet sales 72,345$ 75,802$ 71,050$ 90,173$ Gross profit 22,194 22,317 22,026 27,537 Net income 4,632 5,185 4,041 7,103 Basic earnings per share 0.12 0.13 0.10 0.18 Diluted earnings per share 0.12 0.13 0.10 0.17
Item 9. CHANGES IN AND DISAGREEMENTS WITH ACCOUNTANTS ON ACCOUNTING AND FINANCIAL DISCLOSURE
None. Item 9A. CONTROLS AND PROCEDURES Evaluation of Disclosure Controls and Procedures
Management of our company is responsible for establishing and maintaining effective disclosure controls and procedures as defined under Rules 13a-15(e) and 15d-15(e) of the Securities Exchange Act of 1934. As of April 28, 2007, an evaluation was performed, under the supervision and with the participation of management, including our Chief Executive Officer and Chief Financial Officer, of the effectiveness of the design and operation of our disclosure controls and procedures. Based upon that evaluation, the Chief Executive Officer and Chief Financial Officer concluded that as of April 28, 2007, our disclosure controls and procedures were effective at the reasonable assurance level to ensure that information required to be disclosed in this Annual Report on Form 10-K was recorded, processed, summarized and reported within the time period required by the Securities and Exchange Commission’s rules and forms and accumulated and communicated to management, including our Chief Executive Officer and Chief Financial Officer, to allow timely decisions regarding required disclosure. Changes in Internal Control Over Financial Reporting
During the quarter ended April 28, 2007, there have been no changes in our internal control over financial reporting that materially affected, or are reasonably likely to materially affect, our internal control over financial reporting.

58
Management’s Report on Internal Control Over Financial Reporting
Our management is responsible for establishing and maintaining adequate internal control over financial reporting, as such term is defined in Rule 13a-15(f) under the Securities Exchange Act of 1934. Our internal control system was designed to provide reasonable assurance to our management and board of directors regarding the preparation and fair presentation of published financial statements. All internal control systems, no matter how well designed, have inherent limitations. Therefore, even those systems determined to be effective can provide only reasonable assurance with respect to financial statement preparation and presentation.
Under the supervision and with the participation of our management, including our Chief Executive Officer and Chief Financial Officer, we conducted an evaluation of the effectiveness of our internal control over financial reporting based on the framework in Internal Control—Integrated Framework issued by the Committee of Sponsoring Organizations of the Treadway Commission. Based on our evaluation under the framework in Internal Control—Integrated Framework, our management concluded that our internal control over financial reporting was effective as of April 28, 2007.
Our management’s assessment of the effectiveness of our internal control over financial reporting as of April 28, 2007 has been audited by Ernst & Young LLP, an independent registered public accounting firm, as stated in their report which is included herein on page 59.
James B. Morgan Chief Executive Officer June 22, 2007
William R. Retterath Chief Financial Officer June 22, 2007

59
REPORT OF INDEPENDENT REGISTERED PUBLIC ACCOUNTING FIRM The Board of Directors and Shareholders of Daktronics, Inc. We have audited management’s assessment, included in the accompanying Management Report on Internal Control over Financial Reporting, that Daktronics, Inc. (“the Company”) maintained effective internal control over financial reporting as of April 28, 2007, based on criteria established in Internal Control—Integrated Framework issued by the Committee of Sponsoring Organizations of the Treadway Commission (the COSO criteria.) The Company’s management is responsible for maintaining effective internal control over financial reporting and for its assessment of the effectiveness of internal control over financial reporting. Our responsibility is to express an opinion on management’s assessment and an opinion on the effectiveness of the Company’s internal control over financial reporting based on our audit. We conducted our audit in accordance with the standards of the Public Company Accounting Oversight Board (United States.) Those standards require that we plan and perform the audit to obtain reasonable assurance about whether effective internal control over financial reporting was maintained in all material respects. Our audit included obtaining an understanding of internal control over financial reporting, evaluating management’s assessment, testing and evaluating the design and operating effectiveness of internal control and performing such other procedures as we considered necessary in the circumstances. We believe that our audit provides a reasonable basis for our opinion. A company’s internal control over financial reporting is a process designed to provide reasonable assurance regarding the reliability of financial reporting and the preparation of financial statements for external purposes in accordance with generally accepted accounting principles. A company’s internal control over financial reporting includes those policies and procedures that (1) pertain to the maintenance of records that, in reasonable detail, accurately and fairly reflect the transactions and dispositions of the assets of the company; (2) provide reasonable assurance that transactions are recorded as necessary to permit preparation of financial statements in accordance with generally accepted accounting principles and that receipts and expenditures of the company are being made only in accordance with authorizations of management and directors of the company; and (3) provide reasonable assurance regarding prevention or timely detection of unauthorized acquisition, use, or disposition of the company’s assets that could have a material effect on the financial statements. Because of its inherent limitations, internal control over financial reporting may not prevent or detect misstatements. Also, projections of any evaluation of effectiveness to future periods are subject to the risk that controls may become inadequate because of changes in conditions, or that the degree of compliance with the policies or procedures may deteriorate. In our opinion, management’s assessment that Daktronics, Inc. maintained effective internal control over financial reporting as of April 28, 2007, is fairly stated, in all material respects, based on the COSO criteria. Also, in our opinion, Daktronics, Inc. maintained, in all material respects, effective internal control over financial reporting as of April 28, 2007, based on the COSO criteria. We have also audited, in accordance with the standards of the Public Company Accounting Oversight Board (United States), the consolidated balance sheets of Daktronics, Inc. as of April 28, 2007 and April 29, 2006 and the related consolidated statements of income, shareholders’ equity and cash flows for each of the three years in the period ended April 28, 2007 of Daktronics, Inc. and our report dated June 22, 2007 expressed an unqualified opinion thereon. /s/ ERNST & YOUNG LLP Minneapolis, Minnesota June 22, 2007

60
Item 9B. OTHER INFORMATION None PART III. Item 10. DIRECTORS AND EXECUTIVE OFFICERS OF THE REGISTRANT Information under the heading “Proposal One - Election of Directors” and “Section 16(a) Beneficial Ownership Reporting Compliance” in our Proxy Statement to be filed on or about June 22, 2007 is incorporated herein by reference. The information regarding executive officers is included in Part I, Item 1, of this report under the caption “Directors and Executive Officers of the Registrant.” Item 11. EXECUTIVE COMPENSATION Information regarding compensation of directors and officers for the fiscal year ended April 28, 2007 is in the Proxy Statement to be filed on or about June 22, 2007 under the heading “Proposal One -Election of Directors” and “Executive Compensation” and is incorporated herein by reference.
We maintain a Code of Conduct which applies to all of our employees, officers and Directors. Included in the Code of Conduct are ethics provisions that apply to our Chief Executive Officer, Chief Financial Officer and all other financial and accounting management employees. A copy of our Code of Conduct can be obtained from our Internet website at www.daktronics.com under the Investor Relations page and will be made available free of charge to any shareholder upon request. Information on or available through our website is not part of this report. We intend to disclose any waivers from, or amendments to, the Code of Conduct by posting a description of such waiver or amendment on our Internet website. However, to date we have not granted a waiver from the Code of Conduct. Item 12. SECURITY OWNERSHIP OF CERTAIN BENEFICIAL OWNERS AND MANAGEMENT AND RELATED STOCKHOLDER MATTERS The security ownership of certain beneficial owners and management is contained in the Proxy Statement to be filed on or about June 22, 2007 under the heading “Security Ownership of Certain Beneficial Owners and Management” and “Securities Authorized Under Equity Compensation Plans” and is incorporated herein by reference. Item 13. CERTAIN RELATIONSHIPS AND RELATED TRANSACTIONS AND DIRECTOR INDEPENDENCE
Information required by this item is incorporated by reference from the sections entitled “Proposal One – Election of Directors – Independent Directors” and “Corporate Governance Compensation Committee Interlocks and Insider Participation” contained in our Proxy Statement to be filed on or about June 22, 2007. There are no related party transactions. Item 14. PRINCIPAL ACCOUNTANT FEES AND SERVICES
Information regarding our principal accountant is under the heading “Relationship with Independent
Auditors” in our Proxy Statement to be filed on or about June 22, 2007. PART IV.
Item 15. EXHIBITS AND FINANCIAL STATEMENT SCHEDULES
(a)(1) Financial Statements Our financial statements, a description of which follows, are contained in Part II, Item 8: Report of Independent Registered Public Accounting Firm Consolidated Balance Sheets, April 28, 2007 and April 29, 2006 Consolidated Statements of Income for each of the three years in the period ended

61
April 28, 2007, April 29, 2006 and April 30, 2005 Consolidated Statements of Cash Flows for each of the three years in the period ended April 28, 2007, April 29, 2006 and April 30, 2005 Consolidated Statement of Changes in Shareholders’ Equity for each of the three years in the period
ended April 28, 2007, April 29, 2006 and April 30, 2005 Notes to Consolidated Financial Statements.
(2) Schedules
The following financial statement schedules are submitted herewith: SCHEDULE II – Valuation Accounts Other schedules are omitted because they are not required or are not applicable or because the required information is included in the financial statements listed above.
(3) Exhibits
Certain of the following exhibits are incorporated by reference from prior filings. The form with which each exhibit was filed and the date of filing are as indicated below. 3.1 Reserved. 3.2 Amended and Restated Articles of Incorporation of the Company. (1) 3.3 Amendment to the Articles of Incorporation. (2) 3.4 Amended and Restated Bylaws of the Company. (3) 4.1 Form of Stock Certificate evidencing Common Stock, without par value, of the Company. (4) 4.2 Shareholders Rights Agreement. (5) 4.3 2001 Incentive Stock Option Plan. (6)* 4.4 2001 Outside Directors Stock Option Plan. (6)* 4.5 Daktronics Inc. 2002 Employee Stock Purchase Plan. (7)* 10.1 Amended and Restated Deferred Compensation Agreement Between Daktronics, Inc. and Aelred
Kurtenbach. (8)* 10.2 Amended and Restated Deferred Compensation Agreement Between Daktronics, Inc. and Frank
Kurtenbach. (8)* 10.3 Amended and Restated Deferred Compensation Agreement Between Daktronics, Inc. and James
Morgan. (8)* 10.4 Amended and Restated Deferred Compensation Agreement Between Daktronics, Inc. and Duane
Sander. (8)* 21.1 Subsidiaries of the Company. (9) 23.1 Consent of Ernst & Young LLP. (9) 24. Power of Attorney. (9) 31.1 Certification of the Chief Executive Officer required by Rule 13a-14(a) or Rule 15d-14(a) under
the Securities Exchange Act of 1934, as adopted pursuant to Section 302 of the Sarbanes-Oxley Act of 2002. (9)
31.2 Certification of the Chief Financial Officer required by Rule 13a-14(a) or Rule 15d-14(a) under the Securities Exchange Act of 1934, as adopted pursuant to Section 302 of the Sarbanes-Oxley Act of 2002. (9)
32.1 Certification of the Chief Executive Officer pursuant to Section 906 of the Sarbanes-Oxley Act of 2002 (18 U.S.C. Section 1350.) (9)
32.2 Certification of the Chief Financial Officer pursuant to Section 906 of the Sarbanes-Oxley Act of 2002 (18 U.S.C. Section 1350.) (9)
_____________ (1) Incorporated by reference to the exhibit with the same exhibit number filed with our
Registration Statement on Form S-1 on December 3, 1993. (2) Incorporated by reference to the exhibit with the same exhibit number filed with our
Annual Report on Form 10-K on July 28, 1999. (3) Incorporated by reference to Exhibit 3.1 filed with our Current Report on Form 8-K on
August 18, 2005.

62
(4) Incorporated by reference to the exhibit with the same exhibit number filed with our Amendment No. 1 to the Registration Statement on Form S-1 on January 12, 1994 as Commission File No. 33-72466.
(5) Incorporated by reference to the exhibit with the same exhibit number filed with our Current Report on Form 8-K on November 20, 1998 as Commission File No. 0-23246.
(6) Incorporated by reference to our Registration Statement on Form S-8 filed on November 8, 2001 as Commission File No. 333-72990.
(7) Incorporated by reference to our Registration Statement on Form S-8 filed on October 20, 2002 as Commission File No. 333-100842.
(8) Incorporated by reference to the exhibit with the same exhibit number filed with our Annual report on Form 10-K on June 28, 2004 as Commission File No. 0-23246.
(9) Filed herewith electronically. * Indicates a management contract or compensatory plan or arrangement.
All Sport®, Daktronics®, DakStats®, DakTicker®, DataTime®, DataTrac™, Galaxy®, GalaxyPro™, InfoNet™, Keyframe®, OmniSport®, On the Road®, ProAd®, ProPixel®, ProRail®, ProStar®, Pro Sport®, ProTour®, ProCast™, Scoreboard Sales and Service®, Sportsound®, SportStar™, SportsLink®, Starburst®, SunSpot®, Tuff Sport®, Vanguard®, V-Play®, Venus®, V-Net®, V-Show™, V-Link® and Vortek® are trademarks of Daktronics, Inc.

63
SIGNATURES
Pursuant to the requirements of Section 13 or 15(d) of the Securities Exchange Act of 1934, the Registrant has duly caused this Annual Report to be signed on its behalf by the undersigned, thereunto duly authorized, on June 22, 2007. DAKTRONICS, INC. By: /s/ James B. Morgan Chief Executive Officer and President (Principal Executive Officer) By: /s/ William R. Retterath Chief Financial Officer Pursuant to the requirements of the Securities Exchange Act of 1934, this report has been signed below by the following persons on behalf of the Registrant and in the capacities and on the dates indicated. Signature Title Date By /s/ Byron J. Anderson Director June 22, 2007 Byron J. Anderson By /s/ Robert G. Dutcher Director June 22, 2007 Robert G. Dutcher By /s/ Nancy D. Frame Director June 22, 2007 Nancy D. Frame By /s/ Aelred J. Kurtenbach Director June 22, 2007 Aelred J. Kurtenbach By /s/ Frank J. Kurtenbach Director June 22, 2007 Frank J. Kurtenbach By /s/ James B. Morgan Director June 22, 2007 James B. Morgan By /s/ John L. Mulligan Director June 22, 2007 John L. Mulligan By /s/ Duane E. Sander Director June 22, 2007 Duane E. Sander By /s/ James A. Vellenga Director June 22, 2007 James A. Vellenga

1
EXHIBIT 32.1
DAKTRONICS, INC.
CERTIFICATION OF THE CHIEF EXECUTIVE OFFICER PURSUANT TO 18 U.S.C. SECTION 1350,
AS ADOPTED PURSUANT TO SECTION 906 OF THE SARBANES-OXLEY ACT OF 2002
In connection with the Annual Report on Form 10-K of Daktronics, Inc. and subsidiaries (the “Company”) for the annual period ending April 28, 2007 as filed with the Securities and Exchange Commission on the date hereof (the “Report”), I, James B. Morgan, Chief Executive Officer of the Company, hereby certify, pursuant to 18 U.S.C. Section 1350, as adopted pursuant to Section 906 of the Sarbanes-Oxley Act of 2002, that to my knowledge:
(1) The Report fully complies with the requirements of section 13(a) or 15(d) of the Securities Exchange Act of 1934; and
(2) The information contained in the Report fairly presents, in all material respects, the financial
condition and results of operations of the Company. /s/ James B. Morgan James B. Morgan Chief Executive Officer June 22, 2007
EXHIBIT 32.2
DAKTRONICS, INC.
CERTIFICATION OF THE CHIEF FINANCIAL OFFICER PURSUANT TO 18 U.S.C. SECTION 1350,
AS ADOPTED PURSUANT TO SECTION 906 OF THE SARBANES-OXLEY ACT OF 2002
In connection with the Annual Report on Form 10-K of Daktronics, Inc. and subsidiaries (the “Company”) for the annual period ending April 28, 2007 as filed with the Securities and Exchange Commission on the date hereof (the “Report”), I, William R. Retterath, Chief Financial Officer of the Company, hereby certify, pursuant to 18 U.S.C. Section 1350, as adopted pursuant to Section 906 of the Sarbanes-Oxley Act of 2002, that to my knowledge:
(1) The Report fully complies with the requirements of section 13(a) or 15(d) of the Securities Exchange Act of 1934; and
(2) The information contained in the Report fairly presents, in all material respects, the financial
condition and results of operations of the Company. /s/ William R. Retterath William R. Retterath Chief Financial Officer June 22, 2007

Aelred J. KurtenbachFounder and Director since 1968 and currently the Chairman of the Board.
Frank J.KurtenbachDirector since 1984 and currently the Vice President of Sales.
James B. MorganDirector since 1984 and currently the President and CEO.
Robert G. DutcherDirector since 2002 and currently the Chairman, President and CEO of Possis Medical, Inc. Chairperson of the Compensation Committee.
Nancy D.FrameDirector since 1999 and former Deputy Director of the U.S. Trade and Development Agency. Member of the Audit Committee and Chairperson of the Nominating and Corporate Governance Committee.
Byron J. AndersonDirector since 2005 and formerly a senior executive of Agilent Technologies and Hewlett-Packard. Member of the Nominating and Corporate Governance Committee and the Compensation Committee.
John L.MulliganDirector since 1993 and currently a Vice President and Financial Advisor with Morgan Stanley. Chairperson of the Audit Committee.
Duane E. SanderFounder and Director since 1968 and formerly the Dean of Engineering at South Dakota State University. Memberof the Nominating and Corporate Governance Committee.
James A. VellengaDirector since 1997 and formerly the President and CEO of BFSX Corporation. Member of the Audit Committee and Compensation Committee.
DIReCTORS & SeNIOR MANAgeRS
DanBierschbachVice PresidentSchools & TheatresBusiness Unit
CarlaGatzkeVice PresidentHuman Resources
SethHansenVice PresidentInformation Technology and Systems
MattKurtenbachVice PresidentManufacturing
ReeceKurtenbachVice PresidentLive Events & InternationalBusiness Units
BradWiemannVice PresidentCommercial &TransportationBusiness Units
BillRetterathChief FinancialOfficer
independent directors
employee directors
company officers

331 32nd Avenue PO Box 5128 Brookings, SD 57006-5128tel 800-325-8766 605-697-4300 fax 605-697-4700www.daktronics.com e-mail [email protected]
Trademark Notice:Daktronics®, Galaxy®, GalaxyPro™, Venus®, ProPixel®, ProStar®, ProTour®, Sportsound®, Visiconn™, Vanguard®, Venus® and Vortek® are trademarks of Daktronics, Inc. All other marks are trademarks of their respective companies.
Copyright © 2007 Daktronics, Inc. SL-10401 Rev. 07 061807
Additional investor information and other data can be found at
www.daktronics.comAdditional related websites:www.vortekrigging.comwww.keyframe.com
Cautionary Notice Regarding Forward-Looking Statements:This annual report, including information incorporated by reference and the annual report on form 10-K, contains both historical and forward-looking statements that involve risks, uncertainties and assumptions. The statements contained in this report that are not purely historical are forward-looking statements within the meaning of Section 27A of the Securities Act of 1933, as amended, and Section 21B of the Securities Exchange Act of 1934, as amended, including statements regarding our expectations, beliefs, intentions and strategies for the future. These statements appear in a number of places in this report and include all statements that are not historical statements of fact regarding the intent, belief or current expectations with respect to, among other things: (i) our financing plans; (ii) trends affecting our financial condition or results of operations; (iii) our growth strategy and operating strategy; and (iv) the declaration and payment of dividends. The words “may,” “would,” “could,” “will,”
“expect,” “estimate,” “anticipate,” “believe,” “intend,” “plans” and similar expressions and variations thereof are intended to identify forward-looking statements. Investors are cautioned that any such forward-looking statements are not guarantees of future performance and involve risk and uncertainties, many of which are beyond our ability to control, and that actual results may differ materially from those projected in the forward-looking statements as a result of various factors discussed herein, including those discussed in the section of annual report on form 10-K entitled “Item 1A. Risk Factors” and “Item 7. Management’s Discussion and Analysis of Financial Condition and Results of Operations” and those factors discussed in detail in our other filings with the Securities and Exchange Commission.
DAKTRONICS®