065 CALIFORNIA UNIV BERKELEY ELECTRONICS RESEARCH … · aag 065 california univ berkeley...
47
AAG 065 CALIFORNIA UNIV BERKELEY ELECTRONICS RESEARCH LAB F/B 912 THE DESIGN METHODOLOGY OF DISTRIBUTED COMPUTER SYSTEMS G(U) DEC 80 C V RAMAMOORTHY F49620-79-C-0173 UNCLASSIFIED AFOSR-TR-81-0558 NL ilillllllll IEEEEEEEllEllE EllIEll~lEEEE EElIEE[B
Transcript of 065 CALIFORNIA UNIV BERKELEY ELECTRONICS RESEARCH … · aag 065 california univ berkeley...
AAG 065 CALIFORNIA UNIV BERKELEY ELECTRONICS RESEARCH LAB F/B 912THE DESIGN METHODOLOGY OF DISTRIBUTED COMPUTER SYSTEMS G(U)
DEC 80 C V RAMAMOORTHY F49620-79-C-0173
UNCLASSIFIED AFOSR-TR-81-0558 NL
ilillllllllIEEEEEEEllEllEEllIEll~lEEEEEElIEE[B
SEC URITY CL ASSIFICATION OF THIS PA ,E fienhosIt'er) .,
61EPORT DOCUMENTATION AGE .0 RE AL) INSTRUCTIONS
.'fWP09t NUMFRa 18m055S 2 GOV T ACCESSION NO. 3. RECIPAE' CAT JOG MBE
1 5TL~nwtf~~ TYPE VFr'PORT A PERIOD COVEREDC THE DESIGN M~ETHODOLOGY OF DIST"rBUTED CONPUTER1 ITNUL 30 JUN 79-31. DESC 80-.
E*~fe~-.R&PGjT "U"IbfR I
7. AUTHOR(s) B. CONTRACT OR GRANT NUMBER(s)
C.V ~mamorhy'/~ 149620-79-C-017'/f
9 PERFORMING ORGANIZATION NAME AND ADDRESS 10. PROGRAM ELEMENT PROJECT, TASK
Electronics Research Laboratory AREA &t WORK UNIT NUMBERS
College of Engineering N PE611lO2F 'U /Universi Ty of Ialifor-nia, :13orkeiey CA 9,-4 72--0 /62 /A
11. CONTROLLING OFFICE NAME AND ADDRESS 12. Ri EPORT DATE
Air Force Office of Scientific Research/P1M1 D -E' W80
S Boiling AFB DC 20332 NLTM1)EF PAGES
14. MONITORING AGENCY NAME & ADDRESS(iI different fron, Cantrnlling Of~fice) 15. SECURITY CLASS. (of this report)
1< I50. DECLASSIFICATION DOWNGRADINGSCHEDULE
16. DISTRIBUTION STATEMENT (of this Report)
Approved for public release; distribution unlimited.
M7 DISTRIBUTION STATEMENT (of thte abstract eralered in Plock 20, if different Iron Report)
IS. SUPPLEMENTARY NOTES
JUL -('19. KEY WORDS (Continua on reverse side if necessary and Identify by block numaber)
1, 0 ABSTRACT (Continue on reverse side It necessary and identify bn block nunther)
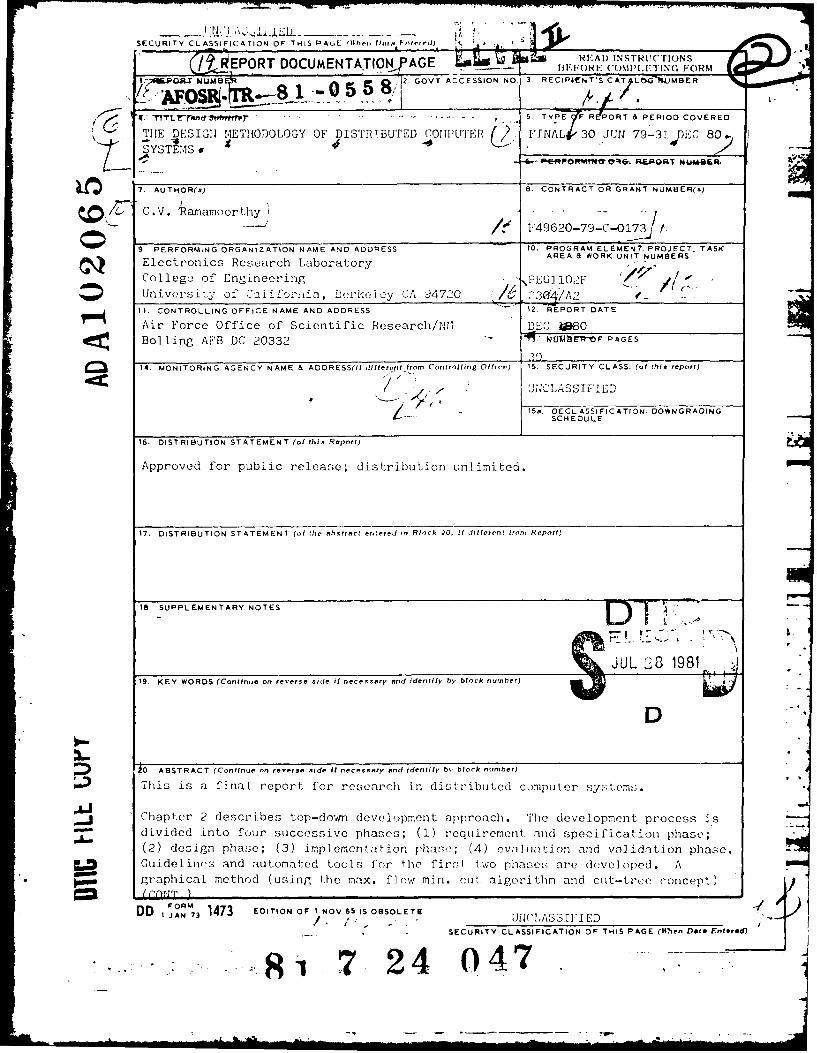
This is a final report for research in distributed computer sses
A-i Chapter 2 describes top-down deve lopment approach. The development process ispdivided into four successive phases; (1) requirement, and specification phase;
(2) design phase; (3) implementation phase; (4) evaluiation and validation phase.LDGuidelinevs and automated tools fo~r the firs I t.wo phssare deve] aped. Ameo graphical method (using the max. flow min. cut., algorithm and cut-tree, concept) n
DD FOR 1473~73 EDITION OF I NOV 65 IS OBSOLETE IUIST 2 F
SECURITY CLASSIFICATION OF THIS PAGE (Whren Data Entered)
~<i7L 24 0477
SECURITY CLASSIFICATION OF THIS PAGE(MIen Date Entered)
(ITEM #20, CONT.)
to decompose and partition a computer system into looely coupled subsystemsis proposed. The implementation and the evaluation and validation phases areoutlined briefly only because they are very technology and architecture
dependent.
Chapter 3 examines Petri net; model for asynchronous concurrent. systems.Procedures based on Petri net for predicting and verifying the systemperformance are presented. The computational complexities of these procedures
are also shown.
Chapter 4 examines the analysis technique:,s for deadlocks in asynchronousconcurrent systems. In particuLar, we study in detail deadlocls caused by .conflicts in mutual exclusive access to resources with the constraint thateach resource type has only one member.
Chapter 5 first classifies and then evaluates s-everal existing softwarereliability models according to some oroposed criteria. Then it develops atheory of software reliability based on the nature of the input domain ofthe program, i.e., the size of the errors and the number, complexity andcontinuity of equivalence classes formed in the input domain.
Acceq ion For
P.:" '; TB
, .. . • .-
7 1 -
UNCLASSIFIED
. # '- L ITV CLASS FICATIOW OF . " AGE(Mlsn D F ....
-" . . -
• " I - , :,-., , k ) I 2,' . .. "I" v -=--- ... - _ 2-:g"::'T': 7Z- "- _T
&E05KR8i 05
WUE DESIGN METHODO.OGY
OF DISTRIBUITED CO UTER SYSTEI,'S
C. V. Fa:,t :oorthy
.''~--!Tcnc Qe.ort
Jun 30, 1979 - Dec 31, 19SO
AYOP. Contract 149620-79--C--0173
.DTICj"ELECTi_1
JUL 28 1981
ELECTi-cNICS P.ISEARCR lFO 7OKY D
College o fn;c er igUnivt -sitv of Caliejrnia, Berkeley
94720
Approvea for publ ?1.eleasedistribution unlimited.
7 24 047
ABSTRACT
This is a final report for research in distributed computer systems.
Chapter 2 describes top-down development approach. The development
process is divided into four successive phases: (i) requirement and specification
phase; (ii) design phase; (iii) implementation phase; (iv) evaluation and validation
phase. Guidelines and automated tools for the first two phases are developed. A
graphical method (using the max. flow min. cut algorithm and the cut-tree
concept) to decompose and partition a computer system into loosely coupled
subsystems is proposed. The implementation and the evaluation and validation
phases are outlined briefly only because they are very technology and architecture
dependent.
Chapter 3 examines Petri net model for asynchronous concurrent systems.
Procedures based on Petri net for predicting and verifying the system performance
are presented. The computational complexities of these procedures are also shown.
Chapter 4 examines the analysis techniques for deadlocks in asynchronous
concurrent systems. In particular, we study in detail deadlocks caused by conflicts
il oulAi exclL-ive acces ,, ",-.cs'u. cc, 'with tl,; conitra'nt h t z c', resot:r-.. L/)
has only one member.
Chapter 5 first classifies and then evaluates several existing software
reliability models according to some proposed criteria. Then it develops a theory
of software reliability based on the nature of the input domain of the program, i.e.,
the size of the errors and the number, complexity and continuity of equivalence
classes formed in the input domain.
AIR FORCE OFFICE OP 9INTIPIC RESEARCH (AyISC)NOTICE OF TRANSMITTAL TO DDCThis technical report has been reviewed and isapproved for public release lAW AR 190-12 (7b).Distribution is unlimited.A. D. BLOSETechuioal Information Officer
CHAPTER ONE.
Introduction
In the past year, we have studied the distributed computer system. The
work that we have accomplished can be summarized as follows:
(1) Top down design strategy.
(2) Modelling and performance analysis of asynchronous concurrent systems.
(3) Methods to detect deadlock in distributed systems.
(4) To develop an theory of software reliability based on the nature of the
input domain of the program.
Current approaches to the design and analysis of computer systems are
based primarily on experience and intuition. The specification, design,
implementation and evaluation of computer systems are very expensive, difficult
to tcst adequately, slow to deploy and difficult to adapt to changing requirements.
T"i_:se difficulties have led to many schedule slippages and project failures.
This research attempts to develop a systematic approach for the design
and analysis of computer systems. However, the activities involved are so wide
and varied that only part of the full scope of the design and development process is
studied. A top-down deveiovnmeri approach icr Cui puttr sys*Xrns is dvelop.
The techniques for prediction and verification of the performance of
asynchronous concurrent systems can be classified into two categories: (1)
deterministic models, and (2) probalistic models. In deterministic models, it is
usually assumed that the task arrival times, the task execution times, and the
synchronization involved are known in advance to the analysis. With this
information, a very precise prediction of the system performance can be obtained.
This approach is very useful for performance evaluation of real time control
systems with hard deadline requirements.
-2-
In probabilistic models, the task arrival rates and the task service times
are usually specified by probabilistic distribution functions. The synchronization
among tasks is usually not modelled, because otherwise the number of system
states becomes so large that it would be impossible to perform any analyses.
Probabilistic models usually give a gross prediction on the performance of the
system and are good for early stages of system design when the system
characteristics are not well understood. In this paper, we focus on performance
analysis of real time systems and therefore we have chosen the deterministic
approach. In particular, in order to model clearly the synchronization involved in
concurrent systems, the Petri net model is chosen.
In our approach, the system to be studied is first modelled by a Petri net.
Eascd on the Petri net model, a given system is classified as either: (1) a
consistent system; or (2) an inconsistent system (the definitions are given in later
sections of the paper). Most real-world systems fall into the first class and so we
focus our discussion on consistent systems. Due to the difference in complexity
involved in the p:!rforrnance analyses of different types of consistent systems, the.y
z-re further subclassified into: (i) decision-free systems; (ii) safe persistent
--ytcmJ; ,,: G.) gc:ierz' s strr . Proc 2dur .s *or pt edL:ting ar., veri.yir.- tIe
system performance of all three types are presented. It is found that the
computational complexity involved increases in the same order as they are listed
a Love.
Our work in system deadlocks concentrates on analysis techniques for
deadlocks in asynchronous concurrent systems. This includes multi-programrmed
systems, multiple processor systcms and computer networks. In particular, we
studyin detail deadlocks caused by conflicts in mutual exclusive accesses to
resources with the constraint that each resource type has only one member.
Deadlocks due to the erroneous nesting of binary semaphores (Dij 71), nesting of
.3-
, " .i -"l - , -, ..... . ._ ! - - i -- ,-- -- -ply- -
critical regions (Bri 72,Bri 73a) and nesting of monitors (Bri 73b, Iloa 74) are
important members in the above category. In addition to these, deadJocks due to
conflicts in data file lockings in distributed database systems also fall into the
above category.
In order to facilitate the use of digital computers in critical, real-time
control systems (e.g., nuclear power plant safety control systems), the software
Must be thoroughly validated. Software reliability is a measure of the confidence
in the operational correctness of the software. Since the early 70's several
software reliability models have been proposed. However, most of these models
are ad hoc extensions of hardware reliability models and their assumptions have not
been validated.
This thesis first classifies and then evaluates several existing software
reliability models according to some proposed criteria. Then it develops a theory
of software reliability based on the nature of the input domain of the program, i.e.,
the size of the errors and the number, complexity and continuity of equivalence
classes formed in the input domain.
A general framework is developed for software reliability growth models
uscd during the debugging phase of software development. It incorporates the
concepts of residual error size and the testing process used. Two specific models
are then developed. The first approach models the effect of debugging actions on
the residual error size as a random valk process with a continuous state-space.
The time beween the detection (and correction) of successive errors is then
modelled as a doubly stochastic Poisson process. The application of this model and
its statistical evaluation are also discussed. The second approach is a bayesian one
dealing with the prior and posterior distributions of the residual error size.
During the validation phase, the program is tested extensively in order to
determine its reliability. Even if new errors are detected, they are not corrected.
-4-
A model is developed for directly estimating the correctness probability of the
software based on the set of test cases used and on the number of equivalence
17lasses, their complexity and continuity properties. The model is applied to a pilot
,2rogramn developed for nuclear power plant safety control systems.
A predictive model, applicable during the operational phase, is developed
based on the continuity of the input domain. Anuncertainty measure using fuzzy
set theory is proposed for the operational software. The perturbation of the
residual error size due to different maintenance activities is also discussed.
The theory is then applied to the evaluation of software validation
techniques and programming languages. Some ]anguage constructs and
documcntaton techniques which can improve the reliability of the software are
p-roposcd. The application of the theory to different aspects of project
mnanngement is also discusrcd.
This report is divided into 6 chapters. The top down design strateogy is
prnsentcd in chapter 2. Chapter 3 presents the techniques for performance
evalua.tion in concurrent systems. Chapter 4 develops the procedure of deadlock
'e~cc~oi i I Jistrihuted systems. Chapter 5 prescnts the developmcnt of a theory
of Soft'vare Reliability model based on the nature of the input domain of the
Program. Lastly, section 6 gives a conclusion of this report.
&[,
-5-

CHAPTER 2
A Top-Down Approach for the Developmentof Distributed Computer Systems
2.1 Introduction
In this chapter, a systematic approach for the development of distributed
computer systems is discussed. The objective is to develop guidelines and
automated tools for the design of distributed systems. The philosophy behind the
approach is based on top-down hierarchical modelling of DCS.
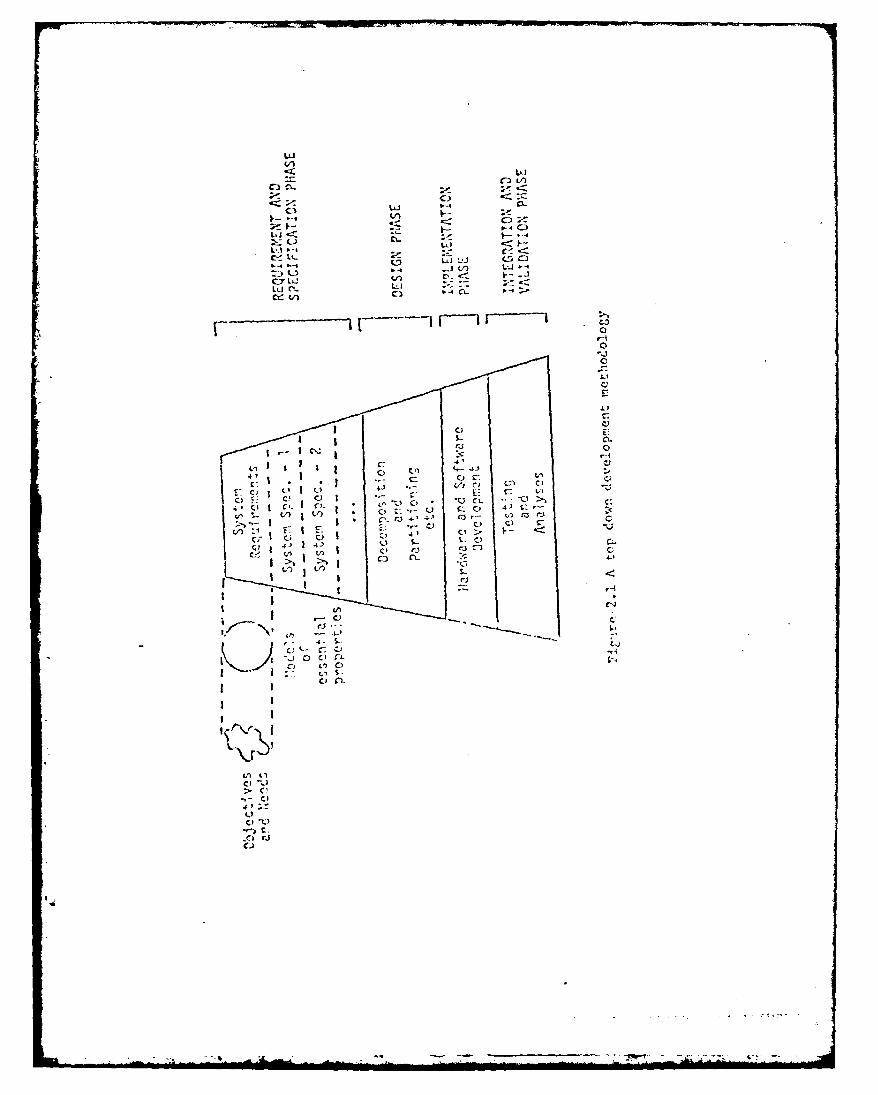
2.2 The Top-Down Development Approach
The top-down approach proposed here can be broken down into four
successive phases (Figure 2.1):
(1) Requirement and specification phase.
(2) Design phase.
(3) Implementation phase.
(4) Evaluation and validation phase.
The requirement and specification phase starts with some (possibly
incomplete, vague, and informal) system requirements that approximate the
csircd sys~en-,, and finish-..s wLcn -h- mjoiiieo a,,J clabo:ated r.cqutrumc.;s hay:
been formally encoded and tested to the satisfaction of the system engineers and
the "customers".
The design phase starts with the requirement specifications and finishes
when the system specifications are produced. The objective is to optimize and
organize the system in a well formed structure. It involves an hierarchy of
decomposition and partitioning of the system into subsystems.
The implementation phase takes the system specification and develops the
system architecture. It then maps the system functions into either hardware or
-6-
LLI
C)k
C)
ti :--3
CLC
C\:)
4-
C))c,
44 -3 C-)
c;~~V M C ZZ .-
ci C3
''-4
I1 X)O ) .
Li
C' :jLU
v) C'
C) -'> C-
.C) rJ
7117r
software functions. It is only at this step that physical constraints and technology
comes into consideration.
The final step is the evaluation and validation of the system. This phase
uses the bottcn up validation approach. It takes the final design and ensures that
the system meets the original requirements. This step uses both analytical
modelling and simulation.
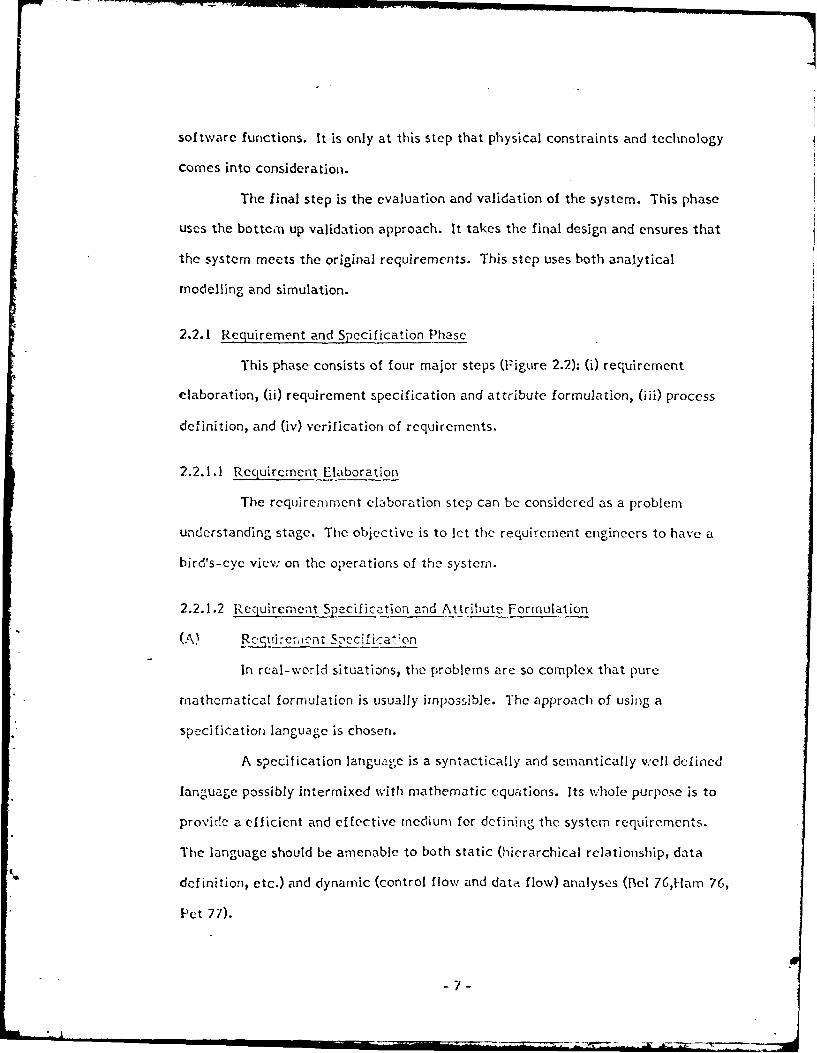
2.2.1 Requirement and Specification Phase
This phase consists of four major steps (Figure 2.2): (i) requirement
elaboration, (ii) requirement specification and attribute formulation, (iii) process
definition, and (iv) verification of requirements.
2.2.1.1 Requirement Elaboration
The requiremment elaboration step can be considered as a problem
understanding stage. The objective is to let the requirement engineers to have a
bird's-eye view on the operations of the system.
2.2.1.2 Requirement Specification and Attribute Formulation
(A) R cui:ericnt 5pecifi-aton
In real-world situations, the problems are so complex that pure
mathematical formulation is usually impossible. The approach of using a
specification language is chosen.
A specification language is a syntactically and semantically well defined
language possibly intermixed with mathematic equations. Its vhole purpose is to
provide a efficient and effective medium for defining the system requirements.
The language should be amenable to both static (hierarchical relationship, data
definition, etc.) and dynamic (control flov and data flow) analyses (Bel 76,Hlam 76,
Pet 77).
-7-
_ V __
' Recuir- 2 n1 Arib~ltCSpeificationrj FoUlation
Dcfinition
Yesy
'P
DES ICPHASE
igre2.a. 1he flo~w ch'.rt for the rcquirc:ai'mt
and specificatiou phnne

(B) Attribute Formulation
For a distributed system, the attributes are cost, reliability, availability,
flexibility, expandability, reconfigurability, etc. Some of them are very difficult
to be quantified. Usually, the situation is further complicated by the fact that the
system attributes are interdependent on each other and they may compete and
interact with each other. The designers are forced to consider design tradeoffs
early in the development process.
2.2.1.3 Process Definition
The process definition step accepts inputs from the requirement
specification and attribute formulation step and identifies major functions to be
performed. First the input stimulus and the required responses are characterized.
2.2.1.4 Verifiction of Rcquirements
In this step, the processes of the virtual system is verified to meet the
original users' requirements. As the system is developed hierarchically, the
specifications of one level are the requirements of the next level. To verify the
correctness of the virtual system, we only have to verify the consistency between
the specifications and requirements betveen consecutive levels.
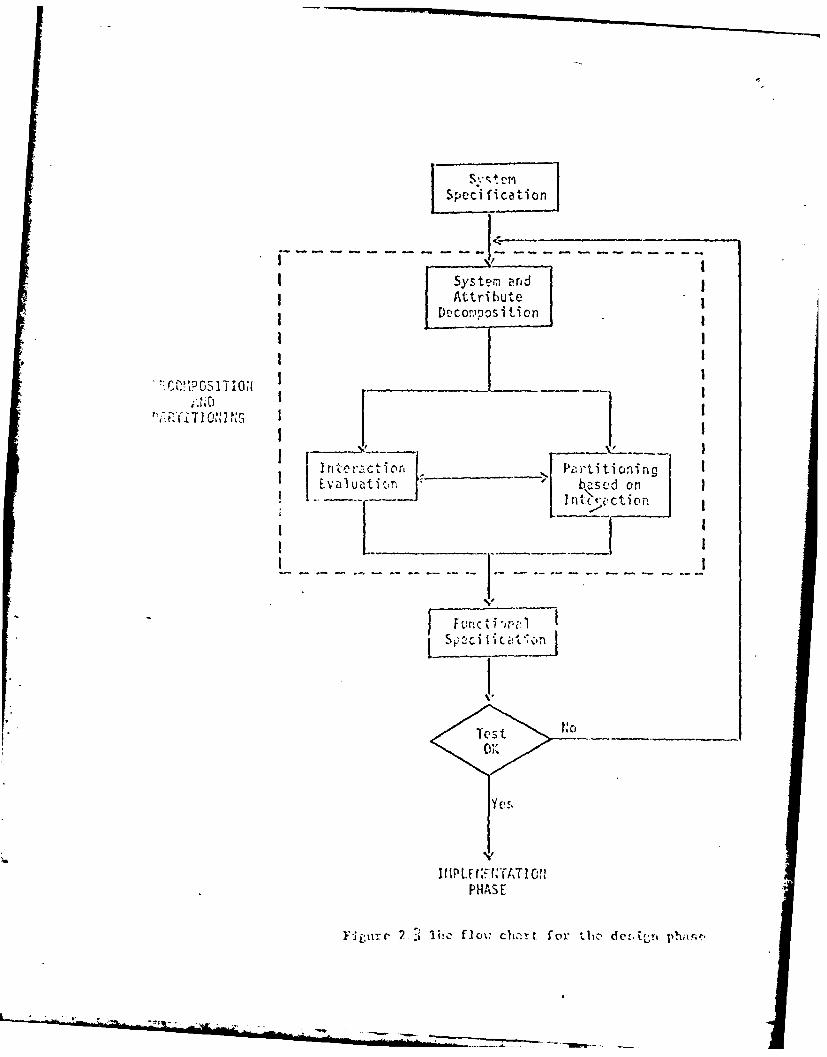
2.2.2 Design Phase
The design phase starts with the defined processes which are the output of
the requirement and specification phase. The major steps involved in the design
phase are decomposition and partitioning, functional specification and finally
veritication (Figure 23).
2.2.2.1 Decomposition and Partitio ing
In order for the design process to be manageable, it must be decomposed
and partitioned in such a way that most decisions can be made locally, based on
I System antdI Attribute
D colositicn
'Y i ~ 10~ N I NC
Interaction~______ Pi~rtitioningE Zlatcn ' bz-svd on
I MP LON
H 1% * Erl ~c to cirt. foId!-L
data available within a local area of the developing system specifications. To
achieve this, the system is decomposed into progressively more detailed
components which are then grouped into partitions (subsystems) to minimize the
amount of interactions between partitions. A graph theoretical approach for the
systematic decomposition and partitioning of a system is developed.
2.2.2.2 Functional Specification
The next major step in the design phase is functional specification of the
partitioned processes. This functional specification is different from the process
specification described in the reuirement specificaton phase. The objective of the
process specification is to define the interactions of the processes for the
decomposition step. The objective of the functional specification here is to define
the characteristics of the functions so to enable optimization in the functions to
processors mapping.
2.2.2.3 Verification of Design
No single model is powerful enough to have all the above features. The
control flow of a distributed system can be modelled quite effectively by Petri net,
UCLA graplh rodel, E-net, eic. (Wet 71, Gos i, Nce 73). "Yz-2 iodels ;eAr,::,cnt
clearly the flow of information and control in a distributed system, especially those
which exhibit asynchronous and concurrent properties.
In order to predict and analyze the performance of the designed system,
queuing models and simulation are often used ('er 78).
2.2.3 Implementation, Evaluation and Validation
The implementation phase takes the virtual system and develops the
system architecture. It then maps the system functions into either hardware or
software functions.
-9-
The final phase is the evaluation and validation of the system. This phase
ises the bottom up validation approach. Both analytical modelling and simulation
will be used. Because of the hierarchical decompositon, each subsystem to be
inalyzed should be small and therefore complexity should be low.
Y.3 Summary
The development process is divided into four successive phases: (i)
t.cquirement and specification phase; (ii) design phase; (iii) implementation phase;
and (iv) evaluation and validation phase. The first two phases are explored in
detail. The last two phases of the development process are only outlined briefly
,ecause they are very technology and architecture dependent.
- 10-

'N
CHAPTER 3
Performance Evaluation of Asynchronous Concurrent System
3.1 Review of Petri Nets
3.1.1 Basic Properties of Petri Nets
Petri nets (PET 77, AGE 75) are a formal graph model for modelling the
flow of information and control in systems, especially those which exhibit
asynchronous and concurrent properties.
3.1.2 Application of Petri Nets in Control Flow Analysis
Petri nets have been used extensively to study the control flow of
computer systems. By analyzing the liveness, boundedness and proper termination
properties of the Petri net model of a computer system, many desirable properties
off th system can be unveiled.
A Petri net is live (HAC 75, IIOL 71) if there always exists a firing
sequence to fire each transition in the net. By proving that the Petri net is live,
the system is guaranteed to be deadlock free.
A Petri net is bounded (NAR 66, LIE 76) if for each place in the net, there
exists an upper bound to the number of tokens that can be there simultaneously. If
tokens are used to represent intermediate results generated in a system, by proving
that the Petri net model of the system is bounded, the amoun1t of buffer space
required between asynchronous processes can be determined and therefore
information loss due to buffer overflow can be avoided. If the upper bound on the
number of tokens at each place is one, then the Petri net is ssatfe. Proramilling
constructs like critical regions (BRI 72) and monitors (BRI 73, 1 IOA 74) can be
modelled by safe Petri nets.
A Petri net is plop,1rly ternir iatirv' (GOS 71, POS 74) if the Petri net
always terminate in a well--defined manner such that no tokens are left if] the net.
- II -
-m " " ' . '; i -.: , , ' : : -7 - - i ---~ " - i'
By verifying that the Petri net is propcrl) tcrniinated, the systcm is guaranteed to
function in a well behaved manner without any side-effects on the next initiation.
3.1.3 E'xtended Timed Petri Nets
In order to study the performance of a system, the Petri net model is
extended to include the notion of time (RAM 74). In such extended nets, an
execution time, r, is associated with each transition. When a transition initiates its
nxecution it takes r units of time to complete its execution. With the extended
'etri net model the performance of a computer system can be studied.
3.2 Pcrfornmance Evaluation
The work that we have accomplished in performance evaluation is to use
Petri n.ts to find the maximum performance of the system, i.e., to find the
ShininuT cycle tirno (for processing a task) of the system. As pointed out before,
different computational complexities are involved in the analyses of systems of
different types. The approaches for analyzing each typc of system are studied
separately in detail in the following section. Before we come to the analyses, some
definitions are in order.
D efinition. In a Petri net, a secquence of places and transitions, PL)Lt2...Pn, is a
directed path from P1 to Pn if transition ti is both an output transition of place Pi
and an input transition of place Pi+I for I i ri-I.
Definiticn. In a Petri net, a sequence of places and transitions, Plt lP2t2...Pn, is a
directed circuit if PitlP2t2...Pri is a directed path from P1 arid Pn and P equals
Definition. A Petri net is strong connected if every pair of places is contained
in a directed circuit.
12-
i i •"--S" -. -. --. "- - -
In this paper, we presented the performance analysis techniques for
strongly connected non-terminating Petri nets. Extensions to analyze weakly
connected Petri nets are quite straightforward so it will not be discussed in this
report.
3.2.1 Consistent and Inconsistent Systems
The first step involved in our approach to analyze the performance of a
system is to model it by a Petri net. A system is a consistent (inconsistent) system
if its Petri net model is consistent (inconsistent). A Petri net is consistent
(condition A) if and only if there exists a non-zero integer assignment to its
transition such that at every place, the sum of integers assigned to its input
transitions equals the sum of integers assigned to its output transitions; otherwise,
the system is inconsistent. If a system is live and consistent, the system goes back
to its initial coniiguration (state) after each cycle and then repeats itself. If a
system is inconsistent, either it produces an infinite number of tokens (i.e., it needs
infinite resources) or consumes tokens and eventually comes to a stop.
3.2.2 Decision-free Svstems
A bysti.n is a cecLzion,- fr- c sys'n if it, l'etri r et r) c'el i3 I
decision-free Petri net. A Petri net is decision-free if and only if for each place in
the nct, there is one input arc and one output arc. This means that tokens at a
given place are generated by a predefined transition (its only input transition) and
consurned by a predefined transition (its only output transition)
For a decision-free system, the maximum performance can be computed
quite easily.
Theorem 3.1. For a decision-free Petri net, the number of tokens in a circuit
remains the same after any firing sequence.
-13-
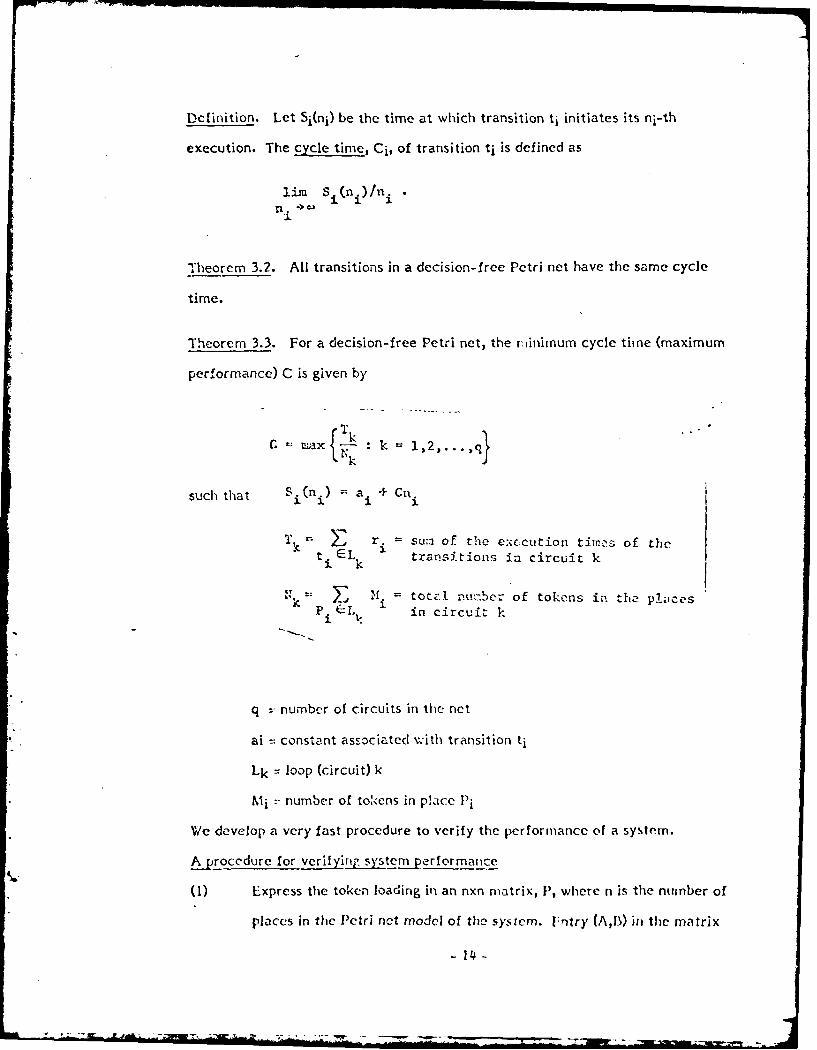
Definition. Let Si(ni) be the time at which transition t i initiates its ni-th
execution. The cycle time, Ci, of transition t i is defined as
Lim S i (n i ) I n •n. ->-'a-
Theorem 3.2. All transitions in a decision-free Petri net have the same cycle
time.
Theorem 3.3. For a decision-free Petri net, the rininum cycle tine (maximum
performance) C is given by
Pl: ax : k = 1,2,...,q
such that S.(n i ) a i + Cn.
T - r. su of the exccution times of thet. Lk transitions in circuit k
3.k
" i total nu.,ber of tokens in the placesP iL V in circuit k
q number of circuits in the net
ai = constant associated with transition t i
Lk loop (circuit) k
Mi -number of tokens in place Pi
We develop a very fast procedure to verify the performance of a system.
Arocedure for verifyig syste performance
(I) Express the token loading in an nxn matrix, P, where n is the number of
places in the Petri net model of the system. Untry (A,13) it) the matrix
-14 -
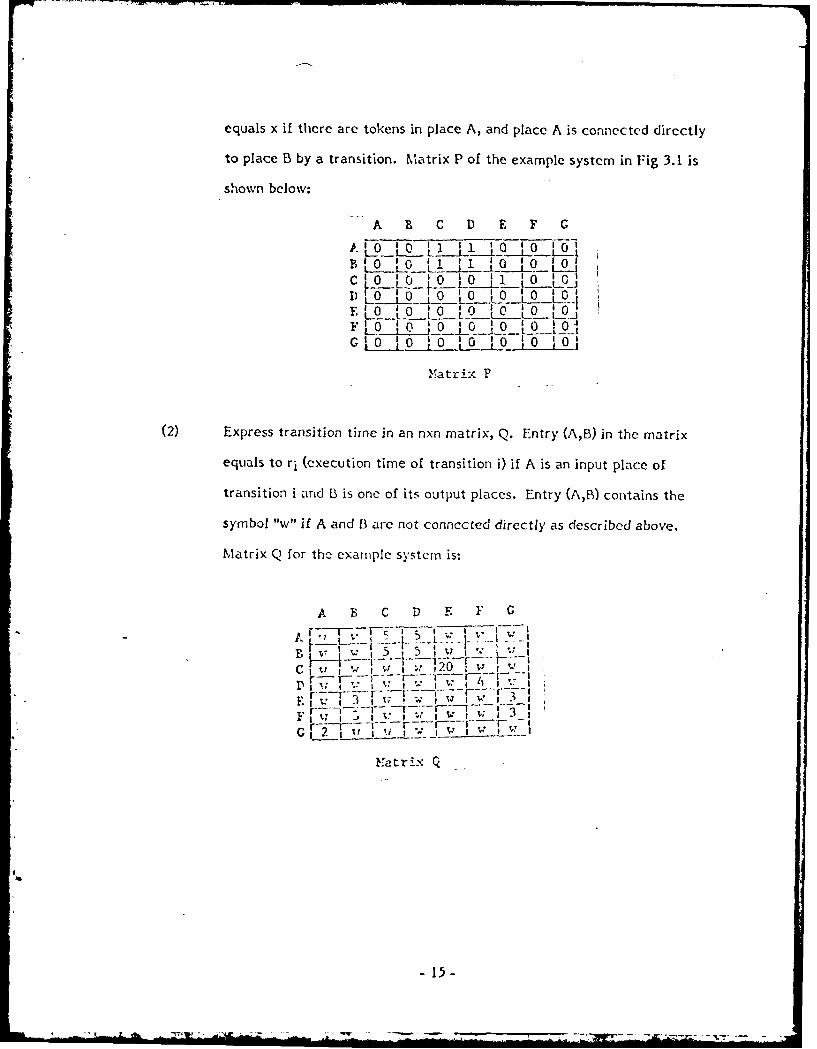
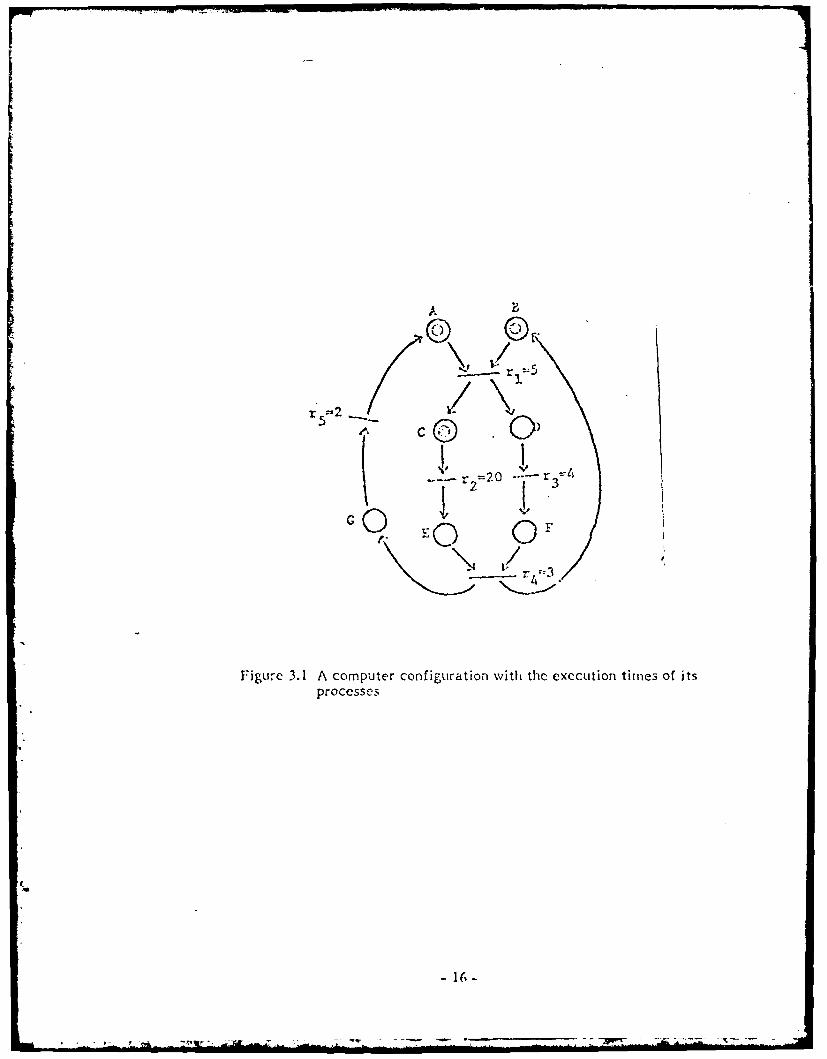
equals x if there are tokens in place A, and place A is connected directly
to place B by a transition. Matrix P of the example system in Fig 3.1 is
shown below:
A C D E F G
B L i LQ.L! i A9L i i
C LLL0_Q_0__0 1-LO_LQi
0 0 'a t0 0 'FLO lo 0L 0_9__QIC i0 0 Q " 0 "0 0O ~0
Matrix P
(2) Express transition time in an nxn matrix, Q. Entry (A,B) in the matrix
equals to r i (execution time of transition i) if A is an input place of
transition i and B3 is one of its output places. Entry (A,B) contains the
symbol "w" if A and B are not connected directly as described above.
Matrix Q for the example system is:
A B C D E F C
B" '"4l -- j i '- ! V 9--
C 20
1 3 SG, 2: !1 w i * , 5 , w "
r atri-x
-15-
G 0.
r~ 52
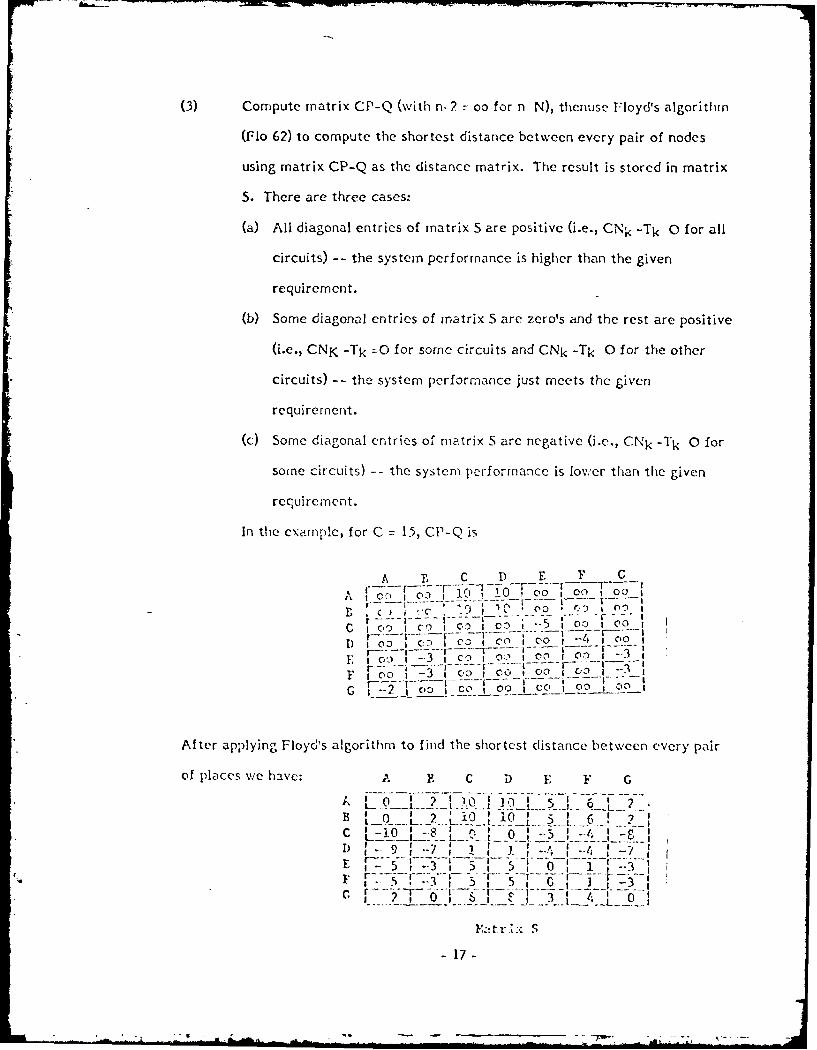
(3) Compute matrix CP-Q (with n-2 oo for n N), thenuse Floyd's algorithm
(Flo 62) to compute the shortest distance between every pair of nodes
using matrix CP-Q as the distance matrix. The result is stored in matrix
S. There are three cases:
(a) All diagonal entries of matrix S are positive (i.e., CNk -Tk 0 for all
circuits) -- the system performance is higher than the given
requirement.
(b) Some diagonal entries of matrix S are zero's and the rest are positive
(i.e., CNK -Tk -0 for some circuits and CNk -Tk 0 for the other
circuits) -- the system performance just meets the given
requirement.
(c) Some diagonal entries of matrix S are negative (i.e., CNk - l k 0 for
some circuits) -- the system performance is lower than the given
requirement.
In the example, for C -- 15, CP-Q is
A r r C D g F C
I"-- 00,'C C 9 I "W* n o , r.,-j n"9
S I - C-I CO I Cc,I .0 I C- I C, CO O '
c, . co oo -o_
S n _ 30
After applying Floyd's algorithm to find the shortest distance between every pair
of places we have; A P C D E F G
C L_ - ..... xL__._. , I .. I ..... I-_
c L-or8 ' i t I .7r I .'. I 'O I6 2
D) 1 9 1 --7 I I
1 -5
- -T- ------- ---3-- -
-17 -
Since the diagonal entries are non-negative, the performance
requirernment of C 15 is satisfied. Moreover, since entries (A,A) (C,C), (E,E) and
(G,G) are zero's, C 15 is optimal (i.e., it is the minimum cycle time). In addition,
when a decision-free system runs at its highest speed, CNk equals to Tk for the
Lottleneck circuit. This implies that the places that are in the bottleneck circuit
rill have zero diagonal entries in matrix S. In the example, the bottleneck circuit
is AtiCt2Et4 GtS. With this information, the system performance can be improved
by either reducing the execution times of some transitions in circuit (by using
faster facilities) or by introducing more concurrency in the circuit (by introducing
more tokens in the circuit). Which approach should be taken is application
dependent and beyond the scope of this thesis.
The above procedure can be executed quite fast. The formulation of
matrices P and Q takes 0(n 2 ) steps. The Floyd algorithm takes 0(n 3) steps. As a
whole, the procedure can be executed in 0(n 3) steps. Therefore, the performance
requirement of a decision-free system can be verified quite efficiently.
3.2.3 Safe Pesistent Systems
A system is a safe persistent system if its Petri net model is a safe
persistent Petri net. A Petri net is a safe persistent Petri net if and only if it is a
safe petri net and for all reachable markings, a transition is disabled only by firing
the transition. To compute the performance of the system, we first transform it
into a decision-free system and then use the algorithm discussed in the previous
subsection to compute the system performance.
A persistent Petri net can be transformed into a decision--free Petri net
by tracing the execution of the system for one cycle.
3.2.4 Gcneral Systems
A system is a general system if its Petri net model is a general Petri net.
- 18-
• :- . "'' ,-,"z ': : ,. i . - --v
A Petri net is a general Petri net if it is a consistent Petri net and there exists a
reachable marking such that the firing of a transition disables some other
transitions.
General systems are very difficult to analyze. In the next theorem, we
show that it is unlikely that a fast algorithm exists to verify the perfo*nance of a
general system. A method of computing the upper and lower bounds of the
performance of a conservative general system (Lie 76) is proposed. For a
non-conservative general system, no good heuristics are known to the authors and
further research is needed.
Theorem 3.4. Verifying the performance of a general Petri net is an NP-cornplete
problem (Kar 72).
- 19-
.. .. , "- .- ".: ,--" : - - i , -: -, - , . . , .. ' w - - : "" " -
CHIAPTERt 4
System Deadlock
4.1 An Approach to Deadlock Prevention
The scope of our study on system deadlock is restricted to systems using:
(i) binary semaphores; (ii) critical regions; and (iii) monitors as their interprocess
synchronization mechanisms. This enforces structural design and greatly reduces
the computational complexities involved in the analyses. Based on the above
synchronization constructs, a formal graph model (the request-possession graph) is
devloped to model deadlocks in these systems. The necessary and sufficient
conditions for the occurrence of a deadlock are derived. Based on these conditions,
techniques for uncovering potential deadlocks in a system are developed, and a
s.ystematic approach for the construction of deadlock-free systems using critical
regions and/or monitors is proposed.
!,.t.1 The Request-Possession Graph Model
An request-possession graph (an RP-graph) is a formal graph mjodel
developed to study deadlocks in systems which use binary semaphores, critical
gi ns ar dj-Tr c'dio-S as thi r sy chrcn;at.c r iec - nis i.;. It is i dir ectd
bipartite graph with two types of nodes and two types of arcs (Fig. 4.1b): (1)
resource reference nodes (which are called reference nod!,s in short in the rest of
the chapter), and (2) resource nodes. The reference nodes are used to represent
.cresses of resources in a system and the resource nodes are used to represent
re:ources. A dotted arc directed from a reference node to a resource node
rej)[esents the request Of the resource from the reference node. A solid arc
directed from a resource to a reference node represents the assignment of the
re ource to the reference node.
- 20 -
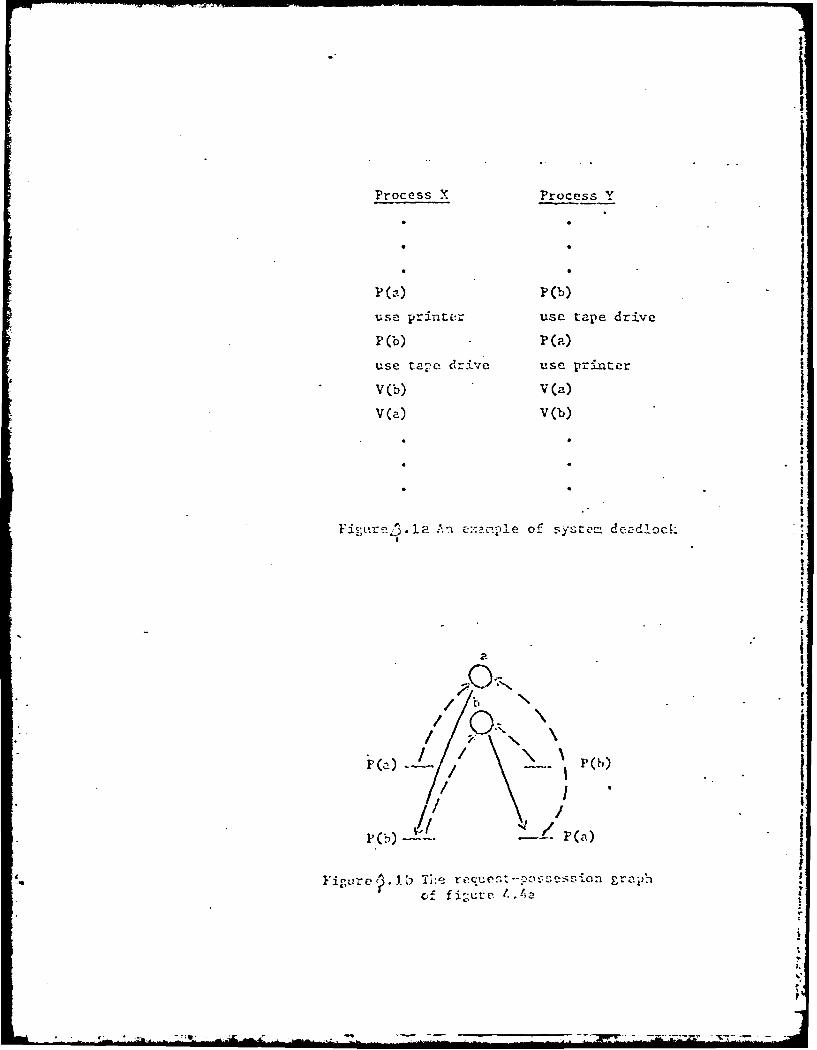
The RP-graph of a program can be generated by scanning through the
program once. The procedure for constructing the RP-graph of a concurrent
sytem can be best illustrated by an example. Figure 4.1 shows a concurrent
.Vstem together with its RP-graph. For each binary seamphore (P or V operation)
in the system, there is a corresponding resource node (reference node) in the
RP-graph. For each P operation in the system, a dotted arc is drawn from the
,corresponding reference node to the corresponding resource node. Solid arcs are
then drawn from the resource nodes to a reference node for the resources that
hCAvc been possessed by the process when it begins to execute the reference node.
For example, solid arcs are drawn from resource nodes a and b to reference node
'(b) or process X because both resources a and b are possessed by the process when
ii begins to execute instruction V(b). Following the above procedure, the RP-graph
cf a system can be constructed in linear time to the number of instructions in a
pr,ra;n. As the releases of resources will never bring a system into a deadlock,
the reference nodes corresponding to V operations are omittd in RP-graphs.
4.1.2 The Necessary and Sufficient Conditions for Dead!ocks
The nece.sary co.!-dtier fcr deadloct:s developed in this sectinn is
applicable to systems using binary semaphores, critical regions and/or monitors as
their synchronization mechanisms. The sufficient condition for deadlocks
developed is only applicable to systems using critical regions and/or monitors as
their synchronization mechanisms. This is due to the unstructureness of
senaphores and are explained later in this section.
.efinition. A system is safe if and only if it is deadlock-free. A system is unsafe
if and only if it potentially can get into a deadlock state.
Threorem 4.1. Only gives the necessary condition for an unsafe system. The
cxistencc of a directed cycle in the RP-graph of a system does not imply that the
-21 -
it t
Process X Process Y
* IP Ca ) P~b)
usez print~r use tape drive
P(b) P(a.)
use ta-e drive use printer
V(b) V(a)
V(a) V(b)
Fis i.re ^.I? An e:.ple of system d c-dlock :
i5
I
1
! / 1 \ I,
I/ \ 1P
Ib i]e reu -po)S o F raf f iure 4.4a
system is unsafe.
The RP-graph can be generated automatically in linear time to the
number of instructions in a system. The Floyd algorithm can be used to detect the
existence of directed cycle in the RP-graph, which has execution time 0(n 3 ) steps
where n is the number of nodes in the generated RP-graph. As a rsult, the
proposed algorithm can be executed in poly-nominal time to the number of
instructions in a systm.
Before we discuss the sufficient condition for a safe system, some
extensions have to be made on the RP-graph. The resultant model is called the
augmented request-possession- graph (the ARP-graph). It is very similar to the
RP-graph except that each reference node, r, is given a set of names, sr, such that
S" Sr if and only if:
(1) s is the name of the process when it begins to execute note r, or,
(2) s is the name of a resource that has been possessed by the process when it
begins to execute node r (i.e., there exists a solid directed arc from
resource so to node r in the RP-graph).
'r~ao, ei. .2. /\ systemni si,,c if a-.d oily f 'ts ARP-graph r-czs ro' contein a
directed cycle with distinct names on its reference nodes (i.e., Su1 'Sv for all
pairs of nodes, u and v, in the cycle).
Theorem 4.2. Is true for a system which uses critical regions and monitors as its
synchronization mechanisms, however, it does not hold for a system that uses
semaphores as its synchronizaton mechanism. From this point onwards, %,.hen we
talk about systems, we mean systems which suse critical regions and/or monitors as
their synchronization mechanisms.
One application of theoroem .2 is to prove the safety of a system.
Before we use the Theorem, we have to develop an effective procedure to
- 22 -

detcrmine whether there exists a directed cycle with distinct labels on its nodes in
a labelled directed graph. -lowever, it is shown in the following theorem that the
above problem is NP-complete (i.e., it is unlikely to have a fast algorithm to solve
Ihe problem).
Theorcm 4.3. It is NP-complete to find a directed cycle with distinct labels on its
aodes in a labelled directed graph.
4.1.3 An Approach to the Design of Deadlock-Free System
..heo.em 4.4
If all critical regions and/or monitiors are linearly ordered, and all
processes enter a critical region or a monitor at a higher level before those at a
.ower level, deadlock cannot occur.
The above strategy imposes severe constraints on the nesting of critical
regions and/or monitors. Two of its drawbacks are: (1) reducing the concurrency
in a system; and (2) reducing the transparency of a system. One approach to
Lceriedy some of the drawbacks is to group critical regions and/or monitors into sets
allowing unordered netirig within each set. A linear ordering is then imposed
anon, sets. A process must not enter a critical Legion or a trionitor in a set at a
hihcr level after it has entered one in a set at a lower level. The linear ordering
anong sets guarantees that deadlock cannot occur due to improper nesting of
critical regions or monitors in different sets. The deadlock-free condition within
each set is verified by the deadlock detection procedure discussed in section 4.1.1.
This approach provides: (I) good programming style; (2) higher degree of
concurrency; (3) no run time overhead; and (4) automatic deadlock detection during
cormplation.
-:.2 Deadlock Detection i, Distributed Data B ases
In a distributed data base, deadlocks carn be detected quite easily by using
-23-
a centralized control strategy. Whenever a process locks or releases a data file, it
gets the permission from a central control node. This control node maintains a
demand graph for the whole system and checks for deadlocks by searching for a
directed cycle in the graph. However, the approach is inefficient. All data
accesses have to get the permissions from the central control node although they
may not cause any deadlocks. This slows down the system, wastes the system
communication bandwidth and unnecessarily congests the cornmunication
subsystem. Above all, if the control node goes down, it is very difficult to recover
the system from the failure.
Another approach for deadlock detection is to store the resource status
locally at each site. Periodically, a node is chosen to be the control node.
Resource status are then sent from each site to the control node for analyses. This
remedies most of the drawbacks of the ccntralized approach. However, due to the
inherent communication delay, the chosen control node may get an inconsistent
view of the system, and it may make a wrong conclusion.
We have developed three approaches to construct consistent demand
graph. In the approaches, it is assumed that each transaction is given a unique
4.2.1 A lwo Phase D-eadlock Detection Protocol
In this protocol, each site maintains a status table for all resources that
are owned by the site. For each resource, the table keeps track of the transaciton
that has locked the resource (if one exists) and the transactions which arc waiting
for the resource (if they exist). Periodically, a niode is choscn as the control. The
chosen control node performs the following operations:
(I) Broadcasts a message to all no(es in the system requesting them to send
their status tables and waits until all tables have been received.
(2) Constructs a demand graph for the system:
- 24 -

(a) If there is no directed cycle, the system is not in a deadlock and the
node releases its control.
(b) If there is a directed cycle, the node continues its execution.
(.i) Broadcasts a second message to all nodes in the system requesting them
to send their status tables and waits until all tables have been received.
(4) Constructs a demand graph for the system using only transactions that are
reported in both the first and second reports:
(a) If there is no direct cycle, the system is not in adeadlock and the
node releases its control.
(b) If there is a directed cycle, the systrn is in a deadlock. The node
reports the deadlock situation to a deadlock resolver.
The above procedure suses a two phase commit protocol. By only using
transactions that are reported in both the first and the second status reports
inconstructing the demand graph, a consistent system stat is obtained. The main
advantage of this protocol is its simplicity. The drawback is the requirement of
two status reports from each site before a deadlock can be determined. In general,
the protocol is good for systems in which deadlocks occur only inftrequently.
4.2.2 A One Phase Deadlock Detection Protocol
In this protocol, a deadlock is detected in one communication phase. Each
site maintains a resource status tat, ior all local resources and a process status
table for all local processes. The resource status table keeps track of the
t~ansactions that have locked a local resource and the trnsactions which are
vaiting for a local resource. The process status table keeps track of the
-rensactions that are being owned by processes local to the site. The system
op-erates according to the following rules:
(A) A process at site S requests a resource -- a transaction (S,t) is created,
- where S is the site name and t is the time at which the transaction is
25-
initiated. An entry (Stpw) is put into the process status table of the site
indicating the transaction (S,t) is waiting for a resource. A message is
sent to acquire the resource.
(B) Site T receives a message that transaction (S,t) requests a resource local
to T:
(i) If the resource is free, the resource is assigned to the transactin and
a lock is set on the resource. An entry (St,a) is created in the
resource status table of the site and a message is sent to notify the
requesting process of the assignment.
(ii) If the resource is being locked, an entry (S,t,w) is created in the
resource status table of the site and a message is sent to
acknowledge the receiver of the request.
(C) Site S receives a resource assignment message for transaction (S,t) -- the
entry (St,%v) in the process status table is changed to (Sta).
(D3) Site S receives a request acknowledgement message for transaction (S,t)
-- do nothing.
(E) A process at site S releases a resource corresponding to transaction (S,t)
.- th -city (S:ta) 's -- rncved 'rni tlei, process sto tii- t nlc Zlrid a
message is sent to notify the releae.
(F) Site T receives a resource message corresponding to transaction (S,t) --
the resource is unlocked and the entry (Sta) is removed from the
resource status table.
Periodically, a node is chosen as the control. The chosen control node
performs the following operations:
(I) Broadcasts a message to all nodes in the system requesting them to send
their status tables and waits until all tables have been received.
- 26-

(2) Constructs a demand graph for the systern using only transactions for
which the resource status table agrees with the process status table (i.e.,
identical entries exist in both the resource status table and the process
status table).
(a) If there is no directed cycle, system is not in a deadlock and the node
releases its control.
(b) If there is a directed cycle, system is in a deadlock. The node reports
the deadlock situation to the deadlock resolver.
In order to show that the above protocol is correct, we have to prove that
t he existence of a directed cycle in the constructed demand graph implies the
,)ccurrence of a deadlock state.
"heore-n 4.5
A system is in a deadlock if and only if there is a directed cycle in the
dcnand graph constructed by the above procedure .
';.2.3 A Hierarchical Deadlock Detection Protocol
In very large distributed data bases, it may be very costly to transfer all
status tables to one site. In parcicular, if the access pattern is very localized, it
will be of great advantage if deadlocks are detected locally. In these systerns, one
-.pproach is to group sites which arc close to each other into a cluster.
Pcriodically, a node in a cluster is chosen to be the control. This control node
executes the one phase deadlock detection protocol and constructs a demand graph
or the cluster. The result obtained by the control node together with the
S:.i'ercluster accesses (which should be relatively few) arc then sent to a central
:c,,.trol node (which is also chosen dynamically). Based on this information, the
,.entral control node constructs the demand graph of the whole system. In this
- 27-
way, deadlocks within a cluster are detected by the control node of the cluster and
deadlocks among clusters are detected by the centrl control node.
Definition
A transaction is a local (intercluster) transaction if and only if the
requesting process and the requested resource are in the same (different) cluster(s).
A Hierarchical Deadlock Detection Protocol
(A) Periodically, a central control node is chosen. This node performs the
following operations:
(1) Chooses dynamically a control node for each cluster.
(2) Broadcasts a message to all control nodes requesting them to send
their status information and wait-for relations of the intercluster
transactions.
(3) Constructs a demand graph of the system using both the intercluster
transactions for which the resource status report agrees with the
process status report and the wait-for relations (which are defined
later) sent from the control nodes. If there is a directed cycle in the
demand graph, the system is in a deadlock, otherwise, the system is
not in a deadlock.
(B) Whenever a node receives a status report request from the central control
node, it performs the following operations:
(1) Broadcasts a message to all nodes in the cluster requesting them to
send their statu tables and waits until all tables have been received.
(2) Constructs a demand graph for the cluster using only local
transactions for which the resource status table agress with the
process status table.
-28 -
(3) Computes the transitive closure of the demand graph. If there is a
directed cycle in the demand graph, the system is in a deadlock.
(4) Dervies the wait-for relations from the transitive closure of the
demand graph. A process/resource is waiting for a process/resource
if and only if:
(a) The procesess and/or the resources are in some intercluster
transactions.
(b) The process/resource is waiting directly or indirectly for the
process/resource (i.e., here is a directed arc pointing from the
process/resource to the process/resource in the transitive
closure of the demand graph).
(5) Send the intercluster transaction status information and the wait-for
relations to the central control node.
The above concept can be extended into many levels. In this way, a
iiierarchy uf control nodes can be constructed. Due to the local access pattern of a
system, the amount of information that has to be sent from a child control node to
its parent can be greatly red'ced.
- 29-
CHAPTER 5
Software Reliability
5.1 Classification of Software Reliability Models
To analyze and further develop different reliability models, we first
classify them based primarily on the phase of software life-cycle during which the
model is applicable, namely, Testing and Debugging phase, Validation phase,
Operation and Maintenance phase. During the Testing and Debugging phase, the
implemented software is tested and debugged. It is often assumed that the
correction of errors does not introduce any new errors. Hence, the reliability of
the program increases and, therefore, the models used during this phase are also
called reliability growth models. These models are mainly used to obtain a
preliminary estimate of the software reliability. However, software developed for
critical applications, like airtraffic control, must be shown to have a high
reliability prior to actual use. At the Validation phase, the software is subjected to
a large amount of testing in order to estimate the reliability. Errors found during
this phase are not corrected. In fact, if errors are discovered the software may be
rejected. The Nelson model (TRW 76) is based on statistical princinles. The
software is tested with test cases having the same distribution as the actual
operating environment. After the software has been thoroughly validated it is put
into operation. During use further errors may be detected or there may be user
demands for new features. These presures result in maintenance activity (SWA 76,
SWA 79), i.e., modification of the software. The addition of new features results in
a growth in the size of the software. Muring the maintenance phase, the possible
activities are: error correction, addition of new features and improvements in
algorithms. Any of these activities canpeturb the reliability of the system. The
new reliability can be estimated using the models for the validation phase.
However, it may be possible to estimate the change in the reliability using fewer
- 30-

,.esting cases by ensuring that the original features have not been altered. We do
nut know of any existing software reliability models applicable during this phase.
Based on the above classifications, we develop a theory of software reliability
based on the nature of the input domain of the program, i.e., the size of the errors
od the number, complexity and continuity of equivalence classes formed in the
.nput domain.
5.2 Testing and Debugging Phase
The major assumption of all software reliability growth models is that
inputs are selected randomly and independently from the input domain according to
he operational distribution.
This is a very strong assumption and will not hold in general, especially so
in the case of process control software where successive inputs are correlted in
zime during system operation. To adjustify the above disadvantage, the models are
developed and can be applied to any type of software, their validity increases as
1he size of the software and the number of programmers involved increases:
(A) Randorn \alk .Model
We cat, view th crrot oize undi," okeiatonal input3, .;ay, , As z tandth
walk process in the interval (O,e). Each time the program is changed (due to error
correctins or other modifications) changes. Let Zj denote the time between
failures after the jth change. Zn is a random variable whose distribution depends
on j. We do not know anything about the random walk process of other than a
sample of time between failures. Hence, one approach is to construct a model for
-ind fit the parameters of the nmodel to the sample data. Then we asume that the
future behaviour of can be predicted fromthe behaviour of the model.
(7) Bayesian Model
An alternative approach is the bayesian approach advocated by Littlewood
-31 -
(LIT 79(B)). Here we postulate a prior distribution for each of 1, 2, .. j- Then
based on the sample data, we compute the postcrior distribution of j+1*
5.3 Validation Phase
The well known Nelson Method during this phase is based upon the policy
that the test cases are selected randomly according to the operational distribution.
However, it suffers from a number of practical drawbacks:
(1) In order to have a high confidence in the reliability estimate, a large
number of test cases must be used.
(2) It does not take into account "continuity" in the input domain. For
example, if the program is correct for a test cse, then it is likely that it is
correct for all test cases executing the same sequence of statements.
(3) It assumes random sampling of the input domain. Thus, it cannot take
advantage of testing strategies which have a higher probability of
detecting errors, e.g., boundary value testing, etc. Further, for most
real-time control systems, the successive inputs are correlated if the
inputs are sensor readings of physical quantities, like temperature, which
~e ,.rt hange rap- Iy. 1nithese cases we -annot perform rarlctond tresting.
(4) It does not consider any complexity measure of the program, e.g., number
of paths, statements, etc. Generally, a complex program should be tested
more than a simple program for the same confidence in the reliability
estimate.
The approach we developed reduces the number of test cases required by exploiting
the nature of the input domain of the program. The input domain based approach
to the estimation of software reliability is: R = I - Ver, where Ver is the estimated
remaining error size. Ver can be deterined by testing the program and locating and
estimating the size of errors found. In most cases this is simple since it is
relatively easy to find the inputs affected by a known error. It this cannot be done,
- 32-
-- -
. ' -. .

random sampling can bo used to estimate the size of the error. It is expected that
oftware for critical applications will contain no known errors during this phase.
.eliability of the program given any input distribution by assuming some knowledge
bout the error distribution in the input domain. Furthermore, we can generalize
dhis by considering the input distribution as well as the membership function of
cach input element in probabilistic equivalence classes defined as fuzzy sets (ZAD
I, 9 )
5.5 Applications
(a) PROGRAMMING LANGUAGE DESIGN: The reliability of a program
,lepends greatly on the language on which it is coded. For example, many more
errors will be introduced in a program coded in a Machine Level Language (MLL)
,han in a program cded in a High Level Lan-uage(HLL). This is the bases of the
concept of language level introduced by -lalstead (HAL77). However, this criteria
rnly considers the difference between the volumes of the programs produced by
us,ng different languages. Here vie propose a different measure of the goodness of
a programming language. The criteria is qualitative and is based on the size of
r,'~ss:le errors w.iich a prnram'ner can commit. A good programming language
construct is one vhich maximizes the change of detecting an error when it occurs,
i.e., it increas:s the size of likely errors. %,'e consider all methods of validating the
software, including code reading, static analysis, dynamic analysis and testing.
(b) PROJECT MANAGEMENT: Another important application of software
reliability theor is in project management. One obvious use of the reliability
measure is as a criterion for the acceptance or rejection of the software. Besides,
sofvtware reliability can be applied to the scheduling of testing when several
different strategies can be used. The analysis is based on the concept of efficiency
cf testing strategies. We develop a probabilistic model which determines a test
case selection strategy in order to minimize some cost criterion. The cost could I)-
- 33 -
the amount of time required to develop a test case using a particular strategy.
This is useful for control systems' software since the requirement of high
confidence in the reliability estimate implies a large amount of testing. The model
also specifies the optimal distribution of test cases over thevarious [nodules
constituting the program. For example, simple modules should be tested less than
complex error-prone module;.
- 34

'CHAPTLR 6
!5'uture Work
One future research area is to develop the criteria for grouping critical
eions and monitors into sets so to minimize the among of "unstructuredness"
rreated by the grouping. Another future research area is to develop faster
dleadlock detection procedures. Although it has been proven that determining the
.afety of a system is NP-complete, the computation complexity can be in
,:olynomial to the size of the program if some parameters are fixed.
One issue which we have not dealt with is thestimtion of the overall
;irdware/software system reliability. The combination of hardware and software
S..eliblity estimates is discussed in (BUN S0, KEE 76, KLI S0, TIIO SO). However,
tne approach generally advocated is to assume that hardware and software failures
ere indepcixent, so that the overall system reliability is the product of the
,oftware arid hardware reliability estimates. This is unsatisfactory since it is
possibie for the software to rectify hardware failures and vice versa. For (xample,
tie failure of a line printer need not be a system failure if the software can
re-dirc- L the output to another device. A viable approach is to view the overall
"'.stcm ,s b:.*.g si .i"lar t- a r-.i ..i u .Lhi ; . (
For complex systems, methods must bc dcveloped for estimating the
d.>i~n correctness of the hardware. Thus, failures can be due to software errors,
iitrd'viare component break-downs or hardware design errors. The applicability of
;oftware reliability growth models discussed above to estimating the design
zorrectness needs to be investigated.
Another important research area is developing techniques for validating
.oftware reliability models. At present the models are applied to some project
'Iata and their validity is deduced from the results. This is not satisfactory since
very few sets of actual data are available. Further, the rnodels make some
- 35-
L- gli,-- -- -I.-

assumriptions which may not hold for the particular project. For example, most
software reliability growth models assurne that the testing process is the same as
the operational environment, which is not true in general. In this thesis we have
adopted a deductive approach coupled with several experiments. Also, we have
derived auxiliary results (e.g., the optimal set of test cases) which seem
reasonable. Further, we have developed an independent way of validating each
model, namely, the determination of the error size for the stochastic model and
the error seeding approach to estimating the correctness probability for the
theoretical model we developed.
- 36-
SO
Bibliography,
(AGE 75) Agerwala, T. and Flynn, M. 3., "On the Completeness of
Representatin Schemes for Concurrent Systems, " Conference on
Petri Nets and Related Method, M.I.T., Cambridge, Massachusetts,
July 1975.
iL E. 76) Bell, T. E. and Thayer, T. A., "Software Requirements: Are they
really a problem?" Proceedings of the 2nd International Conference
on Software Engineering, October, 1976.
([IZ 72) Brinch Hanse, P., "Structure Multiprogramming," Comm. ACM, Vol,
15, No. 7, July 1972.
'1URI 73a) Brinch Hansen, P., "Concurrent Programming Concepts," Computing
Surveys, Vo!. 5, No. 4, Dec. 1973.
I1 73[) Brinch I larnen, P., Operating Systein Principles, Prentice-iHall,
Englewood Cliffs, N. J., 1973.
(I UN S0) Bunce, V. L., "Hardware znd software: an analytical approach,:
Prec. Annuzl Reliability and Maintainability Synp., San Francisco,
CA., Jan. 1980, pp. 209-213.
_ CI' 7 ) C '-unr,. R. C., '*,% user-er iented software eliil,ilit:y mod::l," Proc-.
COMPSAC 7S, Chicago, IL., Nov. 1978, pp. 565-570.
(DIJ 71) Dijkstra, E. W., "Hierarchical Ordering of equential Processes," Acta
Inforrnatica, Vol. 1, No. 2, 1971.
"FR 78) Ferrari, D., Conputer Systems Performance jvalu:ation,
Prentice-Hall, Inc., E-nglewood Cliffs, 1978.
(GS 71) Gostelow, K. P., "Flow of Control, Resource Allocation and the
Proper Termination of Programs," Ph.D. Dissertation, School of
Engincering and Applied Science, University of California, Los
Angcles, Dec. 197 1.
- 37 -
- -Mi - ,
(hAG 75) Hack, M., "Decid ability questions for Petri niets," Ph.D. Thesis, Dept,
of Electrical Engineering, ... ,Cambridge, Mass., Dec. 1975.
(HAL 77) Halstead, M. H., Elements of Software Science, Elsevier
North- Hollance, Inc., New York, 1977.
(11AM 76) Hamilton, LM. and Zeldin, S., "Higher Order Sof tware Methodology for
Defining Software," IEEE Trans. on Software Engineering, Vol. SE-2,
No. 1, March 1976.
(HOA 74) floare, C. A. R., "Monitors: An Operating System Stgructuring
Concept," Comm. ACIM, Vol. 17, No. 10, Oct. 1974.
(HOL 71) Hiolt, R. C., "On Deadlock in Computer Systems," Ph.D. Thesis, Dept.
of Computer Science, Cornell Uniiversity, Ithaca, N.Y., Jan. 1971.
(i',AR 66) Karp, R. 1M. arid Miller, R. E., "Properties of a mnodcl for Parallel
Computation. ck terminincy, termination, quICUCing," SIAM J. ACPp.
Math 14, 6, Nov. 1 906.
(KA."d 72) Karp, R. M., "Reducibility A\mong Comfinatorial Problems,"
Complexity of Computer Computations, Plenum Press, N.Y., 1972.
(.KEFE. 7 6) Keegan, R., It., Howard, R. C., "Approximation mnethod for
- ~s.imra',ing mnx.ial ~dr: c: a siLaccmrue
electro-mcchanical systemn," Proc. Annual Rflia11biiy and
Maintainability Syrnp., 1976, pp. 434-439.
(KLI 8ri) Kline, MI. B~., "Sof tware and hardware - & M: what ar, h
differences?" Proc. Annual 1Reliability anid Maintainability Symp.,
San Francisc, CA., Jan. 1980, p?. 179-185.
(LI11: 7 6) Lien, Y. F., "Teimination Properties, of Gencinalized Petri Nets."
SIAM J. Compijuter 5, 2, June 1976.
(LIT 75(h)) Littlewvvud, Bs., "A reliability modrel for Markov structured sof tware,"1
-3 IS
Proc. 1975 Int. Conf. Reliable Software, Los Angeles, CA., pp.
204-207.
.,ILIT 79(B)) Littlewood, B., "How to measure software reliability and how not to
•..," IEEE Trans. Reliability, Vol. R-28, June 1979, pp. 103-110. Also
in Proc. 3rd Int. Cont. on Software Eng., Atlanta, GA., May 1978, pp.
37-45.
ilIT 79(C)) Littlewood, B., "Software reliability model for modular program
structure," IEEE Trans. Reliability, Vol. R-28, No 3, Aug. 1979, pp.
241-246.
(NOE 73) Noe, J. D. and Nutt, G. J., "Macro E-nets for Representation of
Parallel Systems," IEEE Trans. on Computers, Vol. C-22, No. 3,
September 1977.
(PET 717) Peterson, J. L., "Petri nets," Computing Surveys, Vol. 9, No. 3,
September, 1977.
(l'OS 74) Postel, 3. B., "A Graph Modocl Analysis of Computer Coinh,,unication
Protocols," Ph.D. dissertation UCLA-Erig-7410, Jan., 1974.
(! 10 z0) Thomson, W. E., Chelson, P. 0., "On the specification and testing of
coft,,r reliab:lity," Pro.. Annvl ".eliabilit)' anJ t.inw-Ynal ility
Symp., San Francisco, CA., Jan. 19SO, pp. 379-383.
(TRW 76) TRW DEfense and Space Systems Group, Software Reliability Study,
Report No. 76-2260, 1-9-5, TR1.W, Redondo Beach, CA., 1976.
t(7AD 79) Zadch, L. A., "Fuzzy sets and inforniationg;ranularity,' Advances in
Fuzzy Set Theory and Applications, edited by M. M. Gupta, R. K.
Ragad. and 1. R. Yag!r, NorthHolland Publishing Co., 1979.
- 39 -


![Abstract arXiv:2006.10042v1 [cs.CV] 17 Jun 2020 · Univ. of Southern California liushich@usc.edu Yi Ma Univ. of California, Berkeley yima@eecs.berkeley.edu Abstract 3D reconstruction](https://static.fdocuments.net/doc/165x107/5fc9fcab11d0cf0edc6279e5/abstract-arxiv200610042v1-cscv-17-jun-2020-univ-of-southern-california-liushichuscedu.jpg)