
050407 WILLHITE TORP16thConf Field Demonstration of · PDF fileG. Paul Willhite Class II...
28
Field Demonstration of CO 2 Miscible Flooding in the Lansing-Kansas City Formation, Central Kansas April 7, 2005 Sixteenth Oil Recovery Conference Wichita, KS G. Paul Willhite Class II Revisited DE-AC26-00BC15124 Murfin and WI Partners
Transcript of 050407 WILLHITE TORP16thConf Field Demonstration of · PDF fileG. Paul Willhite Class II...

Field Demonstration of CO2Miscible Flooding
in the Lansing-Kansas City Formation, Central Kansas
April 7, 2005Sixteenth Oil Recovery ConferenceWichita, KSG. Paul Willhite
Class II Revisited DE-AC26-00BC15124
Murfin and WI Partners

Purpose of Demonstration• Determine the technical and economic
feasibility of using CO2 miscible flooding to recover residual and bypassed oil in LKC shallow shelf carbonates.
• Develop reservoir data for the LKC and Hall-Gurney for other floods
• Develop an understanding of operating costs and operating experience for CO2 miscible flooding in Lansing-Kansas City reservoirs
• Oil in tank and provide sufficient information to expand to commercial scale

Type LogCO2#18
L-KC “C” divided into 6 Layers-three flooding cycles
• General Properties*– C1: 8 md, 18.8%– C2: 150 md, 25.8%– C3: 40 md, 22.0%– C4: 6 md, 19.4%– C5: 2 md, 14.7%– C6: 0.3 md, 12.0%
• *- CO2#18 exhibits better properties than average for site
0.0 0.5 1.0Neutron
C1C2C3C4C5C6D
Gamma10

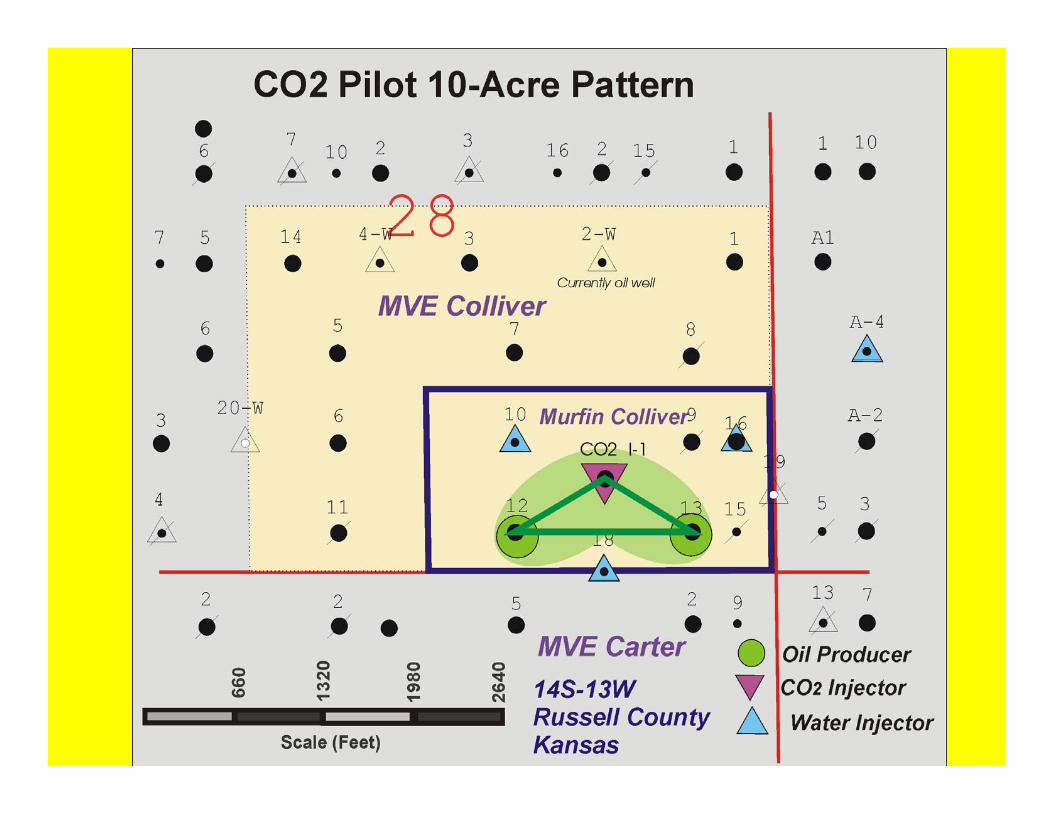
Murfin ColliverCO2 Project
• 70 acre lease• ~10 acre half of
five spot• One CO2 injector• Two Producers• Two Containment
Injectors• 0.290 BCF CO2
injected• 4.6 year operating
life
MurfinColliver
MurfinTB Carter
KM Carter
28
33
14S-13W Russell Co., Kansas
7
10
12
16
1318
CO2I-1

Overview
• Budget Period 1(March 2000-January 2004)– Drill CO2 injection well, technical and economic
evaluation, develop WI partnership(2000-2003)– Drill water supply well and recomplete production
and water injection wells(2003).– Prestartup Activities(August –November 2003)– Continuous CO2 Injection(December -2003)
• Budget Period 2(February 2004-December 2008)-Implementation
• Budget Period 3(January 2009-March 2010)– Post CO2 flood monitoring

CO2#13
CO2#16
CO2#10
Carter 2
CO2#I-1
CO2#12
CO2#18
Carter 5
PPV

Project ManagementPPV= Processable pore volume contacted by carbon dioxide
that is produced by pattern production wells
• PPV~170,000 RB• Must be able to inject at 84.8 RB/D(to account for losses)
and produce from PPV at a rate of 14 PPV%/year(65.2 RB/D).
• Adequate productivity in CO2# 12 and 13 to complete demonstration project within the 5 year time window in the DOE project.
)1( 2orCOiwp SSVPPV −−=

Project Management• Control injection rates into CO2I-1, CO2#10 and
CO2#18 to maintain minimum miscibility pressure(~1200 psi) in most of the PPV to ensure miscible displacement and control CO2 loss to the north
• Monitor production rates and balance with CO2 injection – ~29% of the production from CO2#12 is from the PPV– ~87% of the production from CO2#13 is from the PPV
• Control Injection/Withdrawal Ratio from PPV to 1 after allowance for carbon dioxide losses to the north.

Prestartup Activities
• Demonstrate connectivity between CO2I-1 and CO2#13
• Demonstrate that the estimated pattern volume can be processed within the time frame of the project(5 years)
• Installation of CO2 injection equipment• Pressurization of pilot area• Establish withdrawal rates at CO2#12 and
#13

AplexA-50
Portable Storage Tank
ControlValve
Vent
P TFlowmeters
Data Acquisition Control System
P
CorkenCharge Pump
AplexA-50
Portable Storage Tank
ControlValve
Vent
P TFlowmeters
Data Acquisition Control System
P
CorkenCharge Pump

CO2 Injection Facilities

Injection Skid

Aplex A-50 Triplex

Flowmeter at CO2I-1

Carbon Dioxide Injectivity
0
50
100
150
200
250
300
2003 2003 2004 2004 2004 2004 2004 2004 2004 2004 2004 2004 2004 2004 2005 2005
Nov Dec Jan Feb March April May June July Aug Sept Oct Nov Dec Jan Feb
MC
FD

0
5
10
15
20
25
30
35
40
45
50
2003 2003 2004 2004 2004 2004 2004 2004 2004 2004 2004 2004 2004 2004
Nov Dec Jan Feb March April May June July Aug Sept Oct Nov Dec
Ven
t Los
s, %
of I
njec
ted
CO2
Replace Plungersin Aplex A-50
Vent Loss from Portable Storage Tank

Estimated Reservoir Pressure Distribution

Summary of CO2 InjectedFebruary 2005
• Cumulative Injected– 112.25 MMSCF
• CO2 Available for Project– 290 MMSCF
• % Injected– 38.7
• % Surface Losses– 11.4% of amount injected
• PPV Injected– 33.5%
• CO2 Loss to North and Out of Zone – 29-39%

CO2 Injectivity TestCO2 I-1January 27, 2005
•14% in C1/Upper C2
•0% in Middle C2 zone
•34% in Lower C2/Upper C3
•52% in C3
•Middle C2 zone-shingle with limited lateral extent??
•86% of injection is into low permeability intervals of C2/C3 zone
•Production response will be delayed

Transition in Permeability
Gonzalez & Eberli (1997)
Tidal Channel Spillover Lobe
Ripples on Top ofSand Bars
Prograding ForesetsSand WaveBase Level
Ripples on Channel Floor
Gonzalez & Eberli (1997)
Tidal Channel Spillover Lobe
Ripples on Top ofSand Bars
Prograding ForesetsSand WaveBase Level
Ripples on Channel Floor
Higher Permeability100’s md
Moderate Permeability10’s md
Higher Permeability100’s md
Moderate Permeability10’s md
Low k contact
CO2I#1 Colliver #13

Oil Production-Total Pattern
0
0.5
1
1.5
2
2.5
3
3.5
4
4.5
5
2003 2003 2004 2004 2004 2004 2004 2004 2004 2004 2004 2004 2004 2004 2005 2005
Nov Dec Jan Feb March April May June July Aug Sept Oct Nov Dec Jan Feb
Oil
Rate
, B/D
CO2#13CO2#12
Treated CO2#13 with Two tanks of CO2 12-9-04 and SI for26 days

0
50
100
150
200
250
2003 2003 2004 2004 2004 2004 2004 2004 2004 2004 2004 2004 2004 2004 2005 2005
Nov Dec Jan Feb March April May June July Aug Sept Oct Nov Dec Jan Feb
Liqu
id R
ate,
B/D
CO2#12CO2#13
CO2#13-Huff and PuffSI-December 9
Liquid Production Rates

Cumulative Oil Production
0
200
400
600
800
1000
1200
Sep-03 Dec-03 Mar-04 Jul-04 Oct-04 Jan-05 Apr-05
Cum
ulat
ive
Oil
Prod
uced
, STB

0
1000
2000
3000
4000
5000
6000
7000
8000
Nov
Dec
Jan
FebMarc
h
April
May
June
July
Aug
Sept
Oct
Nov
Dec
Jan
Feb
GO
R, S
CF/S
TB
CO2 Production in CO2#12
CO2 Production in CO2#13
Produced GOR-Total Pattern

Summary • Oil and carbon dioxide production rates differ from
West Texas experience.– Oil rate increases before substantial amount of CO2 is
produced.– CO2 rate and GOR are relatively constant.– Do not know if this is related to reservoir heterogeneity,
saturation distributions or the pore structure.• CO2 production rate still within acceptable values.-
WAG not needed yet to control CO2 yet.• Carbon dioxide injection rate has exceeded and fell
behind the fluid withdrawal rate from the PPV. Need to provide better control in the field.

Summary • Injected CO2 is confined to the C zone• Primary oil bank generated by CO2 injection has
not arrived at either CO2#12 or CO2#13• GOR is relatively constant at ~4000-little CO2
channeling • Late arrival of oil bank appears to be due to
more complex areal reservoir heterogeneity in the pattern
• CO2#13 responded to CO2 stimulation-cannot determine if increased oil production is due to stimulation or connection with the oil bank

0
1
2
3
4
5
6
7
8
9
10
2/27 3/4 3/9 3/14 3/19 3/24 3/29 4/3 4/8
Patte
rn O
il R
ate,
B/D
0
50
100
150
200
250
Wat
er P
rodu
ctio
n R
ate,
B/D
Replace PumpCO2#12
Vent CO2#12 Annulusto Atmosphere


