05 chapter iv - Shodhganga : a reservoir of Indian theses...
28
CHAPTER IV GENERAL LANDUSE PATTERN
-
Upload
phunghuong -
Category
Documents
-
view
221 -
download
2
Transcript of 05 chapter iv - Shodhganga : a reservoir of Indian theses...

CHAPTER IV
GENERAL LANDUSE PATTERN

CHAPTER IV
GENERAL LANDUSE PATTERN
4.1 Introduction
4.2 Meaning of Landuse
4.3 Classification of Landuse
4.4 Tahsilwise trends in General Landuse Pattern in
Sindhudurg District
4.4.1 Area under forest
4.4.2 Area Not available for Cultivation
4.4.3 Other Uncultivable land
(Excluding fallow land)
4.4.4 Fallow land
4.4.5 Net Sown Area
4.5 Volume of change in landuse from 1980-85 to
1995-2000
4.6 Tahsilwise per capita net sown area in Sindhudurg
District
4.7 Landuse Efficiency in Sindhudurg District
4.8 Summary

128
CHAPTER IV
GENERAL LANDUSE PATTERN
4.1 Introduction
There are considerable regional variations in the general land use
of area because of landform diversities and rainfall in the study region. It
is essential to shift from generalities to particularities in the study region,
where agriculture is the only means of livelihood for majority of the
people. Such studies are fundamental for future planning.
Studies on land use pattern have received a good deal of attention
from Indian geographers in the past and continue to draw their attention.
Presently the patterns are being minutely investigated at the regional or
micro regional rather than at the national level. In the view of the recent
extension of irrigation and other facilities, the North-Western India and
some parts of South-India have received comparatively more attention
from the research works. In Utter Pradesh and Bihar, research
publications on this aspect of agriculture appear to be more numerous
than in other part of the country. This is because the abundance of
agricultural resources as well as their various use in the region are
facilitated by congenial environment and capability of the people to adopt
themselves to changes in the environmental determinants. Indian
geographers have long been attracted to study the problems of land use in
the country with a view to finding out ways and means for scientific
utilization of land. Such studies range from inventories of land use
surveys to isolated topical or regional descriptive accounts of land use
variations both in space and time. A rational assessment of land and its
scientific utilization has become important. It is possible only if the whole
complex of land use is studied at the district, tahsil or even village level

129
by taking into account the local physical and socio- economic conditions
(Ali Mohmmed 1978); Land use mapping is important for evolution,
management and conservation of natural resources of an area. Land use/
land cover inventories form essential component in land resources
evolution and environmental studies (NRSA).
Land use is any kind of permanent or cyclic human intervention on
the environment to satisfy human needs and the land use capability or
land suitability is the potential capability of given tract and to support
different types of land utilization under given cultural and socio-
economic conditions (Vink A.P.A. 1975). Land is gift given by the nature
to the mankind hence it is the basic resource of human society. Land use
is the surface utilization of all developed and vacant land on a specific
point at a given time and space. This leads one back to the village farm
and the farmer to the fields, garden pastures, fallow lands and forests and
to the isolated farm steam (Freeman T.W. 1968).
The study of land use in its spatial context is essential to
understand the area of optimum land use and degraded areas, the
comprehensive study of land use is of immense value to ensure better
returns from the land to meet future requirements for food, and industrial
raw materials and for successful planning of agricultural growth,
organized urbanization, regional development and there by to accelerate
the process of development in the country. It is also useful for planners to
evolutes the possibilities and limitations of further spatial development to
avoid or restrict undesirable trends of land exploitation to adjust the
forms of land use to the land capability and to direct the expansion of
intensive land utilization into suitable areas (Nageswar Rao and
Vaidyanathan, 1990). Land is necessary for human survival, because it
provides mean with living space, with food and with number of raw

130
materials which are used in the satisfaction of his wants. But as necessary
as the land factor may be, man plays and important role in conditioning
and transforming his physical environment (Barlowe, R.1963)
The study of land use is important not only in agriculturally
dominated, over populated developing regions but throughout the world
because of its relationship with different human phenomena. It’s
importance also increased during the population pressure and decreasing
man and land ratio, increasing demand for food and raw materials the
need for optimum utilization of land in an integrated manner has assumed
greater relevance. Therefore, scientific regional, intensive and proper use
of every parcel of land has become essential. Lands’ planning on micro
level, based on land use surveys is the first step in putting our lands to the
maximum use. The nature and intensity of land use is closely related to
the technology adopted by man. Extension of agricultural land with the
help of technology may cause considerable changes in land use.
Geography deals with the spatial relationship between these aspects and
planning. This is because land use changes to meet available demands of
the land by the society in its new ways and conditions of life. The
demands for new uses of land may be inspired by a technological change
or by a change in the size composition and requirements of a community.
Some changes are short linked whereas other presents a more constant
(Jackson J.N; 1963).
The main objective is to highlight the spatiotemporal pattern of
land use in the study region. The tahsil is considered as a study unit and
the land use categories are based on the census classification. The present
chapter deals with the pattern of agricultural/general land use during the
period of 1980-81 to 2001.
131
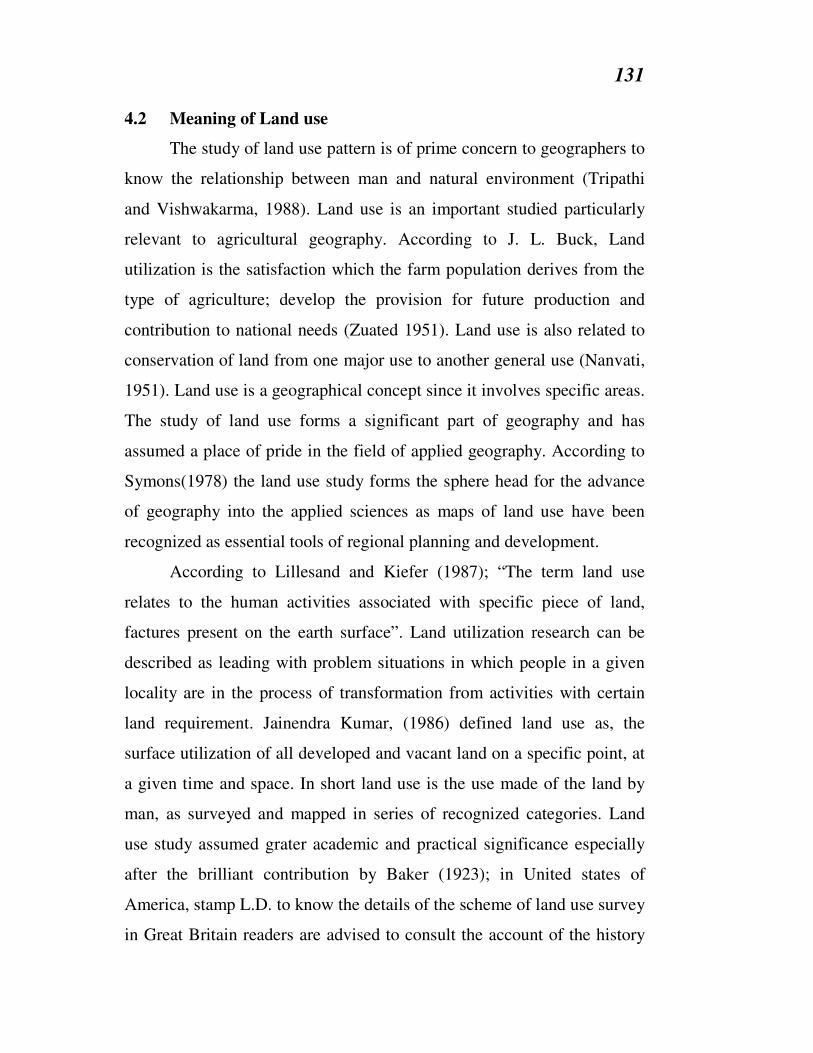
4.2 Meaning of Land use
The study of land use pattern is of prime concern to geographers to
know the relationship between man and natural environment (Tripathi
and Vishwakarma, 1988). Land use is an important studied particularly
relevant to agricultural geography. According to J. L. Buck, Land
utilization is the satisfaction which the farm population derives from the
type of agriculture; develop the provision for future production and
contribution to national needs (Zuated 1951). Land use is also related to
conservation of land from one major use to another general use (Nanvati,
1951). Land use is a geographical concept since it involves specific areas.
The study of land use forms a significant part of geography and has
assumed a place of pride in the field of applied geography. According to
Symons(1978) the land use study forms the sphere head for the advance
of geography into the applied sciences as maps of land use have been
recognized as essential tools of regional planning and development.
According to Lillesand and Kiefer (1987); “The term land use
relates to the human activities associated with specific piece of land,
factures present on the earth surface”. Land utilization research can be
described as leading with problem situations in which people in a given
locality are in the process of transformation from activities with certain
land requirement. Jainendra Kumar, (1986) defined land use as, the
surface utilization of all developed and vacant land on a specific point, at
a given time and space. In short land use is the use made of the land by
man, as surveyed and mapped in series of recognized categories. Land
use study assumed grater academic and practical significance especially
after the brilliant contribution by Baker (1923); in United states of
America, stamp L.D. to know the details of the scheme of land use survey
in Great Britain readers are advised to consult the account of the history

132
and evolution of land use survey in Britain as introduced by L. Dudly
Stamp in his work entitled. “The land use of Britain- Its use and Misuse”,
has been able to generate a good deal of regional \ and systematic survey
of land use of whole of Britain.
Chowdaian (2001) explained that land use and land utilization is
not one and the same. Land use is the use actually made of any parcel of
land, house, industrial location etc. are land use categories, whereas term
residential, industrial, agricultural, refers to land utilization and it mainly
deals with the problems related to society and the region as a whole, land
utilizations is therefore dynamic concept since it undergoes certain
changes due to change in socio-economic conditions, needs and with the
adoption of innovation. Therefore, study of land use is a subject of
continuous interest.
In India, several geographers have paid attention on different
aspects of land use studies at regional, district and micro level. Some of
the eminent researchers who have carried out research work on different
aspects of land use studies are chatter see (1952), Shaffi (1961,
1966,1968); Prakash Rao (1959); Jasbir Singh (1974); Roy(1968) and
Mishra (1990);
The study of land utilization is of immense value in tracing out the
past use of land its future trend. Only through the study of past land
utilization one can be able to predict its future use and evolve land use
planning of a particular region.
4.3 Classification of land use
Landuse classifications is the systematic arrangement of land on
the basis of certain similar characteristics mainly to identity and
understand their fundamental utilities intelligently and effectively. The
land use pattern is complex and dynamic. The present pattern of land use
133
is the result of long continued operations of the whole range of
environmental factors but modified study of land utilization in China
concludes from a survey of 16786 farms in 168 localities of eight
agricultural regions that before agricultural China-there can be no great
increase in account of farm land. He has given seven types of land
utilization of China.
The land pattern indicates the spatiotemporal sequence of area
under different uses. It also indicates that net available land for
cultivation which is an important factor since it is the base for agricultural
planning (Arsud, 2000).
The international geographical classification of world land use
along with color scheme is mainly suited to local condition. The
classification is as fallows. World land use survey was drown up under
the auspices of UNESCO
1. Settlement and associated non-Agricultural land (Dark and light
red)
2. Horticulture (deep purple)
3. Tree and perennial crop (light purple)
4. Crop land: continental rotation cropping (Dark brown) land
rotation (light brown).
5. Improved permanent pasture (light green).
6. Unimproved permanent pasture (yellow)
7. Wood lands: dense (dark green) open (medium green) scrub (olive
green) swampy forest (blue green)
8. Swamps and marshes (blue)
9. Unproductive land (grey)
Some land is for a specific use depending mostly on the physical
characteristics of land to its suitability for particular use is related. Five
134
major categories of land use are noted in the season and crop report for
Maharashtra state which are,
1. Area under forest
2. Land not available for cultivation including
i) Barren and uncultivated land
ii) Land put to non agricultural uses
3. Other pastures and grazing land including
i) Cultivable waste land
ii) Permanent pasture and grazing land
iii) Land under miscellaneous tree crops and groves.
4. Fallow lands including
i) Current fallow
ii) Other fallow
5. Cropped area including
i) Net sown area (NSA)
ii) Area sown more than once
iii) Gross cropped area (GCA)
Census of India have classified land utilization in nine different
categories, but the present study these have been grouped into five major
land use categories as the percentage of area under individual categories
is relatively insignificant. On the basis of the statistical data abstracted
from the sources referred of Sindhdurg district may be divided into five
major land use categories.
1. Area under forest
2. Area not available for cultivation
3. Other uncultivated land excluding fallow land
4. Fallow land
5. Net sown area, (area under other categories are negligible).
135
4.4 Tahsil wise trends in General Land use pattern
This chapter examines the general land use pattern of Sindudurg
district. Land use statistics for the period 1981 to 2000 have been
abstracted from the Socio-Economic Review and District Statistical
Abstracts prepared by the Bureau of Economics. Tahsil level statistics
have been used for analyzing the distributional patterns of general land
use and changes therein. The general land use pattern of the region under
study differs from tahsil to tahsil due to the locality and physical
condition. The existing pattern of land use is shown in map 4.1. There is
change in physiography, soil types, rainfall and geology all these factors
played important role in determining the agricultural practices. Data for
first quinquennial (1980-85) was obtained tahsil wise. This trend in
general land use pattern in Sindudurg District is shown in table 4.1 with
this generalized picture for this analysis, quinquennial averages for 1980-
85 and 1995-2000 are used to find out the spatio-temporal changes.
The table No. 4.1 brings out the main elements of land utilization
in the study region.
4.4.1 Area under Forest
The categories include any land classed or administered as a forest
under legal enactment. The area figures under grazing lands or a crop
within the forest are also included in the area under forest. It is clear from
table 4.1 and map 4.3 area about 33020 hectares or 6.55% of the total
geographical area of Sindhudurg District was under forest during 1980-
85. Forest area increased from 33020 hectares to 38220 hectares i.e. by
1.07% during the period of investigation. Though the area under forest
has increased during the period of investigation it is less than average for
Maharashtra (17.3).

136
Table No. 4.1
Tahsil wise General Land use in Sindhudurg District (1980-85 and 1995-2000)
(Area in Hectares) Landuse Year Devgad Vaibhavwadi Kankavali Malvan Vengurla Kudal Sawantwadi District
1980-85 33 85.2 3 6.4 80.6 122 330.2
% 7.91 11.30 0.47 2.22 9.83 9.09 6.55
1995-2000 24.8 25.6 90.4 3 8.6 100.8 129 382.2
% 3.18 6.14 11.83 0.48 2.84 12.78 9.60 7.63
Area under
Forest
Volume of
change 3.18 -1.76 0.52 0.01 0.62 2.94 0.50 1.07
1980-85 228 90 124.4 231.6 76.6 177 396.2 1326.8
% 29.05 21.58 16.50 36.57 26.61 21.60 29.54 26.28
1995-2000 334.6 83.4 125.6 223.4 78 190 346.8 1381.8
% 43.00 20.02 16.44 36.24 25.82 24.09 25.82 27.59
Area not
available for
Cultivation Volume of
change 13.94 -1.55 -0.06 -0.33 -0.78 2.49 -3.71 1.31
1980-85 274 206 319.6 78 84.2 311 349.6 1622.4
% 34.92 49.4 42.39 12.31 29.25 37.95 26.07 32.21
1995-2000 64.6 5.6 266.4 135.8 63 149.2 316 1050.6
% 8.30 13.35 34.86 22.03 20.86 18.92 23.53 20.97
Other
Uncultivable
Waste Land Volume of
change -26.61 -36.04 -7.52 9.71 -8.39 -19.03 -2.53 -11.23
1980-85 165 10 16 139 15.6 31.4 203.8 580.8
% 21.03 2.39 2.12 21.95 5.42 3.83 15.19 11.53
1995-2000 200.8 143.4 58 51.6 25.2 114.4 276.2 869.6
% 25.81 34.43 7.59 8.37 8.34 14.51 20.56 17.36
Follow Land
Volume of
change 4.77 32.04 5.469 -13.58 2.92 10.67 5.37 5.83
1980-85 117.6 78 208.6 181.6 105 219.4 269.4 1179.6
% 14.98 18.70 27.63 28.68 36.48 26.77 20.08 23.42
1995-2000 153.2 108.4 223.6 202.6 127.2 234 274.8 1323.8
% 19.69 26.03 29.26 32.86 42.11 29.68 20.46 26.43
Net Sown
Area
Volume of
change 4.70 7.32 1.59 4.18 5.63 2.90 0.37 3.01
1980-85 784.6 417 753.8 633.2 287.8 819.4 1341 5036.8
% 100 100 100 100 100 100 100 100
1995-2000 778 416.4 764 616.4 302 788.4 1342.8 5008
Total
Geographical
Area % 100 100 100 100 100 100 100 100
Source- Socio-Economic Abstract of Sindhudurg Disrict 1981-82 to 2005-06.

137
Area under forest varies from tahsil to tahsil in the district Map
4.3A shows that out of the total geographical area less than below 5%
area was under forest in Devgad, Malvan, Vengurla tahsils and 5% to
10% geographical area was noticed under forest in Vaibhavwadi and
Sawantwadi tahsils during the period 1995-2000. Above to percent
geographical area was noticed under forest during the last quinquennial in
Kankavali and Kudal tahsils Map 4.3A shows that area under forest
varies between 12.78% and 11.83% in Kudal and Kankavali tahsils which
has maximum area under forest in study region followed by 9.60%
Sawantwadi, 6.14% Vaibhavwadi, 3.18% Devgad and 2.84% in Vengurla
tahsils. The lowest area under was in Malvan tahsil i. e. 0.48% in1995-
2000.
Below 2% in forest area was recorded in decline Vabhavwadi
tahsil. From 0 to 2% increase was noticed in Kankavali, Malvan,
Vengurla and Sawantwadi tahsils. Above 2% increase was noticed in
Devgad and Kudal tahsils each from 1980-85 to 1995-2000 (Map 4.3B).
It is low as compared to the state.
4.4.2 Area Not Available For Cultivation
This category includes
i) The land put to non agricultural use
ii) Barren and uncultivable land.
Barren and uncultivable lands are rocky out crops of hills, plateaus,
mountains etc. This land can under no conceivable circumstances be
brought under cultivation but at a very high cost a very little proportion
may be classed as uncultivable. This area which is not available for crop
cultivation shows a close association with other uncultivated land and net
sown area will be transfer to categories. Area under non agricultural use
covers all lands occupied by settlements, roads, rail ways, and beds of

138
streams, ponds and canals. The western ghats of the study region have
relatively higher proportion of these lands mainly due to adverse
physiographic conditions like rugged hilly areas, steep slopes; rocky
exposures, lateric cap cover and salt affected inter tidal areas.
Out of the total geographical area of Sindhudurg District an
average was 27.67% this is more than three times to the average area
under this group for the state which is 9.5%. Tahsil wise distributional
patterns under this category are exhibited in map 4.4 A. Area belongs to
this category which is much higher as compared to state average. Out of
the total geographical area below 20% area was found under this category
in Kankavali tahsil and 20% to 30% area is observed in Vaibhavwadi,
Vengurla, Kudal and Sawantwadi tahsils. There are remarkable variations
in the distribution of land under this category, Malavan and Devgad
tahsils recorded over 30% of land area under this category-during the
period of 1999-2000 (map 4.4A).
Volume of change in land not available for cultivation is shown in
the map 4.4B. No uniform pattern is observable in change. Over all
changes are significant. Below 04% negative change in this category is
observed in Vaibhavwadi, Kankavli, Malvan, Vengurla and Sawantwadi
tahsils, whereas below 04% positive change in area not available for
cultivation was observed in Kudal tahsil during the period of
investigation. Above 4% positive change in this land area category is
recorded in Devgad tahsil during 1980-85 and 1995-2000 (map 4.4B).
4.4.3 Other Uncultivable Land (Excluding Follow Land)
This category consists of three types of land viz.
a) Cultivable waste land
b) Permanent pasture and grazing land,
c) Land under miscellaneous tree crops and groves.

139
Cultivable waste land denotes land considered by present
judgments as cultivable but actually not cultivated during the current year
and last five years or more in succession. Permanent pasture and other
grazing land i.e. all grazing lands which may be permanent medows and
village common pasture. Area under miscellaneous trees, crops and
groves overcome all cultivable land which is not included in the net area
sown but is put to some agricultural use other than seasonal cropping. In
the ensuing discussion they are considered together. This is potential
agricultural land which will be available for extension of agriculture but
not been cultivated owing to different reasons.
Total area under this category amounts 149920 hectares or 31.30%
which is much higher than state average of 8% during the first
quinquennial and it was decreased up to 105100 hectares in the last
quinquennial. Regional distribution under this land use category varies
from 8.30% to over 34%. Below ten percent area under this land use
category was recorded in Devgad. Tahsil-while 10% to 20% area was
registered under this category in Kudal and Vaibhawadi tansils during the
periods of 1995-2000 and 20% to 30% area under this land use category
was found in Malvan, Sawantwadi and Vengurla tahsils. Over 30% area
under this category was observed in Kankavali tahsil during the last
quinquennial, map (4.5A).
The spatial distribution of volume change in other uncultivated
land as depicted in map 4.5B is very uneven. Below 10% negative change
in this land use category took place in Sawantwadi, Kankavali and
Vengurla tahsils whereas 10% to 20% negative change in this category
was recorded in Kudal tahsil and 20% to 30% negative change was
observed in Devgad tahsil. While 30% to 40% negative change recorded
in Vabhavwadi tahsil from 1980-85 to1995-2000, whereas below 10%

140
positive change in this land use category was registered in only Malvan
tahsil.
4.4.4 Fallow Land
Term fallow is applied to lands not under cultivation of the time of
reporting, but which have been sown in the past. The duration of period
for which land remains fallow is different in different parts of the study
region. This land use category consists of
i) Current fallow land
ii) Other fallow land
Current fallow means the lands left unsown during the current
agricultural year only to regain fertility and also that which remained
uncultivated in the short term for want of moisture and economic reasons.
Other fallow lands comprise all land which was taken up for a period of
not less than one year and not more than five years. However in the
present study both the sub-categories are grouped together.
Sindhudurg district has a substantial proportion of fallow land with
average of 17.15% cent of the total geographical area. This is more than
double of the state of 7.2%. Regional disparities in the spatial
distributional pattern of fallow lands in the study region are exhibited in
map 4.6A.
During 1980-85 about 55980 hectare of land was under fallow land
category, it increased up to 85780 hectares in 1995-2000. Out of total
geographical area less than 10% area under this category was registered
in Kankavli, Malvan and Vengurla tahsils and 10% to 20% area in this
category was found in Kudal tahsil wile 20% to 30% area of this land use
category was recorded in Devgad and Sawantwadi tahsils during 1995-
2000. Above 30% geographical area in this category was seen in
Vaibhavwadi tahsil. The percentage of fallow lands in Sindhudurg district
141
as a whole is considerably high in comparison to national and state
averages. Because of the topographic and edaphoclimatic conditions in
most part of study region that varkas land is left fallow for four or five
years for accumulation of soil which is washed away by heavy rains.
Except Malvan tahsil remaining tahsils showed increase in fallow
land in the study region. Below 15% negative change in this land use
category took place in Malvan i.e.(13.58%). Zero to five percent positive
change in fallow land is seen in Devgad and Vengurla tahsils (table
4.6B), while 5% to 10% positive change in this group of fallow land is
experienced in Kankavali and Sawantwadi tahsils from 1980-85 to 1995-
2000. About 10% to 15% positive change is observed in Kudal tahsil and
above 15% positive change in this land use category is found in
Vaibhavwadi i.e. 32.04% which is the highest during the period of
investigation (map 4.6B) due to the low proportion of irrigation facilities
comparison to the other districts of the state. Sindhudurg district had
11.68% fallow land in 1980-85 which is increased by 5.47% and reached
up to 17.15% in 1995-2000.
4.4.5 Net Sown Area
Net sown area is the land which is being actively filled for raising
of crops. This land use category and the follow land together constitute
the extent of cropped land in the region and therefore are of vital
significance in studies relating to agricultural geography. The net area
sown is the actual area under crops counting areas sown more than once
in the same years only once. Net area sown represents the extent of the
cultivated area actually sown during the agricultural year. It may be
reoffered to as net cropped area also.
Sindhudurg district in Maharashtra state is one of the poorly
cultivated areas with only 132540 hectares or 26.52% of its total

142
geographical area devoted to crops during 1995-2000. 24.07% area under
this land use category to the total geographical area of the district was
there during 1980-85, while it was 26.52% in 1995-2000. About 2.45%
net sown land has been increased in the district during the period of
investigation. Which indicates that overall increase small widespread than
decrease. Below 2% positive change in net sown area was recorded in
Kankavli, Sawantwadi tahsils and 2% to 4% positive change in this
category was observed in Kudal tahsil. About 4% to 6% positive change
in net sown area was recorded in Davgad, Malvan and Vengurla tahsils
during the period under study (table 4.1 and map 4.7B) over 6% positive
change it means highest positive change in net sown area was
experienced in Vaibhavwadi tahsil from 1980-85 to 1995-2000. Some
fallow and other cultivable waste land was transferred to net sown area
during the period of investigation.
It is clearly seen that agriculture in study region is handicapped.
Since about 68% of the total geographical area of study region is not used
for cultivation owing to dearth of cultivable land. Rugged, terrain, poor
soils and scarcity of water supply coupled together with poor
technological development have all contributed to this situation. The
corresponding percentages for the state and the country as a whole are
56.6% and 45.3% respectively. The percentage of net sown area sown in
the Sindhudurg district varies from tahsil to tahsil which is quite evident.
Out of the total geographical area below 20% to 30% area under
net sown area in Devgad tahsil, whereas 20% to 30% area under this
landuse category was registered in Vaibhavwadi, Kankavli, Kudal and
Sawantwadi tahsils in the last two decades. Over 30% area was recorded
in this group in Malvan and Vengurla tahsils during 1995-2000. This is
higher than the district average of 26.52% map 4.7.

143
The extent of cultivated area in the study region has changed over
the past two decades. About 115180 hectares area in 1980-85, which was
rose to about 132540 hectares in 1995-2000. The volume of change in net
area sown is depicted in map 4.7b.
4.5 Volume of Change in Land use from 1980-85 to 1995-2000.
General land use from 1980-85 to 1995-2000 was transferred use
of land from one category to other categories due to the natural factors as
well as man made affords. Index of volume change of land use is
indicated by A/B where ‘A’ is the summation of differences of
percentage of land use categories of increased and ‘B’ is that of decreased
for the period of investigation. A and B should be same but with apposite
signs. Tahsil wise volume of change in land use is given in the following
table 4.2.
Table no.4.2
Tahsil wise volume of change in Land use 1980-85 to1995-2000
Sr. No. Tahsil Index of volume of
change in %
1 Devgad 26.63
2 Vaibhavwadi 39.38
3 Kankavali 7.6
4 Malvan 13.57
5 Vengurla 9.18.
6 Kudal 19.03
7 Sawantwadi 6.26
Source : Socio-Economic Abstract of Sindhudurg District 1981-82 to
2005-06. Computed by the researcher.
Table 4.2 indicates that one type of land category transfer to other
type of category naturally. Where this volume of change was greater we
can say that more dynamic conditions exist there. Map 4.8 reveals that

144
over 20% i.e. the highest 39.38% volume of change was observed in
Vaibhavwadi tahsil followed by Devgad (26.63%). Below 20% change in
general land use pattern was observed in Kankavali, Malvan, Kudal,
Vengurla and Sawantwadi tahsils during the period of investigation.
4.6 Tahsil wise per capita Net sown Area in Sindhudurg District
Table 4.3 indicates the clear picture about tahsilwise per capita net
sown area in Sindhudurg District. In the study region the position of per
capita net sown area was very poor comparatively to that of state as well
as the whole country. Table 4.3 reveals that per capita net sown area was
below 0.150 hectares in Devgad and Vengurla tahsils, where as it was
above o.150 hectares in Kankavali, Malvan, Kudal, and Sawantwadi
tahsils that was more than the average of the study region i.e. o.146
hectares in 1981. About 0.153 hectares area of the district belongs to per
capita net sown area in 1991. Maximum 0.208 hectares per capita lands
was registered in Kankavali tahsil and below 0.200 hectares per capita
land was found in Devgad, Malvan, Vengurla, Kudal and Sawantwadi
tahsils during 1995-2000. Above 0.200 hectares per capita land was
recorded in Vaibhavwadi and Kankavali tahsils. Table 4.3 indicates that
per capita land was over all the district level in slightly increased in
Devgad, Vaibhavwadi Kankavali, Malvan, Vengurla tahsils. In remaining
two tahsils Kudal and Sawantwadi per capita land has decreased during
the period of investigation. Though their is increase in population for last
two decades the land under net sown area was also increased specially
land under horticulture. It means the Sindhudurg District having very low
per capita lands as compared to other districts of the state.

145
Table No.4.3
Tahsil wise Per Capital Net Sown Area in Sindhudurg District (Area in Hectares)
Sr. No. Tahsil 1981 1991 2001
1 Davgad 0.096 0.108 0.112
2 Vaibhavwadi - 0.0154 0.280
3 Kankavali 0.200 0.208 0.213
4 Malvan 0.153 0.147 0.172
5 Vangurla 0.125 0.112 0.154
6 Kudal 0.171 0.165 0.159
7 Sawantwadi 0.171 0.159 0.131
District 0.146 0.153 0.162
Source Socio-Economic Abstract of Sindhudurg District 1981-82 to 2005-06.
Computed by the researcher.
4.7 Land use Efficiency
Land use efficiency has been defined as the extent to which the net
area sown has been cropped. The total cropped area as percentage of net
area sown gives a measure of land use efficiency which in other words is
the intensity of cropping and refers to the number of crops grown on the
same area in only one agricultural year (Singh, 1972). The main purpose
of the land use efficiency is to study to examine the regional variations in
agricultural efficiency and temporal variations from 1980-85 to 1995-
2000. The emphasis is on high-light the basis of agriculture which
influences agricultural efficiency. Agricultural efficiency is the level of
existing performance of a unit of land which differentiates from one area
of combined effect of various factors like physical socio-economic and
organizational.
The index of land use efficiency is obtained by using the following

146
formula.
Gross cropped area
Index of Land use efficiency = ----------------------- x 100
Net sown Area
Tahsil wise land use efficiency calculated for the period of 1980-
85 and 1995-200 in the Sindhudurg District is given in the following table
Table 4.4
Land use Efficiency in Sindhudurg District
Sr.
No.
Tahsil Index of
1980-85
Land use
1995-2000
Efficiency %
Vol. of change
1 Devgad 105.4 106.5 1.1
2 Vaibhavwadi 100.0 112.9 12.9
3 Kankavali 111.2 113.86 2.66
4 Malvan 116.17 106.12 -10.05
5 Vengurla 105.34 114.93 9.59
6 Kudal 102.73 105.21 2.48
7 Sawantwadi 102.82 108.00 5.18
District 105.24 109.43 4.19
Source: Socio-Economic Abstract of Sindhudurg District 1981-82 to 2005-06.
Computed by the researcher.
Table 4.5 reveals that land use efficiency in the study region
increased from 105.24% cent to 109.43% from 1980-85 to 1995-2000.
The study region is divided into three parts on the strength of percentage
viz. high land use efficiency, medium land use efficiency and low land
use efficiency.
A) Areas of low Land use Efficiency (Below 105%)
Area of low land efficiency was recorded in Kudal, Sawantwadi
and Vaibhavwadi tahsils during 1980-85. Rugged topography
147
uncultivable waste land, lack of irrigation facilities, poor soil conditions,
low use of chemical fertilizers, pesticides and other natural as well as
socio-economical factors are responsible for low efficiency. During 1995-
2000 low to high change was recorded in Kudal, Sawantwadi, and
Vaibhavawadi tahsils i.e. 2.48%, 5.18% and 12.9% respectively (map
4.9B)
B) Areas of Medium Land use Efficiency – (105% to 110%)
Areas of medium land use efficiency were recorded in Devgad and
Vengurla tahsils during 1980-85. Medium land use efficiency to high
land use efficiency change occurred in Devgad and Vangurla tahsils, due
to physical as well as non-physical determinants of land use efficiency
during the period of investigation. About 1.1% to 9.59% positive change
in land use efficiency was registered in Devgad and Vengurla tahsils.
(map.4.9B) Vengurla tahsils agricultural research centers give guidelines
to the farmers and efforts of some primary agricultural societies are
responsible factors to increase landuse efficiency.
C) Areas of high landuse efficiency (Above 110%)
High land use efficiency was observed in Kankavali and Malvan
tahsils during the period of investigation (map 4.9A). Only Malvan tahsil
registered negative change it means the land use efficiency decreased but
in Kankavali tahsil positive change in land use efficiency is seen during
1980-85 to 1995-2000 (map 4.9B)
Summary
Forest area increased from 33020 hectares to 38229 hectares or
1.07% during the period of investigation. The area under forest has
increase which shows that the effect of Social Forestry Programme on
large scale in these tahsils. The average of area under this category is
considerably low compared to the state.

148
Area not available for cultivation was 27.67% of the total
geographical area of Sindhudurg district and this is more than three times
of the average area of this category of the state i.e. 9.5%. The lowest area
under area not available for cultivation to the total geographical area of
study region was observed in Kankavali tahsil (16.44%) whereas the
highest area under this group was noticed in Malvan tahsil (43%) during
1995-2000.
Total area under other uncultivable land was 149920 hectares or
31.30% which is much higher than the state average of 8% during the
first quinquennial and it was decreased up 105100 hectares in the last
quinquennial. Regional distribution under this land use category varies
from 8.30% to over 34%. During 1980-85 about 55980 hectares land was
under fallow land it was increased upto 85780 hectares from 1980-85 to
1995-2000. The positive change in area under follow land from 4.77% to
32.04% was observed in all tahsils of study region except Malvan tahsil
during the investigation period.
About 2.45% net sown land has been increased in the district
during the period of 1980-85 to1995-2000. About 0.37% to 7.32%
positive change in net sown area was noticed in all the tahsils of the study
region. The study region is agriculturally handicapped due to rugged
topography, rough terrain, poor soils, scarcity of water supply which
contributed to low net sown area. The highest per capita net sown area
was registered in Kankavali tahsil (0.208) hectare while below 0.200
hectare per capita land was found in Devgad, Malvan, Vengurla, Kudal
and Sawantwadi tahsils in 2001. Table 4.3 indicate that per capita land
was overall the district has slightly increased in Devgad, Vaibhavwadi,
Kankavali, Malvan and Vengurla tahsils.
The study regions land-use efficiency was increased from 105.24%
149
to 109.43% from 1980-85 to 1995-2000. All the tahsils showed positive
change in land use efficiency except Malvan tahsil. Below 5% positive
change in land use efficiency was noticed in Devgad, Kankavali and
Kudal tahsils while above 5% positive change was found the in remaining
tahsils during 1980-85 to 1995-2000.

150
References
1. Adnaik N. S. (2005): ‘Spatio-Temporal Changes in Agricultural
Productivity in the Drought Prone Region in Maharashtra State: A
Geographical perspective’, Unpublished Ph.D. Thesis submitted to
Shivaji University, Kolhapur, P.91-102.
2. Ali Mohammed (1978), ‘Studies in Agricultural Geography’,
Rajesh Publications, New Delhi, 1978, pp-1-6.
3. Ali Mohammad (1978), ‘Studies in Agricultural Geography’,
Rasesh Publication New Delhi-1978. pp-1-6
4. Arsud, S. S. (2000): “Characterizing Agro Climatic Environment
of Bhima Basin”; Unpublished Ph.D. Thesis, University of Pune.
5. Baker, 1923
6. Barlowe, R, (1963), ‘Land Resources Economics’ Prentice Hall,
Englewood Cliffs p.1.
7. Chatterjee (1952), ‘Land utilization survey of Howrah Districts’,
Geographical Review of India. Vol. 14, No, 13.
8. Chowdaian C. (2001), ‘Productive land and its Misuse: A
comparative analysis of Big, Small and Marginal farmers in
Mysore District’. The Deccan. Geographer, vol. 39. No.1-p-76
9. Freeman T.W. (1968), “Geography and planning”, Hutchinson.
University Library, London p.74.
10. Jackson I.N. (1963), ‘Survey for Town and country planning’
Hutchinson University Library, London.p-109.
11. Kumar J. (1986),‘Landuse Analysis : A case study of Nalanda
District’, Bihar Inter-India Publications New Delhi-p.1
12. Lillesand, T, M. and Kiefer R.W. (1987). ‘Remote sensing and
Image Interpretation’ John Wiley and Sons, p-74.
13. Mali, N. G. (2004): “A critical study of Agricultural Productivity in

151
Parbhani District (M. S.). A Geographical Analysis; Unpublish
Ph.D. Thesis. Submitted to Swami Ramanand Teerth Marathwada
University, Nanded. P. 94-117.
14. Mishra B. N. (ed) (1990), ‘Land utilization and management in
India’, Chugh.
15. Nageshwara Rao K. and Vaidyanathan R. (1981), ‘Landuse
capability studies from Arial Photo-Interpretation -A case study
from Krishna Delha’, India Geographical Review of India. Vol.43,
No.3 pp-226-236.
16. Nanavati M.B. and Anjaria J. J. (1951), ‘The Indian Rural Problem
Vora and Co.Bombay’
17. Patil, A. A. (2002): ‘Changes in Agricultural productivity in Upper
Bhima and Upper Krishna Basin in Maharashtra- A Geographical
Analysis’ Unpublished Ph.D. Thesis submitted to Shivaji
University, Kolhapur p.94-102.
18. Rao P., V. L. S. (1959), ‘The role of geographers in Landuse
Planning’, Bombay Geographical Magazine vol. VI-VII, No.2, pp.
39-44
19. Roy B. K. (1968). Op cit.
20. Shaffi M. (1961), ‘Land utilization in western U. P.’ published by
Aligarh Muslim University.
21. Singh J., (1974), ‘An Agricultural Atlas of Indian-A Geographical
Analysis’, Vishal Publications, Kurukshetra.
22. Stamp L.D. (1967). ‘Applied Geography Penguin Books’, Suffolk,
pp-105-107.
23. Symons, Leslie (1978). ‘Agricultural Geography’, G. Bell, London
p.67
24. Tripathi R.S, and Vishwakarma J.P.-(1988), ‘Landuse cropping

152
pattern and development levels in Banda district (U.P.)’. The
Deccan Geographer vol.XXVI No.2-3 pp 417-27.
25. Shafi M. (1951), ‘A plean for Land utilization’ Survey Geographer,
1951, p412
26. Shaffi M. (1961). ‘Technique of Rural Landuse planning with
reference to India’, Geographic (13)
27. Singh J. (1972), ‘An Agricultural Atlas at India :A Geographical
Analysis’ Vishal Publication Kurukashetra.
28. Vink, A. P. A. (1975): ‘Land use in Advancing Agricultural
Springer Verlag Berlin’, Heidelberg, New York.

153