
05 / 08 / 2009©sultats financiers...Investment Banking Asset Management and Securities Services...
22
05 / 08 / 2009 SECOND QUARTER AND FIRST HALF 2009 RESULTS
Transcript of 05 / 08 / 2009©sultats financiers...Investment Banking Asset Management and Securities Services...

05 / 08 / 2009
SECOND QUARTER AND FIRST HALF 2009 RESULTS

2SECOND QUARTER AND FIRST HALF 2009 RESULTS 05 / 08 / 2009
DisclaimerThe following presentation contains a number of forward-looking statements relating to Societe Generale’s targets and strategy. These forecasts are based on a series of assumptions, both general and specific. As a result, there is a risk that these projections will not be met. Readers are therefore advised not to rely on these figures more than is justified as the Group’s future results are liable to be affected by a number of factors and may therefore differ from current estimates. Readers should take into account elements of uncertainty and risk when basing their investment decisions on information provided in this presentation. Neither Societe Generale nor its representatives shall have any liability whatsoever for any loss arising from any use of this presentation or its contents or otherwise arising in connection with this presentation or any other information or material discussed.
The consolidated half-yearly income statements at June 30th 2009 and the comparative information thus prepared have undergone a limited review by the Statutory Auditors. These income statements were approved by the Board of Directors on August 4th 2009.
The figures provided for the six months ending June 30th 2009 have been prepared in accordance with IFRS (International Financial Reporting Standards) adopted by the European Union at June 30th 2009. In particular, the Group’s summarised consolidated half-yearly income statements have been drawn up and are presented in accordance with IAS 34 “Interim Financial Reporting”.
Unless otherwise specified, the sources for the business rankings are internal.

3SECOND QUARTER AND FIRST HALF 2009 RESULTS 05 / 08 / 2009
Quarterly highlightsOperational performance satisfactory overall
Sound commercial activity for French and International Retail BankingCommercial growth and continued high level of trading revenues for Corporate and Investment Banking, while risks remain under controlSituation mixed for Asset Management and Securities Services
Net Banking Income excluding non-recurring items: EUR 7.4bn, i.e. +13.5% vs. Q2 08
Negative accounting impact of tightening of credit spreads: EUR 1.3bn
Disposal of EUR 3.0bn of assets at risk over the quarter
Cost of risk maintained at a high level (112 bp)
Group Share of Net Income: EUR 309m in Q2 09
Solid financial structure: Tier 1 ratio of 9.5% (Core Tier 1 of 7.3%)
SOCIETE GENERALE GROUP

4SECOND QUARTER AND FIRST HALF 2009 RESULTS 05 / 08 / 2009
7.4
5.7
-0.4-0.5
-0.8
Strong operational performance: NBI up +13.5%(1)
SOCIETE GENERALE GROUP
CDS Marked-to-Market
Accounting impact
Revaluation of financial liabilities& own shares Impairments
and write-downs
Group NBI excluding nonGroup NBI excluding non--recurring items vs. accounting NBI in Q2 09recurring items vs. accounting NBI in Q2 09(in EUR (in EUR bnbn) )
NBI excluding non-recurring items
AccountingNBI
Chg Q2/Q2
Chg Q2/Q2
+2.4%
+13.5%( 1)
(1) Excluding non-recurring items in the supplementary data, page 28
-1.7

5SECOND QUARTER AND FIRST HALF 2009 RESULTS 05 / 08 / 2009
Group result: EUR 309 million in Q2 09
SOCIETE GENERALE GROUP
* When adjusted for changes in Group structure and at constant exchange rates
Second quarter First half
In EUR m Q2 09 Q2 08 H1 09 H1 08
Net banking income 5,716 5,584 +2.4% +3.3%* 10,629 11,263 -5.6% -4.5%*
Operating expenses (4,107) (3,957) +3.8% +4.8%* (7,884) (7,862) +0.3% +1.2%*
Gross operating income 1,609 1,627 -1.1% -0.2%* 2,745 3,401 -19.3% -17.6%*
Net allocation to provisions (1,075) (387) x2.8 x2.9* (2,429) (985) x2.5 x2.5*
Operating income 534 1,240 -56.9% -56.3%* 316 2,416 -86.9% -85.6%*
Group share of net income 309 644 -52.0% -53.9%* 31 1,740 -98.2% -96.8%*
ROE (after tax) 3.0% 8.3% NM 12.3%
Change Q2/Q2 Change H1/H1
6SECOND QUARTER AND FIRST HALF 2009 RESULTS 05 / 08 / 2009
149 191
127 207
116 193
258509
35627072
58
293234134
31029978
23098
213
1,0751,354983687387
Q2 08 Q3 08 Q4 08 Q1 09 Q2 09
28 bp
49 bp
120 bp
34 bp
139 bp
197 bp
173 bp
68 bp
43 bp 120 bp
65 bp
242 bp
185 bp
93 bp
112 bp
33 bp56 bp
71 bp122 bp
127 bp 160 bp
96 bp116 bp
67 bp 97 bp
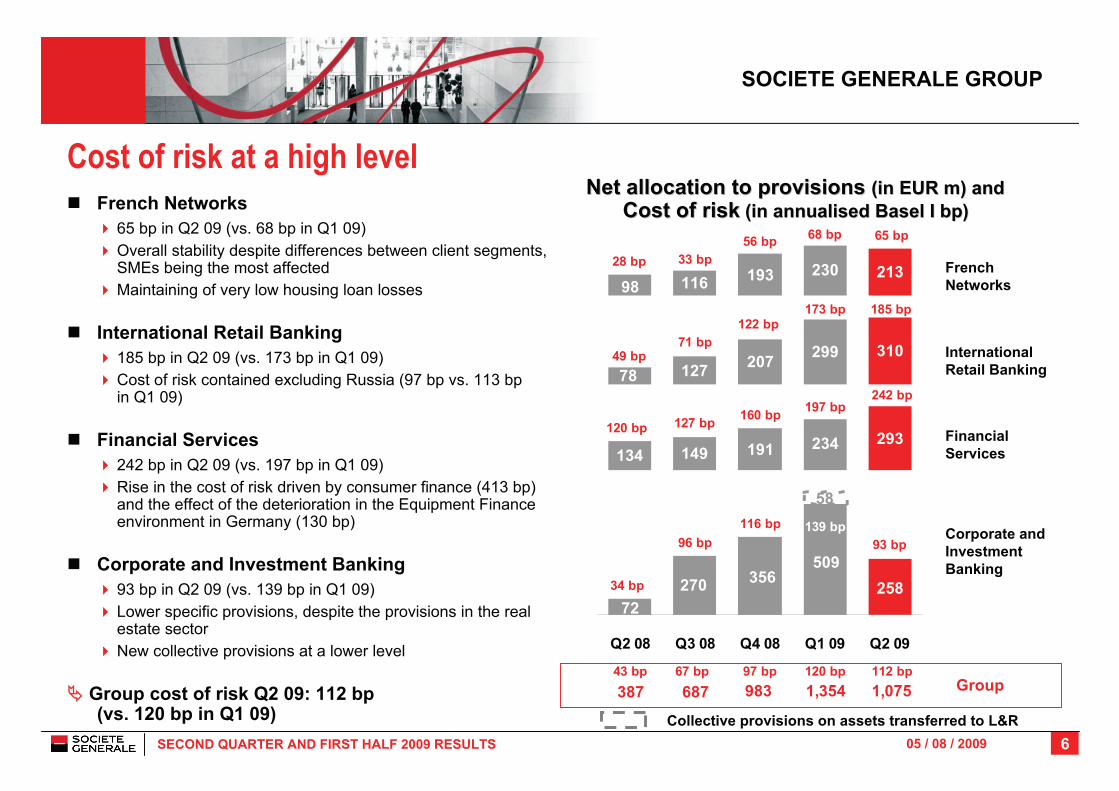
Net allocation to provisions Net allocation to provisions (in EUR m) and (in EUR m) and Cost of riskCost of risk (in annualised Basel I (in annualised Basel I bpbp))
Financial Services
French Networks
Corporate and Investment Banking
International Retail Banking
SOCIETE GENERALE GROUP
Group
Collective provisions on assets transferred to L&R
Cost of risk at a high levelFrench Networks
65 bp in Q2 09 (vs. 68 bp in Q1 09)Overall stability despite differences between client segments, SMEs being the most affectedMaintaining of very low housing loan losses
International Retail Banking185 bp in Q2 09 (vs. 173 bp in Q1 09)Cost of risk contained excluding Russia (97 bp vs. 113 bpin Q1 09)
Financial Services242 bp in Q2 09 (vs. 197 bp in Q1 09)Rise in the cost of risk driven by consumer finance (413 bp) and the effect of the deterioration in the Equipment Finance environment in Germany (130 bp)
Corporate and Investment Banking93 bp in Q2 09 (vs. 139 bp in Q1 09)Lower specific provisions, despite the provisions in the real estate sectorNew collective provisions at a lower level
Group cost of risk Q2 09: 112 bp(vs. 120 bp in Q1 09)

7SECOND QUARTER AND FIRST HALF 2009 RESULTS 05 / 08 / 2009
Reinforced financial strength: Tier 1 ratio (Basel II) of 9.5%
Tier 1 ratio of 9.5% andCore Tier 1 ratio of 7.3% at end-June 2009
Fall in risk-weighted assets:-2.2% vs. end-March 2009 to EUR 335.7bn
Annual growth in loan outstandingsin France: +3.7 vs. end-June 2008
Fall in Corporate and Investment Banking's risk-weighted assets (-5.0%* vs. end-March 2009)
Tier 2
Tier 1
Solvency ratio (2)
SOCIETE GENERALE GROUP
Change in the Basel II Tier 1 RatioChange in the Basel II Tier 1 Ratio
* When adjusted for changes in Group structure and at constant exchange rates** Proforma of 2nd State tranche, with issue of preference shares(1) Core Tier 1: Tier 1 - Hybrid capital (2) Solvency ratio: Tier 1 + Tier 2 - prudential deductions
CoreTier 1(1)
Hybrid capital
Tier 1 ratio
6.5%
2.2% 2.2%
3.0%
7.0% 7.3%
2.2%
3.0% 2.8%
12.3%11.7% 12.2%
9.5%8.7% 9.2%
March 31st 2009 ProformaMarch 31st 2009 **
June 30th 2009

8SECOND QUARTER AND FIRST HALF 2009 RESULTS 05 / 08 / 2009
+0.1%+0.3%
Revenues of businessesIn EUR mIn EUR m
SOCIETE GENERALE GROUP
Corporate andInvestment Banking
Asset Management andSecurities Services
Retail Bankingand Financial Services
Revenues of businesses (excl. non-recurring items)
(1) Excluding non-recurring items in the supplementary data, page 28The French Network changes do not include PEL/CEL
Financial Services
International Retail Banking
French Networks
CIB NBI excluding non-recurring items
H1/H1
+57.5%( 1)
-16.4%( 1)
-2.3%
-2.6%
+1.2%( 1)
+65.8%( 1)
-19.6%( 1)
-3.3%
+0.3%
+0.1%( 1)
+14.6%( 1) +15.2%( 1)
Chg in absolute termsQ2/Q2
1,556 655 643 841
600 873 747 598 652
771 820 801 709 737
1,123 1,215 1,303 1,349 1,161
1,741 1,758 1,774 1,906 1,732
1,136 1,288
747
801
1,183
1,822
2,984 2,688 311 1,761 1,895 1,525
3,8063,6303,9643,8783,7933,635
7,5206,034 6,561 6,323 4,909 6,992
Q1 08 Q2 08 Q3 08 Q4 08 Q1 09 Q2 09

9SECOND QUARTER AND FIRST HALF 2009 RESULTS 05 / 08 / 2009
Solid activity and results in a difficult economic environmentActivity
Business customers • On-balance sheet deposits: +19.9%* vs. Q2 08• Loans: +3.7% vs. Q2 08 o.w. +9.4% for investment loans
Individual customers: • On-balance sheet deposits: +1.5% vs. Q2 08, dynamic
growth in regulated savings accounts• Loans: +3.7% vs. Q2 08
Revenues NBI: +1.2%(a) vs. Q2 08 • Interest margin: +3.8%(a) vs. Q2 08• Commissions: -1.9% vs. Q2 08
Operating expenses under control: +1.5% vs. Q2 08C/I ratio stable: 66.0%(a) vs. 65.8%(a) in Q2 08
Annual NBI growth target: +1%(a) and positive jaw effect over the year
FRENCH NETWORKS
* Excluding medium-term notes issued to French Network customers of EUR 8.5bn in Q2 09 vs. EUR 10.3bn in Q2 08(a) Excluding a EUR 42m PEL/CEL provision reversal in Q2 09 vs. a EUR 1m provision in Q2 08
N.B. The deposit outstandings for Q1 09 have been adjusted following a technical error
Average loan Average loan outstandingsoutstandings (in EUR (in EUR bnbn))
75.2 76.7 77.2 77.6
72.6 74.3 76.6 76.0 74.9
78.0
152.9153.6153.7151.1147.8
Q2 08 Q3 08 Q4 08 Q1 09 Q2 09
41.8 42.6
40.5 40.0 39.8 44.4
15.5 14.8 10.696.4 97.7 97.6
42.1 42.0 42.2
43.09.5 12.592.0 97.5
Q2 08 Q3 08 Q4 08 Q1 09 Q2 09
Bus. customers & Fin. Inst.
Individuals
Term depositsRegulated savings accountsSight deposits
Average deposit Average deposit outstandingsoutstandings* * (in EUR (in EUR bnbn))

10SECOND QUARTER AND FIRST HALF 2009 RESULTS 05 / 08 / 2009
Client activity well adapted to the economic environment
Strengthening of deposit inflowConfirmed success of Livret A: • 1.4 million accounts, i.e. more than one Livret (passbook)
for every 4 sight accounts • Growth in outstandings of +42% vs. Q1 09Commercial policy favouring long-term savings: renewed rise in PEL outstandingsNew products added to the business customer term account product range:• Graduated-interest rate and EONIA+ term accounts
Growing market sharesRegular gain in corporate market share: +30 bp vs. May 2008 and increased use of loans guaranteed by OseoMarked rebound in household deposit market share:+20 bp vs. February 2009Strong increase in outstanding loans to local authorities: +16.7% vs. Q2 08
FRENCH NETWORKS
9.0%
9.5%
10.0%
10.5%
11.0%
11.5%
12.0%
Jan-03Jul-03
Jan-04Jul-04
Jan-05Jul-05
Jan-06Jul-06
Jan-07Jul-07
Jan-08Jul-08
Jan-09
Market share in % Market share in % -- Total corporate loans Total corporate loans (Source: Commission (Source: Commission BancaireBancaire -- May 2009)May 2009)
Market share in % Market share in % -- Individual customer passbooksIndividual customer passbooks(Source: Commission (Source: Commission BancaireBancaire, BDF , BDF -- May 2009)May 2009)
5.0%5.2%5.4%5.6%5.8%6.0%6.2%6.4%
Jan-03Jul-03
Jan-04Jul-04
Jan-05Jul-05
Jan-06Jul-06
Jan-07Jul-07
Jan-08Jul-08
Jan-09

11SECOND QUARTER AND FIRST HALF 2009 RESULTS 05 / 08 / 2009
Strong resilience in a deteriorated environment Realignment of the commercial policy …
+83,000 individual customers at constant structure vs. end-2008, i.e. +0.7% Good resilience of deposits • Deposits: +1.1%* vs. end-2008Slowdown of loan origination • Loans: -2.3%* vs. end-2008Improved loan to deposit ratio: 98% at end-June 2009 vs. 102% at end-2008
… and of operations Slowdown in expansion of network: 31 new branches in Q2 09 vs. 160 in Q2 08 (57 in Q1 09) Reduced headcount: -1.1% over the quarter
NBI: EUR 1,183mGroup Share of Net Income: EUR 122m
INTERNATIONAL RETAIL BANKING
* When adjusted for changes in Group structure and at constant exchange rates** When adjusted for changes in Group structure
Loans
Deposits
Loan and deposit Loan and deposit outstandings outstandings (in EUR (in EUR bnbn -- in absolute terms)in absolute terms)
60.761.462.863.558.6 61.961.061.363.562.9
Jun-08 Sept-08 Dec-08 Mar-09 Jun-09
Results of International Retail Banking in Q2 09Results of International Retail Banking in Q2 09
In EUR m Excl.Russia
ChangeQ2/Q2 Russia TOTAL Change
Q2/Q2Net banking income 950 +5.6%* 233 1,183 +4.1%*Operating expenses (512) +5.3%* (168) (680) +5.0%*Gross operating income 438 +5.9%* 65 503 +2.9%*Net allocation to provisions (131) x3.2 (179) (310) x4.5*
in bp 97 bp 559 bp 185 bpOperating income 307 -17.3%* (114) 193 -53.9%*Group share of net income 177 -18.8%* (55) 122 -49.8%*
ROE (after tax) 29.1% 0.0% NM 15.7%

12SECOND QUARTER AND FIRST HALF 2009 RESULTS 05 / 08 / 2009
2.7 5.3 7.1 8.13.9 5.6 7.2 6.8 6.97.7
Dec-05 Dec-06 Dec-07 Dec-08 Jun-09
6.9 9.3 11.7 13.713.317.5 20.3 20.7 20.7
14.3
Dec-05 Dec-06 Dec-07 Dec-08 Jun-09
6.6 7.8 10.2 9.85.8
Dec-05 Dec-06 Dec-07 Dec-08 Jun-09
7.7 8.6 9.9 11.0 11.4
Dec-05 Dec-06 Dec-07 Dec-08 Jun-09Dec-05 Dec-06 Dec-07 Dec-08 Jun-09
INTERNATIONAL RETAIL BANKING
Satisfactory performance in various geographic regions Mediterranean region: positive trends
Sustained activity driven by Morocco and Egypt • Diversified, rich portfolios • Regular growth in outstandings NBI: EUR 190m;Group Share of Net Income: EUR 51m
Czech Republic: sound market positions Gains in market share(1)
• Real estate loans: +6.2 pts in Q2 09 vs. Q2 08 to 30.5%• Life insurance: +3.0 pts vs. H1 08 to 6.5%Leveraging of cost and synergy pooling• Operating expenses: -1.7%* vs. Q2 08 and -9.6%* vs. Q4 08NBI: EUR 275m; Group Share of Net Income: EUR 49m
Romania: confirmed resilience Consolidation of franchises • Growth in deposit outstandings: +6.3%* vs. end-2008 • Improved penetration rate: 3.30 products per individual
customer vs. 2.98 at end-June 2008Enhancing of positions in a less competitive market NBI: EUR 179m; Group Share of Net Income: EUR 28m
Czech Republic Czech Republic
Mediterranean Region
RomaniaRomania
Loans Deposits
Loan and deposit Loan and deposit outstandingsoutstandings(in EUR (in EUR bnbn -- in absolute terms)in absolute terms)
EgyptMorocco
Others
Loans Deposits
* When adjusted for changes in Group structure and at constant exchange rates(1) Market shares according to the production for the period

13SECOND QUARTER AND FIRST HALF 2009 RESULTS 05 / 08 / 2009
0.4 0.5 0.9
8.69.4
Dec-05 Dec-06 Dec-07 Dec-08 Jun-09
0.6 1.32.9
13.511.1
Dec-05 Dec-06 Dec-07 Dec-08 Jun-09Dec-05 Dec-06 Dec-07 Dec-08 Jun-09
INTERNATIONAL RETAIL BANKING
Russia: realignment of operations with the crisis environment 2009: a crisis environment …
GDP expected to shrink by around 8 to 9% Rouble liquidity crisis and weak loan demand But increase in oil price per barrel, stabilisation of other commodity prices, appreciation of the rouble and increase in foreign exchange reserves
… affecting the operation's results Significant rise in cost of risk:• Cost of risk: 559 bp in Q2 09 vs. 223 bp in Q4 08
NBI: EUR 233m; Group Share of Net Income: EUR -55m
Measures implemented Freezing of network expansion Acceleration of productivity gains• Target of -10% of headcount across all the Russian entitiesVery selective loan approval policy andstrengthening of collection procedures
Medium-term growth potential intact
Loans excl. Rosbank Deposits excl. Rosbank
Rosbank loans Rosbank deposits
Loan and deposit Loan and deposit outstandingsoutstandings in Russiain Russia(in EUR (in EUR bnbn -- in absolute terms)in absolute terms)

14SECOND QUARTER AND FIRST HALF 2009 RESULTS 05 / 08 / 2009
1.3 1.5 1.3 1.5 1.3 1.3
0.4 0.4 0.3 0.3 0.30.2 0.2
0.2 0.30.1
0.3 0.3 0.3 0.30.30.1
0.4 0.4 1.92.02.5
2.22.52.2
Q1 08 Q2 08 Q3 08 Q4 08 Q1 09 Q2 09
* When adjusted for changes in Group structure and at constant exchange rates ** When adjusted for changes in Group structure (1) excluding French Networks (2) excluding factoring
Realignment of businesses affected by the economic cycle Lower activity but improved margins
Fall in loan demand and adjustment of approval criteria• Consumer finance: -11.4%* vs. Q2 08 and +7.7% vs. Q1 09 • Equipment finance: -19.1%* vs. Q2 08 and -3.6% vs. Q1 09 • Fleet management and vehicle leasing: + 51,000 vehicles,
-27.6% vs. Q2 08 and -14.6% vs. Q1 09 Rise in production margins
Stable NBI: EUR 686m (+0.1%* vs. Q2 08)
Realignment measures implemented Reduction of operating expenses: -3.5%* vs. Q2 08 • Consumer finance: -4.1%* vs. Q2 08• Fleet management: -9.5%* vs. Q2 08Reduction of headcount: -5.6%** vs. Q2 08
Growth in GOI: EUR 293m (+5.4%* vs. Q2 08)
Life insurance: gross inflows of EUR 2.3bn (-4.5%* vs. Q2 08)
Group Share of Net Income: EUR 17m
FINANCIAL SERVICES
Consumer financeConsumer finance(1)(1): quarterly production : quarterly production ((in EUR in EUR bnbn))
1.9 2.1 1.8 2.0 1.8 1.9
0.4 0.6 0.7 0.6 0.30.2
0.4 0.5 0.40.30.4 0.5
0.20.3
0.50.60.50.4
3.02.7
3.53.63.53.0
Q1 08 Q2 08 Q3 08 Q4 08 Q1 09 Q2 09
France, Italy,Germany
RussiaPoland
Other emerg.countries
France, Italy, Germany
Scandinaviacountries Other emerg.
Equipment financeEquipment finance(2)(2): quarterly production : quarterly production ((in EUR in EUR bnbn))

15SECOND QUARTER AND FIRST HALF 2009 RESULTS 05 / 08 / 2009
153.7
19.9
73.1
1 2 3 4 5 6 7 8 9
SGAM(1) SGAM AI
TCW
Netinflow
Other Marketeffect
Forexeffect
Jun-09Mar-09
264.2-0.3 -3.0 +2.5 -2.3
17.5
157.
262.1+10.8 -5.1-4.7
Disposaleffect
11.3
73.1
17.5
160.2
71.067.9
+1.3+2.2 -0.4
Mar 09
Netinflow
Marketeffect
Forexeffect
June 09
GLOBAL INVESTMENT MANAGEMENT AND SERVICES
TCWSGAM AISGAM (1) Others
Asset management: Asset management: AuMAuM (in EUR (in EUR bnbn) )
Private banking: Private banking: AuMAuM (in EUR (in EUR bnbn) )
Strong performance of Private Banking, finalisation of SGAM-CAAM agreement
Private bankingNet inflows in Q2 09: EUR +1.3bn(i.e. 8% annualised inflow rate)AuM: EUR 71.0bn (-1.7% vs. end-June 2008 and+4.6% vs. end-March 2009 )High margin rate maintained: 128 bp in Q2 09 including treasury revenues
NBI: EUR 222m (+9.4%* vs. Q2 08)
Asset management Net outflows in Q2 09: EUR -3.1bn• Fall in alternative management• Traditional management stable with investors switching from
money market funds to bond funds AuM at end-June 2009: EUR 262.1bn, -15.2% vs. end-June 2008, -0.8% vs. end-March 2009
NBI: EUR 202m (-25.5%* vs. Q2 08)
(1) Perimeter of operations contributed through the merger with CAAMN.B. The figures at end-March 2009 have been restated following the change in the perimeter contributed (China, Korea)

16SECOND QUARTER AND FIRST HALF 2009 RESULTS 05 / 08 / 2009
2,9062,733
2,580
1,516
Q2 06 Q2 07 Q2 08 Q2 09
Securities Services: financial performance affected by fall in interest rates Securities services to institutional clients and fund administration: resilient commercial performancebut revenues affected by the fall in interest rates
Assets under custody: EUR 2,906bn (+6.3% vs. end-June 2008 and +5.2% vs. end-March 2009)Assets under administration: EUR 423bn (-14.5%vs. end-June 2008 and +4.7% vs. end-March 2009)
Newedge: fall in volumes 761 million lots (-8.5% vs. Q2 08)Market share maintained at high levels: 11.8%(1) at end-June 2009
Boursorama: very satisfactory activity Number of orders executed: +29% vs. Q2 08~7,000 bank accounts opened in Q2 09, i.e. ~89,000 accounts at end-June 2009
NBI: -19.3%* vs. Q2 08GOI: -82.1%* vs. Q2 08
GLOBAL INVESTMENT MANAGEMENT AND SERVICES
Assets under custodyAssets under custody (in EUR (in EUR bnbn))
* When adjusted for changes in Group structure and at constant exchange rates(1) On the main markets of which Newedge is a member
Newedge Newedge (in USD (in USD bnbn))
Rank Futures Commission Merchant Deposits at end-May 09
1 GOLDMAN SACHS & CO 26.92 NEWEDGE USA LLC 26.53 JP MORGAN FUTURES INC 18.94 UBS SECURITIES LLC 18.75 CITIGROUP GLOBAL MARKETS INC 14.06 MERRILL LYNCH PIERCE FENNER & SMITH 10.57 DEUTSCHE BANK SECURITIES INC 10.38 MORGAN STANLEY & CO INCORPORATED 8.49 MF GLOBAL INC 7.8
10 BARCLAYS CAPITAL INC 6.6Source: CFTC.gov website: http://cftc.gov/marketreports/financialdataforfcms/index.htm

17SECOND QUARTER AND FIRST HALF 2009 RESULTS 05 / 08 / 2009
1,895 1,761311
2,688 2,984
-1,696-1,847
825
-1,118-1,240
1,2888411,136643655
Q2 08 Q3 08 Q4 08 Q1 09 Q2 09
-840
-459-397
1,288
2,984
NBI excl.Non-recurr.
Items
CDS Marked-to-Market
Reval.of fin.
liabilities& own shares
Impairmentsand
write-downs
AccountingNBI
Non-recurring items: EUR -1,696m
CORPORATE AND INVESTMENT BANKING
Impact of nonImpact of non--recurring items on the total NBI recurring items on the total NBI (in EUR m) (in EUR m)
NBI excluding nonNBI excluding non--recurring items vs. accounting NBI recurring items vs. accounting NBI (in EUR m)(in EUR m)
NBI excluding non-recurring items
Non-recurring items
(1) Excluding non-recurring items in the supplementary data, page 28 * When adjusted for changes in Group structure and at constant exchange rates
Accounting NBI
A record operational performanceNBI excluding non-recurring items(1):EUR 2,984m (+57% vs. Q2 08)
Accounting NBI: EUR 1,288m (+85%* vs. Q2 08)Non-recurring items(1): EUR -1,696m
o.w. EUR -1,299m of CDS MtM and revaluation of financial liabilities & own sharesBalanced growth in business revenues
Very strong commercial performance(+20% vs. Q1 09 and Q2 08)
High trading revenues (stable vs. Q1 09, x2.4 vs. Q2 08) and controlled market risks
Operating expenses: +19%* vs. Q2 08
Active management of exposures at riskDisposal of EUR 3.0bn of assets at risk in Q2 09

18SECOND QUARTER AND FIRST HALF 2009 RESULTS 05 / 08 / 2009
502 514 560281 156
-497
354441
-10 267
783 670 -507 621 1,001
Q2 08 Q3 08 Q4 08 Q1 09 Q2 09
Equities: a very strong performanceNBI: EUR 1,001m (+28% vs. Q2 08)
Commercial results up 12% vs. Q2 08 andx2.1 vs. Q1 09
Slowdown of structured commercial production, but rebound in flows vs. Q1 09, particularly for listed productsLyxor: AuM at EUR 62.1bn, EUR +3.6bn vs. Q1 09Positive impact of hedges on client positions
Very good trading revenues against a backdrop of normalisation of market parameters:
+57% vs. Q2 08 and +25% vs. Q1 09Fall in risks over the quarter
A recognised franchiseA confirmed leader on the derivatives market in 2009Lyxor named "Institutional Manager of the Year 2009" for the quality of its "managed accounts" platform.
Equity NBIEquity NBI
CORPORATE ANDINVESTMENT BANKING
Clients
Trading
Several awards received in 2009Several awards received in 2009
BestBest Equity Derivatives HouseEquity Derivatives House
LyxorLyxor: : Institutional Manager of Institutional Manager of the Yearthe Year
#1#1 Global Provider of Equity Global Provider of Equity DerivativesDerivatives

19SECOND QUARTER AND FIRST HALF 2009 RESULTS 05 / 08 / 2009
440 442 462296 348
648
1,028 965
-367541
736 790 281 1,569 1,427
Q2 08 Q3 08 Q4 08 Q1 09 Q2 09
Fixed Income, Currencies and Commodities: a high level of revenues maintained
NBI: EUR 1,427m (+94% vs. Q2 08), slightly down (-9%) vs. Q1 09
Very solid commercial performance (+9%* vs. Q2 08)
Flow products (+34% vs. Q2 08), including fixed income products (+96% vs. Q2 08)Strong quarter for Fixed Income and Currencies structured products (+45% vs. Q2 08)
High trading revenues in market conditions that have remained favourable
Continued gains in market share since the start of the crisis
Significant growth on Currencies and Euro Government Bonds electronic platformsConfirmation of status as leading player on the commodities market: • World No. 3 in global rankings• Best Derivatives House 2009
Fixed Income, Currencies and Commodities NBIFixed Income, Currencies and Commodities NBI
CORPORATE ANDINVESTMENT BANKING
Clients
Trading
* At constant structure, adjusted for change in consolidation method of Gaselys (equity-accounted company at 01/04/2009)
Gains in market share in 2009 vs. 2007Gains in market share in 2009 vs. 2007
FX poll #13 +7
Market share 3.8% +2.8 pts
Secondary debt trading poll #1** +6
Govies marketshare (€) 12.4% +5.7 pts
Global #3 +2
Oil #1 +2
Base metals #1
Currencies
Fixed Income, Credit
Commod-ities
N/A** Secondary Debt Trading Poll: 2008 published in January 2009

20SECOND QUARTER AND FIRST HALF 2009 RESULTS 05 / 08 / 2009
2353
26
87
111
35
10.2%10.4%
4.2%
9.7%7.2% 9.1%
Q1 08 Q2 08 Q3 08 Q4 08 Q1 09 Q2 09Market Volume (EUR bn) SG market share
377 329 547 509 561
556498537301376
Q2 08 Q3 08 Q4 08 Q1 09 Q2 09
Financing and Advisory: a record quarterNBI: EUR 556m (+48% vs. Q2 08)
Structured finance: a very good performanceInfrastructures (+20% vs. Q2 08) and Export (+70% vs. Q2 08) driven by continued state investmentplans and projects in emerging countriesNatural resources: +18% vs. Q2 08, strong energy and mining project financing activityAcquisition finance: 3rd bookrunner for EMEA syndicated acquisition loans (+6.1 pts vs. H1 08)
… although some activities are suffering from low market activity:
Leveraged finance (-38% vs. Q2 08), Real estate (-16% vs. Q2 08)
Capital markets: an excellent quarterVery strong rise in new issuance volumesGrowth in market shares:• No. 3 for new Euro bond issuances, • No. 2 for new "corporate" issuances,• No. 4 for equity and equity derivative issuances
in Western Europe
Financing and Advisory NBIFinancing and Advisory NBI
"Corporate" Euro bond issue: "Corporate" Euro bond issue: solid market share maintainedsolid market share maintained
Recognised success of structuredRecognised success of structuredfinancing vs. 2008financing vs. 2008
Best Commodity Finance Bank #1 +1
Best ExportFinance Arranger #1
CORPORATE ANDINVESTMENT BANKING
Client NBI
=

21SECOND QUARTER AND FIRST HALF 2009 RESULTS 05 / 08 / 2009
Good performance for most of the Group's businesses French Retail Banking solid (25% of NBI*)Satisfactory profitability of International Retail Banking, excl. Russia (13% of NBI*)Corporate and Investment Banking revenues at record levels, excl. non-recurring items (40% of NBI*)
Realignment measuresRealignment of cost base in the businesses the most impacted by the crisis Signature of SGAM-CAAM agreementContinued reduction of assets at risk
Reinforced financial structure: Tier 1 of 9.5%
1
2
3
Capacité à faire face à un environnement plus difficileau cours des 18 prochains mois
Solid fundamentals and realignment of the model underway
SOCIETE GENERALE GROUP
Conclusion
20%
3
* NBI, including Corporate Centre, restated for non-recurring items

05 / 08 / 2009
Investor RelationsPatrick SOMMELET, Louise DE L’ESTANG, Stéphane MARTY, Nathalie SAND
Tel.: +33 (0) 1 42 14 47 72E-mail: [email protected] - Internet: www.investor.socgen.com


![PT XL AXIATA Tbk. [EXCL]](https://static.fdocuments.net/doc/165x107/61d0a0f41821235177763d68/pt-xl-axiata-tbk-excl.jpg)


