04-Presentation Analysis of Faults
94
-
Upload
rajesh-pillai -
Category
Documents
-
view
228 -
download
0
Transcript of 04-Presentation Analysis of Faults

8/8/2019 04-Presentation Analysis of Faults
http://slidepdf.com/reader/full/04-presentation-analysis-of-faults 1/94

8/8/2019 04-Presentation Analysis of Faults
http://slidepdf.com/reader/full/04-presentation-analysis-of-faults 2/94
Fault Analysis

8/8/2019 04-Presentation Analysis of Faults
http://slidepdf.com/reader/full/04-presentation-analysis-of-faults 3/94
> Fault Analysis – January 2004 3 3
Power System Fault Analysis (1)
TO :- Calculate Power System Currents and Voltages during Fault
Conditions Check that Breaking Capacity of Switchgear is Not
Exceeded
Determine the Quantities which can be used by Relays toDistinguish Between Healthy (i.e. Loaded) and FaultConditions
Appreciate the Effect of the Method of Earthing on theDetection of Earth Faults
Select the Best Relay Characteristics for Fault Detection
Ensure that Load and Short Circuit Ratings of Plant are NotExceeded
Select Relay Settings for Fault Detection and Discrimination
Understand Principles of Relay Operation
Conduct Post Fault Analysis
All Protection Engineers should have an understanding

8/8/2019 04-Presentation Analysis of Faults
http://slidepdf.com/reader/full/04-presentation-analysis-of-faults 4/94
> Fault Analysis – January 2004 4 4
Power System Fault Analysis (2)
Consider Stability Conditions
Required fault clearance times
Need for 1 phase or 3 phase auto-reclose
Power System Fault Analysis also used to :-

8/8/2019 04-Presentation Analysis of Faults
http://slidepdf.com/reader/full/04-presentation-analysis-of-faults 5/94
> Fault Analysis – January 2004 5 5
Vectors
Vector notation can be used to represent phaserelationship between electrical quantities.
V
Z
I
θV = Vsinwt = V ∠0°
I = I ∠-θ° = Isin(wt-θ)

8/8/2019 04-Presentation Analysis of Faults
http://slidepdf.com/reader/full/04-presentation-analysis-of-faults 6/94
> Fault Analysis – January 2004 6 6
j Operator
Rotates vectors by 90°anticlockwise :
Used to express vectors in terms of “real” and“imaginary” parts.
1
90°90°
90°90°
j = 1 ∠90°
j2 = 1 ∠180°
= -1
j3 = 1 ∠270°= -j

8/8/2019 04-Presentation Analysis of Faults
http://slidepdf.com/reader/full/04-presentation-analysis-of-faults 7/94
> Fault Analysis – January 2004 7 7
a = 1 ∠120 °
Rotates vectors by 120°anticlockwise
Used extensively in “Symmetrical Component Analysis”
120°
120° 1
120°
23 j
21- 1201 a +=°∠=
2
3 j
2
1 2401 a 2 −−=°∠=

8/8/2019 04-Presentation Analysis of Faults
http://slidepdf.com/reader/full/04-presentation-analysis-of-faults 8/94

8/8/2019 04-Presentation Analysis of Faults
http://slidepdf.com/reader/full/04-presentation-analysis-of-faults 9/94
> Fault Analysis – January 2004 9 9
Representation of Plant

8/8/2019 04-Presentation Analysis of Faults
http://slidepdf.com/reader/full/04-presentation-analysis-of-faults 10/94
> Fault Analysis – January 2004 10 10
Generator Short Circuit Current
The AC Symmetrical component of the short circuit current varies with timedue to effect of armature reaction.
Magnitude (RMS) of current at any time t after instant of short circuit :
where :
I" = Initial Symmetrical S/C Current or Subtransient Current= E/Xd" ≈ 50ms
I' = Symmetrical Current a Few Cycles Later ≈ 0.5s orTransient Current = E/Xd'
I = Symmetrical Steady State Current = E/Xd
ΙΙΙΙΙΙ )e-'( )e'-"( t/Td'-t/Td"-ac +
iTIME

8/8/2019 04-Presentation Analysis of Faults
http://slidepdf.com/reader/full/04-presentation-analysis-of-faults 11/94
> Fault Analysis – January 2004 11 11
Simple Generator Models
Generator model X will vary with time. Xd" - Xd' - Xd
X
E

8/8/2019 04-Presentation Analysis of Faults
http://slidepdf.com/reader/full/04-presentation-analysis-of-faults 12/94
> Fault Analysis – January 2004 12 12
Parallel Generators
11kV
20MVA
XG=0.2pu
11kV 11kV
j0.05 j0.1
XG=0.2pu
20MVA
If both generator EMF’s are equal ∴ they can be thought of asresulting from the same ideal source - thus the circuit can besimplified.

8/8/2019 04-Presentation Analysis of Faults
http://slidepdf.com/reader/full/04-presentation-analysis-of-faults 13/94
> Fault Analysis – January 2004 13 13
P.U. Diagram
IF
j0.05 j0.1
j0.2
1.01.0
j0.2
IF
j0.05 j0.1
j0.2 j0.2
1.0⇒

8/8/2019 04-Presentation Analysis of Faults
http://slidepdf.com/reader/full/04-presentation-analysis-of-faults 14/94
> Fault Analysis – January 2004 14 14
Positive Sequence Impedances of Transformers
2 Winding Transformers
ZP = Primary Leakage Reactance
ZS = Secondary LeakageReactance
ZM = Magnetising impedance= Large compared with ZP
and ZS
ZM Infinity ∴ Represented byan Open Circuit
ZT1 = ZP + ZS = PositiveSequence Impedance
ZP and ZSboth expressedon same voltagebase.
S1P1
P S
P1 S1ZP ZS
ZM
N1
N1
ZT1 = ZP + ZS

8/8/2019 04-Presentation Analysis of Faults
http://slidepdf.com/reader/full/04-presentation-analysis-of-faults 15/94
> Fault Analysis – January 2004 15 15
Motors
Xd"
M 1.0
Fault current contribution decays with time
Decay rate of the current depends on the system.
From tests, typical decay rate is 100 - 150mS. Typically modelled as a voltage behind an
impedance

8/8/2019 04-Presentation Analysis of Faults
http://slidepdf.com/reader/full/04-presentation-analysis-of-faults 16/94
> Fault Analysis – January 2004 16 16
Induction Motors – IEEE Recommendations
Small Motors
Motor load <35kW neglect
Motor load >35kW SCM = 4 x sum of FLCM
Large Motors
SCM ≈ motor full load ampsXd"
Approximation : SCM = locked rotor amps
SCM = 5 x FLCM ≈ assumes motorimpedance 20%

8/8/2019 04-Presentation Analysis of Faults
http://slidepdf.com/reader/full/04-presentation-analysis-of-faults 17/94
> Fault Analysis – January 2004 17 17
Synchronous Motors – IEEE Recommendations
Large Synchronous Motors
SCM ≈ 6.7 x FLCM for Assumes X" d = 15%1200 rpm
≈ 5 x FLCM
for Assumes X" d = 20%
514 - 900 rpm
≈ 3.6 x FLCM for Assumes X" d = 28%
450 rpm or less

8/8/2019 04-Presentation Analysis of Faults
http://slidepdf.com/reader/full/04-presentation-analysis-of-faults 18/94
> Fault Analysis – January 2004 18 18
Balanced Faults
8/8/2019 04-Presentation Analysis of Faults
http://slidepdf.com/reader/full/04-presentation-analysis-of-faults 19/94
> Fault Analysis – January 2004 19 19
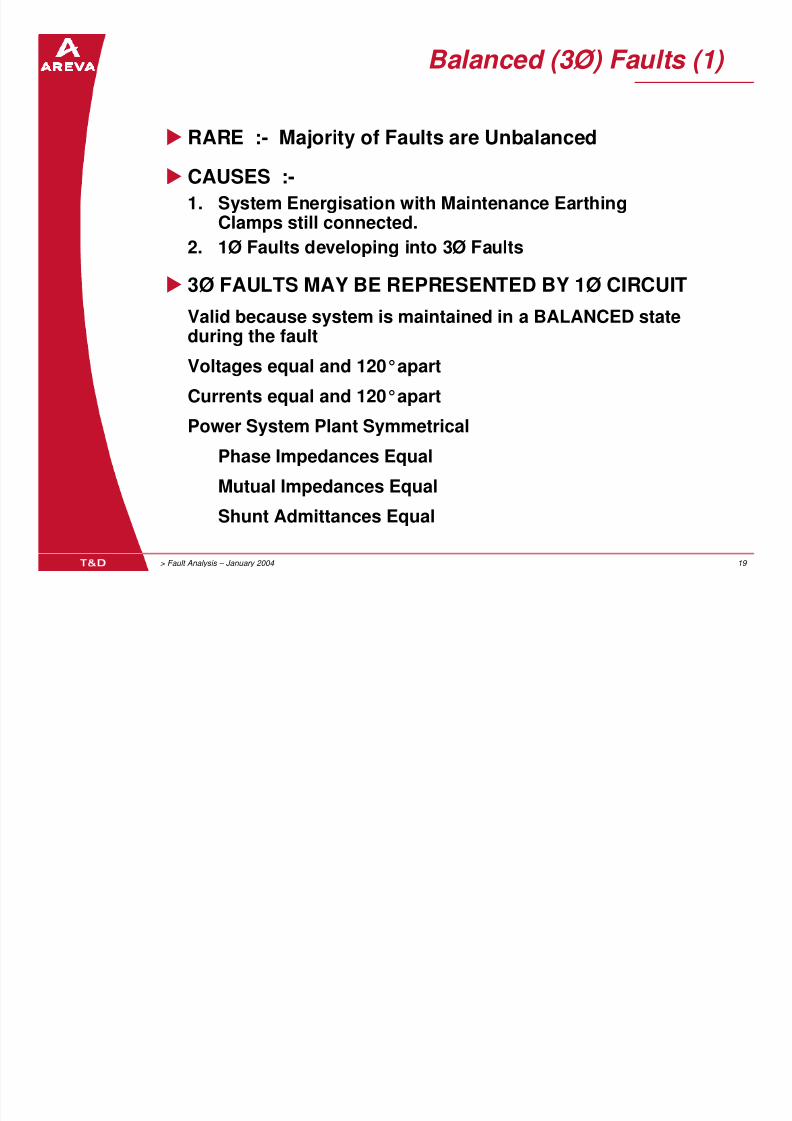
Balanced (3Ø) Faults (1)
RARE :- Majority of Faults are Unbalanced
CAUSES :-
1. System Energisation with Maintenance Earthing
Clamps still connected.
2. 1Ø Faults developing into 3Ø Faults
3Ø FAULTS MAY BE REPRESENTED BY 1Ø CIRCUIT
Valid because system is maintained in a BALANCED stateduring the fault
Voltages equal and 120°apart
Currents equal and 120°apart
Power System Plant SymmetricalPhase Impedances Equal
Mutual Impedances Equal
Shunt Admittances Equal

8/8/2019 04-Presentation Analysis of Faults
http://slidepdf.com/reader/full/04-presentation-analysis-of-faults 20/94
> Fault Analysis – January 2004 20 20
Balanced (3Ø) Faults (2)
LINE ‘X’
LOADS
LINE ‘Y’
3Ø FAULT
ZLOAD
ZLY
IbF
IcF
IaFZLXZTZG
Ec
Ea
Eb
GENERATOR TRANSFORMER

8/8/2019 04-Presentation Analysis of Faults
http://slidepdf.com/reader/full/04-presentation-analysis-of-faults 21/94
> Fault Analysis – January 2004 21 21
Balanced (3Ø) Faults (3)
Positive Sequence (Single Phase) Circuit :-
Ea
Ec
EaF1
N1
Eb
IbF
Ia1 = IaF
IcF
IaF
ZT1 ZLX1 ZLX2ZG1
ZLOAD

8/8/2019 04-Presentation Analysis of Faults
http://slidepdf.com/reader/full/04-presentation-analysis-of-faults 22/94
> Fault Analysis – January 2004 22 22
Analysis of Balanced Faults

8/8/2019 04-Presentation Analysis of Faults
http://slidepdf.com/reader/full/04-presentation-analysis-of-faults 23/94
> Fault Analysis – January 2004 23 23
Different Voltages – How Do We Analyse?
11kV20MVA
ZG=0.3pu
11/132kV50MVA
ZT=10% ZL=40Ω
O/H Line
132/33kV50MVA
ZT=10% ZL=8Ω
Feeder

8/8/2019 04-Presentation Analysis of Faults
http://slidepdf.com/reader/full/04-presentation-analysis-of-faults 24/94

8/8/2019 04-Presentation Analysis of Faults
http://slidepdf.com/reader/full/04-presentation-analysis-of-faults 25/94
> Fault Analysis – January 2004 25 25
Per Unit System
Used to simplify calculations on systems with morethan 2 voltages.
Definition
: P.U. Value = Actual Valueof a Quantity Base Value in the Same Units

8/8/2019 04-Presentation Analysis of Faults
http://slidepdf.com/reader/full/04-presentation-analysis-of-faults 26/94
> Fault Analysis – January 2004 26 26
Base Quantities and Per Unit Values
Particularly useful when analysing large systems withseveral voltage levels
All system parameters referred to common base quantities
Base quantities fixed in one part of system Base quantities at other parts at different voltage levels
depend on ratio of intervening transformers
11 kV
20 MVAO/H LINE
11/132 kV
50 MVA
ZT = 10%ZT = 10%
132/33 kV
50 MVAFEEDER
ZL = 8ΩZL = 40ΩZG = 0.3 p.u.

8/8/2019 04-Presentation Analysis of Faults
http://slidepdf.com/reader/full/04-presentation-analysis-of-faults 27/94
> Fault Analysis – January 2004 27 27
Base Quantities and Per Unit Values (1)
Base quantities normally used :-
BASE MVA = MVAb = 3∅ MVA
Constant at all voltage levels
Value ~ MVA rating of largest itemof plant or 100MVA
BASE VOLTAGE = KVb = ∅ / ∅ voltage in kV
Fixed in one part of system
This value is referred through
transformers to obtain base
voltages on other parts of system.
Base voltages on each side of
transformer are in same ratio asvoltage ratio.

8/8/2019 04-Presentation Analysis of Faults
http://slidepdf.com/reader/full/04-presentation-analysis-of-faults 28/94
> Fault Analysis – January 2004 28 28
Base Quantities and Per Unit Values (2)
Other base quantities :-
kAin kV.3
MVA CurrentBase
Ohmsin MVA
)(kV Z ImpedanceBase
b
bb
b
2b
b
==
==
Ι

8/8/2019 04-Presentation Analysis of Faults
http://slidepdf.com/reader/full/04-presentation-analysis-of-faults 29/94
> Fault Analysis – January 2004 29 29
Base Quantities and Per Unit Values (3)
Per Unit Values = Actual ValueBase Value
CurrentUnitPer
)(kV
MVA .Z
Z
Z Z ImpedanceUnitPer
KV
KV kV VoltageUnitPer
MVA
MVA MVA MVAUnitPer
b
ap.u.
2
b
ba
b
ap.u.
bap.u.
b
ap.u.
Ι
ΙΙ ==
===
==
==

8/8/2019 04-Presentation Analysis of Faults
http://slidepdf.com/reader/full/04-presentation-analysis-of-faults 30/94
> Fault Analysis – January 2004 30 30
Transformer Percentage Impedance
If ZT = 5%
with Secondary S/C
5% V (RATED) produces I (RATED) in Secondary.
∴ V (RATED) produces 100 x I (RATED)
5
= 20 x I (RATED)
If Source Impedance ZS = 0
Fault current = 20 x I (RATED)
Fault Power = 20 x kVA (RATED)
ZT is based on I (RATED) & V (RATED)
i.e. Based on MVA (RATED) & kV (RATED)
∴ is same value viewed from either side of transformer.
8/8/2019 04-Presentation Analysis of Faults
http://slidepdf.com/reader/full/04-presentation-analysis-of-faults 31/94
> Fault Analysis – January 2004 31 31
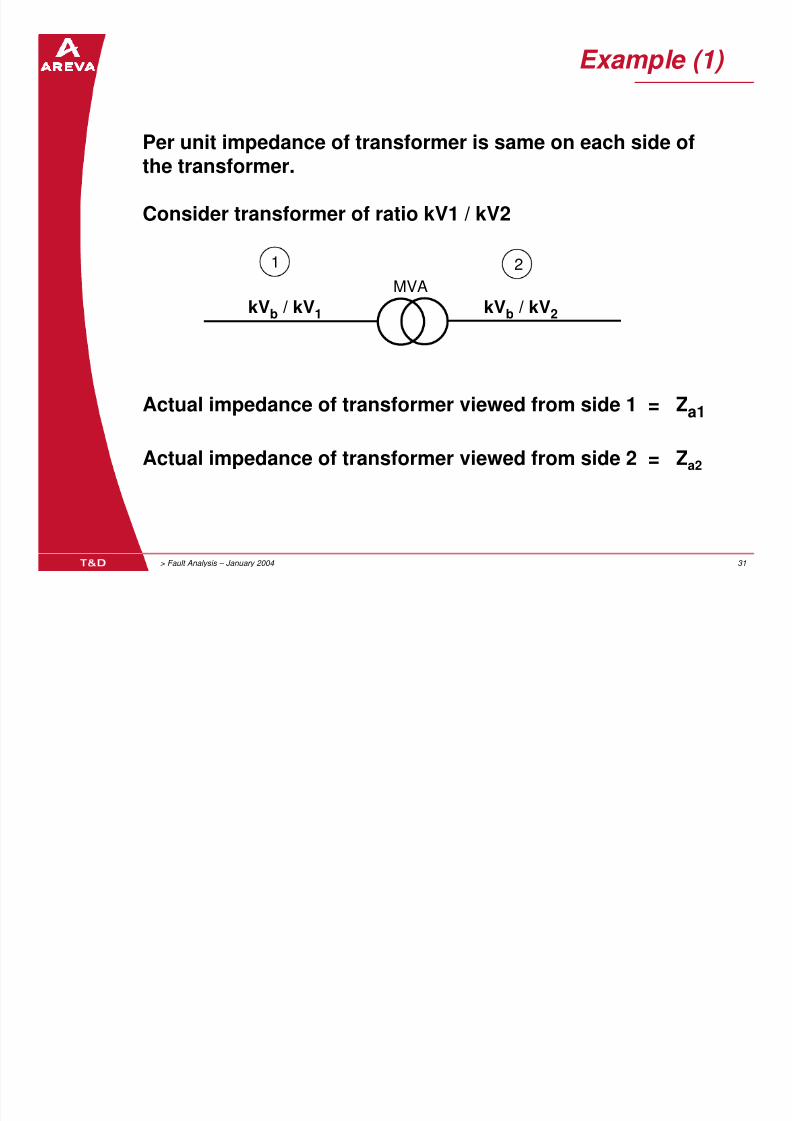
Example (1)
Per unit impedance of transformer is same on each side ofthe transformer.
Consider transformer of ratio kV1 / kV2
Actual impedance of transformer viewed from side 1 = Za1
Actual impedance of transformer viewed from side 2 = Za2
MVA
1 2
kVb / kV1 kVb / kV2

8/8/2019 04-Presentation Analysis of Faults
http://slidepdf.com/reader/full/04-presentation-analysis-of-faults 32/94
> Fault Analysis – January 2004 32 32
Example (2)
Base voltage on each side of a transformer must be in thesame ratio as voltage ratio of transformer.
Incorrect selection
of kVb 11.8kV 132kV 11kV
Correct selection 132x11.8 132kV 11kVof kVb 141
= 11.05kV
Alternative correct 11.8kV 141kV 141x11 = 11.75kVselection of kVb 132
11.8kV 11.8/141kV 132/11kV
OHL DistributionSystem

8/8/2019 04-Presentation Analysis of Faults
http://slidepdf.com/reader/full/04-presentation-analysis-of-faults 33/94
> Fault Analysis – January 2004 33 33
Conversion of Per Unit Values from One Set of Quantities to Another
Z
p.u.2Z
p.u.1
Zb1 Zb2
MVAb1
MVAb2
kVb1 kVb2
Actual Z = Za
2b2
2b1
b1
b2p.u.1
2b2
b2
b1
2b1p.u.1
b2
b1p.u.1
b2
ap.u.2
b1ap.u.1
)(kV
)(kVx
MVA
MVAxZ
)(kV
MVAxMVA
)(kVxZ
Z
ZxZ
Z
Z Z
Z
Z Z
=
=
==
=

8/8/2019 04-Presentation Analysis of Faults
http://slidepdf.com/reader/full/04-presentation-analysis-of-faults 34/94
F l T

8/8/2019 04-Presentation Analysis of Faults
http://slidepdf.com/reader/full/04-presentation-analysis-of-faults 35/94
> Fault Analysis – January 2004 35 35
Fault Types
Line - Ground (65 - 70%)
Line - Line - Ground (10 - 20%)
Line - Line (10 - 15%)
Line - Line - Line (5%)
Statistics published in 1967 CEGB Report, but are
similar today all over the world.

8/8/2019 04-Presentation Analysis of Faults
http://slidepdf.com/reader/full/04-presentation-analysis-of-faults 36/94
> Fault Analysis – January 2004 36 36
Unbalanced Faults
U b l d F lt (1)

8/8/2019 04-Presentation Analysis of Faults
http://slidepdf.com/reader/full/04-presentation-analysis-of-faults 37/94
> Fault Analysis – January 2004 37 37
Unbalanced Faults (1)
In three phase fault calculations, a singlephase representation is adopted.
3 phase faults are rare.
Majority of faults are unbalanced faults.
UNBALANCED FAULTS may be classified intoSHUNT FAULTS and SERIES FAULTS.
SHUNT FAULTS:Line to GroundLine to LineLine to Line to Ground
SERIES FAULTS:
Single Phase Open CircuitDouble Phase Open Circuit
Unbalanced Faults (2)

8/8/2019 04-Presentation Analysis of Faults
http://slidepdf.com/reader/full/04-presentation-analysis-of-faults 38/94
> Fault Analysis – January 2004 38 38
Unbalanced Faults (2)
LINE TO GROUND
LINE TO LINE
LINE TO LINE TO GROUND
Causes :
1) Insulation Breakdown
2) Lightning Discharges and other Overvoltages
3) Mechanical Damage

8/8/2019 04-Presentation Analysis of Faults
http://slidepdf.com/reader/full/04-presentation-analysis-of-faults 39/94
Unbalanced Faults (4)

8/8/2019 04-Presentation Analysis of Faults
http://slidepdf.com/reader/full/04-presentation-analysis-of-faults 40/94
> Fault Analysis – January 2004 40 40
Unbalanced Faults (4)
Analysed using :-
Symmetrical Components
Equivalent Sequence Networks of PowerSystem
Connection of Sequence Networks
appropriate to Type of Fault

8/8/2019 04-Presentation Analysis of Faults
http://slidepdf.com/reader/full/04-presentation-analysis-of-faults 41/94
> Fault Analysis – January 2004 41 41
Symmetrical Components
Symmetrical Components

8/8/2019 04-Presentation Analysis of Faults
http://slidepdf.com/reader/full/04-presentation-analysis-of-faults 42/94
> Fault Analysis – January 2004 42 42
Symmetrical Components
Fortescue discovered a property of unbalanced phasors‘n’ phasors may be resolved into :-
(n-1) sets of balanced n-phase systems of phasors, eachset having a different phase sequence
plus
1 set of zero phase sequence or unidirectional phasors
VA = VA1 + VA2 + VA3 + VA4 - - - - - VA(n-1) + VAn
VB = VB1 + VB2 + VB3 + VB4 - - - - - VB(n-1) + VBn
VC = VC1 + VC2 + VC3 + VC4 - - - - - VC(n-1) + VCn
VD = VD1 + VD2 + VD3 + VD4 - - - - - VD(n-1) + VDn
- - - - - - - - - - - - - - - - - - - - - - - - - - - - - - - - - - - - - - - - - -
Vn = Vn1 + Vn2 + Vn3 + Vn4 - - - - - Vn(n-1) + Vnn
(n-1) x Balanced 1 x ZeroSequence
Unbalanced 3-Phase System

8/8/2019 04-Presentation Analysis of Faults
http://slidepdf.com/reader/full/04-presentation-analysis-of-faults 43/94
> Fault Analysis – January 2004 43 43
Unbalanced 3-Phase System
VA = VA1 + VA2 + VA0
VB = VB1 + VB2 + VB0
VC = VC1 + VC2 + VC0
Positive Sequence Negative Sequence
VA1
VC1
120°
VB1
VA2
VB2VC2
240°
Unbalanced 3-Phase System

8/8/2019 04-Presentation Analysis of Faults
http://slidepdf.com/reader/full/04-presentation-analysis-of-faults 44/94
> Fault Analysis – January 2004 44 44
Unbalanced 3 Phase System
Zero Sequence
VA0
VB0
VC0
Symmetrical Components

8/8/2019 04-Presentation Analysis of Faults
http://slidepdf.com/reader/full/04-presentation-analysis-of-faults 45/94
> Fault Analysis – January 2004 45 45
Symmetrical Components
VA VA1 + VA2 + VA0
VB VB1 + VB2 + VB0
VC VC1 + VC2 + VC0
VA
VB
VC
++
VB1
VC1
VA1
VB2
VC2
VC0
VB0VA0VA2
VB1 = a2VA1 VB2 = a VA2 VB0 = VA0
VC1
= a VA1
VC2
= a2VA2
VC0
= VA0
==
=
Phase ≡ Positive + Negative + Zero

8/8/2019 04-Presentation Analysis of Faults
http://slidepdf.com/reader/full/04-presentation-analysis-of-faults 46/94
Converting from Phase Values to

8/8/2019 04-Presentation Analysis of Faults
http://slidepdf.com/reader/full/04-presentation-analysis-of-faults 47/94
> Fault Analysis – January 2004 47 47
VA1 = 1/3 VA + a VB + a2VC
VA2 = 1/3 VA + a2VB + a VC
VA0
= 1/3 VA
+ VB
+ VC
Converting from Phase Values to Sequence Components
VC
3VA0
VB
VA0
VA
Summary

8/8/2019 04-Presentation Analysis of Faults
http://slidepdf.com/reader/full/04-presentation-analysis-of-faults 48/94
> Fault Analysis – January 2004 48 48
y
VA
= VA1
+ VA2
+ VA0
VB = ∝2VA1 + ∝VA2 + VA0
VC = ∝VA1 + ∝2VA2 + VA0
IA = IA1 + IA2 + IA0
IB = ∝2IA1 + ∝A2 + IA0
IC = ∝IA1 + ∝2IA2 + IA0
VA1 = 1/3 VA + ∝VB + ∝2VC
VA2 = 1/3 VA + ∝2VB + ∝VC
VA0 = 1/3 VA + VB + VC
IA1 = 1/3 IA + ∝IB + ∝2IC
IA2 = 1/3 IA + ∝2IB + ∝IC
IA0 + 1/3 IA + IB + IC
Residual Current

8/8/2019 04-Presentation Analysis of Faults
http://slidepdf.com/reader/full/04-presentation-analysis-of-faults 49/94
> Fault Analysis – January 2004 49 49
IA
IRESIDUAL = IA + IB + IC
= 3I0
IB
IC
E/F
Used to detect earth faults
IRESIDUAL is Balanced Load IRESIDUAL is ∅/E Faultszero for :- 3∅ Faults present for :- ∅/Ø/E Faults
Ø/∅ Faults Open circuits (withcurrent in remaining phases)
Residual Voltage

8/8/2019 04-Presentation Analysis of Faults
http://slidepdf.com/reader/full/04-presentation-analysis-of-faults 50/94
> Fault Analysis – January 2004 50 50
g
Residual voltage is measuredfrom “Open Delta” or “Broken
Delta” VT secondary windings.VRESIDUAL is zero for:-
Healthy unfaulted systems3∅ Faults
∅/∅ FaultsVRESIDUAL is present for:-
∅/E Faults∅/∅/E Faults
Open Circuits (on supplyside of VT)
VRESIDUAL =
VA + VB + VC
= 3V0
Used to detect earth faults
Example

8/8/2019 04-Presentation Analysis of Faults
http://slidepdf.com/reader/full/04-presentation-analysis-of-faults 51/94
> Fault Analysis – January 2004 51 51
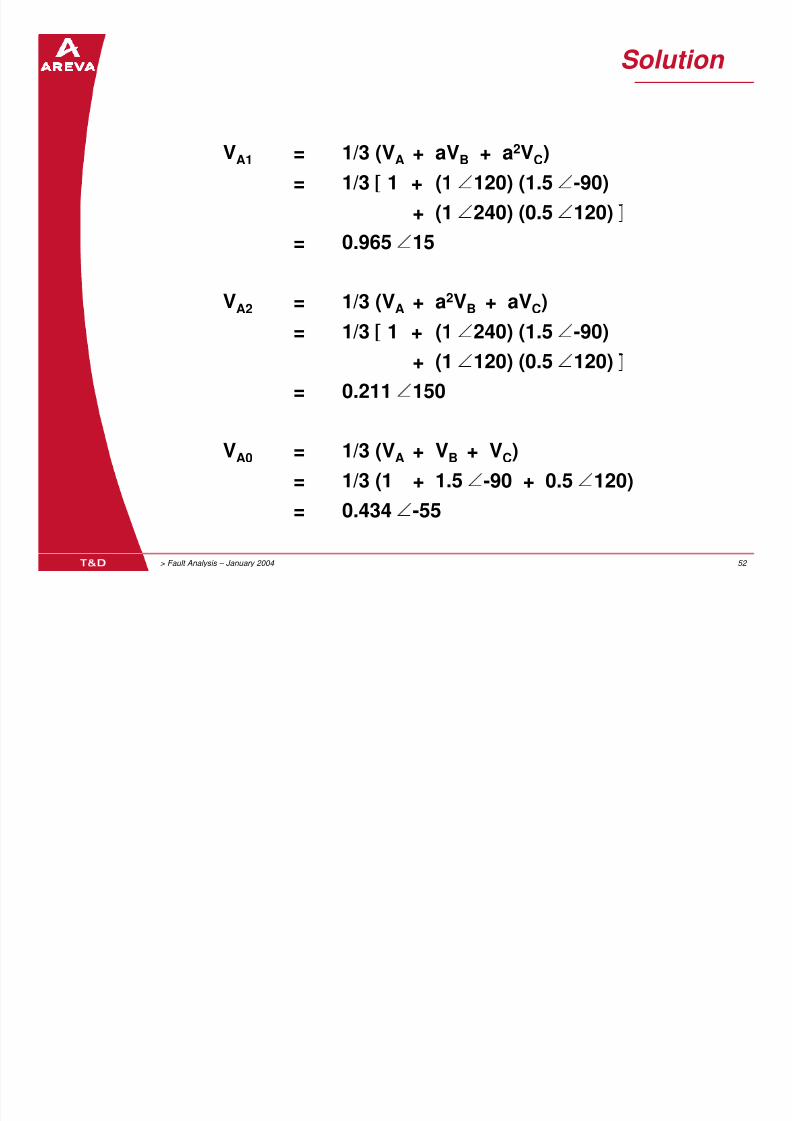
Evaluate the positive, negative and zero sequencecomponents for the unbalanced phase vectors :
VA = 1 ∠0°
VB = 1.5 ∠-90°
VC = 0.5 ∠120°
VC
VA
VB
Solution
8/8/2019 04-Presentation Analysis of Faults
http://slidepdf.com/reader/full/04-presentation-analysis-of-faults 52/94
> Fault Analysis – January 2004 52 52
VA1 = 1/3 (VA + aVB + a2VC)
= 1/3 [ 1 + (1 ∠120) (1.5 ∠-90)
+ (1 ∠240) (0.5 ∠120) ]
= 0.965 ∠15
VA2 = 1/3 (VA + a2VB + aVC)
= 1/3 [ 1 + (1 ∠240) (1.5 ∠-90)+ (1 ∠120) (0.5 ∠120) ]
= 0.211 ∠150
VA0 = 1/3 (VA + VB + VC)
= 1/3 (1 + 1.5 ∠-90 + 0.5 ∠120)
= 0.434 ∠-55
Positive Sequence Voltages

8/8/2019 04-Presentation Analysis of Faults
http://slidepdf.com/reader/full/04-presentation-analysis-of-faults 53/94
> Fault Analysis – January 2004 53 53
VA1 = 0.965∠15º
VC1 = aVA1
VB1 = a2VA1
15º

8/8/2019 04-Presentation Analysis of Faults
http://slidepdf.com/reader/full/04-presentation-analysis-of-faults 54/94
> Fault Analysis – January 2004 54 54
Zero Sequence Voltages
Negative Sequence Voltages
VA2 = 0.211∠150°
VB2 = aVA2
150º
VC2 = a2VA2 -55º
VA0 = 0.434∠-55ºVB0 = -
VC0 = -
Example

8/8/2019 04-Presentation Analysis of Faults
http://slidepdf.com/reader/full/04-presentation-analysis-of-faults 55/94
> Fault Analysis – January 2004 55 55
Evaluate the phase quantities Ia, Ib and Ic from the sequencecomponents
IA1 = 0.6 ∠0
IA2 = -0.4 ∠0
IA0 = -0.2 ∠0
SolutionIA = IA1 + IA2 + IA0 = 0
IB = ∝2IA1 + ∝IA2 + IA0
= 0.6∠240 - 0.4∠120 - 0.2∠0 = 0.91∠-109
IC = ∝IA1 + ∝2IA2 + IA0
= 0.6∠120 - 0.4∠240 - 0.2∠0 = 0.91∠-109

8/8/2019 04-Presentation Analysis of Faults
http://slidepdf.com/reader/full/04-presentation-analysis-of-faults 56/94
Unbalanced Voltages and Currents acting on

8/8/2019 04-Presentation Analysis of Faults
http://slidepdf.com/reader/full/04-presentation-analysis-of-faults 57/94
> Fault Analysis – January 2004 57 57
Balanced Impedances (2)
Resolve V & I phasors into symmetrical components
1 1 1 V0 ZS ZM ZM 1 1 1 I0
1 a2 a V1 = ZM ZS ZM 1 a2 a I1
1 a a2 V2 ZM ZM ZS 1 a a2 I2
Multiply by [A]-1
V0 1 1 1 ZS ZM ZM 1 1 1 I0
V1 = 1 a2 a ZM ZS ZM 1 a2 a I1
V2 1 a a2 ZM ZM ZS 1 a a2I2
V0 1 1 1 ZS ZM ZM 1 1 1 I0
V1 = 1/3 1 a a2 ZM ZS ZM 1 a2 a I1
V2 1 a2 a ZM ZM ZS 1 a a2 I2
V0 ZS + 2ZM ZS + 2ZM ZS + 2ZM
V1 = 1/3 ZS - ZM ZM + aZS + a2ZM ZM + aZM + a2ZS
V2 ZS - ZM ZM + a2ZS + aZM ZM + a2ZM + aZS
1 1 1 I0
1 a2 a I1
1 a a2I2
-1
Unbalanced Voltages and Currents acting on B l d I d (3)

8/8/2019 04-Presentation Analysis of Faults
http://slidepdf.com/reader/full/04-presentation-analysis-of-faults 58/94
> Fault Analysis – January 2004 58 58
Balanced Impedances (3)
V0 ZS + 2ZM 0 0 I0
V1 = 0 ZS - ZM 0 I1
V2 0 0 ZS - ZM I2
V0 Z0 0 0 I0
V1 = 0 Z1 0 I1
V2 0 0 Z2 I2
The symmetrical component impedance matrix isa diagonal matrix if the system is symmetrical.
The sequence networks are independent of
each other.
The three isolated sequence networks areinterconnected when an unbalance such as a faultor unbalanced loading is introduced.

8/8/2019 04-Presentation Analysis of Faults
http://slidepdf.com/reader/full/04-presentation-analysis-of-faults 59/94
> Fault Analysis – January 2004 59 59
Representation of Plant Cont…
Transformer Zero Sequence Impedance

8/8/2019 04-Presentation Analysis of Faults
http://slidepdf.com/reader/full/04-presentation-analysis-of-faults 60/94
> Fault Analysis – January 2004 60 60
P Q
P Q
aaZT0
b b
N0
General Zero Sequence Equivalent Circuit for T o Winding Transformer

8/8/2019 04-Presentation Analysis of Faults
http://slidepdf.com/reader/full/04-presentation-analysis-of-faults 61/94
> Fault Analysis – January 2004 61 61
Two Winding Transformer
On appropriate side of transformer :
Earthed Star Winding - Close link ‘a’Open link ‘b’
Delta Winding - Open link ‘a’Close link ‘b’
Unearthed Star Winding - Both links open
SecondaryTerminal'a' 'a'
PrimaryTerminal
'b' 'b'
N 0
Z T0
Zero Sequence Equivalent Circuits (1)

8/8/2019 04-Presentation Analysis of Faults
http://slidepdf.com/reader/full/04-presentation-analysis-of-faults 62/94
> Fault Analysis – January 2004 62 62
S0ZT0
N0
P0
P S
aa
b b
Zero Sequence Equivalent Circuits (2)

8/8/2019 04-Presentation Analysis of Faults
http://slidepdf.com/reader/full/04-presentation-analysis-of-faults 63/94
> Fault Analysis – January 2004 63 63
S0ZT0
N0
P0
P S
aa
b b
Zero Sequence Equivalent Circuits (3)

8/8/2019 04-Presentation Analysis of Faults
http://slidepdf.com/reader/full/04-presentation-analysis-of-faults 64/94
> Fault Analysis – January 2004 64 64
S0ZT0
N0
P0
P S
aa
b b

8/8/2019 04-Presentation Analysis of Faults
http://slidepdf.com/reader/full/04-presentation-analysis-of-faults 65/94
3 Winding Transformers

8/8/2019 04-Presentation Analysis of Faults
http://slidepdf.com/reader/full/04-presentation-analysis-of-faults 66/94
> Fault Analysis – January 2004 66 66
ZP, ZS, ZT = Leakage reactances of Primary,Secondary and Tertiary Windings
ZM = Magnetising Impedance = Large∴ Ignored
T
SP
S
N1
ZMZT
ZSZPP
T
S
N1
ZT
ZSZPP
T
ZP-S = ZP + ZS = Impedance between Primary (P)and Secondary (S) where ZP & ZS
are both expressed on samevoltage base
Similarly ZP-T = ZP + ZT and ZS-T = ZS + ZT
Auto Transformers

8/8/2019 04-Presentation Analysis of Faults
http://slidepdf.com/reader/full/04-presentation-analysis-of-faults 67/94
> Fault Analysis – January 2004 67 67
ZHL1 = ZH1 + ZL1 (both referred to same voltage base)
ZHT1 = ZH1 + ZT1 (both referred to same voltage base)
ZLT1 = ZL1 + ZT1 (both referred to same voltage base)
H L
T
L
N1
ZM1
ZT1
ZL
1
ZH1H
T
L
N1
ZT1
ZL1ZH1H
T
Equivalent circuit is similar to that of a 3
winding transformer.
ZM = Magnetising Impedance =
Large ∴ Ignored

8/8/2019 04-Presentation Analysis of Faults
http://slidepdf.com/reader/full/04-presentation-analysis-of-faults 68/94
Sequence Networks (2)

8/8/2019 04-Presentation Analysis of Faults
http://slidepdf.com/reader/full/04-presentation-analysis-of-faults 69/94
> Fault Analysis – January 2004 69 69
+ve, -ve and zero sequence networks are drawn for a‘reference’ phase. This is usually taken as the ‘A’
phase.
Faults are selected to be ‘balanced’ relative to thereference ‘A’ phase.
e.g. For Ø/E faults consider an A-E fault
For Ø/Ø faults consider a B-C fault
Sequence network interconnection is the simplest forthe reference phase.
Positive Sequence Diagram

8/8/2019 04-Presentation Analysis of Faults
http://slidepdf.com/reader/full/04-presentation-analysis-of-faults 70/94
> Fault Analysis – January 2004 70 70
1. Start with neutral point N1
- All generator and load neutrals are
connected to N1
2. Include all source EMF’s
- Phase-neutral voltage
3. Impedance network- Positive sequence impedance per phase
4. Diagram finishes at fault point F1
N1F1
E1
Z1
Example
G t Transformer

8/8/2019 04-Presentation Analysis of Faults
http://slidepdf.com/reader/full/04-presentation-analysis-of-faults 71/94
> Fault Analysis – January 2004 71 71
V1
= Positive sequence PH-N voltage at fault point
I1 = Positive sequence phase current flowing into F1
V1 = E1 - I1 (ZG1 + ZT1 + ZL1)
Generator Transformer
Line FN
R
E
N1
E1 ZG1 ZT1 ZL1 I1 F1
V1
(N1)
Negative Sequence Diagram

8/8/2019 04-Presentation Analysis of Faults
http://slidepdf.com/reader/full/04-presentation-analysis-of-faults 72/94
> Fault Analysis – January 2004 72 72
1. Start with neutral point N2
- All generator and load neutrals are connectedto N2
2. No EMF’s included
- No negative sequence voltage is generated!
3. Impedance network
- Negative sequence impedance per phase
4. Diagram finishes at fault point F2
N2Z2 F2
Example
Generator Transformer

8/8/2019 04-Presentation Analysis of Faults
http://slidepdf.com/reader/full/04-presentation-analysis-of-faults 73/94
> Fault Analysis – January 2004 73 73
V2
= Negative sequence PH-N voltage at fault point
I2 = Negative sequence phase current flowing into F2
V2 = -I2 (ZG2 + ZT2 + ZL2)
Generator Transformer
System Single LineDiagram
Negative Sequence Diagram
Line FN
R
E
N2ZG2 ZT2 ZL2 I2 F2
V2
(N2)
Zero Sequence Diagram (1)

8/8/2019 04-Presentation Analysis of Faults
http://slidepdf.com/reader/full/04-presentation-analysis-of-faults 74/94
> Fault Analysis – January 2004 74 74
For “In Phase” (Zero Phase Sequence) currents to flow ineach phase of the system, there must be a fourthconnection (this is typically the neutral or earthconnection).
IA0 + IB0 + IC0 = 3IA0
IA0N
IB0
IC0
Zero Sequence Diagram (2)

8/8/2019 04-Presentation Analysis of Faults
http://slidepdf.com/reader/full/04-presentation-analysis-of-faults 75/94
> Fault Analysis – January 2004 75 75
Zero sequence voltage between N & E given by
V0 = 3IA0.R
Zero sequence impedance of neutral to earth pathZ0 = V0 = 3R
IA0
3ΙA0
N
E
R
Resistance Earthed System :-
Zero Sequence Diagram (3)
Generator Transformer

8/8/2019 04-Presentation Analysis of Faults
http://slidepdf.com/reader/full/04-presentation-analysis-of-faults 76/94
> Fault Analysis – January 2004 76 76
(N0)E0
Generator Transformer
System Single Line Diagram
Zero Sequence Network
FN
R
E
N0ZG0 ZT0 ZL0 I0 F0
V0
Line
RT
3R 3RT
V0
= Zero sequence PH-E voltage at fault point
I0 = Zero sequence current flowing into F0
V0 = -I0 (ZT0 + ZL0)

8/8/2019 04-Presentation Analysis of Faults
http://slidepdf.com/reader/full/04-presentation-analysis-of-faults 77/94
> Fault Analysis – January 2004 77 77
Network Connections
Interconnection of Sequence Networks (1)

8/8/2019 04-Presentation Analysis of Faults
http://slidepdf.com/reader/full/04-presentation-analysis-of-faults 78/94
> Fault Analysis – January 2004 78 78
Consider sequence networks as blocks with faultterminals F & N for external connections.
F1
POSITIVESEQUENCENETWORK
N1
F2NEGATIVESEQUENCENETWORK
N2
F0ZEROSEQUENCENETWORK
N0
I2
V2
I0
V0
Interconnection of Sequence Networks (2)
For any given fault there are 6 quantities to be considered at the fault

8/8/2019 04-Presentation Analysis of Faults
http://slidepdf.com/reader/full/04-presentation-analysis-of-faults 79/94
> Fault Analysis – January 2004 79 79
y g q
point
i.e. VA VB VC IA IB IC
Relationships between these for any type of fault can be convertedinto an equivalent relationship between sequence components
V1, V2, V0 and I1, I2 , I0
This is possible if :-
1) Any 3 phase quantities are known (provided they are not all
voltages or all currents)or 2) 2 are known and others are known to have a specific
relationship.
From the relationship between sequence V’s and I’s, the manner in
which the isolation sequence networks are connected can bedetermined.
The connection of the sequence networks provides a single phaserepresentation (in sequence terms) of the fault.

8/8/2019 04-Presentation Analysis of Faults
http://slidepdf.com/reader/full/04-presentation-analysis-of-faults 80/94
> Fault Analysis – January 2004 80 80
IA
VA
IB IC
VB VC
F
To derive the system constraints at the fault terminals :-
Terminals are connected to represent the fault.
Line to Ground Fault on Phase ‘A’

8/8/2019 04-Presentation Analysis of Faults
http://slidepdf.com/reader/full/04-presentation-analysis-of-faults 81/94
> Fault Analysis – January 2004 81 81
At fault point :-
VA = 0VB = ?VC = ?
IA = ?
IB = 0IC = 0
IA
VA
IB IC
VB VC
Phase to Earth Fault on Phase ‘A’
At fault point

8/8/2019 04-Presentation Analysis of Faults
http://slidepdf.com/reader/full/04-presentation-analysis-of-faults 82/94
> Fault Analysis – January 2004 82 82
VA = 0 ; IB = 0 ; IC = 0
but VA = V1 + V2 + V0
∴ V1 + V2 + V0 = 0 ------------------------- (1)
I0 = 1/3 (IA + IB + IC ) = 1/3 IA
I1 = 1/3 (IA + aIB + a2IC) = 1/3 IA
I2 = 1/3 (IA + a2IB + aIC) = 1/3 IA
∴ I1 = I2 = I0 = 1/3 IA ------------------------- (2)
To comply with (1) & (2) the sequence networks must be connected in series :-
I1 F1
N1
V1
+veSeqN/W
I2F2
N2
V2
-ve
SeqN/WI0
F0
N0
V0
ZeroSeqN/W
Example : Phase to Earth Fault
SOURCE LINE F

8/8/2019 04-Presentation Analysis of Faults
http://slidepdf.com/reader/full/04-presentation-analysis-of-faults 83/94
> Fault Analysis – January 2004 83 83
132 kV2000 MVAZS1 = 8.7ΩZS0 = 8.7Ω
A - GFAULTZL1 = 10Ω
ZL0 = 35Ω IF
8.7 10 I1 F1
N1
8.7 10 I2 F2
N2
8.7 35 I0 F0
N0
Total impedance = 81.1Ω
I1 = I2 = I0 = 132000 = 940 Amps
√3 x 81.1IF = IA = I1 + I2 + I0 = 3I0
= 2820 Amps
Earth Fault with Fault Resistance

8/8/2019 04-Presentation Analysis of Faults
http://slidepdf.com/reader/full/04-presentation-analysis-of-faults 84/94
> Fault Analysis – January 2004 84 84
F1
POSITIVESEQUENCENETWORK
N1
F2
NEGATIVESEQUENCE
NETWORK
N2
F0
ZERO
SEQUENCENETWORK
N0
I2
V2
I0
V0
I1
V1
3ZF
Phase to Phase Fault:- B-C Phase

8/8/2019 04-Presentation Analysis of Faults
http://slidepdf.com/reader/full/04-presentation-analysis-of-faults 85/94
> Fault Analysis – January 2004 85 85
I1F1
N1
V1
+veSeqN/W
I2F2
N2
V2
-veSeqN/W
I0F0
N0
V0
ZeroSeqN/W
Example : Phase to Phase Fault
SOURCE LINE F

8/8/2019 04-Presentation Analysis of Faults
http://slidepdf.com/reader/full/04-presentation-analysis-of-faults 86/94
> Fault Analysis – January 2004 86 86
Total impedance = 37.4Ω IB = a2I1 + aI2
I1 = 132000 = 2037 Amps = a2I1 - aI1
√3 x 37.4 = (a2 - a) I1
I2 = -2037 Amps = (-j) . √3 x 2037= 3529 Amps.
132 kV2000 MVA
ZS1 = ZS2 = 8.7Ω
B - CFAULTZL1 = ZL2 = 10Ω
8.7 10
8.7 10
I1
I2
F1
N1
F2
N2
132000
√3
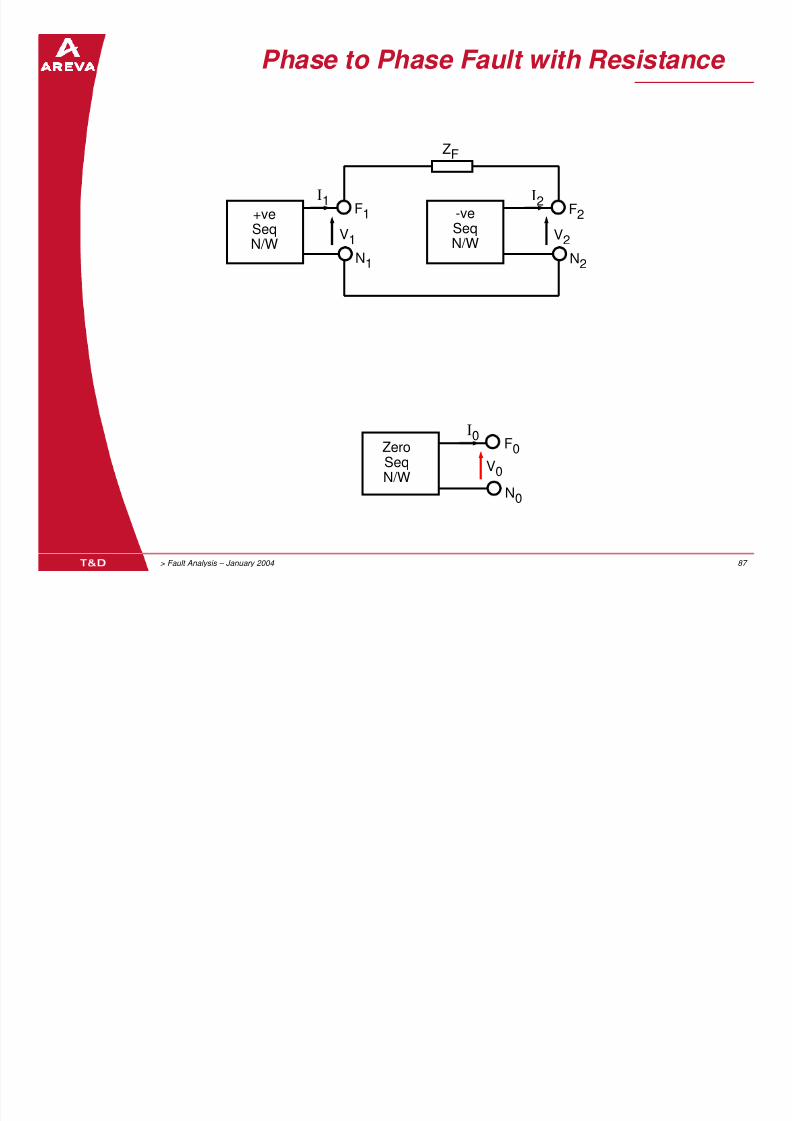
Phase to Phase Fault with Resistance
8/8/2019 04-Presentation Analysis of Faults
http://slidepdf.com/reader/full/04-presentation-analysis-of-faults 87/94
> Fault Analysis – January 2004 87 87
I1F1
N1
V1
+ve
SeqN/W
I2F2
N2
V2
-veSeqN/W
I0
F0
N0
V0ZeroSeqN/W
ZF
Phase to Phase to Earth Fault:- B-C-E

8/8/2019 04-Presentation Analysis of Faults
http://slidepdf.com/reader/full/04-presentation-analysis-of-faults 88/94
> Fault Analysis – January 2004 88 88
I1F1
N1
V1
+veSeqN/W
I2F2
N2
V2
-veSeqN/W
I0F0
N0
V0
ZeroSeqN/W
Phase to Phase to Earth Fault:- B-C-E with Resistance

8/8/2019 04-Presentation Analysis of Faults
http://slidepdf.com/reader/full/04-presentation-analysis-of-faults 89/94
> Fault Analysis – January 2004 89 89
I1F1
N1
V1
+veSeqN/W
I2F2
N2
V2
-veSeqN/W
I0F0
N0
V0
ZeroSeqN/W
3ZF
Maximum Fault Level

8/8/2019 04-Presentation Analysis of Faults
http://slidepdf.com/reader/full/04-presentation-analysis-of-faults 90/94
> Fault Analysis – January 2004 90 90
Can be higher than 3Φ fault level on solidly-
earthed systems
Check that switchgear breaking capacity > maximumfault level for all fault types.
Single Phase Fault Level :
3Ø Versus 1Ø Fault Level (1)

8/8/2019 04-Presentation Analysis of Faults
http://slidepdf.com/reader/full/04-presentation-analysis-of-faults 91/94
> Fault Analysis – January 2004 91 91
XgXT
E
Xg XT
E
Z1
IF
3Ø
1TgF
Z
E
XX
E ≡
+=Ι
3Ø Versus 1Ø Fault Level (2)

8/8/2019 04-Presentation Analysis of Faults
http://slidepdf.com/reader/full/04-presentation-analysis-of-faults 92/94
> Fault Analysis – January 2004 92 92
Z0
IF
1Ø Xg XT
E
Z2 = Z1
Z1
Xg2 XT2
Xg0 XT0
01F Z2Z
3E
+=Ι
3Ø Versus 1Ø Fault Level (3)

8/8/2019 04-Presentation Analysis of Faults
http://slidepdf.com/reader/full/04-presentation-analysis-of-faults 93/94
> Fault Analysis – January 2004 93 93
LEVELFAULTLEVELFAULT
10
01LEVELFAULT
1111LEVELFAULT
3 1
Z ZIF
Z2Z
3E 1
Z2Z
3E
3Z
3E
Z
E 3
∅>∅
<∴
+=∅
+===∅

8/8/2019 04-Presentation Analysis of Faults
http://slidepdf.com/reader/full/04-presentation-analysis-of-faults 94/94


![EE 423 – Power System Analysis - [Section 2 – Power System Faults]](https://static.fdocuments.net/doc/165x107/54659d8db4af9fda3f8b4cb1/ee-423-power-system-analysis-section-2-power-system-faults.jpg)