02501 - ENHANCED MASS TRANSFER AND WALL … · ENHANCED MASS TRANSFER AND WALL SHEAR STRESS IN...
17
ENHANCED MASS TRANSFER AND WALL SHEAR STRESS IN MULTIPHASE SLUG FLOW Hongwei Wang * , Tao Hong, Ji Yong Cai, William Paul Jepson NSF, I/UCRC Corrosion in Multiphase System Center Institute for Corrosion and Multiphase Technology Ohio University 340 ½ West State Street, Athens, OH 45701, USA Christoph Bosch Laboratory for Corrosion Protection Iserlohn University of Applied Sciences Frauenstuhlweg 31, D-58644, Iserlohn, Germany ABSTRACT This paper presents a study of mass transfer and wall shear stress in slug flow in a large diameter horizontal pipeline using the electrochemical limiting current technique. Since the mass transfer in slug flow is very different from that in full pipe flow, the extrapolation of the mass transfer correlation developed in single-phase flow to multiphase flow will cause a large error in the corrosion mechanistic modeling. Hence the new mass transfer correlation was studied in slug flow. The high wall shear stress derived from the measured mass transfer coefficient may explain the mechanical effect of multiphase flow on corrosion product layer and its breakage. INTRODUCTION Internal corrosion of carbon steel pipelines is a common and serious problem in oil and gas production, which are designed for long-time operation. This problem has caused the consideration of many corrosion control programs and research in various oil fields around the world. The internal corrosion in oil and gas production pipelines involves the interaction between metal wall and the flowing fluids. Relative motion between the fluid and metal surface will in general affect ______________________________ * Current address: Dept. of Material Science & Engineering, University of Virginia, Charlottesville, VA 22903, USA 1 1
Transcript of 02501 - ENHANCED MASS TRANSFER AND WALL … · ENHANCED MASS TRANSFER AND WALL SHEAR STRESS IN...
ENHANCED MASS TRANSFER AND WALL SHEAR STRESS IN MULTIPHASE SLUG FLOW
Hongwei Wang*, Tao Hong, Ji Yong Cai, William Paul Jepson NSF, I/UCRC Corrosion in Multiphase System Center
Institute for Corrosion and Multiphase Technology Ohio University
340 ½ West State Street, Athens, OH 45701, USA
Christoph Bosch Laboratory for Corrosion Protection
Iserlohn University of Applied Sciences Frauenstuhlweg 31, D-58644, Iserlohn, Germany
ABSTRACT This paper presents a study of mass transfer and wall shear stress in slug flow in a large diameter horizontal pipeline using the electrochemical limiting current technique. Since the mass transfer in slug flow is very different from that in full pipe flow, the extrapolation of the mass transfer correlation developed in single-phase flow to multiphase flow will cause a large error in the corrosion mechanistic modeling. Hence the new mass transfer correlation was studied in slug flow. The high wall shear stress derived from the measured mass transfer coefficient may explain the mechanical effect of multiphase flow on corrosion product layer and its breakage.
INTRODUCTION
Internal corrosion of carbon steel pipelines is a common and serious problem in oil and gas production, which are designed for long-time operation. This problem has caused the consideration of many corrosion control programs and research in various oil fields around the world.
The internal corrosion in oil and gas production pipelines involves the interaction between metal wall and the flowing fluids. Relative motion between the fluid and metal surface will in general affect
______________________________ * Current address: Dept. of Material Science & Engineering, University of Virginia, Charlottesville, VA 22903, USA
1
1
the corrosion rate. Heitz studied the chemo-mechanical effect of flow on corrosion.1 He suggested that there are a number of mechanisms of conjoint action of flow and corrosion that result in four types of flow-induced corrosion: (1) mass transport-controlled corrosion, (2) phase transport-controlled corrosion, (3) erosion-corrosion, and (4) cavitation corrosion. For the mass transport-controlled corrosion, the corrosion rate is affected by either the transport of corrosive species to the metal surface or the rate of dissolved corrosion products away from the surface. The phase transport-controlled corrosion depends on the wetting of the metal surface by the phase containing corrosive material. The phase distribution is strongly affected by the multiphase flow. Erosion-corrosion occurs when high velocity, high turbulence flow, and/or flow of abrasive materials prevents formation of protective film, allowing fresh material to be continuously exposed to the corrosive environment. Cavitation corrosion occurs in areas with high flow rates and rapid pressure changes. This causes gas bubbles to collapse. The collapsed bubbles exert a high force on the metal surface, which can remove corrosion product layer and an active metal surface is exposed thereafter. From a microscopic view, Schmitt, Bosch, and Mueller proposed that the momentum exchange of near-wall turbulence elements with the wall and subsequent fatigue cracking of corrosion product layers can result in the flow induced localized corrosion in single phase flow and multiphase flow.2
In a corrosion study under water/oil two-phase flow, Kanwar and Jepson3 observed that the two components, shear forces and mass transfer, contribute to the enhancement of corrosion rates. However, these two components have not been distinguished. Selman and Tobias reviewed the mass transfer and shear stress studies between the solid surface and the fluids using the electrochemical limiting current technique.4 This technique can be used to measure the mass transfer and the shear stress in multiphase pipeline, thus to distinguish these two factors. Therefore, this technique can be used to understand the influences of multiphase systems on the corrosion and as well as develop a better corrosion prediction model and control strategy. Wang et al. already applied this technique to study the enhanced instantaneous mass transfer coefficient in water/oil flow5 and the average mass transfer coefficient in multiphase flow.6 Langsholt et al. studied mass transfer coefficient in two-phase stratified flow using a similar technique.7
Slug flow is one of most common flow regimes in oil and gas production. The high turbulence in slug flow causes a high corrosion rate of carbon steel, which was first reported by Green et al. in 1990.8 Jepson showed that the turbulence of slug flow is associated with pulses of gas bubbles reaching the bottom surface of the pipe as shown in Figure 1.9 The gas bubbles trapped in the mixing zone are forced down towards the wall surface, where they are released in the form of pulses of bubbles. Through the visualization of flow, Gopal and Jepson showed that gas bubbles result with a high degree of turbulence, and destroy the hydrodynamic boundary layer within the mixing zone.10 Gopal et al. further found that the averaged wall shear stress in slug flow increases from 80 to 160 Pa when the Froude number of slug flow increases from 3 to 6.11
Several studies in ultrasound sonochemistry have investigated the effect of the collapsing of gas bubbles on the mass transfer to a solid surface. The enhancement in the mass transfer by ultrasound can reach hundred times than general flow without ultrasound.12-18
Wang et al. examined the enhancement effect of gas bubble on mass transfer in the electrochemical cell and the stationary slug flow using the electrochemical limiting current technique.19-20 The present work further investigates the enhanced mass transfer and wall shear stress induced by the bubble events under moving slug flow in a large diameter horizontal pipeline using the electrochemical limiting current technique.
22
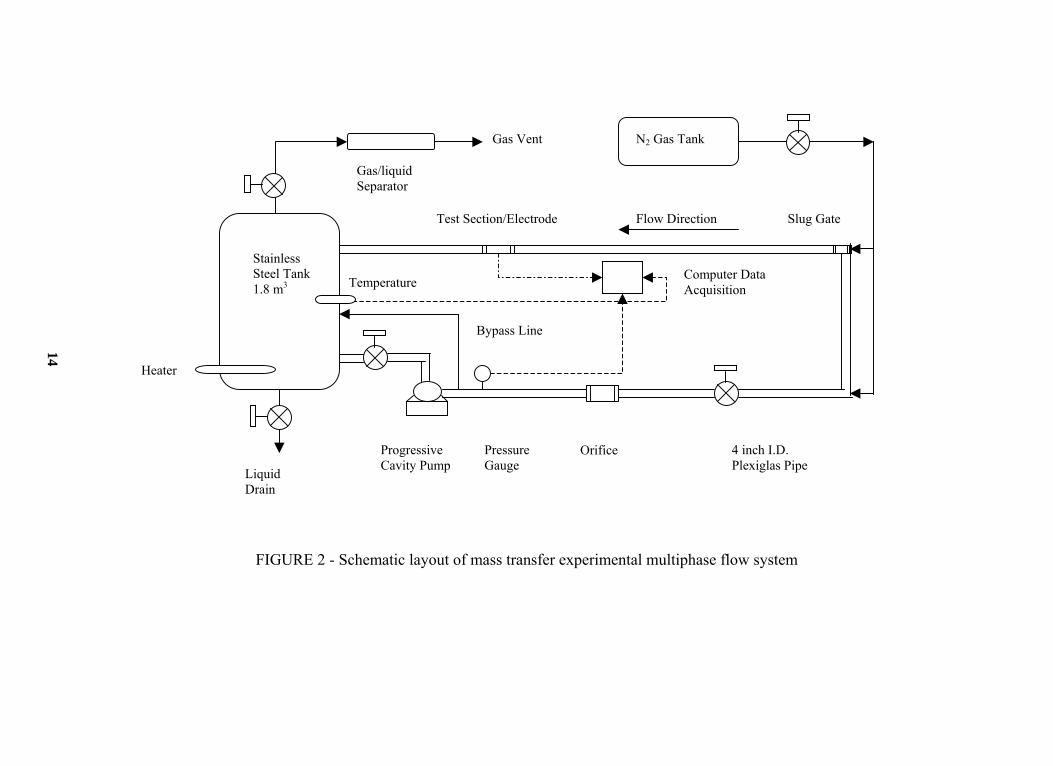
EXPERIMENTAL AND TEST MATRIX Flow loop and test section The experiments were carried out in a 10 cm inner diameter (i.d.) and 15 meter long Plexiglas pipe. The schematic layout of the system is shown in Figure 2. The solution used in the experiments was 0.01 M potassium ferri/ferrocyanide in 1.0 M NaOH electrolyte, stored in a 1m3 stainless steel tank. The solution was pumped through a 10 cm i.d. PVC pipe by a variable speed multiphase pump. The liquid flow rate was measured by means of an orifice plate.
Nitrogen gas, stored in pressurized cylinders, was used for water/gas two-phase flow. Gas flow rate was controlled by a regulator and a valve. Its flow rate was measured using a flow meter. The gas was injected into the system at a T-junction as shown in Figure 2. The liquid and gas were mixed at this junction and the mixture then flowed through a 15 m long pipeline before entering the storage tank. The storage tank also acts as a primary separator for the liquid and gas. The gas was vented from the top and sent to a vertical separator where it was stripped of the entrained liquid before being vented. In horizontal pipes at moderate liquid and gas flow rates the flow regime is slug flow.
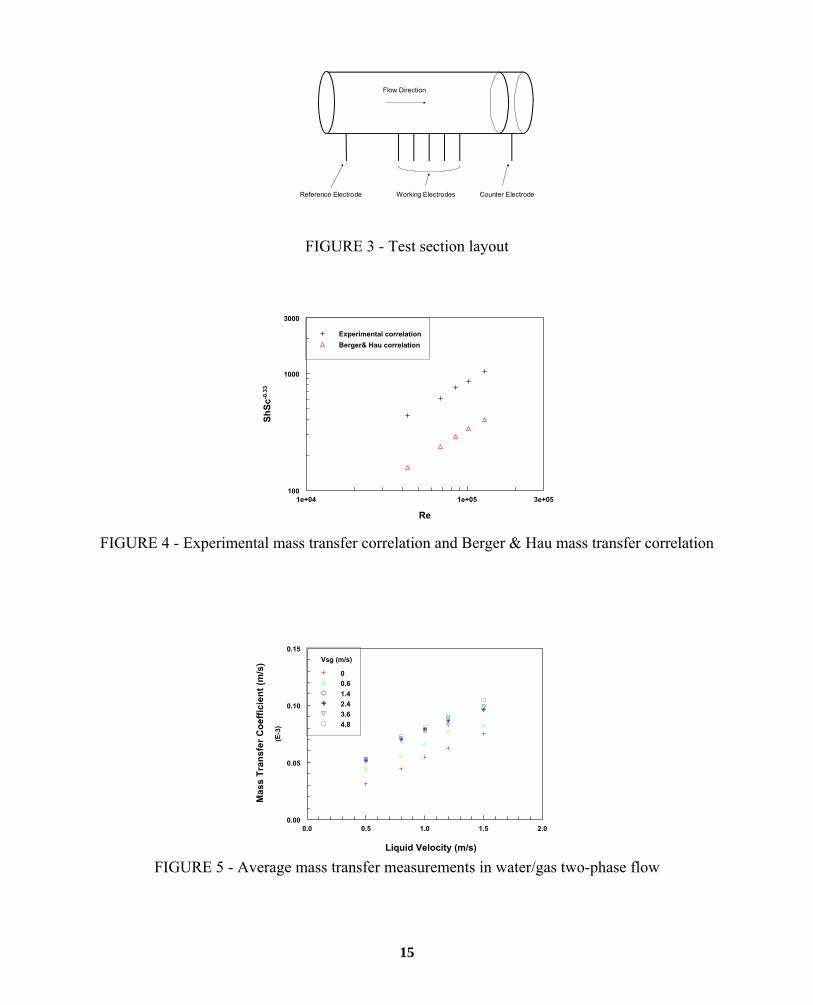
The test section is shown in Figure 3. The reference electrode, five working electrodes, and counter electrode were placed in the direction of the flow respectively. All electrodes were made from Hastelloy C-276. The counter was a ring electrode mounted flush with the pipe wall. The working and reference electrode pins were inserted in the Plexiglas block along a line at the bottom of the pipe wall. The diameter of each pin was 1.5 mm and the distance between the consecutive working electrodes was 4.5 mm. Electrochemical limiting current technique
The electrochemical limiting current technique is used quite frequently for measuring the mass transfer rate and wall shear stress between a fluid and a solid surface. The measured quantity is the electric current produced by the transfer of certain reacting ions to electrodes. Various systems have been suggested, but the most frequently applied in practice is an aqueous solution of the redox couple potassium ferri/ferrocyanide with an added non-reacting electrolyte, usually NaOH.21 The NaOH was added to reduce the ionic migration effects and to increase the conductivity of the solution.
The studied surface is located in working electrodes, where anodic reaction Fe(CN)6
-4 – e = Fe(CN)6-
3 takes place, and the reaction in cathode is Fe(CN)6-3 + e = Fe(CN)6
-4. The limiting current is obtained from measurements of the electric current as a function of the potential applied between the working electrode and reference electrode. The current increases exponentially with increasing potential until it approaches a constant value, i.e. the limiting current. The instantaneous limiting current is obtained from the potentionstatic measurement at a given potential. If the chemical reaction proceeds rapidly, the reaction rate at the cathode is diffusion limited and Cw=0. The mass transfer coefficient can be determined from
K = IL / (n F A Cb) (1) Where: K = mass transfer coefficient (m/s)
33
IL = limiting current (A) n = number of moles reacted F = Faraday’s constant = 96500 (c/mol) A = surface area of the electrode (m2) Cb = the bulk concentration of the potassium Ferrocyanide (mol/m3) Cw = the concentration the potassium ferrocyanide at the wall (mol/m3) Gamry software CMS 105 was used for the potentiodynamic and potentiostatic measurements. All experiments were performed at 20°C. The limiting current density can be obtained through the potentiodynamic and potentiostatic measurements. Correspondingly the average mass transfer coefficient and instantaneous mass transfer coefficient can be calculated by the Eq. (1). Table 1 shows the test matrix for the mass transfer experiments.
RESULTS AND DISCUSSIONS Mass transfer measurements in single-phase full pipe flow
In the flow loop, measurements were made initially in single-phase full pipe flow. The measured limiting currents, IL, in single-phase flow were converted into the mass transfer coefficient, K, via the Equation 1. The results of these measurements in single-phase full pipe flow are shown in Figure 4. A dimensionless mass transfer correlation shown in Equation 2 is developed from these mass transfer coefficients measured by the small circular electrode in Figure 4 and the results are not dependent on the properties of the solution or the species involved.
Sh′ = 0.089 Re0.78 Sc 0.33 (2)
The mass transfer measurement value obtained with the small circular electrode, which corresponds to an incompletely developed mass transfer boundary layer, need to be converted into the actual mass transfer coefficient value, which corresponds to the fully developed mass transfer boundary layer. A mass transfer correlation for single-phase full pipe flow was well established by Berger and Hau:22
Sh = 0.0165 Re0.86 Sc 0.33 (3)
Where: Sh: Sherwood number =
DKd
Re: Reynolds number = µ
ρ eL dV
Sc: Schmidt number =Dυ
K = mass transfer coefficient (m/s) de = effective pipeline diameter (m)
Lρ = density (kg/m3) V = liquid velocity (m/s) µ = dynamic viscosity (cP)
44
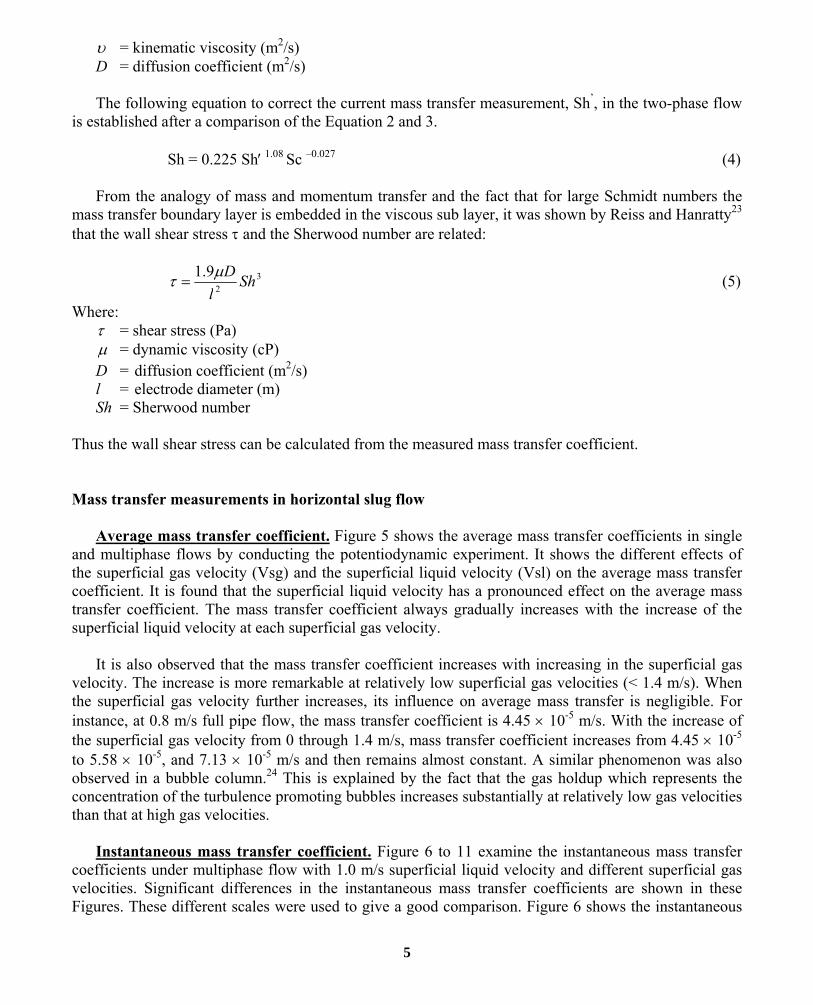
υ = kinematic viscosity (m2/s) D = diffusion coefficient (m2/s)
The following equation to correct the current mass transfer measurement, Sh’, in the two-phase flow is established after a comparison of the Equation 2 and 3.
Sh = 0.225 Sh′ 1.08 Sc –0.027 (4)
From the analogy of mass and momentum transfer and the fact that for large Schmidt numbers the mass transfer boundary layer is embedded in the viscous sub layer, it was shown by Reiss and Hanratty23 that the wall shear stress τ and the Sherwood number are related:
32
9.1 Shl
Dµτ = (5)
Where: τ = shear stress (Pa) µ = dynamic viscosity (cP) D = diffusion coefficient (m2/s) l = electrode diameter (m)
Sh = Sherwood number Thus the wall shear stress can be calculated from the measured mass transfer coefficient. Mass transfer measurements in horizontal slug flow Average mass transfer coefficient. Figure 5 shows the average mass transfer coefficients in single and multiphase flows by conducting the potentiodynamic experiment. It shows the different effects of the superficial gas velocity (Vsg) and the superficial liquid velocity (Vsl) on the average mass transfer coefficient. It is found that the superficial liquid velocity has a pronounced effect on the average mass transfer coefficient. The mass transfer coefficient always gradually increases with the increase of the superficial liquid velocity at each superficial gas velocity.
It is also observed that the mass transfer coefficient increases with increasing in the superficial gas velocity. The increase is more remarkable at relatively low superficial gas velocities (< 1.4 m/s). When the superficial gas velocity further increases, its influence on average mass transfer is negligible. For instance, at 0.8 m/s full pipe flow, the mass transfer coefficient is 4.45 × 10⁻⁵ m/s. With the increase of the superficial gas velocity from 0 through 1.4 m/s, mass transfer coefficient increases from 4.45 × 10⁻⁵ to 5.58 × 10⁻⁵, and 7.13 × 10⁻⁵ m/s and then remains almost constant. A similar phenomenon was also observed in a bubble column.24 This is explained by the fact that the gas holdup which represents the concentration of the turbulence promoting bubbles increases substantially at relatively low gas velocities than that at high gas velocities.
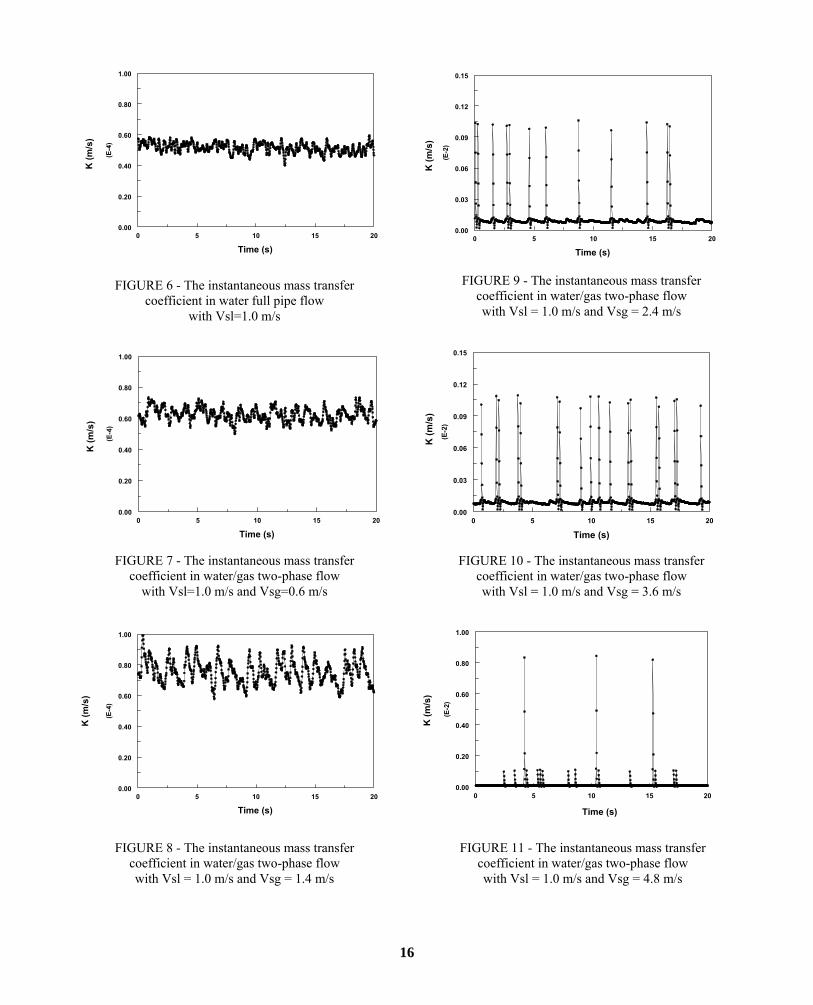
Instantaneous mass transfer coefficient. Figure 6 to 11 examine the instantaneous mass transfer coefficients under multiphase flow with 1.0 m/s superficial liquid velocity and different superficial gas velocities. Significant differences in the instantaneous mass transfer coefficients are shown in these Figures. These different scales were used to give a good comparison. Figure 6 shows the instantaneous
55
mass transfer coefficient in full pipe flow. The fluctuations reflect just the nature of the turbulence and the mass transfer coefficient is almost constant at about 5.44 × 10⁻⁵ m/s. When the superficial gas velocity increases to 0.6 m/s (Figure 7), the fluctuations are enhanced due to the formation of slow moving lumps of liquid or plugs. The instantaneous mass transfer coefficient increases to about 6.36 × 10⁻⁵ m/s with fluctuations between 5.0 × 10⁻⁵ and 7.3 × 10⁻⁵ m/s. The fluctuation of the instantaneous mass transfer coefficient further increases with a superficial gas velocity of 1.4 m/s (Figure 8). Much higher peaks now appear and the plug flow can be divided into two zones, the plug itself and the film between plugs.
When the superficial gas velocity increases to 2.4 and 3.6 m/s, slug flow appears and large amplitude peaks appear in Figure 9 and 10. This is due to the formation of the mixing zone, which produces high-energy bubbles collapsing on the bottom of the pipe as shown in Figure 1. The magnitude of the mass transfer coefficient peaks is much higher than plug flow. The instantaneous value in the slug is about 1.08 × 10⁻³ m/s which is about 10 times higher than that in the film region. There are more peaks in Figure 10 than Figure 9, which indicates that a superficial gas velocity of 3.6 m/s can produce more bubble impacts.
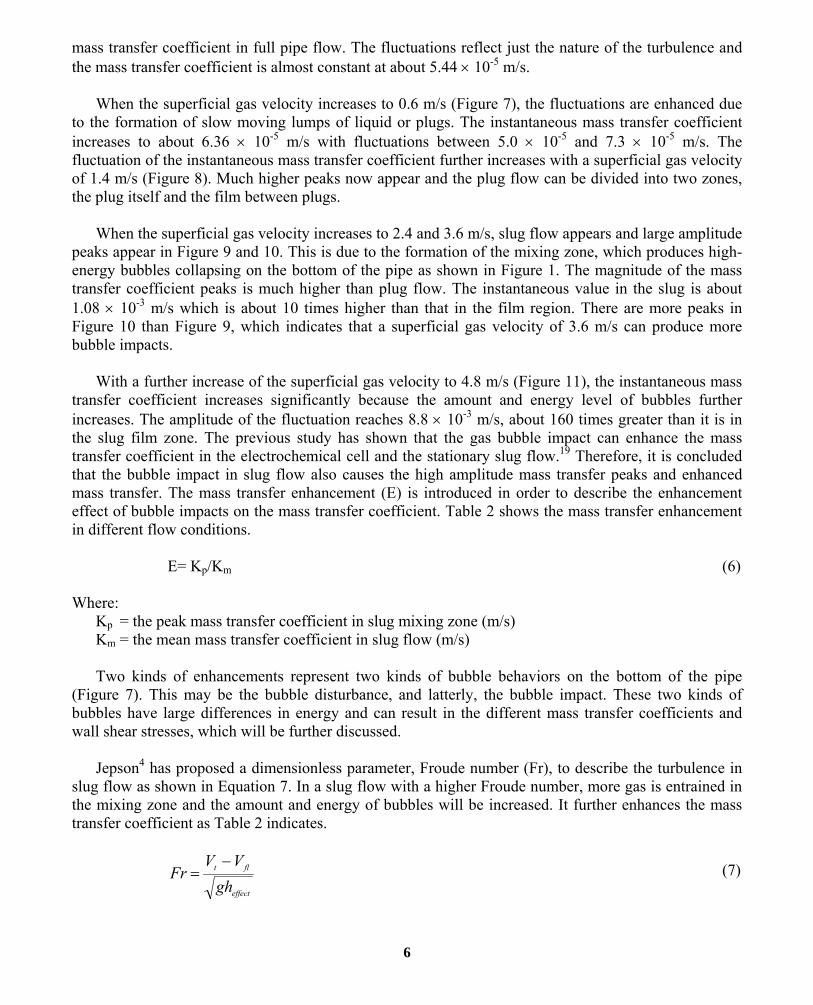
With a further increase of the superficial gas velocity to 4.8 m/s (Figure 11), the instantaneous mass transfer coefficient increases significantly because the amount and energy level of bubbles further increases. The amplitude of the fluctuation reaches 8.8 × 10⁻³ m/s, about 160 times greater than it is in the slug film zone. The previous study has shown that the gas bubble impact can enhance the mass transfer coefficient in the electrochemical cell and the stationary slug flow.19 Therefore, it is concluded that the bubble impact in slug flow also causes the high amplitude mass transfer peaks and enhanced mass transfer. The mass transfer enhancement (E) is introduced in order to describe the enhancement effect of bubble impacts on the mass transfer coefficient. Table 2 shows the mass transfer enhancement in different flow conditions.
E= Kp/Km (6)
Where: Kp = the peak mass transfer coefficient in slug mixing zone (m/s) Km = the mean mass transfer coefficient in slug flow (m/s) Two kinds of enhancements represent two kinds of bubble behaviors on the bottom of the pipe (Figure 7). This may be the bubble disturbance, and latterly, the bubble impact. These two kinds of bubbles have large differences in energy and can result in the different mass transfer coefficients and wall shear stresses, which will be further discussed.
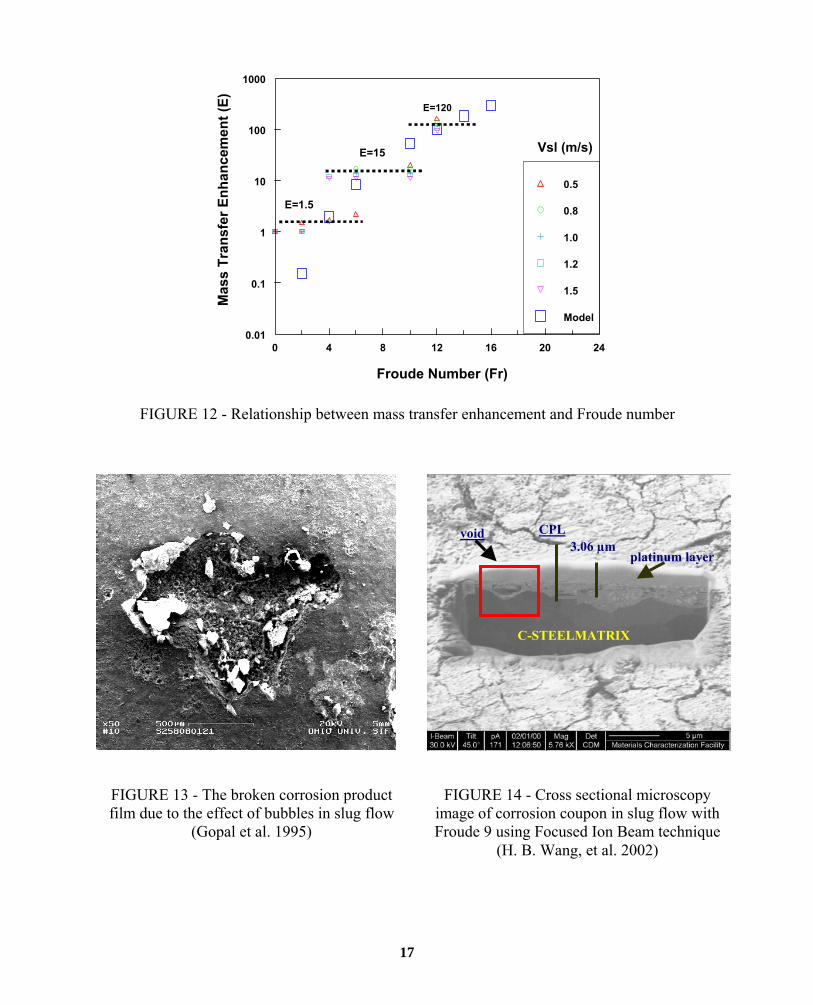
Jepson4 has proposed a dimensionless parameter, Froude number (Fr), to describe the turbulence in slug flow as shown in Equation 7. In a slug flow with a higher Froude number, more gas is entrained in the mixing zone and the amount and energy of bubbles will be increased. It further enhances the mass transfer coefficient as Table 2 indicates.
effect
flt
ghVV
Fr−
= (7)
66
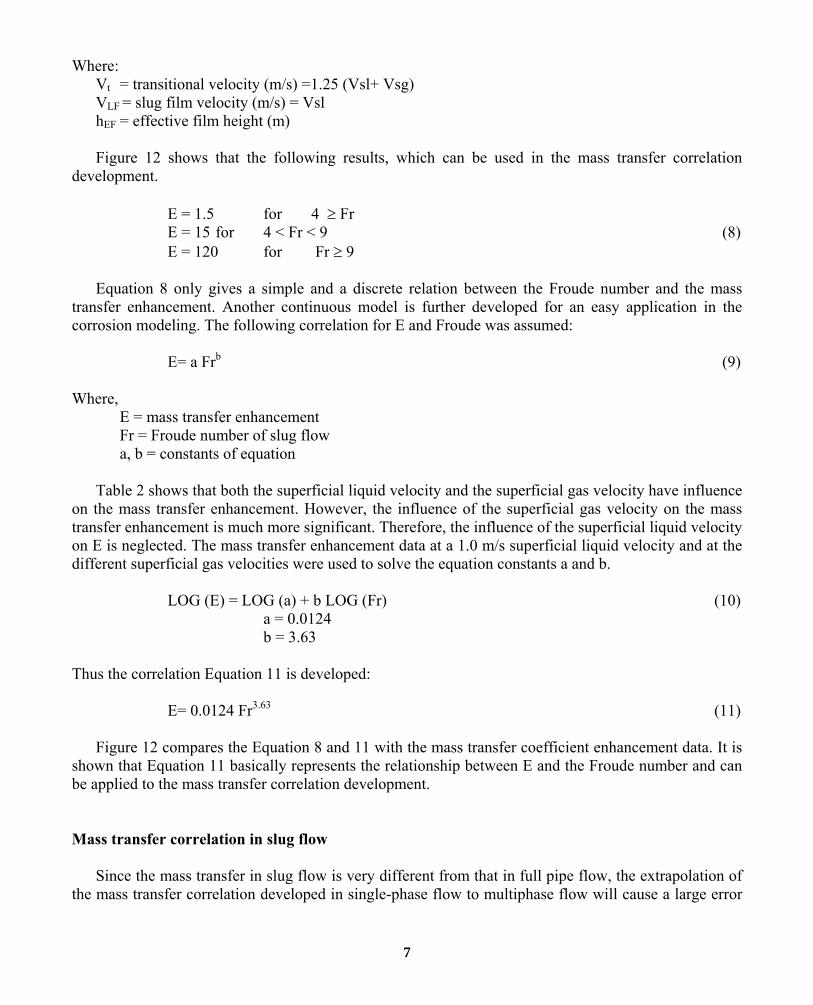
Where: Vt = transitional velocity (m/s) =1.25 (Vsl+ Vsg) VLF = slug film velocity (m/s) = Vsl hEF = effective film height (m) Figure 12 shows that the following results, which can be used in the mass transfer correlation development.
E = 1.5 for 4 ≥ Fr E = 15 for 4 < Fr < 9 (8) E = 120 for Fr ≥ 9
Equation 8 only gives a simple and a discrete relation between the Froude number and the mass transfer enhancement. Another continuous model is further developed for an easy application in the corrosion modeling. The following correlation for E and Froude was assumed:
E= a Frb (9)
Where,
E = mass transfer enhancement Fr = Froude number of slug flow a, b = constants of equation
Table 2 shows that both the superficial liquid velocity and the superficial gas velocity have influence on the mass transfer enhancement. However, the influence of the superficial gas velocity on the mass transfer enhancement is much more significant. Therefore, the influence of the superficial liquid velocity on E is neglected. The mass transfer enhancement data at a 1.0 m/s superficial liquid velocity and at the different superficial gas velocities were used to solve the equation constants a and b.
LOG (E) = LOG (a) + b LOG (Fr) (10)
a = 0.0124 b = 3.63
Thus the correlation Equation 11 is developed:
E= 0.0124 Fr3.63 (11)
Figure 12 compares the Equation 8 and 11 with the mass transfer coefficient enhancement data. It is shown that Equation 11 basically represents the relationship between E and the Froude number and can be applied to the mass transfer correlation development. Mass transfer correlation in slug flow Since the mass transfer in slug flow is very different from that in full pipe flow, the extrapolation of the mass transfer correlation developed in single-phase flow to multiphase flow will cause a large error
77
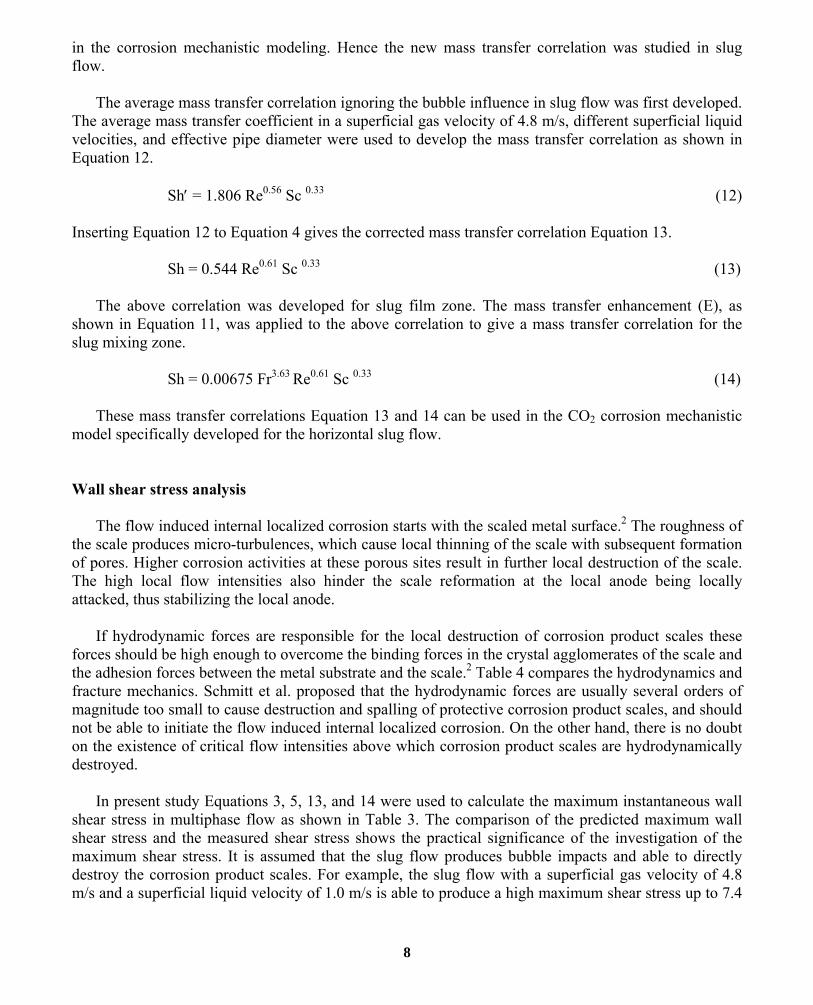
in the corrosion mechanistic modeling. Hence the new mass transfer correlation was studied in slug flow. The average mass transfer correlation ignoring the bubble influence in slug flow was first developed. The average mass transfer coefficient in a superficial gas velocity of 4.8 m/s, different superficial liquid velocities, and effective pipe diameter were used to develop the mass transfer correlation as shown in Equation 12.
Sh′ = 1.806 Re0.56 Sc 0.33 (12)
Inserting Equation 12 to Equation 4 gives the corrected mass transfer correlation Equation 13.
Sh = 0.544 Re0.61 Sc 0.33 (13)
The above correlation was developed for slug film zone. The mass transfer enhancement (E), as shown in Equation 11, was applied to the above correlation to give a mass transfer correlation for the slug mixing zone.
Sh = 0.00675 Fr3.63 Re0.61 Sc 0.33 (14)
These mass transfer correlations Equation 13 and 14 can be used in the CO2 corrosion mechanistic model specifically developed for the horizontal slug flow. Wall shear stress analysis The flow induced internal localized corrosion starts with the scaled metal surface.2 The roughness of the scale produces micro-turbulences, which cause local thinning of the scale with subsequent formation of pores. Higher corrosion activities at these porous sites result in further local destruction of the scale. The high local flow intensities also hinder the scale reformation at the local anode being locally attacked, thus stabilizing the local anode.
If hydrodynamic forces are responsible for the local destruction of corrosion product scales these forces should be high enough to overcome the binding forces in the crystal agglomerates of the scale and the adhesion forces between the metal substrate and the scale.2 Table 4 compares the hydrodynamics and fracture mechanics. Schmitt et al. proposed that the hydrodynamic forces are usually several orders of magnitude too small to cause destruction and spalling of protective corrosion product scales, and should not be able to initiate the flow induced internal localized corrosion. On the other hand, there is no doubt on the existence of critical flow intensities above which corrosion product scales are hydrodynamically destroyed.
In present study Equations 3, 5, 13, and 14 were used to calculate the maximum instantaneous wall shear stress in multiphase flow as shown in Table 3. The comparison of the predicted maximum wall shear stress and the measured shear stress shows the practical significance of the investigation of the maximum shear stress. It is assumed that the slug flow produces bubble impacts and able to directly destroy the corrosion product scales. For example, the slug flow with a superficial gas velocity of 4.8 m/s and a superficial liquid velocity of 1.0 m/s is able to produce a high maximum shear stress up to 7.4
88
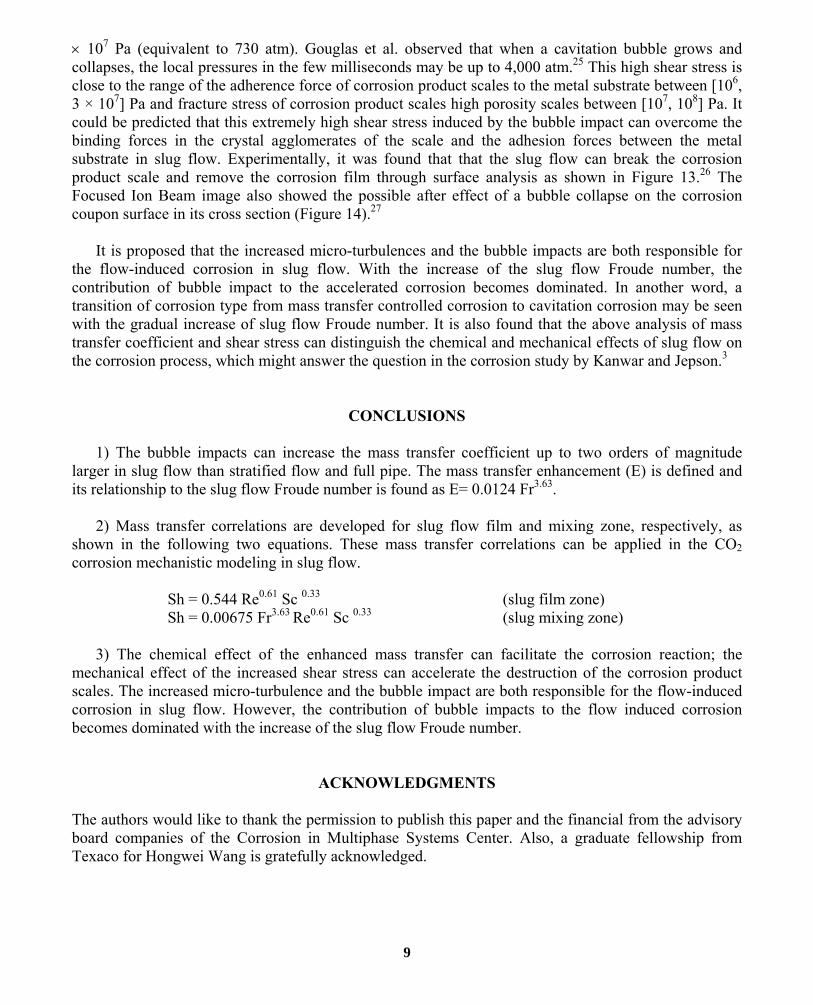
× 107 Pa (equivalent to 730 atm). Gouglas et al. observed that when a cavitation bubble grows and collapses, the local pressures in the few milliseconds may be up to 4,000 atm.25 This high shear stress is close to the range of the adherence force of corrosion product scales to the metal substrate between [106, 3 × 10⁷] Pa and fracture stress of corrosion product scales high porosity scales between [107, 108] Pa. It could be predicted that this extremely high shear stress induced by the bubble impact can overcome the binding forces in the crystal agglomerates of the scale and the adhesion forces between the metal substrate in slug flow. Experimentally, it was found that that the slug flow can break the corrosion product scale and remove the corrosion film through surface analysis as shown in Figure 13.26 The Focused Ion Beam image also showed the possible after effect of a bubble collapse on the corrosion coupon surface in its cross section (Figure 14).27
It is proposed that the increased micro-turbulences and the bubble impacts are both responsible for the flow-induced corrosion in slug flow. With the increase of the slug flow Froude number, the contribution of bubble impact to the accelerated corrosion becomes dominated. In another word, a transition of corrosion type from mass transfer controlled corrosion to cavitation corrosion may be seen with the gradual increase of slug flow Froude number. It is also found that the above analysis of mass transfer coefficient and shear stress can distinguish the chemical and mechanical effects of slug flow on the corrosion process, which might answer the question in the corrosion study by Kanwar and Jepson.3
CONCLUSIONS 1) The bubble impacts can increase the mass transfer coefficient up to two orders of magnitude larger in slug flow than stratified flow and full pipe. The mass transfer enhancement (E) is defined and its relationship to the slug flow Froude number is found as E= 0.0124 Fr3.63. 2) Mass transfer correlations are developed for slug flow film and mixing zone, respectively, as shown in the following two equations. These mass transfer correlations can be applied in the CO2 corrosion mechanistic modeling in slug flow.
Sh = 0.544 Re0.61 Sc 0.33 (slug film zone) Sh = 0.00675 Fr3.63 Re0.61 Sc 0.33 (slug mixing zone)
3) The chemical effect of the enhanced mass transfer can facilitate the corrosion reaction; the mechanical effect of the increased shear stress can accelerate the destruction of the corrosion product scales. The increased micro-turbulence and the bubble impact are both responsible for the flow-induced corrosion in slug flow. However, the contribution of bubble impacts to the flow induced corrosion becomes dominated with the increase of the slug flow Froude number.
ACKNOWLEDGMENTS The authors would like to thank the permission to publish this paper and the financial from the advisory board companies of the Corrosion in Multiphase Systems Center. Also, a graduate fellowship from Texaco for Hongwei Wang is gratefully acknowledged.
99
REFERENCES
1. E. Heitz, Corrosion, “Chemo-Mechanical Effects of Flow on Corrosion,” 47, 135 (1991).
2. G. Schmitt, C. Bosch, and M. Mueller, “Modeling the Probability of Flow Induced Localized Corrosion From Critical Hydrodynamic Data and Fracture Mechanics Data of Scales from CO2 Corrosion of Steel,” Advances in Corrosion Control and Materials in Oil and Gas Production, European Federation of Corrosion Publication, The Institute of Materials, London, (1999).
3. S. Kanwar and W. P. Jepson, “A Model to Predict Sweet Corrosion of Multiphase Flow in Horizontal Pipelines,” Corrosion/94, Paper No. 94024, (Houston, TX: NACE International, 1994).
4. J. R. Selman, and C. W. Tobias, “Mass-Transfer Measurements by the Limiting –Current Technique,” in Advances in Chemical Engineering, Academic Press, 11, (1978).
5. H. Wang, T. Hong, J. Y. Cai, H. D. Dewald, and W. P. Jepson, “Enhancement of the Instantaneous Mass Transfer Coefficient in Large Diameter Pipeline under Water/Oil Flow,” J. Electrochem. Soc., 147, 2552 (2000)
6. H. Wang, D. Vedapuri, J. Y. Cai, T. Hong, and W. P. Jepson, “Mass Transfer Coefficient Measurement in Water/Oil Multiphase Flow,” J. Energy Resour. Technol., 23, 144 (2001).
7. M. Langsholt, M. Nordsveen, K. Lunde, S. Nesic, and J. Enerhaug, “Wall Shear Stress and Mass Transfer Rates – Important Parameters in CO2 Corrosion,” Proc. BHR Group, Multiphase (1997).
8. A. S. Green, B. V. Johnson, and H. Choi, “Flow-related Corrosion in Large-Diameter Multiphase Flow Line,” SPE, 20685, 677 (1990).
9. W. P. Jepson, “The Flow Characteristics in Horizontal Slug Flow,” Proc. The 3rd International Conference on Multiphase Flow, The Hauge, Netherlands (1987).
10. M. Gopal, and W. P. Jepson, “The Study of Dynamic Slug Flow Characteristics Using Digital Image Analysis,” J. Energy Resources Tech., 120, 87 (1998).
11. M. Gopal, A. Kaul, and W. P. Jepson, “ Mechanisms Contributing to Enhanced Corrosion in Three Phase Slug Flow in Horizontal Pipes,” Corrosion/1995, Paper No. 95105, (Houston, TX: NACE International, 1995).
12. P. R. Birkin, S. Silva-Martinez, “The Effect of Ultrasound on Mass Transfer to a Microelectrode,” J. Chem. Soc. Chem. Commun., 1807 (1995).
13. P. R. Birkin, S. Silva-Martinez, “A Study of the Effect of Ultrasound on Mass Transfer to a Microelectrode,” J. Electroanal. Chem. 416, 127 (1996).
14. P.R. Birkin, S. Silva-Martinez, “A Study on the Effect of Ultrasound on Electrochemical Phenomena,” Ultrasonic Sonochemistry, 4, 121 (1997).
15. A. Ben Youssef, U. Haebel, P. Javet, “Local Enhancement of Liquid-to-Wall Mass Transfer by a Single Gas Bubble,” J. Applied electrochemistry, 24, 658 (1994).
16. A. Shah, and J. Jorne, “Mass Transfer under Bubble-Induced Convection in a Vertical Electrochemical Cell,” J. Electrochem. Soc., 136, 144 (1989).
17. A. Shah, and J. Jorne, “Mass Transfer under Combined Gas Evolution and Forced Convection,” J. Electrochem. Soc., 136, 153 (1989).
1010
18. G. M. Whitey, and C. W. Tobias, “Mass Transfer Effects of Bubbles Streams Rising Near Vertical Electrodes,” AIChE J., 34, 1981 (1988).
19. H. Wang, J.Y. Cai, T. Hong, M. Gopal, W. P. Jepson, and H. D. Dewald, “Effect of Bubbles on Mass Transfer in Multiphase Flow,” Corrosion/2000, Paper No. 50 (Houston, TX: NACE International, 2000).
20. H. Wang, “CO2 Corrosion Mechanistic Modeling in Horizontal Slug Flow,” Ph.D. Dissertation, Ohio University, 2002
21. F. P. Berger, and A. Ziai, “Optimization of Experimental Conditions for Electrochemical Mass Transfer Measurements,” Chem. Eng. Res. & Des., 61, 377 (1983).
22. F. P. Berger, and K. -F.F.-L. Hau, “Mass Transfer in Turbulent Pipe Flow Measured by Electrochemical Method,” Int. J. Heat Mass Transfer, 20, 1185 (1977).
23. L. P. Reiss, and T. Z. Hanratty, “An Experimental Study of the Unsteady Nature of the Viscous Sublayer,” AIChE J., 8, 154 (1963).
24. M. M. Zaki, I. Nirdosh, G. H. Sedahmed, “Forced Convection Mass Transfer Inside Large Hemispherical Cavities under Laminar Flow Conditions,” Can. J Chem. Eng. 75, 333 (1997).
25. J. F. Gouglas, J. M. Gasiorek, and J. A. Swaffield, Fluid Mechanics, Pitman Publishing Limited, (1979).
26. M. Gopal, and S. Rajappa, “Corrosion Product Layer in Slug Flow,” Corrosion/1999, Paper No. 46, (Houston, TX: NACE International, 1999)
27. H. B. Wang, W. P. Jepson, “Why Corrosion Inhibitors do not Perform Well in Some Multiphase Conditions: A Mechanistic Study,” Corrosion/2002, Paper No. 02276, (Houston, TX: NACE International, 2002)
1111

TABLE 1. EXPERIMENTAL TEST MATRIX
Superficial liquid velocity (Vsl) (m/s) 0.2 0.5 0.8 1.0 1.2 1.5
Superficial gas velocity (Vsg) (m/s) 0 0.6 1.4 2.4 3.6 4.8
Gas Nitrogen
Liquid 0.01 M potassium ferri/ferrocyanide, 1.0 N sodium hydroxide
2.0 Volume of liquid (l) 800
Temperature (°C) 20
TABLE 2. MASS TRANSFER ENHANCEMENT IN WATER/GAS TWO-PHASE FLOW
Vsg (m/s) E 0 0.6 1.4 2.4 3.0 3.6 4.8
0.5 1 1.5 1.7 2.2 2.2
20 164
0.8 1 1.5 1.6 17 17
17 135
1.0 1 1.5 2 14 14, 112
14, 120
14, 120
1.2 1 1.5 12 13 13, 104
13, 104
13, 104
Vsl (m/s)
1.5 1 1.5 11 11, 92
11, 92
11, 92
11, 92
Froude number (Vsl=1.0)
0 2 4 6 8 9 12
1212
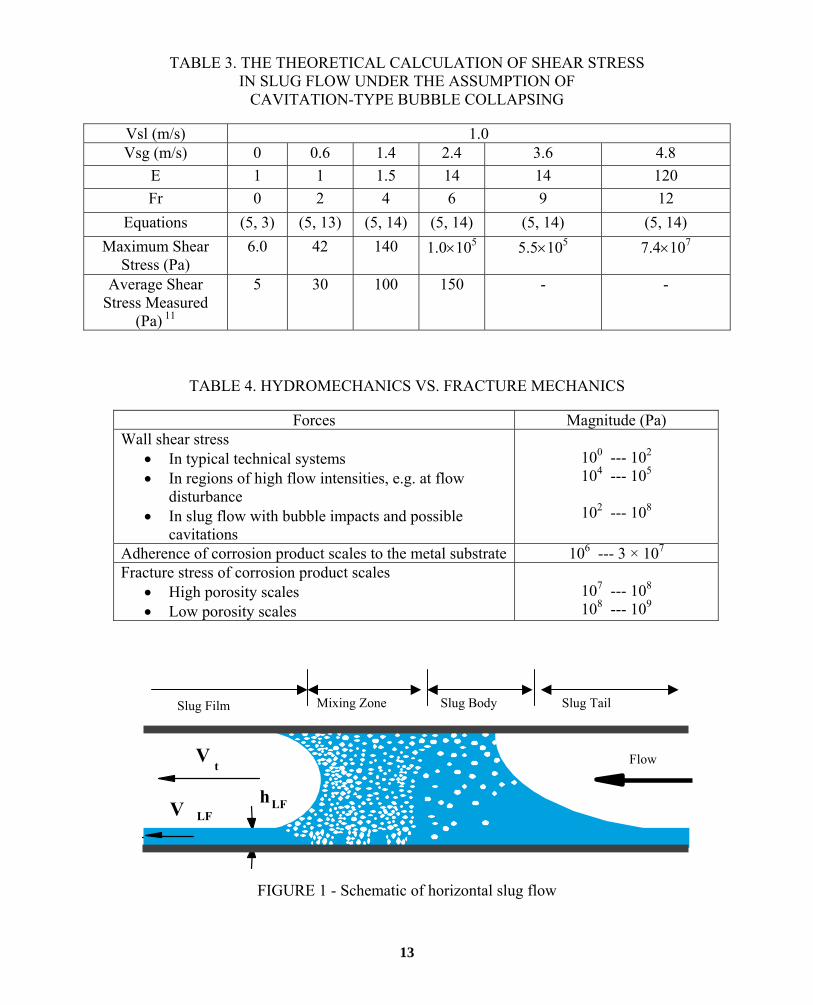
TABLE 3. THE THEORETICAL CALCULATION OF SHEAR STRESS
IN SLUG FLOW UNDER THE ASSUMPTION OF CAVITATION-TYPE BUBBLE COLLAPSING
Vsl (m/s) 1.0 Vsg (m/s) 0 0.6 1.4 2.4 3.6 4.8
E 1 1 1.5 14 14 120 Fr 0 2 4 6 9 12
Equations (5, 3) (5, 13) (5, 14) (5, 14) (5, 14) (5, 14) Maximum Shear
Stress (Pa) 6.0 42 140 1.0×10⁵ 5.5×10⁵ 7.4×10⁷
Average Shear Stress Measured
(Pa) 11
5 30 100 150 - -
TABLE 4. HYDROMECHANICS VS. FRACTURE MECHANICS
Forces Magnitude (Pa)
Wall shear stress • In typical technical systems • In regions of high flow intensities, e.g. at flow
disturbance • In slug flow with bubble impacts and possible
cavitations
100 --- 102 104 --- 105
102 --- 108
Adherence of corrosion product scales to the metal substrate 106 --- 3 × 10⁷ Fracture stress of corrosion product scales
• High porosity scales • Low porosity scales
107 --- 108 108 --- 109
FlowV t
Slug Body Slug Film Mixing Zone Slug Tail
h LF V LF
FIGURE 1 - Schematic of horizontal slug flow
1313
Flow Direction
Bypass Line
Temperature Computer Data Acquisition
Stainless Steel Tank 1.8 m3
4 inch I.D. Plexiglas Pipe
Gas/liquid Separator
Gas Vent
Slug Gate
N2 Gas Tank
Test Section/Electrode
Orifice Pressure Gauge
Progressive Cavity Pump Liquid
Drain
14 Heater
FIGURE 2 - Schematic layout of mass transfer experimental multiphase flow system
14
14
Working Electrodes Counter Electrode
Flow Direction
Reference Electrode
FIGURE 3 - Test section layout
1e+04 1e+05 3e+05
Re
100
1000
3000
ShSc
-0.3
3
Experimental correlationBerger& Hau correlation
FIGURE 4 - Experimental mass transfer correlation and Berger & Hau mass transfer correlation
0.0 0.5 1.0 1.5 2.0
Liquid Velocity (m/s)
0.00
0.05
0.10
0.15
(E-3
)
Mas
s Tr
ansf
er C
oeffi
cien
t (m
/s)
00.61.42.43.64.8
Vsg (m/s)
FIGURE 5 - Average mass transfer measurements in water/gas two-phase flow
1515
0 5 10 15 20
Time (s)
0.00
0.20
0.40
0.60
0.80
1.00
(E-4
)
K (m
/s)
0 5 10 15 20
Time (s)
0.00
0.20
0.40
0.60
0.80
1.00
(E-4
)
K (m
/s)
FIGURE 7 - The instantaneous mass transfer coefficient in water/gas two-phase flow
with Vsl=1.0 m/s and Vsg=0.6 m/s
0 5 10 15 20
Time (s)
0.00
0.20
0.40
0.60
0.80
1.00
(E-4
)
K (m
/s)
FIGURE 6 - The instantaneous mass transfer coefficient in water full pipe flow
with Vsl=1.0 m/s
0 5 10 15 20
Time (s)
0.00
0.03
0.06
0.09
0.12
0.15
(E-2
)
K (m
/s)
FIGURE 9 - The instantaneous mass transfer coefficient in water/gas two-phase flow with Vsl = 1.0 m/s and Vsg = 2.4 m/s
0 5 10 15 20
Time (s)
0.00
0.03
0.06
0.09
0.12
0.15
(E-2
)
K (m
/s)
FIGURE 10 - The instantaneous mass transfer coefficient in water/gas two-phase flow with Vsl = 1.0 m/s and Vsg = 3.6 m/s
0 5 10 15 20
Time (s)
0.00
0.20
0.40
0.60
0.80
1.00
(E-2
)
K (m
/s)
FIGURE 11 - The instantaneous mass transfer coefficient in water/gas two-phase flow with Vsl = 1.0 m/s and Vsg = 4.8 m/s
FIGURE 8 - The instantaneous mass transfer
coefficient in water/gas two-phase flow with Vsl = 1.0 m/s and Vsg = 1.4 m/s
1616
0 4 8 12 16 20 24
Froude Number (Fr)
0.01
0.1
1
10
100
1000
Mas
s Tr
ansf
er E
nhan
cem
ent (
E)
0.5
0.8
1.0
1.2
1.5
Model
E=1.5
E=120
E=15 Vsl (m/s)
FIGURE 12 - Relationship between mass transfer enhancement and Froude number
void CPL
3.06 µm
C-STEELMATRIX
platinum layer
FIGURE 13 - The broken corrosion product film due to the effect of bubbles in slug flow
(Gopal et al. 1995)
FIGURE 14 - Cross sectional microscopy image of corrosion coupon in slug flow with Froude 9 using Focused Ion Beam technique
(H. B. Wang, et al. 2002)
1717