01Part II Cover - JICA
379
PART II COUNTRY REPORTS
Transcript of 01Part II Cover - JICA

PART II
COUNTRY REPORTS

COUNTRY REPORT
Summaries of the Country Reports
ASEAN Countries
Brunei DarussalamCambodiaIndonesia
LaosMalaysiaMyanmar
PhilippinesSingaporeThailandVietnam
+3 Countries
ChinaJapanKorea

1
Summary of Country Report: Brunei Darussalam
1. ProductionA limited quantity of rice (about 200 tons or about 0.6% of total consumption) is produced by smallfarmers in the interior region. The output is usually kept for their own consumption. Manyschemes were attempted in the past, to increase domestic rice production, including the importation offarmer to cultivate rice in Brunei D. and investing in the production of rice in other countries. Thesealternatives had proved to be less efficient than import.
2. ImportsAlmost all the rice consumed in Brunei Darussalam is imported. Most of rice imported is the highquality fragrant rice from Thailand. However, there are some diversification from this traditionalsource.
The import of rice is conducted through the Government-to-Government (G-to-G) arrangement,especially, with Thailand. Other sources of supply include Singapore and Vietnam. The import iscontrolled and managed by the State Store under the Department of Information Technology and StateStore, Ministry of Finance.
3. ConsumptionBrunei Darussalam has 350,000 population and most of the people are in the urban. The per capitaincome is about US$ 24,000 in the year 2000. The per capita consumption of rice is about 94.8 kg in1998 and 108.6 kg in 1999. The total consumption of rice is about 36,000 tons in the year.
4. Reserve PoliciesThe import of rice is controlled and regulated by the State Store. The State Store will determine thequantity and schedule of rice to be delivered by the exporters. At the same time, the quantity releaseof rice in the market is regulated through the release from the State Store stock. The State Store has atarget of 3 months supply of rice in stock + reserve. There are some fluctuations in the stock levelbut it will fall below this target level. In the case of emergency, the State Store can readily mobilise thereserve from its stock to a specific location.
Rice balance (Unit: 1,000 tons)Supply Demand
Year BeginningStock Production Import Total Local
Consumption Export EndingStock Total
1997/1998 12.6 0.3 33.0 45.9 33.2 - 12.7 45.91998/1999 12.7 0.1 32.0 44.8 30.9 - 13.9 44.81999/2000 19.6 0.2 34.2 54.0 35.9 - 18.0 54.0
Source : Department of Agriculture, Brunei Darussalam

2
Summary of Country Report: Cambodia
1. ProductionThe nation level self-sufficiency in rice has been achieved since 1995/96. However, rice productionsystem is vulnerable to the changes of climate conditions and to the insect/disease, due to obsoletecultivation technology and poor agricultural infrastructure. The destroyed ratios of rainy season ricefrom 1995 to 2000 were 9%, 15%, 8%, 7%, 4% in order. Paddy area in 1999/2000 is 1.9 million ha.It has not yet recovered to the level (2.5 million ha) in the 1960s.
2. Imports and Food aidThrough the informal border trades, local markets are integrated with Thailand or Vietnam.Consequently, fragrant broken rice constantly flows into the country from Thailand according to thepreference of city consumers. On the other hand, there is a chance of rice inflows from Vietnamdepending on rice prices in the Mekong Delta in Vietnam, i.e. situation of Vietnam’s rice export.Japan provided the in-kind support to WFP activities in Cambodia and it accounted for about 50% ofthe distributed volume of rice in 1998 and 1999.
3. ConsumptionAlthough there has been an overall rice surplus, 20 % of rural population were under the food povertyline (1997). Per capita rice consumption has been set at 151.2 kg as a result of the FAO/WFPmission since 1996.
4. ExportsAnnual rice export was 3,000 tons to 16,000 tons from 1999 to 2001 and Singapore was a majordestination accounting for 57% of total volume based on the data of Ministry of Commerce. Largevolume of paddy is exported though informal border trades to Vietnam and Thailand every year. TheCambodia government permitted the export without an export license for both of milled rice andpaddy in July 2001.
5. Reserve PoliciesExcept for ASEAN Food Security Reserve (AFSR), there is no measure accompanied by clearnumerical target as a national reserve. About the half of the obligate amount in AFSR is reserved bythe government through GTC, another half is done by commercial rice millers.
Rice balance (Unit: 1,000 tons)
Available volumePaddyProduction
Seed &Feed Loss
Paddy Milled riceDemand
(milled rice)Annual balance
(milled rice)1996/97 3,458 242 346 2,870 1,779 1,618 1621997/98 3,415 239 341 2,834 1,757 1,653 1041998/99 3,510 246 351 2,913 1,806 1,776 301999/00 4,041 283 404 3,354 2,079 1,819 2612000/01 4,026 282 403 3,342 2,072 1,981 91Source : Agricultural Statistic, MAFF

3
Summary of Country Report: Indonesia
1. ProductionFrom 1984 to 1998, rice production rose by just 1.7% annually, barely sufficient to keep pace withpopulation growth. However, promotion of production (subsidy for fertilizer etc.) is decreasingexcept irrigation project, this condition lead to constipation of production increasing. Reducingsubsidy is protecting farmers from feeble ability of farmers’ production depending upon subsidy freak.Import of rice with low price defect grower’s price and informal import of rice decrease farmer’smotivation for producing. Under control of the government, the banks of private sector haveachieved a new credit system for farmers since December 2001.
2. Import and Food aidLow-grade rice and high-grade rice should be imported continuously through the government policy.Bulog’s main activity changed to the distribution of supporting rice to the poverty through thegovernment scheme (OPK, RASKIN). There are large numbers of poor and near-poor consumers,for whom rice provides the main source of calories and protein in the diet, and who cannot afford tobuy adequate amounts of rice when prices would be high. Production was approximately 51 milliontons of paddy in 2000. Tariff of imported rice is Rp.430/kg.
3. ConsumptionConsumption per capita is slightly decreasing. It was 130.0 kg in 1999 (BCS).
4. ExportNo export transaction for rice.
5. Reserve PoliciesThe strategic directions are stable production, Increase of percentage of rice self-sufficient, Stableimport quantity. There is a system to control and monitor the national stock of the rice by Bulog(National Reserve is 68,000 tons). It is supposed that balance of supply-demand for rice is on theborderline being in deficit side. National Food Security Committee is the final organization forreservation and for stock control including with import quantity through Bulog’s data. Bulog isholding 1 to 2 million tons of milled rice as buffer stock included with ASEAN Food Reserve. Thegovernment’s policy is not to classify the rice between the ASEAN food reserve and the national foodreserve.
Rice balance (Unit: 1,000 tons)Supply Domestic Use
ProductionYearPaddy Milled rice
Import Total Food Loss, Seed& Other Total
Annualbalance
1997 49,377 31,206 782 31,988 26,371 5,617 31,988 01998 49,237 31,118 6,076 37,194 31,593 5,601 37,194 01999 50,866 32,147 4,183 36,330 30,544 5,786 36,330 02000 51,179 32,345 1,512 33,857 28,034 5,822 33,856 12001 50,080 31,661 1,396 33,057 27,351 5,707 33,058 -1
Source: Ministry of Agriculture, Population data, BCS and data on production & availability to consume (2001)

4
Summary of Country Report: Laos
1. ProductionIn the last five years, the output of rice increases from 0.85 million tons to 1.32 million tons, anincrease of about 55%. This remarkable achievement is attained through the increase in planted areaand the improvement of yield. The main production areas are in the central and south regions wheremore land is still available for rice cultivation. With better infrastructure such as irrigation and road,this rate of production growth can be sustained for the next few years.
2. ImportsLaos imported rice a small quantity of rice in the north in spite of the surplus in the south. Thetransportation cost from the south to the north is high. It would be cheaper to use the road network inThailand. The market takes care of this by exporting rice from the south and importing rice in thenorth. A large proportion of imported rice into Lao is for purpose of food aid, e.g., during the floodin 1995/1996.
3. ConsumptionWith the 50% increase in production and no report on export, it implies that per capita consumption ofrice in Lao has increased enormously during the past 5 years. The level of consumption is about 180kg/cap/year or about 0.5 kg/cap/day. This is supported by the household survey which put the percapita consumption at 358 kg in paddy basis. However, the consumption for feed and seeds areproperty taken into account, the direct consumption may not be as high. If the proper statistic isaccount for the export, it is likely that the level of rice consumption in Lao is at best staying the sameor even declining.
4. ExportsWith a 50% increase in production and limited increase in consumption, the logical deduction wouldbe that there must be at least a 50% increase in export. It is a well accepted fact that there areunofficial exports along the border to its neighboring countries i.e. Vietnam, Thailand, and China.Some source mentioned that volume of export to Vietnam is much higher than the export to Thailand.Approximately 50,000 tons of rice was exported from Laos to Vietnam in Year 2001. With thepotential increase in rice production in Lao, it is likely that the export from Lao will increase further inthe future.
5. Food aidBetween 1975 and 1990, total foreign aid to Laos, including grants and loans, was approximatelyUS$2.3 billion. Of this sum, only 65 % had been spent as of 1989, of which grants and loans made upapproximately equal quantities. Fifty-five percent of spent aid derived from the nonconvertiblecurrency area, 17.8 % from convertible currency area countries, and 27.2 % from internationalorganizations and financial institutions.

5
6. Reserve PoliciesThough there is no law/regulation on rice reservation, the Government realizes the need of have somesort of reserve for food security in the country. Generally if there is surplus amount of rice in a year,this stock usually kept by the farmers around the country. It is expected that rice reserved in LaoPDR is stored in form of paddy, glutinous rice. Approximate rice reserve is 3 months.
Rice balance (Unit: 1,000 tons)Supply Demand
Year BeginningStock Production Import Total Local
Consumption Export EndingStock Total
1995/1996 - 851 16 867 978 - - 9781996/1997 - 848 27 875 998 - - 9981997/1998 - 996 20 1,016 1,030 - - 1,0301998/1999 - 1,005 6 1,011 1,056 - - 1,0561999/2000 - 1,262 5 1,266 1,082 - - 1,0822000/2001 - 1,321 10 1,331 1,109 - - 1,109
Source: Ministry of Agriculture and Forestry and Department of Customs and Electrical Enterprise.

6
Summary of Country Report: Malaysia
1. ProductionMalaysia has adopted a rice-sufficiency target of 65%. However, the success of the productionprogram has increased the output from 1.27 million tons in 1996 to 1.47 million tons in 2000. Thisenables Malaysia to achieve 72% self-sufficiency, i.e., import only 28% of total domestic consumption.The increase comes mainly from the lower quality rice which is not a preferred by higher income andmore sophisticate farmer. The government is now focusing on quality improvement.
2. ImportsThe import of rice went up from 0.44 million tons in 1996 to 0.66 million tons in 1998 and reduced to0.55 in 2000. With the favorable production, import may not be expanding much in the future. Thesole authorized importer is BERNAS, now a listed company in the stock market. BERNAS isresponsible to ensuring purchase of the domestic crop and wide power to regulate import. Malaysiaimports rice in various forms, that is semi-milled or wholly-milled either polished or glazed andbroken rice. Source of supply comes from various countries in Asia and even USA and Oceania.Imports high quality rice usually comes from Thailand and Pakistan.
3. ConsumptionThe per capita consumption of rice declined from 102.2 kg in 1985 to 81 kg in 2001. However thenational consumption of rice is projected to increase from 1.8 million tons in 1995 to 2.12 million tonsin 2000 due to population increase. As income increases and degree urbanization grows, it is likelythat per capita consumption of rice in Malaysia will decline even further. The movement towardhigher quality rice will become more prominent not only in the urban but also in the rural areas.
4. Reserve PoliciesRice reserves in Malaysia is governed by the Control of Paddy and Rice Act which control (store andmanage) the supply of paddy and rice domestically and ensure a stable price for both farmers andconsumers. Its target is to ensure adequate supply of rice in any situation, especially during nationalemergencies. BERNAS is the main agency executing the rice reserve with the guidance from theMinistry of Agriculture.
Rice balance (Unit: 1,000 tons)Supply Demand
Year BeginningStocks
Production(milled rice) Import Total Domestic
Use Export EndingStocks Total
95/96 300 1,270 440 2,010 1,800 - 210 2,01096/97 210 1,380 480 2,070 1,830 - 240 2,07097/98 240 1,370 660 2,270 2,010 - 260 2,27098/99 260 1,280 610 2,150 1,780 - 370 2,15099/00 370 1,470 550 2,390 2,120 - 270 2,390
Source: Ministry of Agriculture
7
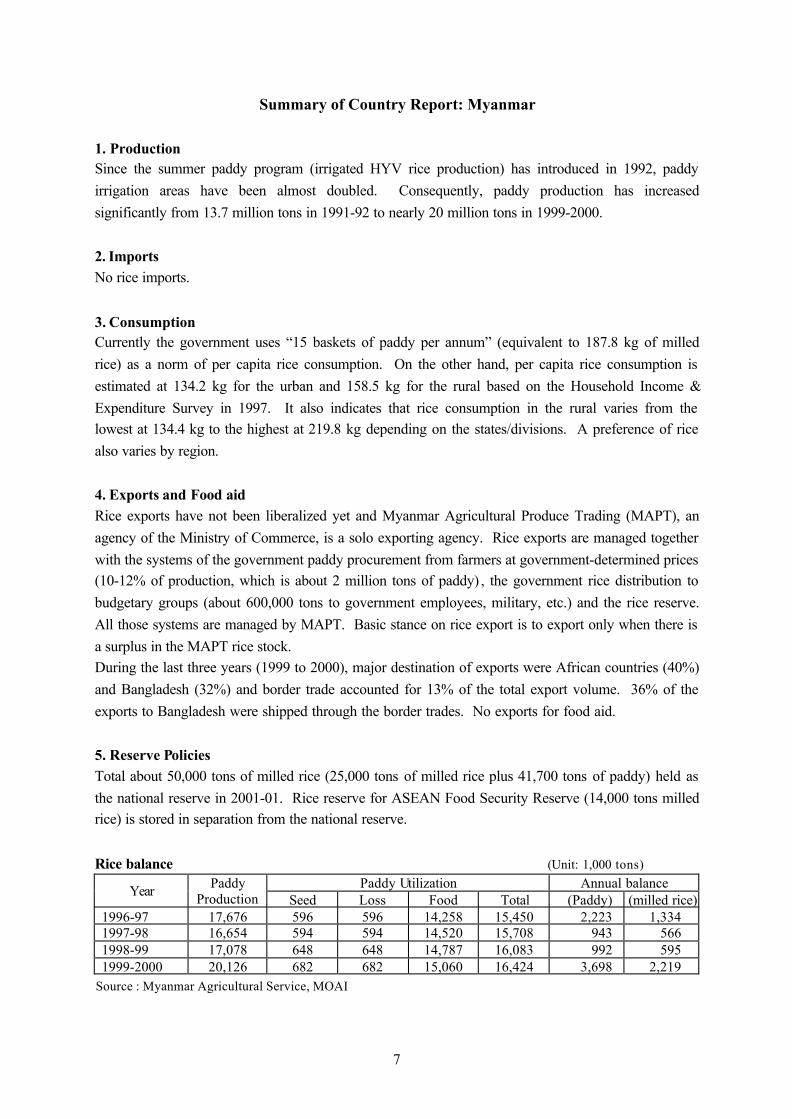
Summary of Country Report: Myanmar
1. ProductionSince the summer paddy program (irrigated HYV rice production) has introduced in 1992, paddyirrigation areas have been almost doubled. Consequently, paddy production has increasedsignificantly from 13.7 million tons in 1991-92 to nearly 20 million tons in 1999-2000.
2. ImportsNo rice imports.
3. ConsumptionCurrently the government uses “15 baskets of paddy per annum” (equivalent to 187.8 kg of milledrice) as a norm of per capita rice consumption. On the other hand, per capita rice consumption isestimated at 134.2 kg for the urban and 158.5 kg for the rural based on the Household Income &Expenditure Survey in 1997. It also indicates that rice consumption in the rural varies from thelowest at 134.4 kg to the highest at 219.8 kg depending on the states/divisions. A preference of ricealso varies by region.
4. Exports and Food aidRice exports have not been liberalized yet and Myanmar Agricultural Produce Trading (MAPT), anagency of the Ministry of Commerce, is a solo exporting agency. Rice exports are managed togetherwith the systems of the government paddy procurement from farmers at government-determined prices(10-12% of production, which is about 2 million tons of paddy) , the government rice distribution tobudgetary groups (about 600,000 tons to government employees, military, etc.) and the rice reserve.All those systems are managed by MAPT. Basic stance on rice export is to export only when there isa surplus in the MAPT rice stock.During the last three years (1999 to 2000), major destination of exports were African countries (40%)and Bangladesh (32%) and border trade accounted for 13% of the total export volume. 36% of theexports to Bangladesh were shipped through the border trades. No exports for food aid.
5. Reserve PoliciesTotal about 50,000 tons of milled rice (25,000 tons of milled rice plus 41,700 tons of paddy) held asthe national reserve in 2001-01. Rice reserve for ASEAN Food Security Reserve (14,000 tons milledrice) is stored in separation from the national reserve.
Rice balance (Unit: 1,000 tons)Paddy Utilization Annual balanceYear Paddy
Production Seed Loss Food Total (Paddy) (milled rice)1996-97 17,676 596 596 14,258 15,450 2,223 1,3341997-98 16,654 594 594 14,520 15,708 943 5661998-99 17,078 648 648 14,787 16,083 992 5951999-2000 20,126 682 682 15,060 16,424 3,698 2,219
Source : Myanmar Agricultural Service, MOAI

8
Summary of Country Report: Philippines
1. ProductionThe country’s self-sufficiency ratio for rice averaged 92.93 % for the last decade. Production is notstable, for ex. El Niño and the draught in 1998 caused serious damage for production by about 8%.
2. ImportsThe country has been consistently relying on importation to supplement domestic production of ricesince 1983. NFA is presently a sole agency for rice imports inclusive of allocating import quota forprivate importers. Allowing farmers to import rice was pronounced by President on July 23, 2001, thisdirective is yet to be implemented. The government through NFA is now in the process of determiningthe system of allocating the volume to be imported among the farmers, the private sector and thegovernment. The both prices of farmers-gate and consumer are competitively higher than otherASEAN countries. Consequently, cheaper rice from the neighbor countries is in tendency to flow intothe country topographically.
3. ConsumptionPopulation has increased by yearly 2.35% so that increase of rice production could not reach increaseof consumption. Shortage situation of rice is becoming chronic, although the government tries to haveadvancement of self-sufficiency for the rice.
4. Exports and Food aidNo rice was exported after 1983. Poor people who have a lack of food are increasing (39.4%/2000).Accordingly, the government is required to strengthen food aid to those people. Food aid under USPL480 has supplied rice since 1996.
5. Reserve PoliciesReserve for national level shall be 90 days consumption (24,000-25,000 tons/day), i.e. 30 days by thegovernment through NFA, 15 days by commercial sector and 45 days by household level.
Rice balance (Unit: 1,000 tons)Supply Demand
Year BeginningStock Production Imports
1/ Total Exports Seeds2/
Feeds &Wastes
3/
LocalConsumption Total
1996 1,422 7,334 862 9,618 - 244 587 6,990 7,8211997 1,797 7,325 722 9,844 - 249 623 6,996 7,8681998 1,976 5,560 2,171 9,707 - 212 500 6,711 7,4231999 2,284 7,662 834 10,780 - 286 728 7,411 8,4252000 2,355 8,053 617 11,025 - 289 765 7,782 8,836
Source: Selected Statistics on Agriculture, June 20011/ NSO figures, 2/ Updated based on seeding rate, 3/ Updated based on post-harvest losses

9
Summary of Country Report: Singapore
1. ProductionSingapore has no production of rice. There are some private investors who invest in rice productionin Myanmar and Vietnam and importing into Singapore. For the purpose of this study, this will notbe counted as Singapore's production. However, this is an interesting development, which couldhave an impact on the future arrangement for trade and investment.
2. ImportsSingapore imports about 3-400 thousand tons of rice a year. Imports of rice are carried out by privatecompanies. Some companies (e.g. NTUC) are linked with the government. Importers count ontheir long-standing relationship with the suppliers in price negotiation. Traditionally, Singaporeimports rice from Thailand. However, now imports are becoming more diverse. In particular,Vietnam and Myanmar are playing a more important role.
3. ConsumptionThe calculation of domestic utilization suggests that rice consumption per capita in Singapore increasefrom 108 kg/cap/annum to 114 kg/cap/annum. Given the level of income and degree of urbanizationin Singapore, the consumption per capita should be about of 68 kg/cap/annum - lower than that inMalaysia and higher than in Japan.
4. ExportsSingapore re-exports some of the rice imported. This is an important function of Singapore for therice market in the region. In particular, the fragrant rice from Thailand is re-exported to BruneiDarussalam, Mauritius and even Malaysia. With the establishment of AFTA, this flow of tradethrough Singapore could become more vigorous.
5. Reserve PoliciesThe Price Control Order also lists participation in stockpile as a condition of the license. Only theimporters of rice for local consumption have to participate in the Rice Stockpile Scheme (RSS) andsign the Rice Stockpile Agreement. The RSS is operated under the legal framework of Price ControlAct (Cap 244) and Price Control Order 1990. The level of reserve is varied depending on the supplyand demand of the domestic rice market. It is estimated to range between 3 to 6 months of domesticconsumption.
Rice balance (Unit: 1,000 tons)Supply Demand
Year BeginningStock
Production Import Total LocalConsumption
Export EndingStock
Total
1998/1999 37 - 404 441 400 4 44 4481999/2000 44 - 355 399 352 3 42 3972000/2001 42 - 448 490 447 1 51 499Source: Import/Export - Trade Development Board

10
Summary of Country Report: Thailand
1. ProductionThailand in 2001/02, ranks sixth in the world in terms of rice production volume. Rice production inThailand in 2001/02, increase from 15.9 to 16.9 million tons. This additional output furtherdepresses the price of rice in the domestic market. The government introduced a paddy depositprogram to cushion the impact of price decline. However, with the dry spell in 2002, it is expectedthat rice production will be reduced.
2. ConsumptionRice consumption is about 9 million metric tons in 2001/02. The per capita consumption of rice isabout 110 kg/cap/annum. Lower price of rice does not stimulate direct human consumption butcheaper bro-ken rice makes it more competitive with other animal feed ingredients.
3. ExportsThailand export about 7 million tons of rice in 2001 which is about 30% of the world market. Thairice exports could reach 7.55 million metric tons in 2002. However, the good harvest in majorproduction areas in the world, especially, China and India, has increased the stock level and depressthe world price. There are more competitors in the world market, especially, Vietnam and India.
4. Reserve PoliciesThe ending stock in has increased from 2.33 million (milled rice) tons in 1998/1999 to 3.76 milliontons in 2000/01. This high level of ending stock indicates the surplus in the market. Although thereis no specific provision for the maintenance of emergency reserve in the Thai law, Thai Rice ExporterAssociation is working closely with the government agencies to ensure that an amount equivalent toabout 3 months consumption would be kept for this purpose.
Rice balance (Unit: 1,000 tons)Supply Demand
Year BeginningStock Production Import Total Local
Consumption Export EndingStock Total
1996/1997 2,130 14,230 - 16,360 8,740 5,030 2,590 16,3601997/1998 2,690 15,570 - 18,260 9,010 6,600 2,650 18,2601998/1999 2,650 15,180 - 17,820 8,840 6,660 2,330 17,8201999/2000 2,330 15,950 - 18,280 8,980 6,090 3,210 18,2802000/2001 3,210 16,900 - 20,110 9,350 6,990 3,780 20,110
Source: Thai Chamber of Commerce

11
Summary of Country Report: Vietnam
1. ProductionVietnam’s rice production (milled basis) in 2000/01 crop is 20.90 million tons increased from 20.30million tons in 1999/00. Severe flood in late summer and early fall in 2000 is estimated to havereduced plantings of Vietnam’s 2001/02 10-month crops and will likely delay planting of the country’smain winter-spring crop as well.
2. ImportsIn 2001, Vietnam imported an estimated 20,000 metric ton of rice, mainly from Thailand. Traderspredict that, imports of Thai jasmine rice will probably increase before the TET (Feb 7-17, 2002)holidays. Moreover, two companies in Nghe An province have been granted permission to import5,000 tons of glutinous rice from Laos. Rice imported from Laos will be assessed a lower importtariff (about 50% lower than the 40% tariff Laos would normally face) as a result of the agreementbetween the two countries).
3. ConsumptionDomestic consumption of rice increases steadily from 14.58 million tons in 1998 to 16.75 million tonsin 2001. Rice consumption in Vietnam varies only slightly by income groups, though beyond acertain level of income, additional income is not spent on rice but on higher-value foods such as meat,fat/oil, eggs and on non-food items. The average per capita consumption is about 190 kg in 1998 andincrease to 210 in 2001.
4. ExportsSince joining international markets in 1989, the year which Vietnam started exporting rice, quality andscale of Vietnam export rice has been dramatically improved. Rice export volume increased from 1.4million tons in 1989 to 4.5 million tons in 1999, making Vietnam the second largest rice exporter inthe world. Along with the increase in export volume and value, rice market share of Vietnam in theworld market has been ever enhanced, from 9% in 1989 to 15% in 1998 and to 21% in 1999.
5. Food aidIn summer and autumn 2000, the Mekong River basin, one of the most important rice producing areasin Southeast Asia, was experiencing unusually serious flooding which affected human life andagricultural production in large areas of Thailand, Lao, Cambodia and Vietnam. An Giang Provinceof Vietnam was one of the most affected by the flood. 3,253 hectares of summer-autumn and thirdseason rice were destroyed while another 116 hectares were partially damaged. VietnamGovernment’s appeal through the United Nation system launched an appeal to assisting the country inits relief and rehabilitation efforts. The appeal resulted in funds being allocated by OCHA to FAOwith a total of USD378,800 for the procurement of rice seeds in sup-port of the most-affected farmhouseholds.

12
6. Reserve PoliciesNational reserve is a major mechanism of rice serve that is directly controlled by the government.The reserve is in the form of both paddy and rice. The current government policy is to reduce theamount of rice reserve and replaced by an increasing amount of cash reserve. In 2001, VietnamGovernment made the reserve of 1 million tons of rice in order to protect the farmers’benefits/earnings after being affected by the reduced market price.
Rice balance (Unit: 1,000 tons)Supply DemandCrop
Year Beginningstocks
Production(milled rice) Import Total Domestic
use Export Endingstocks Total
Population(million)
1997/98 3,690 18,940 0 22,630 14,580 3,700 4,350 22,630 76.51998/99 4,350 20,400 0 24,750 14,820 4,510 5,420 24,750 77.51999/00 5,420 20,300 0 25,720 15,060 3,600 7,060 25,720 78.52000/01 7,060 20,900 0 27,960 16,750 4,000 7,210 27,960 79.9Source: Country Report in the 22nd Asean Food Security Reserve Board (AFSRB) Meeting, 28-29 June 2001
held in Phnom Penh, Cambodia

13
Summary of Country Report: China
1. ProductionSelf-sufficiency in food is an important policy target for a large country like China. Governmentprovides both inputs (such as seed) and price subsidies for food crop including rice. The output of rice,one the main food grains, reached the historical height of 198.7 million ton in 1997. This accountsfor about 51% of the global output. This has led to a surplus in rice and prompted China to export.Starting in the 2000, the government has withdrawn the price support for early rice, a lower qualityrice crop grown mostly in the south. The research program is redirected toward quality rather thanquantity. The output of rice declined to 188 million tons in 2001. The output may decline furtherand the quality of rice will improve for the future.
2. ImportsChina imports a small quantity of premium grade quality rice from Thailand, the US and Myanmar(about 0.3 million tons or 0.1% of total consumption). Thailand has been the dominant supplier.China may be importing more rice as a member of WTO. The amount committed is 2.66 million tonsin 2002 (about 10 times more than the actual import) and 5.3 million tons in 2006. This is almost20% of the current level of world rice trade.
3. ConsumptionAbout 50 percent of the population in China has rice as their major staple and over 80% of rice forhuman consumption. Average per capital consumption in China is about 102 in 2000. This is stillhigh. The rapid degree of urbanization and the increase in income will reduce the consumption ofrice. If the production does not decline fast enough, there will be more surplus in China.
4. ExportsChina export jumps to 3.75 million tons in 1998 and declines to 2.5 million tons in 2001 (about 10%of the world market). Most of China’s rice exports were Indica rice from the Yangtze River region.China also export Japonica rice (about 20 per cent) from the northeastern provinces. Some of these arefrom number of joint-venture farms with investors from Japan and Korea. China also export tocountries outside eastern Asia, especially, Cote d’Ivoire, Cuba, Russia, Iran and Guinea.
5. Food aidWorld Food Programme (WFP), a UN specialised Agency, is one of the major food aid donors toChina. China’s government has built an increasingly effective partnership by closely matching WFP’scontribution with its own contributions over the last two decades.
6. Reserve PoliciesGovernor’s Grain Bag Policy, first implemented in 1995, requires a minimum reserve of 3 months ofgrain consumption for grain surplus provinces and 6 months for grain-deficit provinces. Nevertheless,only a small share of these stocks are likely to enter the market. This is due to strong preference forself-sufficiency in grain and these grains stocks serve as insurance against catastrophic crop failures.

14
Rice balance (Unit: 1,000 tons)Supply Demand
Year BeginningStock Production Import Total Local
Consumption Export EndingStock Total
1995/1996 85,500 129,650 850 216,000 246,930 270 84,500 331,6901996/1997 84,500 136,570 330 221,400 244,750 940 88,500 334,1901997/1998 88,500 140,490 240 229,230 250,350 3,750 93,000 347,1001998/1999 93,000 198,710 170 291,880 248,680 2,700 96,000 347,3901999/2000 96,000 198,490 240 294,730 246,010 2,950 98,500 347,4602000/2001 98,500 187,910 300 286,710 256,130 2,500 95,000 353,630
Source : China Agriculture Yearbook

15
Summary of Country Report: Japan
1. ProductionRice production has tendency to decline slightly over the long term. In accordance with thecontinuing decline in rice demand, various governmental programs to adjust rice production have beenimplemented since 1970s. In 2000, rice planted area became 1.77 million ha that is 54% of theplanted area in 1960.
2. ImportsMinimum access (MA) rice imports began in 1995 at commitment volume of 426 thousand tons(brown rice basis) and it increased at 767 thousand tons in 2000. MA rice imports are controlled bythe government and carried out under the two bidding methods. The main rice exporter to Japan wasAustralia, China, Thailand and U.S.A. in 1999 – 2001.
3. ConsumptionPer capita rice consumption was at its peak (118.3 kg) in 1962 (total demand about 13 million tons),but afterward it has been continuing to decline and it reached at 64.6 kg, 76% of the peak, in 2000(total demand about 10 million tons). In general, Japanese consumers are extremely stuck on theirfavorite; i.e. Japonica rice. Also they have high attention to the food safety.
4. Exports and Food aidNo commercial exports. In the past five years, total of approximately 2.13 million tons of rice wasexported under the various food aid programs. At the large-scale food emergency in case ofIndonesia (1998) and North Korea (2000), the government supported them in response to their requestand/or appeals for food aid issued by FAO/WFP.
5. Reserve PoliciesThe normal level of rice stock is set at 1 million tons as precaution against once-in-ten years poorharvest.
Rice balance (Unit: 1,000 tons)Domestic Supply Domestic UseTradeFiscal
Year Production Import Export
Stockchanges
1/Total Food
Feed, Seed,Processing &
LossTotal
1996 10,344 634 6 783 10,189 9,345 844 10,1891997 10,025 634 201 351 10,107 9,291 816 10,1071998 8,960 749 876 -1,075 9,908 9,096 812 9,9081999 9,175 806 141 -65 9,905 9,109 796 9,9052000 9,490 879 462 -81 9,988 9,045 934 9,988
Source: Food Balance Sheet, MAFF1/ Difference between carryover volume and stock volume at the end of year.

16
Summary of Country Report: Korea
1. ProductionThere is a policy to advance increase of rice production heretofore. It is difficult to change policybecause of election year in 2002, nominally policy of advancement of production increase. Underthe circumstance, the government has commenced to make an examination of production control forunderstanding. Rice self-sufficiency was established stably in 1997 because of reduction ofconsumption. The government has to stock approximately 150 million tons of rice in the end of 2001.The strategic direction is to control production keeping rice self-sufficiency.
2. ImportMinimum access (MA) rice has been imported under the government control since 1995/1996. Thequantity that the government committed for MA is 128,267 tons in 2001, which imported mainly fromChina (55 to 93%) with short grain through bidding procedures. MA imports rice is approximately2.5% of annual consumption in 2001.
3. ConsumptionSurplus of rice is generated because of improvement of production technology (increasing yield) andreduction of rice consumption. Annual consumption per capita is prospectively 93.6 kg in 2000(119.6 kg in 1990): reduction speed is 2.6 kg/year.
4. Export & Food aidNo commercial rice was exported. The government accomplished food aid for North Korea withfood shortage as a part of improvement for relations. The milled rice was exported to North Korea,150,000 tons with Korean rice in 1995 through grant aid program and 300,000 tons with Thai ricethrough loan program in 2001.
5. Reserve PoliciesThere is no conclusive regulation for stock as the national rice reserve. The government should stockrice in paddy except MA rice, which is attained to stock 1,150,000 tons (8,000,000 sok: 1 sok = 144kg) +288,000 tons based on milled rice.
Rice balance (Unit: 1,000 tons)Supply Demand
Year BeginningStock Production Import Total Food Loss, seed
& other Export EndingStock Total
1996 659 4,695 115 5,469 4,778 447 - 244 5,4691997 244 5,323 - 5,567 4,710 360 - 497 5,5671998 497 5,450 75 6,022 4,606 610 - 806 6,0221999 806 5,097 97 6,000 4,541 737 - 722 6,0002000 722 5,263 107 6,092 4,425 689 - 978 6,092
Source: Ministry of Agriculture and Forestry

COUNTRY REPORT
Brunei Darussalam

Country Report : Brunei Darussalam
A - 1
1. Background
Rice is the staple food grain for Brunei Darussalam. Like other food, most of the supply of rice isimported. Domestic production is confined to a small number of farmers in remote areas.Government manages the supply and price of rice through import control.
2. Production
2.1 Cultivating Area
A small quantity of rice is produced by medium and small-scale farmers in the Belait andTemburong districts of Brunei using tradition methods. Total land area utilized for rice productionis 482 ha.
Table 1: Number of Farmers, Area and Output of RiceDistricts No. of Farmers Area (ha) Output (tons)
Belait 155 200 151Temburong 221 205 161
Tutong 132 77 38Total 508 482 350
Source: Brunei Rice Policies in Rice Stock Management and Food Security, Paper presented at theFirst Technical Meeting on Rice Reserve (TMRR), 19 April 2002, Bangkok, Thailand.
Most of the farmers are using their family labour. However, a few are using foreign workers.
2.2 Rice Variety
The rice grown in Brunei is a local variety, which has a texture between glutinous and normal rice.This variety of rice only has 1 harvest a year. The yield is about 1 metric ton per ha but with betterinfrastructure and technology, the official opined that the yield can be increase to 3 metric tons.
The government has tried growing modern rice variety but has to stopped because it is not popularwith the local consumers. Currently, the Ministry of agricultural is trying to plant a rice varietyfrom Bangladesh.
2.3 Output
About 350 tons of rice was produced in 2001. Domestic production only accounts for 1% ofdomestic rice consumption. The aim is to increase product to 5% in next few years.
2.4 Production Policy
In order to ensure the supply of rice, the government invested in the food production (including

Country Report : Brunei Darussalam
A - 2
rice) not only in Brunei. itself but also in other countries. Many scheme were attempted in the past,including the importation of farmer to cultivate rice in Brunei. This had proved to be less efficientthan import.
The Ministry of Agriculture oversees all aspects of rice production and the sale of domesticallyproduced rice. Under the national development plan, $2 million has been earmarked fordevelopment of the domestic rice production. Due to the lack of expertise and manpower, theMinistry do not cultivate/breed rice variety. Instead they, try to ask other countries for rice varietiesfor “trial production” in Brunei.
The Ministry is also considering joining the ASEAN Science and Breeding program to conductresearch with China. This will allow them to tap on Chinese equipments & expertise. The Ministryset aside an annual budget of about $300,000 to purchase all the domestic rice production at a priceof 41.60 per kg. The Ministry will also undertake to mill the rice for direct sale to end-consumers.
Other forms of assistance to the farmers include provision of fertilizer and chemicals such asinsecticides.
3. Consumption
Brunei Darussalam has 350,000 population. The per capita income is about US$ 24,000 in the year2000. Most of the people are in the urban area. In 2001, the estimated consumption of rice is 97.7 kg.This is a decrease from 94.8 kg. in 1998 and 108.6 kg. in 1999. The total consumption of rice is about36,000 tons in the year.
Table 2 : Rice Balance Sheet 1997-2001 (Unit: 1,000 tons)1997 1998 1999 2000 2001
Beginning Stocks 12.589 12.670 19.575 18.045 14.457Production (milled rice) 0.293 0.135 0.199 0.299 0.350Import 16.500 32.000 34.200 20.800 32.600Total Supply 29.382 44.805 53.974 39.144 47.407Domestic Use 16.224 30.930 35.929 24.686 29.701Ending Stock 13.158 13.875 18.045 14.457 17.707
Source: Department of Information Technology and State Store.
The important factor determining the rice consumption is the growth rate of population is (about 2%).However, consumption per capita may be declining as the taste of consumer, especially, with theincrease in the size of younger population.
The preference for high quality rice consumption is evidence in the type of rice imported (See theimport table below). Fragrance rice is the main variety of rice consumed in Brunei. The import offragrant rice from Thailand dominates the import of rice by Brunei.

Country Report : Brunei Darussalam
A - 3
Another important aspect of rice consumption in Brunei is the consumption of rice by the migrantworker. In 1998, there are about 20,000 Thai worker (mostly construction workers). The Thaiworkers prefer glutinous rice. The import of glutinous rice cater for this demand and a small portionwent for the preparation of deserts.
4. Distribution and Price
4.1 Distribution
Rice is distributed to the consumption through an open market system. Most (66%) of the riceproduced domestically are sent to the rice mill and sold through roadside stalls, hawkers, retailerand consumed by the farmers themselves.
For the imported rice, the rice trader (licensed wholesalers and retailers) purchase their rice from theState Store and distribute it to the consumer in each locality. Currently there are more than 160license holders registered with the State Store. To apply for a license, the rice wholesaler/retailerneeds to be a registered business in Brunei.
Diagram 1 Rice Distribution System in Brunei Darussalam (2001)
Rice wholesalers/retailers can also import other specialty rice e.g. basamti from overseas suppliersupon application for a license from the State Store.
Retailers
Import29,35.0.5mt
(98.8%)
GovernmentState Store
Wholesalers
Consumers(29,700.5 mt)
Local Production350 mt (1.2%)
Private Milling233mt (66.6%)
GovernmentSubsidy
PurchasingScheme
Direct Selling Collecting Centre
Government RiceMill
Department ofAgriculture

Country Report : Brunei Darussalam
A - 4
4.2 Price and Price Policy
The price of rice is controlled by the government and through the selling price of the State Store.The objective of the price control is to protect the consumer.
The government set the sale of rice in Brunei. The rice is sold at $7.50-$8.50 per 10 kg pack to thewholesaler who in turn sells it for $11.50, this price structure has been used for the last 7 years.
Table 3: Rice Price by TypesWholesale Price Ceiling Retail PriceType of Rice
B$ per 50kg B$ per 10 kg B$ per 50kg B$ per 10 kgFragrant Rice 57.50 11.50 62.50 12.50Ordinary Rice 38.50 7.70 42.50 8.50Glutinous Rice 35.50 7.10 38.50 7.70
Source: Department of Information Technology and State Store.
5. Rice Trade
Importation of rice is the most important source of supply of rice in Brunei. The import is controlledand managed by the State Store under the Department of Information Technology and State Store,Ministry of Finance.
Brunei Darussalam is an importer of rice. Only the State Store under the Ministry of Finance isallowed to import rice. Rice traders can only import other varieties of rice. To import rice, thesetraders need to apply for a license from the State Store. There is no criteria attached to the applicationfor a licence other than being a business registered in Brunei.
Although there is no regulation, prohibiting the purchase of rice from other countries, the State Storecontinue to rely solely on Thai suppliers out of consideration for the following factors
• Better bargaining power with the scale of purchase• Relative ease of mobilizing shipment of a large quantity from 1 country of supply versus
several shipments from numerous countries.• The end-consumers in Brunei prefer the Thai fragrance rice.
The import of rice is conducted through the Government-to-Government (G-to-G) arrangement,especially, with Thailand. Other sources of supply include Singapore and Vietnam. The Governmentof Brunei has an agreement with the Thailand government on the purchase of rice. This agreement isnegotiated yearly and the price of the rice is based on the Thai prevailing market price.
The State store will in turn sell the rice to licensed wholesalers/retailers. They’re about 160 licensedwholesalers/retailers. These traders are free to store the rice purchased from the State Store in theirown warehouses. Similarly there are no criteria attached to the application for a license.

Country Report : Brunei Darussalam
A - 5
The delivery is usually made every 2 months. This is to ensure the freshness of rice and to avoidholding large quantity of rice stock. The State Store will determine the quantity of rice to be delivered.
Prior to the delivery, the State Store will dispatch the inspector to check the quality of the rice.
Table 4: Import of Rice by TypesTypes of Rice Quantity (MT)
1998 1999Fragrant rice 22,500 27,400Ordinary rice 5,500 4,600Glutinous rice 4,000 2,200Total 32,000 34,200
Source: Department of Information Technology and State Store.
Beside the procurement of rice, the state store is also responsible for checking the quality of the rice,and maintaining the rice reserve.
6. Recent Developments The government has recently awarded 300 ha of land to an agricultural group to grow rice in Brunei.The group, which has close affiliation with China, will be growing rice in Brunei using the Chineserice variety and technology.
The Ministry will be reviewing all incentives for rice production next year and does not rule out thepossibility of involving the private sector in the sale of domestically produced rice. As such, theannual budget for the purchase of rice from the farmers can be channeled into development ofinfrastructure. Another reason for the review is that a bigger budget will be needed to purchase theincreasing rice production.
One of the immediate concerns is to improve the current rice storage system to cater to increasing riceproduction and to better maintain the quality of the imported rice while in storage.
One option that the government can explore is to invest in the production of rice in other countries.For example, Japan and Korea invest in rice production in China and import it back to their countries.
7. Rice Reserve System in Brunei
7.1 Reserve System
The import of rice is controlled and regulated by the State Store. The State Store will determine thequantity and schedule of rice to be delivered by the exporters. At the same time, the quantityrelease of rice in the market is regulated through the release from the State Store stock.

Country Report : Brunei Darussalam
A - 6
The State Store has a target of 6 months consumption of rice in stock + reserve. There are somefluctuations in the stock level but it will fall below this target level.
In the case of emergency, the State Store can readily mobilise the reserve from its stock to a specificlocation.
7.2 Management of Rice Reserve
The State Store bears all the costs of maintaining the reserve. It operates a central warehouse, whichcould keep up to 6,000 tons of rice. The State Store maintains a reserve of 6 months of rice basedon an average of last 3 months consumption. After 6 months, the rice stock is sold to the traders.This is higher than the 1.5 months consumption recommended by FAO.
The stock is replenished by the import shipment every 2 months. The release of stock is based on aFirst-in-first-out System.
8. International Commitments
8.1 ASEAN
Aside from the commitment under the AERR, Brunei is also participating in the ASEAN Free TradeArea (AFTA). Since Brunei has not reserve the right under the Special Arrangement for Sensitiveand Highly Sensitive Product, Brunei will be oblige to bring down the import tariff (already 0%) by1 January 2002 and the quantitative restriction has to be removed immediately.
8.2 WTO
As a member of WTO, Brunei is bounded by the regulation stipulate in the WTO. Brunei hasbound the import tariff for rice at 50%.
8.3 ASEAN Emergency Rice Reserve
Brunei agreed to earmark 5,000 tons of rice for this purpose. This stock is part of the stock kept bythe State Store. There is no special process or mechanism devised for this purpose. In other words,emergency in ASEAN will be treated as the emergency in Brunei.

Brunei at a glance 9/19/01
POVERTY and SOCIAL High-Brunei income
2000Population, mid-year (millions) 0.33 903GNI per capita (Atlas method, US$) .. 27,510GNI (Atlas method, US$ billions) .. 24,829
Average annual growth, 1994-00
Population (%) 2.2 0.7Labor force (%) 2.8 0.9
Most recent estimate (latest year available, 1994-00)
Poverty (% of population below national poverty line) .. ..Urban population (% of total population) 72 77Life expectancy at birth (years) 76 78Infant mortality (per 1,000 live births) 9 6Child malnutrition (% of children under 5) .. ..Access to an improved water source (% of population) .. 99Illiteracy (% of population age 15+) 9 < 5Gross primary enrollment (% of school-age population) 106 103
Male 109 104Female 104 103
KEY ECONOMIC RATIOS and LONG-TERM TRENDS
1980 1990 1999 2000
GDP (US$ billions) 4.9 3.6 .. ..
Gross domestic investment/GDP 3.0 .. .. ..Exports of goods and services/GDP .. .. .. ..Gross domestic savings/GDP .. .. .. ..Gross national savings/GDP .. .. .. ..
Current account balance/GDP .. .. .. ..Interest payments/GDP .. .. .. ..Total debt/GDP .. .. .. ..Total debt service/exports .. .. .. ..Present value of debt/GDP .. .. .. ..Present value of debt/exports .. .. .. ..
1980-90 1990-00 1999 2000 2000-04(average annual growth)GDP -0.7 2.1 .. .. ..GDP per capita -3.5 -0.5 .. .. ..Exports of goods and services .. .. .. .. ..
STRUCTURE of the ECONOMY1980 1990 1999 2000
(% of GDP)Agriculture 0.6 2.4 .. ..Industry 84.8 54.8 .. ..
Manufacturing 11.8 .. .. ..Services 14.5 42.9 .. ..
Private consumption .. .. .. ..General government consumption 7.0 .. .. ..Imports of goods and services .. .. .. ..
1980-90 1990-00 1999 2000(average annual growth)Agriculture 4.1 2.8 .. ..Industry -3.5 0.5 .. ..
Manufacturing -0.3 .. .. ..Services 6.6 4.8 .. ..
Private consumption .. .. .. ..General government consumption .. .. .. ..Gross domestic investment .. .. .. ..Imports of goods and services .. .. .. ..
Note: 2000 data are preliminary estimates.This table was produced from the Development Economics central database.
* The diamonds show four key indicators in the country (in bold) compared with its income-group average. If data are missing, the diamond willbe incomplete.
0
2
4
6
95 96 97 98 99 00
GDI GDP
Growth of investment and GDP (%)
Brunei
High-income group
Development diamond*
Life expectancy
Access to improved water source
GNIpercapita
Grossprimary
enrollment
Brunei High-income group
Economic ratios*
Trade
Domesticsavings
Investment
Indebtedness
Kondo
A-7

Brunei
PRICES and GOVERNMENT FINANCE1980 1990 1999 2000
Domestic prices(% change)Consumer prices .. .. .. ..Implicit GDP deflator 86.1 8.4 .. ..
Government finance(% of GDP, includes current grants)Current revenue .. .. .. ..Current budget balance .. .. .. ..Overall surplus/deficit .. .. .. ..
TRADE1980 1990 1999 2000
(US$ millions)Total exports (fob) 4,581 2,213 2,600 3,500
Food and agricultural raw materials 0 0 .. ..Fuels, ores, and metals 4,455 2,137 .. ..Manufactures 0 10 .. ..
Total imports (cif) 572 1,001 1,500 1,600Food 86 192 .. ..Fuel and energy 11 9 .. ..Manufactures 445 780 .. ..
Export price index (1995=100) .. .. .. ..Import price index (1995=100) .. .. .. ..Terms of trade (1995=100) .. .. .. ..
BALANCE of PAYMENTS1980 1990 1999 2000
(US$ millions)Exports of goods and services .. .. .. ..Imports of goods and services .. .. .. ..Resource balance .. .. .. ..
Net income .. .. .. ..Net current transfers .. .. .. ..
Current account balance .. .. .. ..
Financing items (net) .. .. .. ..Changes in net reserves .. .. .. ..
Memo:Reserves including gold (US$ millions) .. .. .. ..Conversion rate (DEC, local/US$) 2.2 1.8 1.7 ..
EXTERNAL DEBT and RESOURCE FLOWS1980 1990 1999 2000
(US$ millions)Total debt outstanding and disbursed .. .. .. ..
IBRD .. .. .. ..IDA .. .. .. ..
Total debt service .. .. .. ..IBRD .. .. .. ..IDA .. .. .. ..
Composition of net resource flowsOfficial grants .. .. .. ..Official creditors .. .. .. ..Private creditors .. .. .. ..Foreign direct investment .. .. .. ..Portfolio equity .. .. .. ..
World Bank programCommitments .. .. .. ..Disbursements .. .. .. ..Principal repayments .. .. .. ..Net flows .. .. .. ..Interest payments .. .. .. ..Net transfers .. .. .. ..
The World Bank Group: http://www.worldbank.org/data/ 9/19/01
0
1,000
2,000
3,000
4,000
94 95 96 97 98 99 00
Exports Imports
Export and import levels (US$ mill.)
-5
0
5
10
95 96 97 98 99 00
GDP deflator CPI
Inflation (%)
Kondo
A-8

Brunei Social IndicatorsLatest single year Same region/income group
High-1970-75 1980-85 1993-99 income
POPULATION Total population, mid-year (millions) 0.2 0.2 0.3 896.3 Growth rate (% annual average for period) 4.3 2.9 2.3 0.7Urban population (% of population) 62.0 62.3 71.6 76.8Total fertility rate (births per woman) 4.8 3.5 2.7 1.7
POVERTY(% of population)National headcount index .. .. .. .. Urban headcount index .. .. .. .. Rural headcount index .. .. .. ..
INCOMEGNI per capita (US$) .. .. 24,620 26,440Consumer price index (1995=100) .. .. .. 107Food price index (1995=100) .. .. .. ..
INCOME/CONSUMPTION DISTRIBUTIONGini index .. .. .. ..Lowest quintile (% of income or consumption) .. .. .. ..Highest quintile (% of income or consumption) .. .. .. ..
SOCIAL INDICATORSPublic expenditure Health (% of GDP) .. .. 8.1 6.1 Education (% of GNI) .. .. 3.1 5.5 Social security and welfare (% of GDP) .. .. .. 9.8Net primary school enrollment rate(% of age group) Total .. 78 91 95 Male .. 78 90 95 Female .. 78 91 95Access to an improved water source(% of population) Total .. 90 .. .. Urban .. .. 100 .. Rural .. .. 92 ..Immunization rate(% under 12 months) Measles .. 98 94 89 DPT .. 88 92 91Child malnutrition (% under 5 years) .. .. .. ..Life expectancy at birth(years) Total 69 73 76 78 Male 68 71 73 75 Female 71 75 78 81Mortality Infant (per 1,000 live births) 35 12 9 6 Under 5 (per 1,000 live births) .. .. 11 6 Adult (15-59) Male (per 1,000 population) 173 187 132 125 Female (per 1,000 population) 142 132 76 63 Maternal (per 100,000 live births) .. .. .. ..Births attended by skilled health staff (%) .. 82 98 ..
Note: 0 or 0.0 means zero or less than half the unit shown. Net enrollment ratios exceeding 100 indicate discrepanciesbetween the estimates of school-age population and reported enrollment data. Latest year for access to improved watersource data is 2000.
2001 World Development Indicators CD-ROM, World Bank
Kondo
A-9
COUNTRY REPORT
Cambodia

Country Report : Cambodia
B - 1
1. Rice Production
Rice is Cambodia's most important agricultural commodity and it accounted for nearly one-third oftotal agricultural output and about 11 % of total GDP in 1998. Also, it takes up 80-90% of totalcultivated area.
There are serious problems, partly the result of three decades of war and civil strife. Displacement offarmers, land mines, abandoned fields, social insecurity and shortage of manpower have caused asignificant decline in paddy area from 2.5 million ha in 1967 to 1.9 million ha in 1999/2000.
1.1 Rice Production in Recent Years
Production has increased in 1999/2000 due to increase of yield of wet season crop but still very lowlevel compare to other Asian countries. Planted area of dry season crop has no much expansionduring last 5 years.
Rice Production in Cambodia, 1996/97 – 2000/01
Description 1996/97 1997/98 1998/99 1999/00 2000/01
Planted area (ha) 2,170,900 2,076,011 2,104,013 2,157,592 2,318,495
Harvested area (ha) 1,882,000 1,928,689 1,962,566 2,079,442 1,903,159
Yield (ton/ha) 1.84 1.77 1.79 1.94 2.12Tota
l
Output (paddy, ton) 3,458,000 3,414,918 3,509,871 4,040,900 4,026,092
Planted area (ha) 1,936,900 1,827,328 1,873,093 1,915,592 2,058,648
Harvested area (ha) 1,649,000 1,684,906 1,745,396 1,846,442 1,647,812
Yield (ton/ha) 1.67 1.60 1.65 1.81 1.95
Wet
sea
son
crop
Output (paddy, ton) 2,759,000 2,672,597 2,873,906 3,332,900 3,212,269
Planted area (ha) 234,000 248,683 230,920 242,000 259,847
Harvested area (ha) 233,000 243,783 217,170 233,000 255,347
Yield (ton/ha) 3.00 3.05 2.93 3.04 3.19
Dry
sea
son
crop
Output (paddy, ton) 699,000 742,321 635,965 708,000 813,823
Source: Agricultural Statistics, MAFF
1.2 Characteristic of Rice Production
(1) Rice ecosystem
Rice ecosystems in Cambodia are diversified and can be classified into four systems as; Rainfedlowland rice, Deepwater Rice, Rainfed Upland Rice (Wet season crop) and Dry Season Rice.Local varieties are mostly cultivated in wet season crop and IR varieties are cultivated in dry seasoncrop.

Country Report : Cambodia
B - 2
0 cm
100cm
200cm
300cm
Depth
Upper FieldSandy soilDepth:20-30cm
early-ripening varietyHarvest:Late in Nov.~Beginning of Dec.
Medium FieldSandy~sandy loam soilDepth:20-40cm
middle-ripening varietyHarvest:Middle of Dec.~Latein Dec.
Lower FieldSandy loam~loam soilwith some silt contentDepth:40-50cm
late-ripening varietyHarvest:Late in Dec.~Middle of Jan.
Rainfed Lowland Rice
Depth 0/15 - 50/80cm
Upland Rice
Height 30 - 1000m
Deepwater/Floating Rice
Depth 50 - 300cm over
Submerge FieldLoam-loam/clay soilDepth:50cm-3m over
latest-ripening varietyHarvest:Late in Jan.~Beginning of Mar.
Upland Field
Rice grown in dryfield:Harvest:August~
Depth of water(Sep.~Oct.)
Ecosystems of Wet Season Rice
(2) Rice Crop Damage
Rice production is strongly influenced by changes of climatic conditions and the insect/disease, dueto obsolete cultivation technology and poor agricultural production infrastructure without irrigationsystem and dyke system.
The destroyed ratio of wet season rice from 1995 to 2000 were 9%, 15%, 8%, 7%, 4% in order.The destroyed ratios of dry season rice were lower than that of wet season rice. Average yieldswere stable for both wet season rice and for dry season rice. Although the causes of damage varyby areas, for a country as a whole , it can be said that year 1997 and 1998 were drought years andyear 1999 was a flood year. Provincial share (average for three years) of the national damage showthat the damages were most serious in Bat Dambang province and Banteay Mean Chey province,occupying 45% of the total damage. Following Kompong Thum province, Takeav province andPrey Veaeng province, another main rice production area in southeast part, were in the higher rankof the damage share, occupying 11% of the total damage.
Destroyed Area of Wet Season Rice
0 20,000 40,000 60,000 80,000 100,000 120,000 140,000 160,000
1997/1998
1998/1999
1999/2000
Flood Drought Insect+Rodent
Provincial Share in the DestroyedArea
BanteayMean Chey
16%Kampong
Thum10%
BatDambang
29%
Pousat4%
Kampot5%
Svay Rieng4%
Takev6%
PreyVeaeng
5%
Total ofother
provinces21%

Country Report : Cambodia
B - 3
(3) Inputs and Production Costs
Besides natural disasters, the subsistence nature of agriculture is another productivity-inhibitingfactor. There is, for example, limited use of improved crop varieties and fertilizers. According tothe research report of Cambodia-IRRI-AusAID project, the costs and returns of economic model ofrainfed lowland rice (1995) are summarized as follows.
Economic model of rainfed lowland rice production, 1995Traditional system Improved system
Item Unit price Quantity Value Quantity Value
Seed 368 / kg 80 29,440 -- --Improved seed 800 / kg -- -- 80 64,000Fertilizer
Urea 680 / kg 0 0 50 34,000DAP 864 / kg 0 0 70 64,800
Manure Free / cart 5 0 10 0Labor
Family Free/person-day 110 0 120 0Hired 3,000/person-day
Hired draft power 95,650 1 95,650 1 95,650Equipment & materials 25,800 1 25,800 1 25,800Total costs for 1 ha 150,890 284,250Yield per 1 ha 1.3 ton 2.0 tonTotal costs for 1 ton paddy (Riel) 116,069 142,125Total costs for 1 ton paddy (US$) 1/ 46.4 56.9Source : Rice Production in Cambodia, Cambodia-IRRI-AusAID (1997)1/ US$ 1 = 2500 riels (1995), Exchange rate in March 2002 was around 3,950 riels.
(4) Irrigation
Only a small fraction of around 250,000 ha of irrigated dry-season rice land is presently fullyirrigated.
1.3 Policy on the Rice Production
(1) Rice Production Plan
The Agricultural Development Plan (2001-2005) aims at accelerating and increasing foodproduction, especially the rice crop and other alternative food crops. Ministry of Agriculture andForestry (MAFF) has set up a target-yield in year 2005 as 2.0 ton/ha and a target-harvest area as2,420,000 ha. Target harvest area has set as about 14% increase in wet season rice and about 24%increase in dry season rice. Damage/destroy area has set as corresponding to the actual result of1999/00 in which the damage in wet season rice was least in recent years.

Country Report : Cambodia
B - 4
Rice Production Plan for Year 2005/06Description Targets in 2005/06
1. Total cultivated land 2,500,0002. Damaged land 80,0003. Harvested land 2,420,0004. Yield (ton/ha) 2.005. Total output 4,800,000
Each of these targets corresponds to the actual result in the past. They can be achieved if theremoval of land-mines and the improvement in productivity through rehabilitation of irrigationsystem, increase in access and better use of quality input (seeds, fertilizers, pesticides) andmodernization of agricultural technology are progressed.
(2) Government Support on Rice Production
There is no subsidy program regarding the rice production. Agricultural support services,especially input supply, research and extension, marketing and credit, have just started from scratchwith foreign assistance.
Company of Material, Equipment and Transport (COCMA) affiliated with MAFF handles fertilizer,agricultural chemicals, agricultural machines, etc. but it is regarded as object of privatization. Themultiplication and distribution of high quality seed gets high priority. The CARDI under MAFFhas been conducting paddy seed multiplication and distribution under assistance from Australia butits quantity is rather limited. Depending on the area, some small-scale groups are formed by NGO.The government is planning to organize farmer's groups but the MAFF is yet in the stage of draftingthe agricultural cooperative act.
NGOs and banks are providing loans to farmers, traders, rice millers, etc. Although generalconditions for loan (specially interest rate) are severe due to low agricultural productivity, there isnot stable political loan specific to rice marketing. A system which the Central Bank evaluatesNGO and approves their qualification as lender have been introduced.
2. Demand
2.1 Per Capita Consumption
Per capita consumption of rice has been set at 151.2 kg in the food balance calculations as a resultof the FAO/WFP mission since 1996. From the result of limited scale of the survey (159 samples)in the JICA Study, amount of rice consumption was calculated as about 117 kg per person in PhnomPenh. At the same time, significant taste preference to the certain varieties/place of productionwas observed, especially at the central part of the city. In the rural area, collected data show thesimilar level of rice consumption per capita, 151.2 kg.

Country Report : Cambodia
B - 5
Staple cereals including rice have low-income elasticity and per capita consumption is expected todecline with the change of the eating habits in accordance with the economical development and theincrease of income, from the examples of other Asian countries. However, it is hard to say thatrapid economical development and change of eating habits will take place in Cambodia whenpresent situations in rural villages are viewed.
2.2 Consumer’s preferences
Phnom Penh has a population of about 1.1 million and is the largest market in the country. Ricefrom the northwest production areas, namely Bat Dambang, has an established reputation of goodtaste and good quality. It has largemarket share in high-medium pricemarket in Phnom Penh. High-medium priced rice such as Somaly,Phaka Kagney, N. Menh from BatDambang are the most common in thecity center where residents have thehighest income level in the country.In contrast, medium-low priced ricefrom surrounding provinces such as IR,Local variety and Mixed-rice arecommon in the outskirts of the cityarea where lower income earners live.
IR rice produced in the southern part of the country such as Takaev and Prey Veaeng is evaluatedpoor in taste and the cheapest rice in Cambodia. In Phnom Penh, IR rice is marketed mostly forfactory lunch consumption and for low-income earners living in the outskirts of the city. IR rice issold only at a few markets in the city center. Phaka Kagney produced in Takaev is 100 – 150Riel/kg cheaper than the same produced in Bat Dambang, due to "hard taste".
Thai fragrant broken rice (Thai A1 Special 100% broken) is sold at most rice shops in center ofPhnom Penh. Consumers value this rice and considered as “It is soft and it maintain softness evenwhen rice get cool” . In contrast, Cambodian rice is considered as “It becomes hard when it iscool”. Many local restaurants also use Thai fragrant broken rice to blend with local rice to addfragrance and softness.
The “look“ of rice is an important factor in determining price (quality) in the market. Therefore,foreign matter and colored grain are removed manually before retailing.
According to the questionnaire survey on the consumer’s criteria for choosing rice at shopconducted in the JICA Study, the respondents put higher marks on ‘variety’, ‘fragrance’ and ‘price’.Among the criteria, broken percentage is the least important.
Kind of rice usually buy
Phaka Kagney47%
N.Minh/Ph.Kagney/Somaly
5%
IR + State rice +Dry season rice
3%
Neang Minh19%Somaly
12%
Thai rice7%
Other localvariety
2%Wet season mixrice2%
Srov Krahom3%

Country Report : Cambodia
B - 6
Consumer’s criteria for choosing rice in Phnom Penh
Criteria Variety Price Fragrance ColorShop
Recommendation
Brokenratio Origin
Average score 1.596 3.396 2.324 3.917 5.729 6.042 4.917Order 1 3 2 4 6 7 5
As for the preference on the variety, the result conforms to an assortment of varieties at rice shops inthe city. 71 cases (45.2%) of respondents prefer new crop, and 86 cases (54.8%) prefer old one.
3. Supply and Demand Balance
3.1 National Balance
With the yield growth and planted area expansion, Cambodia have achieved the rice self-sufficiencysince 1995. In the crop year 1999/2000, Cambodia produced 4.04 million ton of paddy; its largestever total, and the surplus was estimated to be 261 thousand ton.
Rice Balance ( Unit : 1000 tons )
Available volumeCrop Year Paddy
ProductionSeed &
Feed Loss (Paddy) (Rice)Demand(Rice)
Deficit/Surplus(Rice)
1994/95 2,223 156 222 1,845 1,144 1,467 -3221995/96 3,448 241 345 2,862 1,774 1,588 1871996/97 3,458 242 346 2,870 1,779 1,618 1621997/98 3,415 239 341 2,834 1,757 1,653 1041998/99 3,510 246 351 2,913 1,806 1,776 301999/00 4,041 283 404 3,354 2,079 1,819 2612000/01 4,026 282 403 3,342 2,072 1,981 91
Calculated based on the production data (Agricultural Statistics, MAFF) with under-mentioned norms.
Norms for assessment of food balance by MAFF:Post-harvest losses : 10 % of paddy productionSeed use : 5 % of paddy productionFeed and other uses : 2 % of paddy production *1
Milling yield from paddy to rice : 62 %Per capita rice consumption : 151.2 kg per annum
Nationwide self-sufficiency of rice has been achieved since 1995/96. However, even in surplusdistrict, there exist certain rice deficit communes. The vulnerable people must rely on internationalassistance (food aid) through WFP and NGOs.
*1 The norm for Feed and other uses (2%) did not applied to the MAFF’s food balance estimation in 1995/96
and 1994/95.

Country Report : Cambodia
B - 7
3.2 Regional Balance
The rice balance situation by Provinces in 1999/2000 is shown in the following table. Out of the13 main rice-producing Provinces, which have paddy production more than 100,000 tons , four (4)provinces are rice-deficit. The remaining nine (9) rice-producing Provinces are all rice-sufficient.
Province-wise Balance of Rice in 1999/2000
Area (ha) Yield Production Paddy Rice1 Phnom Penh Plain 6,596 1.84 12,110 660 1,399 10,051 6,232 1,052,743 159,175 -152,9432 Kandal Plain 87,674 2.81 246,331 8,767 33,109 204,455 126,762 1,132,491 171,233 -44,4713 Prey Veaeng Plain 297,225 1.94 577,380 29,723 68,432 479,225 297,120 996,985 150,744 146,3764 Kampong Cham Plain 197,243 2.34 460,935 19,724 58,635 382,576 237,197 1,696,135 256,456 -19,2585 Svay Rieng Plain 171,318 1.56 266,877 17,132 28,237 221,508 137,335 504,331 76,255 61,0806 Takev Plain 231,131 2.40 554,890 23,113 71,218 460,559 285,546 833,039 125,955 159,5917 Kampong Chhnang Tonle S. 92,966 1.66 154,300 9,297 16,934 128,069 79,403 439,879 66,510 12,8938 Bat Dambang Tonle S. 169,771 2.11 357,860 16,977 43,859 297,024 184,155 835,410 126,314 57,8419 Siem Reab Tonle S. 191,080 1.36 260,404 19,108 25,161 216,135 134,004 805,888 121,850 12,154
10 Kampong Spueu Plt/Mt. 85,303 1.82 155,388 8,530 17,886 128,972 79,963 630,917 95,395 -15,4321,530,307 1.99 3,046,475 153,031 364,870 2,528,574 1,567,716 8,927,818 1,349,886 217,830
11 Kampong Thum Tonle S. 100,964 1.52 153,070 10,096 15,926 127,048 78,770 599,643 90,666 -11,89612 Banteay Mean Chey Tonle S. 140,500 1.73 243,446 14,050 27,336 202,060 125,277 608,975 92,077 33,20013 Pousat Tonle S. 72,050 1.84 132,650 7,205 15,346 110,100 68,262 380,060 57,465 10,79714 Otdar Mean Cgey Tonle S. - - - - - - - - - -15 Krong Pailin Tonle S. - - - - - - - - - -16 Krong Preah Sihanouk Coastal 9,500 1.78 16,940 950 1,930 14,060 8,717 163,901 24,782 -16,06517 Kampot Coastal 135,607 2.28 308,795 13,561 38,934 256,300 158,906 556,869 84,199 74,70718 Kaoh Kong Coastal 7,272 1.30 9,460 727 881 7,852 4,868 139,149 21,039 -16,17119 Krong Kaeb Coastal 2,450 1.84 4,500 245 520 3,735 2,316 30,250 4,574 -2,25820 Preah Vihear Plt/Mt. 16,911 1.30 21,986 1,691 2,047 18,248 11,314 125,698 19,006 -7,69221 Stueng Traeng Plt/Mt. 13,466 1.40 18,852 1,347 1,858 15,647 9,701 85,421 12,916 -3,21422 Rotanak Kiri Plt/Mt. 17,618 1.30 22,905 1,762 2,132 19,011 11,787 99,356 15,023 -3,23623 Mondol Kiri Plt/Mt. 6,180 1.45 8,960 618 905 7,437 4,611 34,169 5,166 -55624 Kracheh Plt/Mt. 26,617 1.99 52,861 2,662 6,325 43,875 27,202 277,372 41,939 -14,736
549,135 1.81 994,425 54,914 114,139 825,373 511,731 3,100,863 468,850 42,8812,079,442 1.94 4,040,900 207,944 479,009 3,353,947 2,079,447 12,028,681 1,818,737 260,711
Note: *1 Deficit is probably supplied by Province of Siem Reab; *2 Deficit is probably supplied by Bat Dambang Province *3 Crop assesment for Wet season rice 1999/2000 and Dry season rice 2000Table does not include any provision for rice under so-called social safety nets such as the United Nations World Food Program (WFP) activities.
TotalDemand
Province RegionSupply of Rice Demand of Rice
Sub-total (Study Area)
Sub-total (Non Study Area)Total
BalamcePaddy Production *3 SeedReq't
P.H. Loss Availability Population
3.3 Seasonal Balance
Harvest volume is largest during the harvest peak of wet season crop in December and is smallestduring wet/flood season in July and August. Monthly balance is in deficit situation in 7 months ofthe year. Although about 60% of the production are harvested during harvest season of wet seasonrice (November – January), harvesting is practiced almost throughout the year. Paddy cultivationis subject to water resources, and if irrigation system and flood control systems are installed,monthly harvest quantity can be equalized more throughout the year.

Country Report : Cambodia
B - 8
Monhtly harvest volume and balance of Rice
-300,000
-200,000
-100,000
0
100,000
200,000
300,000
400,000
500,000
Jan Feb Mar Apr May Jun Jul Aug Sep. Oct Nov Dec
Ton
Monthly Balance Montly output of Rice Cumulative Balance
Data source : Agricultural statistic (1998/99), MAFFNote : Monthly harvest volume is assumed based on cropping calendars.
3.4 A Future View on Rice Balance
Population Increase: The population of Cambodia is likely to increase from about 12.2 million in1998 to 20.3 million in 2021. The percentage of urban population may increase from about 16% to18% during the period of 2001-2021, based on the population census in 1998 by NIS.
Balance prediction for the year 2005/06: Based on the above target value of paddy production forthe year 2005/06 with adopting the result of loss assessment survey for “milling yield of paddy torice” and “ratio of post-harvest loss”, 404 thousand ton of surplus milled rice is calculated. Thereis a difference of 134 to 171 thousand ton in the estimated surplus of milled rice calculated on theconventional conditions (milling yield 62% and post-harvest loss 10%) and on the conditions basedon the result of the study.
Prediction of Rice Balance for the year 2005/06 (Unit:1000 tons)
CASE-1 CASE-2
Items 1999/00 2005/06 1999/00 2005/06
1. Paddy production 4,041 4,800 4,041 4,800
2. Post harvest losses 404 480 283 336
3. Seed, Feed and other uses 283 336 283 336
4. Available milled rice 2079 2,470 2,224 2,641
6. Demand of milled rice 1,819 2,238 1,819 2,238
7. Balance of milled rice 261 233 405 404
CASE-1 : same as the present assumption of MAFF (Milling yield of paddy to rice=62%, Post
harvest losses =10%)
CASE-2 : assumption based on the results of the JICA Study in 2000 (Milling yield of paddy torice=64%, Post harvest losses=7%)

Country Report : Cambodia
B - 9
4. Rice Marketing
4.1 Trade Flows
Rice/paddy trade flows vary depending on crop conditions in the provinces and depending on theprices in neighboring countries. Trade flows are generated not only by quantity imbalance but alsoby needs for specific rice variety and quality. Rice flows to Phnom Penh are steady. Paddy flowto Vietnam is largely influenced by the rice export situation of Vietnam.
Only varieties of Somaly, Phaka Kagney and Neang Minh produced at the northwest productionareas, have an established reputation for high quality and marketed to many urban areas - PhnomPenh, Sihanouk Ville and other provincial towns. Other local varieties are marketed only withinthe province of origin and/or to neighbor ing provinces. Except the paddy flows to Thailand andVietnam, paddy movements in the country are limited. Most paddy is milled in the province oforigin or in a neighboring province. Thai fragrant broken rice constantly flows into Phnom Penhvia small corridors and via formal gates without leaving record.
To Order Mean Chey
R56 Border trade and contraband tradeBoeg Trakun To Oder Mean Chey
Main movementR68
Import of white rice from Thailand and supporting rice
Banteay Mean Chay
R5 Sisofon R6Puoypeat
Siem Reap
Tonle SapKompong Thom
Bat Dambang
R5
Pousat
R7
Kompong Chhnang Kompong Cham R7R6
Kaoh Kong R51
Phnom Penh
Kompong Spue Prey VengKandal R1
R4
TakeoSvay Rieng
R2
R3
Sihanouk Ville
Thai
Vietnam

Country Report : Cambodia
B - 10
Major Trade FlowsFrom To Kinds / Major variety
Phnom Penh Rice : Somely, Phaka Kagney,Neang MenhNorthwest main production area
(Bat Dambang, Banteay Mean Chey)Thailand Paddy : Somely, Domely
Phnom Penh Rice : IR, Phaka Kagney, SrovKrahome, Mixed-rice
Southeast main production area(Takeav, Prey Veang) Vietnam Paddy : IR
4.2 Marketing Channels
(1) Marketing Channel
Under the market economic policy, rice/paddymarketing is entrusted entirely in the hand of theprivate sector. Currently, the government has nomarket intervention or market control system for thedomestic marketing. Under this situation, farmer,middleman, commercial mill, wholesaler and retailerformulate various marketing channels. From thevarieties of the channels, a trunk form is abstractedas shown in the figure.
Prices prevailing in their immediate area ofoperation are well known by all agents exceptfarmers.
(2) Marketing Agents
Farmer: According to the questionnaire survey conducted in JICA Study, only 40% of farmers soldrice, regardless of quantity, during the 1998/99 – 1999/00. Average sales volume is 1.6 ton/yearand maximum is about 3 ton/year. Thus, the number of farmers involved in the marketing systemis limited. Farmers tend to sell part of the surplus paddy immediately to repay debts and store therest until they need more money. About 70% of farmers sold paddy to middlemen and about 20 %sold to commercial rice millers.
Middleman (Paddy Collector): Middlemen play an important role in the marketing of farmer’spaddy, especially in remote areas far from rice mills, markets or towns. The area for paddycollection is generally fixed within several districts. Large-scale middleman uses agents to visitindividual farmers and buy paddy.
: paddy : rice
Trunk Form of Marketing Channel
Farmer
Commercial Mill
Middleman
Retailer
Consumer
Wholesaler
Retailer
Consumer
Production Area
Thai/Vietnamtrader
Consumption Area

Country Report : Cambodia
B - 11
Commercial rice miller: Among the marketing agents, commercial rice millers have the largestbusiness scale and play the role of financial supplier to other agents; making advance payments tomiddlemen and deferred payments to rice sellers. They also play an important role in paddystorage. Scale of business varies from 200 ton/year to 10,000 ton/year in throughput. Except fora few commercial mills in Bat Dambang, which are formed as a company or partnership, almost allcommercial mills are family operation and categorized as Sole Proprietorship. Many of rice millshave regular business relations with select middlemen. Many of rice mills have regular businessrelations with selected middlemen to order a specific variety of paddy to middleman when theyreceive a large or urgent order.
Rice trader (seller): Rice sellers can be divided into a stall shop type in the markets and anindependent shop type. Most of all rice traders are small-scale businesses. Especially, a stallshop type in the markets sell only 50 to 300 kg/day and mostly are owned and managed byhousewives earning supplemental housekeeping money. Except Phonom Penh and Sihanoukvillle,the number of rice sellers in each provincial town is small due to small urban population.Combining the functions of retailer/wholesaler and direct purchase from rice millers is widelypracticed by rice sellers. Between rice miller - wholesaler – retailer, deferred payments are usual.It is common for retailers to settle payment when re-purchasing. Rice sellers in Phnom Penh arefacing the situation of “Too many rice shops and too small sales”.
Rice procurement by the WFP: The amount of rice procured by WFP was 16,352 tons fromoutside of the countries and 19,673 tons from domestic market in 1998. In 1999, it was 10,882tons (outside) and 13,037 tons (domestic). The domestic procurement accounts for 5 % of thenational surplus (260,710 ton, milled rice) in 1999/2000. WFP procures milled rice by tender.
Rice procurement by the Police and Army:Reportedly, the total rice supply for the army and police was 70,000 ton in 1999. A sole agentexclusively has been supplying rice to the army and police. The agent procures rice from rice millsdirectly.
(3) Prices
Price trend: Rice price tends to show a seasonal fluctuation pattern: decreasing during main harvestseason (Nov. – Jan.) and increasing during off-season (flood season) although the range and patternof fluctuation varies every year, due to the fluctuation of the international market price. Paddyprices and rice prices of Cambodia, Thailand and Vietnam show similar fluctuation. Especially,paddy prices in the Southeast region are largely influenced by the rice export situation of Vietnam.

Country Report : Cambodia
B - 12
0
200
400
600
800
1000
1200
1400
1600
1800
Jan-
98
Apr
-98
Jul-9
8
Oct
-98
Jan-
99
Apr
-99
Jul-9
9
Oct
-99
Jan-
00
Apr
-00
Jul-0
0
Oct
-00
Rie
l/kg
50
100
150
200
250
300
350
US
D/to
n
Paddy, PhakaKagney, Millbuying
Rice, PhakaKagney, selling
Paddy, IR, Millbuying
Thai Longgrain 15%broke (FOB,USD)
Price differences between Provinces: Price differences between provinces on the varieties whichare produced at Bat Dambang, such as Somaly, Phaka Kagney and Neang Menh, are small. Pricesof IR variety rice, which is always cheapest in the markets, are in the same level among severalprovinces. Prices of Mixed-rice, which is mixture of minor wet season varieties and it may havedifferent content of varieties depending on the province, are also in the same level (Riel 600-700/kg) among provincial towns.
Price difference among variety/grade: There is a definite price order among major marketedvarieties that is Somaly- Phaka Kagney- Neang Khon- Neang Menh- Mixed Rice – IR, and thisorder never change in the markets. In Phnom Penh, some rice shops have different grade of rice,in higher price variety such as Somaly. The price difference between grades is normally 100-200Riel/kg. Rice sellers explain the difference is: in appearance (clearness) which comes fromdifferent degrees of milling, broken rice ration, or production area (i.e. taste). Although it appearsthat some common scale/sense of quality evaluation exist among the traders, no numerical indicatoris used for grading the rice quality in domestic trade.
Margin: Farmers share account for 70 – 80% of the retail price. The cost/margin at milling stageand retail stage is stable: cost/margin of both stages account for 6 – 13% for Phaka Kagney and 8 –13% for Neang Menh.
4.3 Rice Milling
Rice mills in Cambodia are classified into two: Custom Mills (village mill) work for onlycommission processing and do not buy/sell the rice, Commercial Mills (large mill) have capacity of0.3 ton/hr. to more than 1.0 ton/hr. Most of the rice mills have storage facility and play a roll ofadjusting the seasonal imbalance of rice demand-supply. According the registration data on ricemills , about 60% of them were installed after 1995, although many of rice millers have notregistered yet due to the registration is not compulsory. Numbers of rice millers in 10 provinceswere 12,716 (Commercial mills 581, Custom mills 12,198) in 1999. The number of large-scalerice mills is increasing.
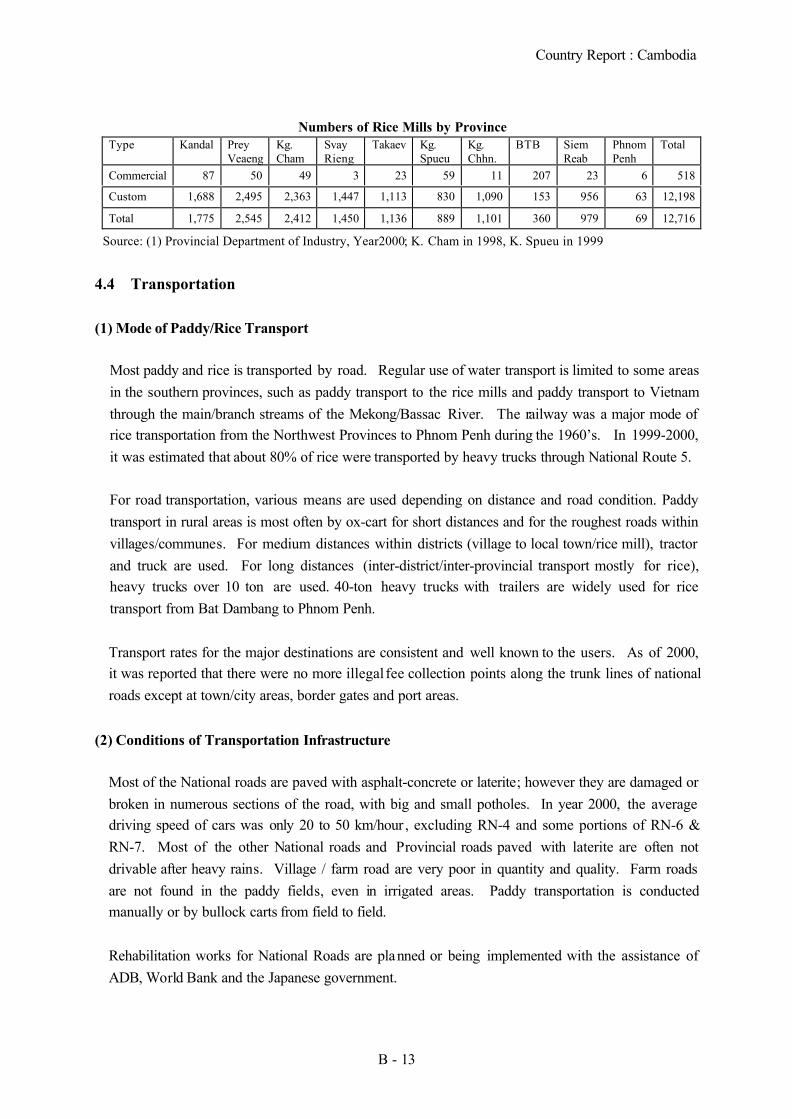
Country Report : Cambodia
B - 13
Numbers of Rice Mills by ProvinceType Kandal Prey
VeaengKg.Cham
SvayRieng
Takaev Kg.Spueu
Kg.Chhn.
BTB SiemReab
PhnomPenh
Total
Commercial 87 50 49 3 23 59 11 207 23 6 518
Custom 1,688 2,495 2,363 1,447 1,113 830 1,090 153 956 63 12,198
Total 1,775 2,545 2,412 1,450 1,136 889 1,101 360 979 69 12,716
Source: (1) Provincial Department of Industry, Year2000; K. Cham in 1998, K. Spueu in 1999
4.4 Transportation
(1) Mode of Paddy/Rice Transport
Most paddy and rice is transported by road. Regular use of water transport is limited to some areasin the southern provinces, such as paddy transport to the rice mills and paddy transport to Vietnamthrough the main/branch streams of the Mekong/Bassac River. The railway was a major mode ofrice transportation from the Northwest Provinces to Phnom Penh during the 1960’s. In 1999-2000,it was estimated that about 80% of rice were transported by heavy trucks through National Route 5.
For road transportation, various means are used depending on distance and road condition. Paddytransport in rural areas is most often by ox-cart for short distances and for the roughest roads withinvillages/communes. For medium distances within districts (village to local town/rice mill), tractorand truck are used. For long distances (inter-district/inter-provincial transport mostly for rice),heavy trucks over 10 ton are used. 40-ton heavy trucks with trailers are widely used for ricetransport from Bat Dambang to Phnom Penh.
Transport rates for the major destinations are consistent and well known to the users. As of 2000,it was reported that there were no more illegal fee collection points along the trunk lines of nationalroads except at town/city areas, border gates and port areas.
(2) Conditions of Transportation Infrastructure
Most of the National roads are paved with asphalt-concrete or laterite; however they are damaged orbroken in numerous sections of the road, with big and small potholes. In year 2000, the averagedriving speed of cars was only 20 to 50 km/hour , excluding RN-4 and some portions of RN-6 &RN-7. Most of the other National roads and Provincial roads paved with laterite are often notdrivable after heavy rains. Village / farm road are very poor in quantity and quality. Farm roadsare not found in the paddy fields, even in irrigated areas. Paddy transportation is conductedmanually or by bullock carts from field to field.
Rehabilitation works for National Roads are planned or being implemented with the assistance ofADB, World Bank and the Japanese government.

Country Report : Cambodia
B - 14
4.5 Policy on Rice Marketing and Prices
Currently, the government has no market intervention or market control system for the domesticmarketing.
Producer's priceRice prices are completely under market mechanism and there is no programs/subsidies to supportproducer's prices or guarantee minimum price, etc. There are no insurance institutions to protectfarmers from natural disaster.
Consumer’s priceThere is no mechanism to stabilize the price fluctuation (Market intervention)
Food subsidy (Rice procurement by the Police and Army)Rice for police and army is procured by the tender but its details are no clear. Reportedly, the totalrice supply for the army and police was 70,000 tons in 1999. Due to the demobilization, theamount of rice supply also is decreased.
5. Rice Trade
5.1 Rice Trade
Although some import/export statistics are available from various agents such as FTD/MOC,Custom Dept./MEF, Port Authority and CAMCONTROL, each figure is based on different sourcesand has no reliability.
Rice export data obtained from MOC are shown. During the 1996-2001, Singapore is a majordestination and it account for 57% of total export volume.
Export amount & turnover Year Q’ty (M/T) Turnover (USD) Average FOB (USD/ton)1996 16,310 4,314,070 2651997 10,947 3,234,815 2951998 3,080 808,840 2631999 7,390 1,632,310 2212000 12,800 2,413,866 1892001 6,020 2,049,395 340Source : Foreign Trade Department/MOCNote : Although several export-import data are available form Custom dept./MEF, FTD/MOC and
Camcontrol, each data shows different figures because data sources are different from each other.
Export costs by using a dry cargo 20-ft container was quoted at over USD21/ton (in 2000).Informal fee payments for port procedures were included in the quotation.

Country Report : Cambodia
B - 15
5.2 Paddy Trade
There is no statistics for paddy export to neighboring countries. Based on the Agricultural Statistic1999/2000 and other trade data obtained, the volume of paddy out-flow through informal border is
roughly assumed as 477 to 485 thousand ton.
Main reason for the paddy flow to Vietnam is lack of a domestic market for irrigated early rice(specially IR variety). The main reason for the paddy flow to Thailand is physical difficulty andhigh costs of transporting commodities within the northwest region and/or higher profit. Due tothis informal export, there is no trade data. This is a major hindrance to estimate the national foodbalance and to formulate policies and intervention measures.General agreement on trade cooperation between respective country was made and promotion ofbilateral trade and border trade is clearly stated in the agreements. But it seems that no definite
(written) agreements about paddy border trade exists.
Reportedly paddy trade is banned at Thai border. However, Thai local authority has someflexibility in border trade and admits the paddy import with a limitation of amount at a certain
formal gate.
Vietnam government allows Cambodian people with legal permanent residence in border areas inCambodian territory to conduct trade at border markets in Vietnam if they have border passes.Rice imports need the permit from the Ministry of Trade of Vietnam. According to the hearingfrom Vietnam traders, paddy import is legalized with import tax, but rice import is banned in bordertrade.
5.3 Policy on Rice Trade
Although export of processed agricultural produce is regarded as most important policy in thedevelopment of national economy, there is no concrete measure for export promotion about rice.
(1) Overseas (Rice) Trade
Ban on export of milled rice was removed in 1995 (Declaration No.02) and export license (issuedon request) was introduced. Thus, there is no restriction on rice export.
(2) Border (Paddy) Trade
Large quantity of paddy has been flowing out as informal border trade (without license) toneighboring countries (Vietnam and Thailand). On the other hand, the government did not want toexport paddy and took a stance for not issuing a license for paddy export even if there was anapplication. But in order to promote rice production in the country, Ministry of Commerce haspermitted the export both of milled rice and paddy without an export license in July 2001(Notification No. 2290 Moc/M2001).

Country Report : Cambodia
B - 16
Tax on Export / ImportExport duty on milled rice is 0%, import duty is 7% and VAT 10%.
Export subsidiesNone
Bilateral/Multilateral agreement on Rice tradeThough there are general trade agreements, there is no agreement specific on rice trade.
Quality Standard SystemIn June-2000 “Law on the Management of Quality and Safety of Products and Services” wasenacted as sub-decree but the quality standard as a measure is not enacted yet. Standard of rice(for export and for domestic distribution) has not established yet.
6. Rice Reservation
6.1 Policy on Rice Reserve
Although the food reserve policy is the foundation of food security, except for urgent rice reserve byASEAN, there is no measure accompanied by the clear numerical target as a national reserve by thegovernment.
6.2 Rice Reservation by the Government
After its official participation in 1999, Cambodia is obligated to allocate 3,000 tons of milled ricefor the ASEAN Food Security Reserve (AFSR). Ministry of Commerce is a responsible agencyfor the AFSR and Green Trade Company (GTC) under the Ministry of Commerce undertakes themanagement. Rice reserve by GTC is conducted in a form of paddy.
In FY 2001, actual reserved amount by GTC was 2,340 tons (equal to about 1,450 tons of milledrice) nearly equal to 50 % of the obligate amount due to tight situation of national finance. Foranother 50%, in October 2001, the Minister of Commerce has requested to commercial rice millersin the country through the Rice Millers Association to regularly keep stock at the volume of not lessthan one month of the handling volume (sales volume or processing volume) in either paddy or rice.
6.3 Rice Storage Facilities under the Government
Warehouses under MOC: Most of warehouses owned by MOC were constructed around the year1985, and they are old and less utilized. However, they are dispersed in whole provinces, having agood accessibility locating along the National Road or main roads or near main cities. Most ofthem are necessary to renovate to be utilized because the damages on doors, walls, floors and roofs.

Country Report : Cambodia
B - 17
Warehouses & facilities owned by GTC: GTC has 27 warehouses of 50,000 ton capacity inPhnom Penh, and three rice mills in Phnom Penh and Bat Dambang and one under construction inKampong Cham.
Warehouses owned by MOCBuilding Conditions (Number)
Province NumberCapacity
(ton)Usage
(Number) Good Fair PoorBat Dambang 13 43,438 1 N.A N.A N.AKg. Cham 17 36,369 0 2 10 5Kg. Chhnang 7 12,703 0 2 1 4Kg. Spueu 3 1,040 0 0 0 3Kandal 5 10,783 0 0 1 3 + (N.A)Siem Reab 15 21,154 0 9 6Svay Rieng 12 161,400 0 N.A N.A N.ATakeav 7 11,300 1 2 5 0
Source: Provincial Department of Commerce
7. Food Aids (Food distribution to the vulnerable people)
7.1 WFP
WFP financially supported by international donors, procures rice from both external and internalsources. It then distributes this rice with other basic commodit ies to deficit and vulnerable areas.Food-for-Work program accounts for 85 % of its activities.
Rice Procurement and Distribution by WFP (Unit: tons)
Year Foreignprocurement
DomesticProcurement Total Distribution
1998 16,352 19,673 36,025 28,8281999 10,882 13,037 23,919 27,474
Source : WFP
Japanese government provided 16,533 tons (1998), 10,859 tons (1999) and 14,772 tons (2000) ofrice in kind through the WFP and other IOs.
Although it may be cheaper to import rice from neighboring countries when the need arises, itwould be desirable for donors, including WFP, to purchase local rice surplus for internal transfers todeficit areas. Apart from cost savings, this would help support prices in surplus areas inCambodia .*1
7.2 The National Committee for Disaster Management (NCfDM)
The National Committee for Disaster Management (NCfDM) under the Council of Ministers isresponsible to implement the disaster relief scheme, which was established in 1996. NCfDM has
*1 Agricultural Strategies and Policy Framework for Sustainable Food Security and Poverty Alleviation, MAFF, FAO & UNDP, 2000
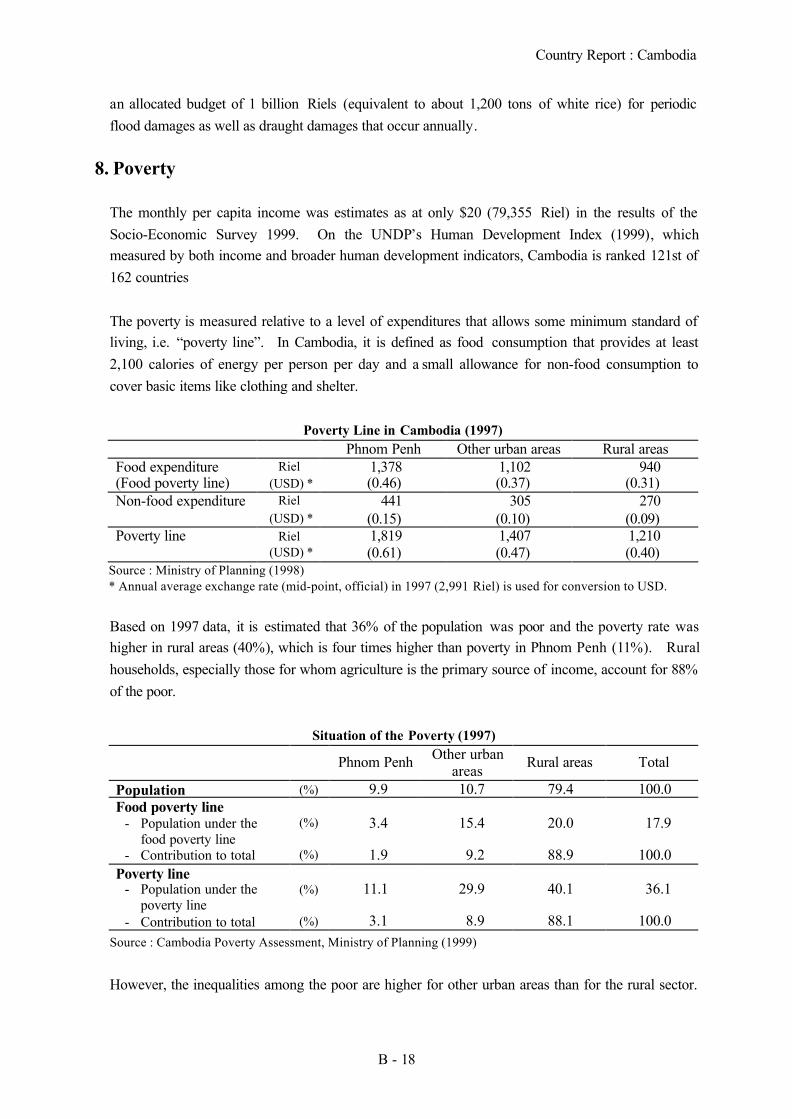
Country Report : Cambodia
B - 18
an allocated budget of 1 billion Riels (equivalent to about 1,200 tons of white rice) for periodicflood damages as well as draught damages that occur annually.
8. Poverty
The monthly per capita income was estimates as at only $20 (79,355 Riel) in the results of theSocio-Economic Survey 1999. On the UNDP’s Human Development Index (1999), whichmeasured by both income and broader human development indicators, Cambodia is ranked 121st of162 countries
The poverty is measured relative to a level of expenditures that allows some minimum standard ofliving, i.e. “poverty line”. In Cambodia, it is defined as food consumption that provides at least2,100 calories of energy per person per day and a small allowance for non-food consumption tocover basic items like clothing and shelter.
Poverty Line in Cambodia (1997)Phnom Penh Other urban areas Rural areas
Food expenditure Riel 1,378 1,102 940(Food poverty line) (USD) * (0.46) (0.37) (0.31)
Riel 441 305 270Non-food expenditure(USD) * (0.15) (0.10) (0.09)
Poverty line Riel 1,819 1,407 1,210(USD) * (0.61) (0.47) (0.40)
Source : Ministry of Planning (1998)* Annual average exchange rate (mid-point, official) in 1997 (2,991 Riel) is used for conversion to USD.
Based on 1997 data, it is estimated that 36% of the population was poor and the poverty rate washigher in rural areas (40%), which is four times higher than poverty in Phnom Penh (11%). Ruralhouseholds, especially those for whom agriculture is the primary source of income, account for 88%of the poor.
Situation of the Poverty (1997)
Phnom Penh Other urbanareas Rural areas Total
Population (%) 9.9 10.7 79.4 100.0Food poverty line
- Population under thefood poverty line
(%) 3.4 15.4 20.0 17.9
- Contribution to total (%) 1.9 9.2 88.9 100.0Poverty line
- Population under thepoverty line
(%) 11.1 29.9 40.1 36.1
- Contribution to total (%) 3.1 8.9 88.1 100.0Source : Cambodia Poverty Assessment, Ministry of Planning (1999)
However, the inequalities among the poor are higher for other urban areas than for the rural sector.

Country Report : Cambodia
B - 19
Some urban areas outside Phnom Penh have a significant minority of their population with very lowliving standards. A particular characteristic of urban poverty is the presence of about 35,000squatters families in all seven wards of Phnom Penh. There are approximately 170,000 squattersliving legally or illegally in the capital, of which more than 50% are children.*1
By type of employment of household head, poverty rate was highest in households headed byfarmers (43.6%) and households headed by civil servants were second lowest (18%).
Distribution of poverty by employment of household head (June 1997)
Population Population underthe poverty line
Contribution tototal
(%) (%) (%)Agriculture 59.1 43.6 71.3Manufacturing and mining 4.7 28.9 3.8Construction and utilities 2.0 37.8 2.1Trade 6.8 18.7 3.5Transportation andcommunications
3.6 19.9 2.0
Government service 4.7 18.0 2.4Education and health services 3.0 17.0 1.4Other services 1.8 26.5 1.3Employed, industry not reported 2.3 33.6 2.1Unemployed 0.4 27.0 0.3Not in labor force 9.7 31.2 8.4Not reported 1.9 27.1 1.4Total 100.0 36.1 100.0
Source : Cambodia Poverty Assessment, Ministry of Planning (1999)
In Cambodia, rice accounts for an estimated 75% of daily calorie intake, and rice availability is acritical element of overall food security. Although there has been an overall rice surplus since1995, yet food insecurity in rural areas remains a major aspect of poverty in Cambodia. Accordingthe 1997’s data of food poverty line, 20% of rural population were unable to secure enough food tomeet the nutritional norm of 2,100 calories a day.
The most important contributors to food insecurity in Cambodia are low incomes and high levels ofindebtedness, high variation in food production over time and across regions, and inadequatedistribution and marketing infrastructure linking food deficit and surplus areas. Low incomes limitpurchasing power and effective access to adequate food supplies.*2
9. National Food Security Policy
As described in the prior section, 44 % of the agricultural farm households live on the expenditurelevel under the poverty line. Taking a fact that 75% of the nation labor force is engaged in
*1 Interim Poverty Reduction Strategy Paper, Oct. 2000
*2 Cambodia Poverty Assessment, Ministry of Planning 1999

Country Report : Cambodia
B - 20
agriculture into account, agriculture development for up-raising of farmers’ income will greatlycontribute to poverty alleviation in Cambodia.
The Agricultural Development Plan (2001-2005) has set a development target in conformity with itspolitical line: “to assure food security and natural resource conservation”. The basic targets for thedevelopment of agriculture, forestry and fisheries until year 2005 has set as:
- Continues to focus the attention upon the food security, especially at community and familylevels, and on reducing poverty because there is a large number of poor people in theagricultural sector. Accelerate and increase in food production, especially the rice crop andother alternative food crops.
- Help promote the national economic growth through exporting agricultural produce, which aresurplus to domestic consumption.
- Improve quality of agriculture produce and increase value added by promoting thedevelopment of processing agro-industry, and create new jobs for rural areas.
- Improve family income, reduce poverty through the production of various crops that yieldhighly with low cost of production.
- Manage natural resources effectively by law and technical measures in order to assuresustainable exploitation.

Country Report : Cambodia
B - 21
References
1. Final Report, The Study on Improvement of marketing System and Post-harvest QualityControl of Rice in Cambodia, MOC, MAFF & JICA, September 2001
2. Agricultural Statistics 2000 – 2001, MAFF3. Agricultural Statistics 1999 – 2000, MAFF4. Agricultural Statistics 1998 – 1999, MAFF5. Agricultural Statistics 1997 – 1998, MAFF6. Agricultural Statistics 1996 – 1997, MAFF7. Agricultural Statistics 1995 – 1996, MAFF8. Price Bulletin for Agricultural Commodities, 20009. Price Bulletin for Agricultural Commodities, 199910. Price Bulletin for Agricultural Commodities, 199811. Report on the Cambodia Socio-Economic Survey 1999, Ministry of Planning12. Analysis of Census Results, Report 6 Population Projections 2001-2021, Ministry of Planning13. Country Position Paper on Food Security in the Policy Framework of Poverty Alleviation in
Cambodia (World Food Summit, Nov. 2001) Council for Agricultural and Rural Development14. Report on the Results of the Agricultural, Forestry and Fishery Activities for the 1st Five-year
(1996-2000) and the 2nd Five-year Development Targets (2001-2005), MAFF15. Rice Production in Cambodia, Cambodia-IRRI-Australia Project, 199716. Agricultural Strategies and Policy Framework for Sustainable Food Security and Poverty
Alleviation, MAFF, FAO & UNDP, 200017. Cambodia Poverty Assessment, Ministry of Planning, 199918. Interim Poverty Reduction Strategy Paper, Oct. 2000

Country Report : Cambodia
B - 22
Annexes
1. Cambodia at a glance & Social Indicators (World Bank Data)
2. Annual and Monthly Statistic Data for Production of paddy
3. Rice crop damage, 1995 – 1999
4. Cause of Damage, Selected provinces
5. Destroyed area of wet season rice
6. Ploughed area by tractor in 2000
7. Monthly paddy/rice prices, 1998 - 2000
8. Rice export by grade, 1996 - 2000
9. Rice export by destination, 1996 – 2001
10. Rice import, 1996 - 2000
11. Rice cropping pattern in each ecosystem

Cambodia at a glance 9/7/01
EastPOVERTY and SOCIAL Asia & Low-
Cambodia Pacific income2000Population, mid-year (millions) 12.0 1,853 2,459GNI per capita (Atlas method, US$) 260 1,060 420GNI (Atlas method, US$ billions) 3.1 1,964 1,030
Average annual growth, 1994-00
Population (%) 2.5 1.1 1.9Labor force (%) 2.7 1.4 2.4
Most recent estimate (latest year available, 1994-00)
Poverty (% of population below national poverty line) 36 .. ..Urban population (% of total population) 16 35 32Life expectancy at birth (years) 54 69 59Infant mortality (per 1,000 live births) 100 35 77Child malnutrition (% of children under 5) 47 13 ..Access to an improved water source (% of population) 30 75 76Illiteracy (% of population age 15+) 60 14 38Gross primary enrollment (% of school-age population) 113 119 96
Male 123 121 102Female 104 121 86
KEY ECONOMIC RATIOS and LONG-TERM TRENDS
1980 1990 1999 2000
GDP (US$ billions) .. 1.1 3.0 3.2
Gross domestic investment/GDP .. 8.2 15.8 15.0Exports of goods and services/GDP .. 6.1 37.2 40.1Gross domestic savings/GDP .. 1.6 3.9 5.3Gross national savings/GDP .. 5.6 3.7 5.0
Current account balance/GDP .. -4.5 -9.4 -10.4Interest payments/GDP .. 2.6 0.4 0.5Total debt/GDP .. 166.4 75.1 74.0Total debt service/exports .. 34.1 2.9 1.0Present value of debt/GDP .. .. 62.1 ..Present value of debt/exports .. .. 163.0 ..
1980-90 1990-00 1999 2000 2000-04(average annual growth)GDP .. 4.8 5.0 5.0 6.0GDP per capita .. 2.0 2.7 2.7 4.0Exports of goods and services .. 15.1 19.1 5.0 5.0
STRUCTURE of the ECONOMY1980 1990 1999 2000
(% of GDP)Agriculture .. 55.6 39.6 37.1Industry .. 11.2 18.8 20.5
Manufacturing .. 5.2 .. ..Services .. 33.2 41.6 42.4
Private consumption .. 91.2 89.8 ..General government consumption .. 7.2 6.3 ..Imports of goods and services .. 12.8 49.1 46.9
1980-90 1990-00 1999 2000(average annual growth)Agriculture .. 1.9 1.1 1.0Industry .. 8.3 7.5 4.7
Manufacturing .. 8.2 .. ..Services .. 6.9 8.1 9.3
Private consumption .. 1.5 1.7 ..General government consumption .. -0.8 9.9 ..Gross domestic investment .. 13.4 16.7 ..Imports of goods and services .. 10.3 22.6 5.0
Note: 2000 data are preliminary estimates.
* The diamonds show four key indicators in the country (in bold) compared with its income-group average. If data are missing, the diamond willbe incomplete.
0
10
20
30
40
95 96 97 98 99 00
GDI GDP
Growth of investment and GDP (%)
Cambodia
Low-income group
Development diamond*
Life expectancy
Access to improved water source
GNIpercapita
Grossprimary
enrollment
-25
0
25
50
75
95 96 97 98 99 00
Exports Imports
Growth of exports and imports (%)
Cambodia
Low-income group
Economic ratios*
Trade
Domesticsavings
Investment
Indebtedness
Kondo
B-23

Cambodia
PRICES and GOVERNMENT FINANCE1980 1990 1999 2000
Domestic prices(% change)Consumer prices .. .. 4.0 -0.8Implicit GDP deflator .. 145.6 1.6 1.5
Government finance(% of GDP, includes current grants)Current revenue .. 6.8 14.6 15.6Current budget balance .. -0.4 1.8 1.5Overall surplus/deficit .. -1.6 -4.4 -5.5
TRADE1980 1990 1999 2000
(US$ millions)Total exports (fob) .. 86 971 1,396
Rubber .. 17 111 49Logs and sawn timber .. 8 37 11Manufactures .. .. .. ..
Total imports (cif) .. 164 1,337 1,885Food .. .. .. ..Fuel and energy .. .. .. ..Capital goods .. .. .. ..
Export price index (1995=100) .. .. .. ..Import price index (1995=100) .. .. .. ..Terms of trade (1995=100) .. .. .. ..
BALANCE of PAYMENTS1980 1990 1999 2000
(US$ millions)Exports of goods and services .. 88 1,131 1,600Imports of goods and services .. 183 1,407 1,919Resource balance .. -95 -276 -319
Net income .. 0 -76 -81Net current transfers .. 45 70 70
Current account balance .. -50 -282 -330
Financing items (net) .. .. 377 392Changes in net reserves .. .. -95 -62
Memo:Reserves including gold (US$ millions) .. .. 422 484Conversion rate (DEC, local/US$) .. 537.0 3,807.8 3,840.8
EXTERNAL DEBT and RESOURCE FLOWS1980 1990 1999 2000
(US$ millions)Total debt outstanding and disbursed .. 1,854 2,262 2,357
IBRD .. 0 0 0IDA .. 0 180 207
Total debt service .. 30 33 16IBRD .. 0 0 0IDA .. 0 1 1
Composition of net resource flowsOfficial grants .. 23 220 271Official creditors .. 0 38 78Private creditors .. 0 -3 0Foreign direct investment .. .. 146 110Portfolio equity .. 0 .. ..
World Bank programCommitments .. 0 80 37Disbursements .. 0 27 37Principal repayments .. 0 0 0Net flows .. 0 27 37Interest payments .. 0 1 1Net transfers .. 0 26 35
The World Bank Group: http://www.worldbank.org/data/ 9/7/01
-20
-15
-10
-5
0
94 95 96 97 98 99 00
Current account balance to GDP (%)
0
500
1,000
1,500
2,000
94 95 96 97 98 99 00
Exports Imports
Export and import levels (US$ mill.)
-5
0
5
10
15
20
95 96 97 98 99 00
GDP deflator CPI
Inflation (%)
G: 100
D: 174
C: 73B: 207
E: 1,803
Composition of 2000 debt (US$ mill.)
A - IBRDB - IDAC - IMF
D - Other multilateralE - BilateralF - PrivateG - Short-term
Kondo
B-24

Cambodia Social IndicatorsLatest single year Same region/income group
East
Asia & Low-1970-75 1980-85 1993-99 Pacific income
POPULATION Total population, mid-year (millions) 7.1 7.8 11.8 1,836.6 2,417.1 Growth rate (% annual average for period) 0.5 2.7 2.6 1.2 1.9Urban population (% of population) 10.3 12.6 15.6 34.5 31.4Total fertility rate (births per woman) 4.7 5.0 4.4 2.1 3.7
POVERTY(% of population)National headcount index .. .. 36.1 .. .. Urban headcount index .. .. 21.1 .. .. Rural headcount index .. .. 40.1 .. ..
INCOMEGNI per capita (US$) .. .. 260 1,010 420Consumer price index (1995=100) .. .. 136 136 138Food price index (1995=100) .. .. .. .. ..
INCOME/CONSUMPTION DISTRIBUTIONGini index .. .. 40.4 .. ..Lowest quintile (% of income or consumption) .. .. 6.9 .. ..Highest quintile (% of income or consumption) .. .. 47.6 .. ..
SOCIAL INDICATORSPublic expenditure Health (% of GDP) .. .. 0.6 1.7 1.2 Education (% of GNI) 5.8 .. 2.9 2.9 3.3 Social security and welfare (% of GDP) .. .. .. .. ..Net primary school enrollment rate(% of age group) Total .. .. 100 100 .. Male .. .. .. 100 .. Female .. .. 92 100 ..Access to an improved water source(% of population) Total .. .. 30 75 76 Urban .. .. 53 93 88 Rural .. .. 25 66 70Immunization rate(% under 12 months) Measles .. .. 63 83 64 DPT .. .. 64 82 70Child malnutrition (% under 5 years) .. .. 47 12 ..Life expectancy at birth(years) Total 35 47 54 69 59 Male 34 46 52 67 58 Female 36 49 55 71 60Mortality Infant (per 1,000 live births) 230 142 100 35 77 Under 5 (per 1,000 live births) 244 330 143 44 116 Adult (15-59) Male (per 1,000 population) 509 473 364 184 288 Female (per 1,000 population) 406 355 315 141 258 Maternal (per 100,000 live births) .. .. 470 .. ..Births attended by skilled health staff (%) .. 100 31 .. ..
Note: 0 or 0.0 means zero or less than half the unit shown. Net enrollment ratios exceeding 100 indicate discrepanciesbetween the estimates of school-age population and reported enrollment data. Latest year for access to improved watersource data is 2000.
2001 World Development Indicators CD-ROM, World Bank
Kondo
B-25

B - 26
2. Annual and Monthly Statistic Data for Production of paddy
Transition of Production, Cultivation area, Yield for the last 6 years
Cropping year 1995-1996
1996-1997
1997-1998
1998-1999
1999-2000
2000-2001
Planning area 2,345,000 2,297,000 2,358,000 2,370,000 2,370,000 2,395,000Planted area 2,085,991 2,170,900 2,076,011 2,104,013 2,157,592 2,318,495Damaged area 161,950 288,900 147,422 141,447 78,150 415,336Harvested area 1,924,041 1,882,000 1,928,589 1,962,566 2,079,442 1,903,159Yield 1.792 1.837 1.771 1.788 1.943 2.115Production 3,447,827 3,458,000 3,414,918 3,509,870 4,040,900 4,026,092Remaining paddy 2,930,653 2,870,140 2,834,382 2,913,192 3,353,947 3,341,656Available for consumption 1,817,005 1,779,487 1,757,317 1,806,179 2,079,447 2,071,827Requirement to eat 1,587,600 1,617,840 1,653,265 1,776,110 1,818,737 1,980,642Surplus (milled rice) 229,405 161,647 104,052 30,069 260,710 91,185
Totalof crop-pingyear
Surplus (paddy) 370,000 260,721 167,825 48,499 420,500 147,072Planning area 2,185,000 2,127,000 2,128,000 2,130,000 2,130,000 2,135,000Planted area 1,869,991 1,936,900 1,827,328 1,873,093 1,915,592 2,058,648Damaged area 160,950 287,900 142,422 127,697 69,150 410,836Harvested area 1,709,041 1,649,000 1,684,906 1,745,396 1,846,442 1,647,812Yield 1.640 1.673 1.586 1.647 1.805 1.949
Wetseasoncrops
Production 2,802,827 2,759,000 2,672,597 2,873,905 3,332,900 3,212,269Planning area 160,000 170,000 230,000 240,000 240,000 260,000Planted area 216,000 234,000 248,683 230,920 242,000 259,847Damaged area 1,000 1,000 5,000 13,750 9,000 4,500Harvested area 215,000 233,000 243,683 217,170 233,000 255,347Yield 3.000 3.000 3.046 2.928 3.039 3.187
Dryseasoncrops
Production 645,000 699,000 742,321 635,965 708,000 813,823
Source: AGRICULTURAL STATISTICS, Department of Agronomy & Agricultural Land Improvement, MAFF
Production transition of paddy by cropping year for the last 6 years
1.792
1.8371.771
1.788
1.943
2.1153,447,827 3,458,000 3,414,918
3,509,870
4,040,900 4,026,092
260,721420,500370,000
167,825 48,499147,072
0
500,000
1,000,000
1,500,000
2,000,000
2,500,000
3,000,000
3,500,000
4,000,000
4,500,000
1995-1996 1996-1997 1997-1998 1998-1999 1999-2000 2000-2001Cropping year
Prod
uctio
n (t
on),
Are
a (h
a), s
urpl
us (t
on)
1 .00
1.20
1.40
1.60
1.80
2.00
2.20
2.40
Yie
ld (t
on/h
a)
Planning area
Planted area
Damaged area
Harvested area
Yeild
Production
RemainingpaddyAbailable forconsumptionRequirementto eatSurplus(milled rice)Surplus(paddy)

B - 27
Production transition of paddy by wet season crops for the last 6 years
Production transition of paddy by dry season crops for the last 6 years
2 ,802 ,827 2,759,0002,672,597
2 ,873 ,905
3,332 ,9003,212,269
1.6401.673
1.586
1.647
1.805
1.949
0
500,000
1,000,000
1,500,000
2,000,000
2,500,000
3,000,000
3,500,000
1995-1996 1996-1997 1997-1998 1998-1999 1999-2000 2000-2001Coropping year
Prod
ucti
on (t
on),
Are
a (h
a)
1 . 0 0
1 . 2 0
1 . 4 0
1 . 6 0
1 . 8 0
2 . 0 0
2 . 2 0
2 . 4 0
Yie
ld (t
on/h
a)
Planning area
Planted area
D a m a g e d a r e a
Harvested area
Produc t ion
Yeild
3.0003.000
3.046
2.928
3.039
3.187
645,000
699,000742,321
635,965
708,000
813 ,823
0
100,000
200,000
300,000
400,000
500,000
600,000
700,000
800,000
900,000
1995-1996 1996-1997 1997-1998 1998-1999 1999-2000 2000-2001Cropping year
Prod
uctio
n (t
on),
Are
a (h
a)
2 .40
2.60
2.80
3.00
3.20
3.40
3.60
3.80
Yei
eld
(ton
/ha)
Planning area
Planted area
Damaged area
Harvested area
Yeild
Production

3. Rice Crop Damage (1995 - 2000)Wet Season Rice unit 1995/1996 1996/1997 1997/1998 1998/1999 1999/2000Cultivated Area ha 1,869,991 1,936,900 1,827,328 1,873,093 1,915,592Destoryed Area ha 160,950 287,900 142,422 127,697 69,150Harvested Area ha 1,709,041 1,649,000 1,684,906 1,745,396 1,846,442Destroyed ratio % 9% 15% 8% 7% 4%Production 1000 ton 2,803 2,759 2,673 2,874 3,333Yield ton/ha 1.64 1.67 1.60 1.65 1.81
Dry Season Rice unit 1995/1996 1996/1997 1997/1998 1998/1999 1999/2000Cultivated Area ha 216,000 234,000 248,683 230,920 242,000Destoryed Area ha 1,000 4,000 4,900 13,750 9,000Harvested Area ha 215,000 230,000 243,783 217,170 233,000Destroyed ratio % 0.5% 2% 2% 6% 4%Production 1000 ton 645 699 742 636 708Yield ton/ha 3.00 3.04 3.05 2.93 3.04Source : Agricultural Statictics, MAFF
4. Cause of Damage, Selected provincesCrop Year Province
1997/1998 Flood 4% 0% 69% 67% 7%Draught 94% 100% 21% 33% 93%
2% 0% 10% 0% 0%1998/1999 Flood 8% 47% 9% 0% 22%
Draught 91% 44% 68% 100% 11%2% 9% 23% 0% 67%
1999/2000 Flood 65% 78% 67% 39% 33%Draught 3% 20% 20% 39% 42%
32% 2% 13% 22% 26%Source : Agricultural Statictics, MAFF
Insect+Rodent
Insect+Rodent
Insect+Rodent
BatDambangCause of damage
BanteayMeanChey
KampongThum Takev
PreyVeaeng
B - 28

5. Destroyed Area of Wet Season Rice Unit : ha
Crop YearProvince Region Area* Cultivated Cultivated Cultivated
(sq.km) area Total Flood Rodent Draught Insect area Total Flood Rodent Draught Insect area Total Flood Rodent Draught Insect1 Phnom Penh Plain 290 7,530 2,134 2,134 7,980 1,580 0 0 1,580 0 7,845 156 76 802 Kandal Plain 3,568 45,143 2,469 1,869 165 435 44,150 1,950 950 1,000 42,891 4,868 4,343 5253 Prey Veaeng Plain 4,883 241,308 1,083 353 63 450 217 204,112 2,312 500 80 262 1,470 177,507 17,031 1,241 15,7904 Kampong Cham Plain 9,799 168,374 1,131 1,063 50 18 160,500 400 30 190 180 146,937 3,117 2,837 180 1005 Svay Rieng Plain 2,966 167,878 5,560 2,465 80 1,815 1,200 154,800 5,400 1,700 100 3,200 400 151,681 792 727 656 Takev Plain 3,563 176,102 2,971 1,147 660 1,164 170,648 8,648 8,648 170,648 8,619 5,745 2,835 397 Kampong Spueu Plt/Mt. 7,017 86,598 2,295 1,756 539 83,645 45 45 81,931 2,563 138 2,4258 Kampong Chhnang Tonle S. 5,521 83,561 495 495 76,714 414 150 184 80 84,110 483 386 979 Bat Dambang Tonle S. 11,702 184,154 15,583 10,099 470 5,014 202,033 33,333 2,500 30,233 600 193,065 56,422 2,352 53,070 1,000
10 Siem Reab Tonle S. 10,299 182,630 1,550 1,150 320 80 182,000 1,200 50 850 300 178,820 8,645 7,970 67511 Kampong Thum Tonle S. 13,814 108,887 9,723 6,536 173 1,914 1,100 121,702 11,502 1,021 1,050 7,839 1,592 127,501 9,248 6,338 1,967 94312 Banteay Mean Chey Tonle S. 6,679 145,700 5,500 4,300 1,100 100 157,500 32,800 15,500 14,400 2,900 149,250 20,000 20,00013 Pousat Tonle S. 12,692 76,404 4,454 4,454 77,147 6,647 0 6,647 76,028 1,500 1,50014 Otdar Mean Chey Tonle S. 6,158 0 0 015 Krong Pailin Tonle S. 803 0 0 016 Krong Preah Sihanouk Coastal 868 9,523 23 23 9,645 166 130 36 9,450 1,700 1,70017 Kampot Coastal 4,873 135,890 2,783 2,783 130,535 13,635 13,635 136,500 018 Kaoh Kong Coastal 11,160 7,514 242 242 7,115 0 7,340 019 Krong Kaeb Coastal 336 2,500 50 30 10 10 2,594 0 2,594 020 Preah Vihear Plt/Mt. 13,788 17,425 514 477 37 15,000 1,020 854 166 15,755 021 Stueng Traeng Plt/Mt. 11,092 17,110 3,644 2,779 865 16,000 873 194 679 14,262 5,349 4,948 172 22922 Rotanak Kiri Plt/Mt. 10,782 18,822 1,204 1,089 115 17,423 1,075 542 533 19,883 944 225 71923 Mondol Kiri Plt/Mt. 14,288 7,602 1,422 887 535 5,000 747 222 525 6,185 024 Kracheh Plt/Mt. 11,094 24,937 4,320 4,302 5 13 23,850 3,950 15 3,935 27,145 985 985
178,035 1,915,592 69,150 50,433 1,196 9,119 8,402 1,870,093 127,697 23,320 1,310 92,727 10,340 1,827,328 142,422 39,008 0 98,486 4,928
Note: * Not including Tonle Sap Lake (3,000 sq.km) Data Source: General Population Census of Cambodia, 1998Source : Agricultural Statistics, MAFF
Total
1999/2000 1998/1999 1997/1998Destroyed areaDestroyed areaDestroyed area
B-29

6. Ploughed Area by Tractor in 2000
Province State-own Private-own State-own Private-own(unit) (unit) (unit) (unit) (ha)
Phnom Penh 5 2 122Kandal 25 4,865Kampong Cham 1 195 263 32,588Svay Rieng 20 3,380Prey Veaeng 8 132 278 9,151Takev 82 85Kampong Thum 150 1 17,016Siem Reab 14 34 24 5,487Bat Dambang 32 693 1 2,599 121,115Banteay Mean Chey 658 1,625 87,000Pousat 45 25 11,012Kampong Chhnang 40 94 2,100Sihanouk Ville 10Kampot 2 10 20Kampong Spueu 10 15 15Total 57 2,109 2 5,030 293,851Source : Agricultural Statistics 2000-2001, MAFF
Power TillerTractor PloughedArea
B - 30

7. Monthly Paddy / Rice Prices, 1998 - 2000
Thailand 2/
Place Bat Dambang Phnom Penh Takeo Bangkok
Type / VarietyPaddy/Phaka
KagneyMilled rice,/Phaka
Kagney Paddy/IRWhite rice/Longgrain 15% broke
Kind of price Mill buying priceWholesaler selling
price Mill buying price FOB Bangkok
Unit (Riel/kg) (Riel/kg) (Riel/kg) (US$/ton)1998-Jan. 553 1220 441 2781998-Feb. 461 1180 413 2791998-Mar. 524 1245 415 2781998-Apr. 578 1320 478 2961998-May. 761 1490 537 2991998-Jun. 812 1470 599 3111998-Jul. 736 1470 648 3041998-Aug. 703 1490 626 3051998-Sep. 745 1540 668 3041998-Oct. 714 1500 621 2821998-Nov. 536 1400 549 2601998-Dec. 535 1300 495 2611999-Jan. 448 1100 2831999-Feb. 436 1115 2631999-Mar. 563 1110 2391999-Apr. 599 1100 424 2211999-May. 1300 413 2291999-Jun. 506 1300 2401999-Jul. 525 1276 395 2411999-Aug. 570 1250 400 2371999-Sep. 480 1230 374 2171999-Oct. 446 1160 358 2051999-Nov. 383 1150 394 2161999-Dec. 377 1100 386 2212000-Jan. 417 1023 2282000-Feb. 388 1000 2252000-Mar. 434 977 2092000-Apr. 402 962 2002000-May. 383 980 288 1862000-Jun. 406 989 290 1832000-Jul. 470 1028 319 1782000-Aug. 461 1015 345 1752000-Sep. 481 930 336 1702000-Oct. 517 965 359 1762000-Nov. 523 950 348 1732000-Dec. 424 1067 299 173
Source : 1/ Price Bulletin for Agricultural Commodities, 1998, 1999 and 2000, MAFF2/ USDA Rice Outlook
Cambodia 1/
B - 31

8. Rice Export 1996 - 2000 by GradeYear 1996 1997 1998 1999 2000
MT USD MT USD MT USD MT USD MT USD MT %White rice 100% 3,050 670,990 400 58,800 3,450 6.8%4% Broken 500 164,525 500 1.0%5% Broken 10,620 3,242,670 7,216 2,337,730 1,880 507,840 1,920 412,400 1,380 419,341 23,016 45.5%10% Broken 240 100,800 400 108,000 120 24,000 760 1.5%15% Broken 200 35,600 200 0.4%30% Broken 500 120,000 500 1.0%35% Broken 490 135,400 1,186 313,260 700 181,000 1,820 404,320 10,400 1,747,200 14,596 28.9%Broken 5,200 936,000 2,315 483,125 7,515 14.9%
16,310 4,314,070 10,957 3,234,915 3,080 808,840 7,390 1,631,310 12,800 2,413,866 50,537 100.0%Source : Export Office, MOC
9. Rice Export 1996 - 2001 by DistentionYear 1996 1997 1998 1999 2000 2001
MT USD MT USD MT USD MT USD MT USD MT USD MT %China 750 217,500 750 1.3%Hong Kong 1,526 442,540 1,100 419,000 2,626 4.6%Philippine 450 126,000 450 0.8%Singapore 13,584 3,528,030 8,757 2,374,815 2,280 618,840 6,390 1,366,560 1,600 333,000 32,611 57.7%Australia 240 100,800 500 150,000 740 1.3%Israel 215 92,450 215 0.4%Netherlands 420 159,600 420 0.7%Spain 215 88,150 215 0.4%Thailand 800 190,000 800 1.4%Malaysia 500 114,750 1,200 400,866 6,000 2,049,375 7,700 13.6%USA 10,000 1,680,000 10,000 17.7%Belgium 20 20 20 0.04%
Total 16,310 4,314,070 10,947 3,234,815 3,080 808,840 7,390 1,631,310 12,800 2,413,866 6,020 2,049,395 56,547 100.0%Source : Export Office, MOC
10. Rice Import 1996 - 2000Year 1996 1997 1998 1999 2000
MT USD MT USD MT USD MT USD MT USD
Rice 25,966 7,566,025 19,755 3,783,502 33,419 9,122,039 34,169 6,272,134 60,646 8,493,626Source : Export Office, MOC
173,956
1996 - 2000
1996 - 2001
1996 - 2000MT
B-32
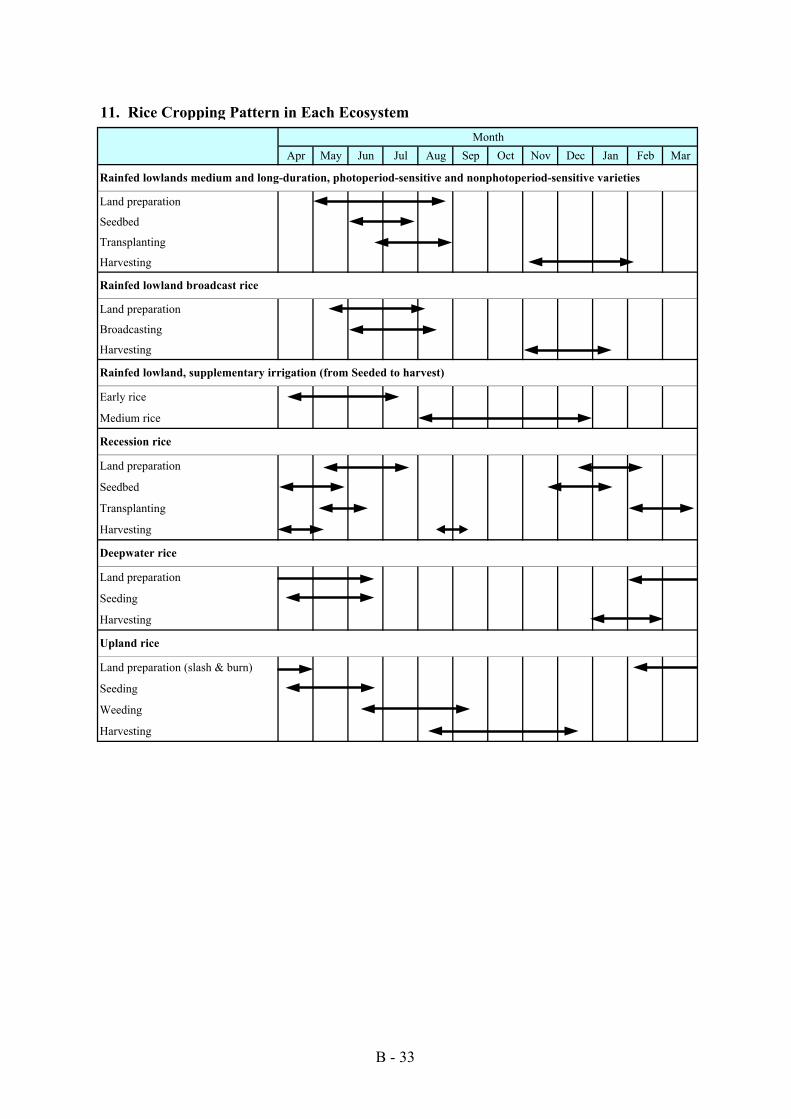
Month
Apr May Jun Jul Aug Sep Oct Nov Dec Jan Feb Mar
Land preparation
Seedbed
Transplanting
Harvesting
Land preparation
Broadcasting
Harvesting
Early rice
Medium rice
Land preparation
Seedbed
Transplanting
Harvesting
Land preparation
Seeding
Harvesting
Land preparation (slash & burn)
Seeding
Weeding
Harvesting
Recession rice
Deepwater rice
Upland rice
11. Rice Cropping Pattern in Each Ecosystem
Rainfed lowlands medium and long-duration, photoperiod-sensitive and nonphotoperiod-sensitive varieties
Rainfed lowland broadcast rice
Rainfed lowland, supplementary irrigation (from Seeded to harvest)
B - 33
COUNTRY REPORT
Indonesia
Country Report : Indonesia
C - 1
1 Production
1.1 Production Status
Rice production momentum has been badly compromised in the 1990s. The culmination of thiswas the series of poor harvests in 1997, 1998 and 1999, resulting in record imports of 5.8 millionmetric MT in 1998. Since 1990, Indonesia has witnessed horrific year-to-year variability in riceproduction. While weather-related crop stress may be the immediate cause of poor performance inthe short-run, the instability and slowing-growth in rice production reflects a great number ofunderlying, structural factors. To understand what went wrong with rice production in the 1990s,one must scrutinize these underlying or systemic determinants of rice production.
• From 1969 to 1984, rice production increased at an average of 5.01% per annum while ricedemand rose at just 4.65% per year. In other words, domestic supply growth outstrippeddemand growth in the run-up to self-sufficiency in the early 1980s.
• From 1984 to 1998, rice production rose by just 1.7% per annum, barely sufficient to keep pacewith population growth. Demand growth has steadily outstripped production growth.
• From 1969 to 1984, the average coefficient of variation in rice production growth was 86%.From 1984 to 1998, the average coefficient of variation of rice production growth was 203%.Clearly, the growth slowdown has coincided with a period of wild instability in rice supply.
In terms of rice output, the pre-self-sufficiency period was one in which production was advancingrapidly and year-to-year growth was becoming more stable. Since 1984, rice production growthhas slowed and production has become much unstable. Both the falloff in growth and theincreasing instability of output undermine efforts to build sustainable food security. The topping-out of rice growth and the volatility in output has been especially problematic in the 1990s. From1990 to 1998, rice production grew by just 0.89% per annum, well below growth in population andincomes. But the rice problem is not just a problem of production alone. The rice-milling yieldhas been on a declining trend for the better part of the past forty years. The figures presenteddemonstrate that the rice-milling yield has fallen from around 70% in the 1950s to close to 62% inthe late 1990s. If milling yields had been maintained at the levels prevailing in the 1950s, thisalone would have made a significant contribution mutational rice output.
Looking ahead, the main challenge for policy makers is to reverse these adverse trends in riceproduction, supply-volatility and the rice-milling yield. But in order to make progress in theseareas, it is important to understand why these problems have come about.
In the 1970s, the rice varieties released had significantly higher yields than those did that wereregularly in use. On average, the yield of the high yield variety (HYV)’s released in the 1970syielded 4.6 to 5.5 MT of rough rice per hectare. The most important of these were Pelita-I, IR-26and IR-36. Since 1980s, the varieties that have been released have not improved on the yieldpotential of the first generation of HYV’s, but have focused on improved consumer taste

Country Report : Indonesia
C - 2
characteristics, disease resistance and ability to withstand climatic stress. IR-36 dominatedproduction from 1978 to 1988. It was widely adopted after pest infestations in 1976 and 1977.While its taste characteristics were inferior to the earlier HYV’s, it was resistant to brown planthopper infestation. IR-64 was released in 1986. It has favorable taste and disease resistancecharacteristics and has dominated production for the better part of the last decade. In addition,during the 1980s, new varieties were released that were suitable for “unfavorable land” or theswamp, acidic and rain-fed rice production. These varieties were widely diffused in the 1980s aswell.
But technological progress slowed considerably in the 1990s. In the 1980s, of the 41 rice varietiesreleased, the average yield potential was 6.9 MT per hectare, or some 2.3 MT higher than thevarieties released in the 1970s. In the 1990s, only 17 new rice varieties were released, comparedto some 41 in the 1980s. Furthermore, the yield ceiling of the new varieties released in the 1990sfell to 5.9 MT, compared to 6.9 MT in the 1980s. The 1990 HYV’s exhibited improved cookingand taste characteristics, better disease tolerance and slightly shorter cultivation periods. But theseimprovements clearly came at the expense of rice productivity. In terms of new technology, Indonesia’s rice farmers were facing a rice production frontier that wasgradually shifting inwards during the 1990s. Farmers were reluctant to adopt the newer varieties,in large part because of the lower yields. But the reliance on IR-64, for a period of almost 14 years,has contributed to technological degradation. Over time, the longer a given HYV is used, thelower its potential yield and the lower its resistance to pests, disease and climatic stress.Sudaryanto, Adnuana and Swastika (1999) present research results that show that IR-64 remains thedominant rice variety in use in large parts of Java and that the maximum yield from this variety isdeclining over time. For the best part of the past decade, farmers have had a choice between the“best technology” of the 1980s, knowing that peak yields would decline over time, or the newervarieties introduced in the 1990s whose yield ceiling was significantly below that of IR-64.
As a strategic commodity, available domestic rice production for consumption serves as a parameterof the Indonesian staple food supply. Rice production development during the last eleven years(1990-2001), indicates that paddy production tends to increase relatively slowly, with an averageannual growth of 0.67 %. In 1990, available rice production for consumption amounted to 26.5million MT, that fluctuated and reached a high level volume of 29.7 million tons of rice in 1996.During the crisis and long dry season in 1997-1998, rice production decreased and re-increased in1999, reaching the peak production level of 28.9 million MT in 2000. In fact, rice production in theform of dried husked paddy in 2000 reached its highest amount that has ever been reached byIndonesia during the time. However, due to the conversion from husked paddy to rice, the figure ofdomestic rice production in 2000 was lower than that of 1996. Up to 1996, the conversion figurewas 0.65 compared to the figure in 1997 of 0.632. It is estimated that due to various issues related tothe economic crisis that hit farmers and the adjustment process of the regional autonomy, the 2001production would be lower than 2000.
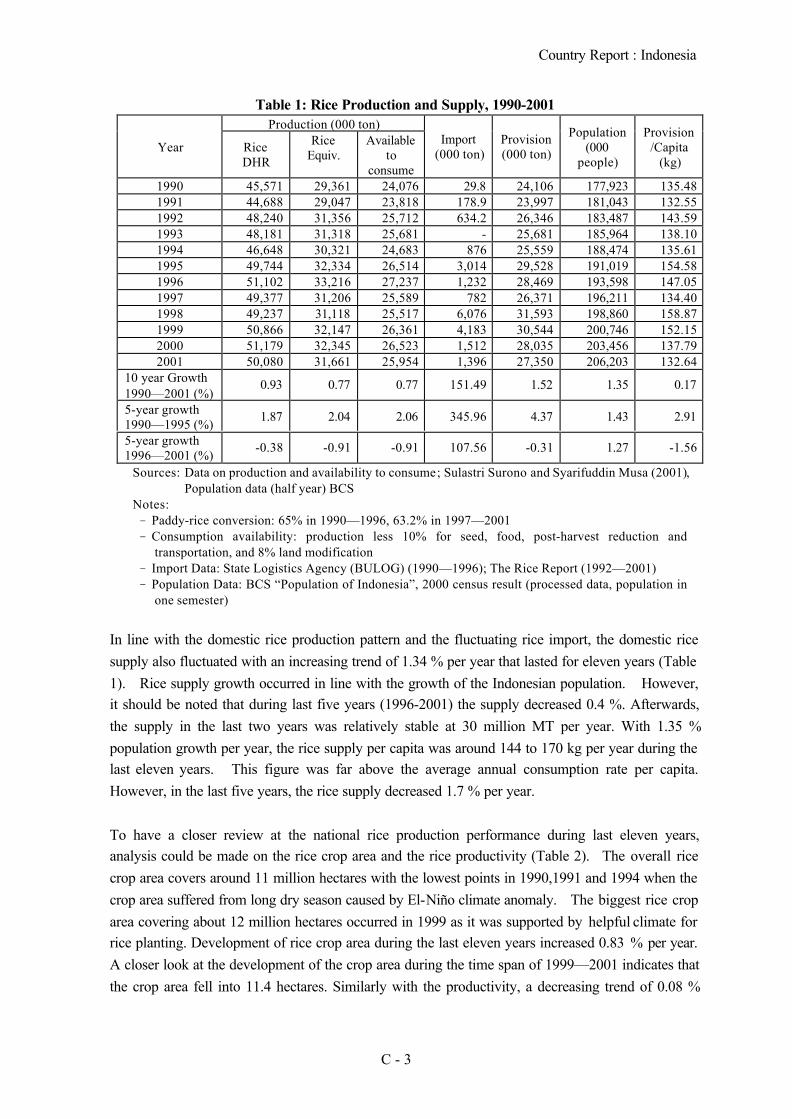
Country Report : Indonesia
C - 3
Table 1: Rice Production and Supply, 1990-2001Production (000 ton)
Year RiceDHR
RiceEquiv.
Availableto
consume
Import(000 ton)
Provision(000 ton)
Population(000
people)
Provision/Capita
(kg)
1990 45,571 29,361 24,076 29.8 24,106 177,923 135.481991 44,688 29,047 23,818 178.9 23,997 181,043 132.551992 48,240 31,356 25,712 634.2 26,346 183,487 143.591993 48,181 31,318 25,681 - 25,681 185,964 138.101994 46,648 30,321 24,683 876 25,559 188,474 135.611995 49,744 32,334 26,514 3,014 29,528 191,019 154.581996 51,102 33,216 27,237 1,232 28,469 193,598 147.051997 49,377 31,206 25,589 782 26,371 196,211 134.401998 49,237 31,118 25,517 6,076 31,593 198,860 158.871999 50,866 32,147 26,361 4,183 30,544 200,746 152.152000 51,179 32,345 26,523 1,512 28,035 203,456 137.792001 50,080 31,661 25,954 1,396 27,350 206,203 132.64
10 year Growth1990—2001 (%)
0.93 0.77 0.77 151.49 1.52 1.35 0.17
5-year growth1990—1995 (%)
1.87 2.04 2.06 345.96 4.37 1.43 2.91
5-year growth1996—2001 (%)
-0.38 -0.91 -0.91 107.56 -0.31 1.27 -1.56
Sources: Data on production and availability to consume; Sulastri Surono and Syarifuddin Musa (2001),Population data (half year) BCS
Notes:− Paddy-rice conversion: 65% in 1990—1996, 63.2% in 1997—2001− Consumption availability: production less 10% for seed, food, post-harvest reduction and
transportation, and 8% land modification− Import Data: State Logistics Agency (BULOG) (1990—1996); The Rice Report (1992—2001)− Population Data: BCS “Population of Indonesia”, 2000 census result (processed data, population in
one semester)
In line with the domestic rice production pattern and the fluctuating rice import, the domestic ricesupply also fluctuated with an increasing trend of 1.34 % per year that lasted for eleven years (Table1). Rice supply growth occurred in line with the growth of the Indonesian population. However,it should be noted that during last five years (1996-2001) the supply decreased 0.4 %. Afterwards,the supply in the last two years was relatively stable at 30 million MT per year. With 1.35 %population growth per year, the rice supply per capita was around 144 to 170 kg per year during thelast eleven years. This figure was far above the average annual consumption rate per capita.However, in the last five years, the rice supply decreased 1.7 % per year.
To have a closer review at the national rice production performance during last eleven years,analysis could be made on the rice crop area and the rice productivity (Table 2). The overall ricecrop area covers around 11 million hectares with the lowest points in 1990,1991 and 1994 when thecrop area suffered from long dry season caused by El-Niño climate anomaly. The biggest rice croparea covering about 12 million hectares occurred in 1999 as it was supported by helpful climate forrice planting. Development of rice crop area during the last eleven years increased 0.83 % per year.A closer look at the development of the crop area during the time span of 1999—2001 indicates thatthe crop area fell into 11.4 hectares. Similarly with the productivity, a decreasing trend of 0.08 %

Country Report : Indonesia
C - 4
was indicated during the lst five years, especially in 1998 and 1999. With the condition asmentioned above, Indonesian rice production during the last 11 years grew relatively slow (1.01 %per year). However, it has shown a better condition in the last five years (0.36 % per year). Thisdecrease was caused by long dry season and economy crisis. However, in the last two years riceproduction was raised and in 2000 it reached a capacity of 51.90 million MT which was the highestproduction achieved by Indonesia.
The phenomena of stagnant rice crop area and paddy productivity in the last five year was closelyrelated to long dry season, economy crisis and transition of the national economic policy. Theproblems faced by farmers are: (i) insufficient stock of Urea fertilizer and the high price ofphosphate and potassium fertilizers; (ii) decreasing seed supplies and quality; (iii) limited financialresource due to the cancellation of credit program (except for interest subsidy); (iv) profit generatedby rice agribusiness is less than other alternative commodities to plant in the field (e.g. sugarcane,orange, and other horticultural plants); (v) an intensity of plant disturbing organism and otherdisasters such as flood or dry season; (vi) low efficiency in water usage due to rehabilitation ofirrigation network is not optimum caused by the lack of financial support; (vii) educationalperformance decreasing related to the regional autonomy process.
Table 2: Rice Crop Area, Rice Productivity and Production 1990—2001
Year Rice crop area(1000 ha)
Productivity(ton/ ha)
Production(1000 ton/MDHP )
1990 10,502,357 4,302 45,178,7511991 10,280,519 4,347 44,688,2471992 11,103,317 4,345 48,240,0091993 11,012,776 4,375 48,181,0871994 10,733,830 4,345 46,641,5241995 11,438,764 4,349 49,744,1401996 11,569,729 4,417 51,101,5061997 11,140,594 4,432 49,377,0541998 11,730,325 4,197 49,236,6921999 11,963,204 4,252 50,866,3872000 11,793,475 4,401 51,898,8522001 11,412,026 4,390 50,096,486
Growth1990-2001 (%)
0.83 0.21 1.01
Growth1996-2001 (%)
-0.22 -0.08 -0.36
Source: BCS
1.2 Production Control
After three years of heavy reliance on imports to meet domestic requirements between 1996 and1998, Indonesia intensified its rice production policy to achieve rice self-sufficiency. Thisrenewed emphasis was reflected in marked increases in support prices and large domestic purchasesof paddy rice by Bulog, the National Logistic Agency in 1998, 1999 and 2000. Rice purchases inIndonesia continue to be carried out by BULOG, the state marketing agency, but private traders
Country Report : Indonesia
C - 5
were allowed to import rice as of 1999. However, due to an expected higher local rice production,the government imposed a ban on all rice imports between March and May 1999, and allocatedabout US$ 10 million to purchase paddy from domestic farmers. There is no plan of thegovernment to strengthen a subsidy system for farmers because of protecting farmers from feebleability of farmers’ production depending upon subsidy freak. The government is reduced subsidyto farmers step by step except the projects for infrastructure, irrigation etc.
Under control of the government, the banks of private sector have achieved a new credit system forfarmers since December 2001.
2 Policy on Prices
2.1 Growth of Price of Rice (1990-2001)
Domestic price of rice increases 20 % consistently per year during the last ten years (Table 3).During the time span of 1990-1997, a consistent increase was indicated along with thegovernment’s control through floor price policy. This increase is designed in line with theinflation level to protect the interests of farmers and consumers. The price of domestic riceincreased sharply in 1998. At the same time, the government increased the floor price of huskedpaddy/rice more than double with the purpose of providing the benefits of the price increase tofarmers. Subsequently, in the last two years, 2000-2001, the price of rice tends to decrease and isrelatively stable at around Rp 2,500.00 per kilogram with a sharp increase by the end of 2001 and inthe beginning of 2002. At the same time, the international price of rice - if converted to rupiah -also shows high increase of 23 % per year. However, it decreased in dollar of 3.7 % per year(US$ 254/ton in 1990 to US$ 151/ton in 2001 of 25% of Thai rice quality). This increase wasresulted by weakened rupiah exchange rate. Compared to the price of domestic rice in 1990-1997,the international price shows bigger fluctuation. It implies that the stability of domestic supplycannot fully depend on the supply in the world market. Domestic or international price of ricefaces the stable period during 1990-1997, and then fluctuated sharply in 1998-1999, and becamestable again in 2000-2001. The domestic price of rice up to 1997 was relatively equal to theinternational price and slightly decreased in-1998-1999 and in 2000-2001 the domestic as well asthe international price of rice reached an equal level. There were different policies thatcharacterized the movement of domestic price of rice in those three time segments. In the firstsegment, 1990 until 1997, a policy was implemented to protect domestic price of rice fromfluctuating international price. The next segment, 1998-1999, a transition policy was issued thatremoved almost all-prevailing protection instruments and a sharp exchange rate fluctuation occurred,and the international price of rice affected the domestic price. Afterwards, in 2000-2001, an importduty of Rp 430 per kg was applied so that the impact of international price movement towards thedomestic price was not as strong. Except for 1998, the movement in 1998 (BULOG stabilizationera) and in 2000-2001 (controlled market era), the movement of the monthly price was relativelystable. The big movement occurred in 1998 was closely related to the macro economy condition at

Country Report : Indonesia
C - 6
the time. The relation between the international and the domestic price of rice can be shown moreclearly in monthly price movement represented. It means that (a) parity prices of rice in 2001 and2002 (in rupiah, FOB Bangkok) was much lower than the domestic one by taken out CIF cost, porthandling, and import tariff, the price of imported rice at wholesale market was competitive.Moreover (b) movement patterns of domestic and international price of rice were not alike due tounstable exchange rate in those two years.
Table 3: Comparison of Domestic and International Price of Medium quality rice,1990 to 2001
International PriceYear Domestic Price Thai Rice 25%
(US$/ton)Imported Thai
Parity 25% (Rp/kg)1990 432 254.00 6011991 480 244.13 6051992 536 235.17 5941993 511 215.63 5581994 592 270.78 7271995 657 304.25 8511996 880 331.80 9671997 1,064 289.96 1,0631998 2,100 275.99 3,3841999 2,666 216.21 2,0962000 2,519 172.72 2,3032001 2,545 151.85 2,406
10 year growth1990 to 2001(%) 19.96 -3.65 23.49
5 year growth1990 to 1995(%) 8.99 4.41 8.03
5 year growth1996 to 2001(%) 28.14 -14.26 40.91
Source: Price of Rice: State Logistics Agency (BULOG) 2001Notes :1. Thai 25% Rice Price is F.O.B.2. Freight Insurance 7.5% of F.O.B price; C.I.F price=1.075*F.O.B3. Handling cost/domestic transport 5% of C.I.F price4. Imported parity price at wholesale level = C.I.F. + handling cost (for 2000 & 2001 plus Rp.
430/kg import duty)5. Import parity price at retail level = price at wholesale level + 10%
During the New Order era, the main aim of Indonesian rice policy was increase food security and tohelp stabilize domestic prices. Stabilizing rice prices was important because of the pronouncedseason of domestic production and because of the year-to-year volatility in prices due to climate-induced supply volatility and changes in world market rice prices. Compared to many otherAsian states, BULOG has been highly successful in stabilizing rice prices through a combination ofadept procurement, stock management and stock release policies. This was facilitated bysubsidized credit (KLBI) which allowed the agency to finance these activities without muchdifficulty.

Country Report : Indonesia
C - 7
2.1 Price Policy
During the crisis period of 1997 to 1999, the Government was unable to contain inflation usingtraditional rice price stabilization techniques. In fact, inflation reached 72 % in 1998, the highest ithad been in the past thirty years. Since the beginning of the financial crisis, the Government tried toincrease rice supply to dampen domestic price growth. Imports were increased and heavy subsidieswere applied to fertilizer and farm credit to stimulate domestic supply. BULOG was providedforeign exchange at concessionaire rates and was instructed to sell rice at subsidized prices indomestic markets. But rice prices increased anyway. Because rice prices were held below worldmarket price levels, rice was smuggled from Sumatra and Kalimantan to neighboring states. Thiswas especially the case when the gap between domestic and world market prices ranged from 50-60 %.Holding farm prices well below world market prices conveyed significant benefits to consumers but atthe cost of considerable producer welfare.
The most significant change in rice policy was the replacement of general price subsidies with targetedfood subsidies. In mid-1998, the Government introduced the special market operations program,which was aimed at subsidizing rice consumption levels of the poor. The rice price stabilizationprogram was phased-down and in September 1998, free trade in rice was declared. Private riceimports increased rapidly because falling world market rice prices and an appreciating exchange ratecombined to make Indonesian rice more expensive that rice imports. To stem soaring private riceimports, Bulog’s rice import monopoly was re-imposed in September 1999 except for high-quality rice(5 % Broken). Since the price of high-quality rice was 15 to 20 % lower than prevailing-domesticrice prices, the new policy hasn't been fully effective in containing rice imports. Furthermore, sincerice import prices was below the government floor support price, the Government has inadvertentlysubsidized imported rice. To date, rice policy has been rather ineffective in combating low millingyields, high waste and the erosion in rice productivity. On average, the rice mills are relatively oldbut milling attracts very little new investment. The operation of many small vintage mills make ricequality to decline year-after-year.
Public policy making in rice has suffered because different reforms have been introduced withoutadequate assessment and without considering the need to frame a consistent set of rice policies.Future rice policy should aim to frame policies which are internally consistent and which make apositive contribution towards raising farm incomes and enhancing food security. Although thepresent study is being conducted during the economic crisis, it is also a time of unprecedented publicpolicy change. A new Government has come into office, and that Government has expressed itsdesire to revitalize agriculture and improve the lot of the farm community.
The government quitted to distribute rice for the government officer except the officers in the remotearea and army/ police officers as a salary and food logistics in 2000.
The 1998/1999 rice price stabilization experience raises concerns about both the feasibility and cost-effectiveness of Government rice price stabilization, at least using traditional instruments. In

Country Report : Indonesia
C - 8
1997/1998, as the Rupiah devalued from Rp.2500 to Rp.17,000, the Government tried to use domesticrice price controls to brake inflation. From mid-1997 to mid-1998, BULOG was instructed to keepdomestic rice prices from rising above RP.1500-Rp.1700 per kg, a price ceiling that proved to be 50 to60 % of prevailing import parity prices. By May of 1998, domestic hoarding, soaring imports,consumer panic, smuggling and re-export of official imports forced BULOG to abandon its attempts tocontain the domestic price. From May to September of 1998, domestic prices quickly converged toworld market levels. Domestic rice prices have gradually fallen from the highs reached in September1998 to present levels.
A number of lessons can be drawn from the 1998/1999 episode of high rice price instability:
• Bulog's ability to maintain a wedge between domestic and international prices is limited bygeography. When the gap becomes too large --as it did in early 1998-- incentives for hoardingand smuggling become too great.
• Exchange rate volatility has become a significant source of rice price volatility1. Traditionalrice price stabilization instruments were designed to offset seasonal rice shortages, not day-to-dayvolatility in the exchange rate.
• General rice price stabilization, in the face of exchange rate volatility, can place great burdens onthe budget. In 1998, general rice price subsidies were initially budgeted at Rp.14 trillion ($1.6billion).
• Producers paid a high cost as domestic prices were held well below import-parity levels. Theloss in producer welfare from the 1997/1999 “low consumer price” rice policy to rice producerswas estimated at Rp. 22 trillion (Tabor et. al. 1998), or almost twice the fiscal cost of the ricesubsidy.
1 Rice price controls may even aggravate exchange rate instability. If rice price controls lead to hoarding or excessive
fiscal costs, the private sector may anticipate higher future rates of inflation or further devaluation. This, quite rational,
change in expectations can become self-fulfilling when it is translated into a shift in the demand for base money.

Country Report : Indonesia
C - 9
2.3 Short-term Price Control Management
Table 4: Volume of rice supplies and Price of rice (IR-64) at Cipinang Wholesale RiceMarket, 25 December 2001 - 24 January 2002
Supply (ton) Price (Rp/kg)Date
2000/2001 2001/2002 2000/2001 2001/200225 December 14 228 2,100 2,90026 December 0 2021 2,100 2,90027 December 0 1565 2,100 2,90028 December 0 1468 2,100 3,10029 December 35 1358 2,100 3,10030 December 147 512 2,100 3,10031 December 175 3250 2,100 3,1001 January 212 340 2,100 3,1002 January 1,253 2907 2,100 3,1003 January 1,843 1992 2,100 3,1004 January 2,290 1117 2,100 3,1005 January 2,300 880 2,100 3,3006 January 1,798 199 2,100 3,3007 January 204 2140 2,100 3,3008 January 3,263 1903 2,100 3,300Average Growth 902 1,459 0.00 % %
9 January 2,139 2,583 2,100 3,70010 January 2,443 2,505 2,175 3,70011 January 2,260 2,897 2,175 3,70012 January 2,481 1,847 2,175 3,70013 January 1,954 397 2,175 3,70014 January 99 3,858 2,175 3,60015 January 2,649 2,325 2,175 3,60016 January 2,987 2,262 2,175 3,55017 January 2,208 1,536 2,175 3,50018 January 2,061 2,131 2,175 3,50019 January 2,165 1,516 2,175 3,50020 January 1,289 384 2,225 3,50021 January 43 2,520 2,225 3,50022 January 3,194 1,974 2,225 3,40023 January 2,270 1,252 2,225 3,30024 January 820 2,017 2,225 3,300Average Growth 1,756 1,666 5.87% -5.58%
Source: Cipinang Wholesale Rice Market
To stabilize this abnormal increase of the price of rice, the government has executed pure marketoperation (PMO) since 8 January 2002. This PMO is one of real short-term efforts to stabilize theincrease of the price of rice. This strategy was taken to anticipate and prevent uncontrollableescalation of price of rice, which was triggered by further speculation and market psychologicalfactor. If the price escalation occurs --as rice is the staple food and it has economical andpsychological relations to other commodities and it also has large contribution to inflation-- theimpact to the economy recovery would be very serious.

Country Report : Indonesia
C - 10
The government through State Logistics Agency (Bulog), executed PMO in 15 provinces which wasconcentrated in big cities, with distribution volume shown in Table 5 after the monitoring for ricemarket. These concentrations were in Jakarta, Bandung (West Java) Surabaya (East Java), andSemarang (Central Java); because the price escalation took place in these big markets. The PMO inother areas were also conducted but not to decrease the price (because there was no significantfigure), but to prevent the market players from increasing the price due to the news of increasedprice of rice in Jakarta. Around one week after the PMO was launched, the government alsolaunched the so called “RASKIN program”2 that provided assistance in the form of subsidized pricefor poor people.
PMO realization figure, which reached only 18,583 tons (Table 5), was not much, but it has animpact in stabilizing the price of rice in some big cities. This situation shows that actually therewere no serious insufficient rice supply. It reaffirmed the assumed speculative acts in rice tradingin several big cities, especially Jakarta.
At the same time, in order to accelerate rice import distribution, the government has decided toimplement rice import distribution policy under “green track”. It is expected that the rice import willincrease and the domestic price of rice will decrease.
Table 5. Total Pure Rice Operation (OPM) Volume, 9-24 January 2002
No. Regional LogisticsAgency (Dolog)
PMORealization(Ton)
Type of RicePrice beforePMO(Rp/Kg)
Price afterPMO(Rp/Kg)
Pricechange(%)
1 North Sumatra 18 ADA DN 1/ 2,975 2,975 -2 Jambi 30 ADA DN 2,750 2,750 -3 South Sumatra 200 ADA DN 3,000 3,000 -4 Bengkulu 254 ADA DN 2,800 2,800 -5 Lampung 526 ADA DN 3,100 3,100 -6 Jakarta 3,493 ADA DN 3,500 2,900 -17.147 West Java 2/ 9,208 ADA DN 3,400 2,900 .14.718 Central Java 632 ADA DN 2,900 2,900 -9 Yogyakarta 67 ADA DN 2,900 2,900 -10 East Java 2,402 ADA DN 3,000 2,900 -3.3311 East Kalimantan 72 ADA DN 2,700 2,700 -12 Bali 235 ADA DN 3,500 3,500 -13 West Nusa Tenggara 390 ADA DN 3,500 3,300 -5.7114 East Nusa Tenggara 100 ADA DN 2,500 2,500 -15 Maluku 856 Ex Vietnam 3,250 3,250 -
Total 18,583Source: State Logistics Agency (Bulog)Notes:1/ ADA DN = Domestic rice
2/ Plan to distribute (Laklog)
2 Raskin: Beras untuk orang Miskin (A program to the poor people).

Country Report : Indonesia
C - 11
In monitoring the implementation of PMO, the Ministry of Agriculture in cooperation with theBureau of Food Security Public Education/Provincial Agricultural Services and Cipinang WholesaleRice Market have monitored the daily price of rice since 7 January 2002 in 7 (seven) big cities:Jakarta, Bandung, Semarang, Surabaya. Makassar, Medan and Palembang. From the monitoringresult of 26 January 2002, it was found that after PMO execution the price was relatively stable inmost of those big cities. It means that in two weeks of the PMO implementation, it succeeded instabilizing the escalating price of rice. Especially at Cipinang Wholesale Rice Market, there was adecreasing price for the IR-64 type of 5.6 percent during the PMO execution. In addition, the ricedistribution to this market was relatively normal, which was parallel with the similar condition inthe previous year. Based on the monitoring of the price movement in the above seven big cities, itshows that the price increase in Jakarta also occurred in Bandung, Semarang and other related cities,which has trade relation with Jakarta such as Surabaya. Meanwhile, the price of rice outside Java,such as in Makassar, Palembang and Medan, did not fluctuate (with an exception of Medan at thetime of this city being flooded).
3 Policy on Trades
3.1 Basic Stance
Since 1934, the Government of Indonesia has regulated international trade. From 1967 to 1998,Bulog had a monopoly for rice imports. Bulog used this monopoly to stabilize domestic prices andto ensure that there were adequate supplies of rice to meet domestic consumer requirements. Ingeneral, Indonesian rice prices were held in line with long-term trends in world market prices.
Following the 1998 reform, Indonesia relaxed Bulog’s rice import monopoly and allowed riceimports by the private sector for the first time in 1999. However, private imports were initiallyrestricted to high quality rice of no more than 5 % broken and were charged a 25 % import duty.The quality restriction was withdrawn in January 2000 and a tariff of Rupees 430 per kilo (US$ 58per ton), equivalent to a 30 % ad-valorem duty, was imposed on all imports, whether private sectoror Bulog.
The Ministry of Agriculture dissents from WTO’s completed liberalization for agri-production inorder to protect the farmer. The government recognizes that the farmer and marketing firm for therice would lack competitive power under the international market. On the other hand, there isdifficult situation to fix tariff for custom duty of rice under the circumstance, which keep farmer’smotivation for rice production and protect from illegal import, it is hard problem to have unifiablecondition of its tariff.

Country Report : Indonesia
C - 12
Table 6: Rice Import by Bulog and Private sector, Jan.1998 to Sep. 1999 (Unit :MT)Month 1998 1999
Bulog Private Bulog PrivateJan 399,800 0 445,100 232,800Feb 427,200 0 301,900 207,300Mar 663,900 0 221,500 231,300Apr 843,500 0 97,400 94,900May 725,000 0 132,600 98,800Jun 323,800 0 156,800 275,800Jul 252,600 0 218,600 418,800Aug 293,600 0 20,500 NASep 362,200 228,600 108,600 NAOct 375,600 216,400Nov 587,800 259,400Dec 528,100 613,300Total 5,783,100 1,317,700 1,703,000 1,559,700
Source: Bulog and Ditjen Bea Cukai, Ministry of Finance for private sector (revised 19-10-99)Note: Values are rounded by hundreds MT.
3.1 Management of Import/Export
Indonesia could use a “price-based” system to regulate access to international trade. A tariff couldbe applied to regulate international trade. The main advantages of using a tariff to regulateinternational trade are:
• Price formation is more transparent;• Scope for private investment in storage and marketing is increased;• It is easier to administer and has a lower fiscal cost than an import monopoly;• Government will receive revenues from the import tax;• Domestic prices will become more closely integrated with the world market price;• Price policy will signal more efficient resource allocation---those areas, which have a
comparative advantage in rice will produce it and those that don’t will not.
Some of the advantages of a tariff are also disadvantages, given the nature of the thin world ricemarket:
• Domestic prices will become more volatile, unless the tariff is periodically adjusted to offsetvolatility in global market prices;
• “High cost” rice production will be discouraged as those “high cost” regions come to increasingcompete with imported rice (priced with a tariff).
• Government may face difficulties in implementing other farm support efforts, such as a floorprice program, in the face of volatility in international rice prices.
Three other factors bear consideration when thinking about the application of rice tariff forIndonesia. First, Indonesia doesn’t have any recent experience in applying or implementingimport tariffs for rice. This doesn’t mean that it can’t be done, and certainly tariffs are applied forother commodities. But rice is different (i.e. the gap between private and social opportunity costs
Country Report : Indonesia
C - 13
is large) and the “economic logic” used to set tariffs for purely private goods isn’t appropriate forrice. Institutional capacity for appropriate rice tariff setting needs to be created in Indonesia.This can certainly be done, but it is not in place at the moment. Second, Indonesia’s physical andinstitutional geography limits the scope for tariff setting. If a tariff is set too high, the incentivesfor smuggling and collusion (with custom’s and with the tariff setters) will be too high. If thetariff-formula is too complicated, “slow implementation” of the tariff by customs can disrupt tradeand trigger rice shortages. Most importantly, high-cost rice production regions may no longer be“globally” competitive, and inter-insular rice trade may also decline.
Third, a tariff, unto itself cannot completely close the gap between private and social opportunitycosts for rice. The tariff will need to be complemented by other measures (those which raiseproducer incomes) to help correct this distortion.
From a political-economy advantage point, tariffication appears to be the most appropriate solution.Indonesia can honor its commitments to GATT and WTO and politicians can demonstrate that theyare abolishing one of the Soeharto’s monopolies.
If Indonesia does impose an import monopoly, than it will need to renegotiate its IMF commitmentnot to apply import duties above 5 %. The IMF will, no doubt, try to hold the country to itscommitments, because the “credibility” of the Fund and Government is enhanced if thesecommitments aren’t changed. On the other hand, the Fund normally is willing to changecommitments when the economic setting changes and when it becomes aware that its pastcommitments were inappropriate. In this case, the economic setting has changed----the exchangerate has appreciated and world rice prices have collapsed. Furthermore, the Fund was perhapsunaware that Indonesian rice is a quasi-private good, and that there is a large gulf between the socialand private opportunity cost for rice. Clearly the IMF doesn’t wish to induce a farm incomecollapse, for the human, fiscal and political cost of this would be severe indeed. To put it bluntly, iffarm incomes collapse, social stability will be lost and Indonesia’s fragile democracy will comeundone. Clearly the IMF doesn’t want to undermine Indonesia’s hard fraught restoration ofdemocracy.
How high should a tariff be set? The appropriate economic answer to this is that Indonesia’sdomestic rice price should reflect the private economic cost of rice (which is its import parity value)and the net value of any externalities. This, as noted above, would make the “optimal” domesticprice of rice quite a bit higher than world market prices. The size of a rice import tariff, on theother hand, is likely to be limited by rather practical constraints, for a tariff is set too high, it will notbe effective---smuggling and collusion will occur.
It has been found out price moved from –60 % in May/June 1998 to a high of 27 % in September1999. This comparison is, of course, sensitive to what is assumed to be an appropriate marketingcharge and exchange rate. The conclusion, however, is that the nominal protection rate, resultingfrom Bulog’s import monopoly, is now on the order of some 33-37 % of world market prices.

Country Report : Indonesia
C - 14
It was recommend that Government replace Bulog’s import monopoly by a tariff; that trade beopened to general importers and that the tariff be set initially equal to 33-37 % of the Indonesianrice wholesale price. No restrictions should be placed on rice exports. It is recommended that:
• A specific (rather than an ad valorem) tariff is set; to eliminate the need to use check-prices orto review import prices.
• A specific tariff is set that is a price that can be easily calculated to avoid costly delays incalculating the custom’s duty.
• To insulate the domestic rice market from exchange rate volatility, the specific tariff should becalculated in dollars.
• Given world market prices of approximately $200/ton, and a prevailing nominal protection rateof 32-37%, this would imply that the specific tariff should be set at (about) $70 per ton of riceimported into Indonesia.
It is also recommended that the Government carefully monitor the implementation of the tariff. Itmay, or it may not be effective. Until it is “tested”, the government simply does not know ifIndonesia can operate an effective rice import tariff.
3.3 Bilateral/multilateral Agreements
There is no Bilateral/ Multilateral agreement only for rice trade.
4 Policies on Stock Management
4.1 General Situation of Stock Rice
In 1998, Indonesia initiated a market liberalization process under a structural agreement with theIMF, which diminished the role of BULOG, the National Logistic Agency, in domestic food cropmarketing and imports. Since 1999, the agency’s authority to procure rice has been restricted topaddy, which it purchases through local logistic agencies, “Dolog”, local agencies of Bulog, while itabstains from purchasing milled rice from millers. Moreover, under the 1998 reform, the agency isto rely on banking credits at market rates to finance its operations. Bulog has, nonetheless, keptthe responsibility to stabilize the domestic rice market through supply releases from stocks and tooperate a Government subsidized rice distribution scheme to the needy. Under this program, low-income households were entitled to receive 10 kilos of rice per month, per person, at rupees 1000per kilo (US$ 0.14 per kilo) in 1999. The Bulog also sells rice to military and civil servants as partof their salaries. In 1999 and 2000, the agency is estimated to have released some 4.8 million ton ofrice on the domestic market, half of which under its special programs and half as regular marketoperations, carried out through Dolog local agencies.
It is most important index character for Bulog to purchase rice. There is a lot of illegal import ofrice, which the government does not grasp the quantity of it. Under this circumstance, it makes
Country Report : Indonesia
C - 15
unfair price of rice for the farmer to reduce incentive to produce rice.
4.2 Rice Reserve
There is a system to control and monitor the national stock of the rice by Bulog.National Reserve = 1,000,000 MTNational Food Security Committee is final organization for reservation and for stock controlincluding with import quantity through Bulog’s data.
Indonesia's rice policy has been guided by a notion of 'self-sufficiency' for the better part of the pastthree decades. This has been the over-riding goal. It has focused public policy in the food sectorand has provided a rallying call for political and administrative action. Supporting publicexpenditure programs and policies, in the areas of rice supply, technology, agro-input and pricingwas designed to support the attainment of this objective.
Some confuse Indonesia's rice self-sufficiency policy with commodity autarky. This is incorrect.In practice, Indonesia's rice self-sufficiency policy has been implemented in a manner "broadly"consistent with private and public resource use efficiency. Rice self-sufficiency has been interpretedto mean the provision of an adequate supply of rice to meet domestic consumption requirements at"globally competitive" prices. The policy was applied to the long-term trends in rice requirementsand availability, rather than to season-to-season or year-to-year requirements. International tradewas used to clear the markets during surplus and deficit years, with public stocks adjusting tochanges in inter-seasonal availability.
In the 1960s, when rice self-sufficiency first became national policy, Indonesia was a poor, agrarian,food deficit nation. Food shortages contributed to endemic poverty, political insecurity and burstsof severe inflation. From a macro-economic vantagepoint, rice self-sufficiency helped to reduceinflationary pressures and release scarce foreign exchange for the import of goods and servicesneeded to modernize the other sectors of the economy. From a national security vantage point, thebelief that there was an adequate domestic food supply helped to allay consumer fears anduncertainties.
In terms of economic development, rice self-sufficiency helped to increase employment andincomes for small farmers and to ensure adequate availability of rice at a low price for domesticconsumers. The combination of the two contributed to labor-intensive development improvednutrition standards and poverty reduction. From an agricultural development vantagepoint, riceself-sufficiency provided an opportunity to close the gap between global and Indonesian ricetechnology. In so doing, Government was able to draw subsistence rural societies into the broadermarket economy.
Since 1996, Indonesian has failed to achieve what could be described as “globally competitive” riceself-sufficiency. Rice imports of 5.8 MT in 1998 broke historical records. In 1999, despite a

Country Report : Indonesia
C - 16
return of more normal environmental conditions, rice imports of approximately 5 million metric MTare anticipated. As 1999 comes to an end, nearly a quarter of the population depend onGovernment rice-subsidies to meet consumption requirements while domestic rice prices are 30-40 % above world market import-parity levels. All of these are signs that "rice self-sufficiency" astraditionally defined in Indonesian policy, has been badly compromised in the past two years.
While it is clear that rice self-sufficiency has been compromised, the Government should achieve"correct the situation" by reaffirming its commitment to rice self-sufficiency and increase publicspending on rice programs? The answer to this is far less obvious than it was three decades ago.
First of all, rice has lost much of its macro-economic significance. Its share in the overallconsumption basket has declined to below 7 %. It is still very important as a wage good and in thediets of the poor, but wages are being held down by under-employment, price rigidity and weaklabor demand rather than “low” rice prices. Growing poverty and food insecurity has resultedmainly because of Indonesia’s economic crisis---not because of the fall in domestic rice output.
As an instrument for fostering long-term economic development, rice has also lost much of its luster.Rice output would need to rise by approximately fifteen % to bring the country back on a self-sufficiency track. As incomes improve, domestic rice demand is expected to "top out", in percapita terms, sometime during the next decade. By the year 2025, Indonesia is expected to have atotal population of 275 million persons. Total rice consumption is expected to reach between 60and 65 million MT by then. Thereafter aggregate demand will either be flat, slightly rising orslightly falling, as the demand-enhancing effects of population growth are counter-balanced by thediet-quality improving effects of income growth and urbanization. Demographic and economiclimits to domestic rice demand growth imply that rice cannot be a very powerful motor for futureagricultural development since the long-term demand-ceiling is just 20-25 % above current outputlevels.
The future expected social benefits arising from "rice self sufficiency" are also considerably lessthan they were some three decades ago. Rural poverty is still severe, but is increasingly unrelatedto developments in the rice market. Rural poverty is most severe in eastern Indonesia where rice isnot the main food staple or the main source of agricultural incomes. In rural Java, the recentupsurge in poverty levels primarily reflects the collapse of urban industry and services whichcontributed to off-farm incomes in the rural areas. A broader recovery of aggregate demand willbe needed to replace the largely, off-farm sources of income and employment lost during theeconomic crisis.
Rice policy has been designed to protect consumer food security. There were several reasons forthis:
• Government needed to ensure that the military, the police and the civil service can afford ricein order to have a properly functioning government;
• there are large numbers of poor and near-poor consumers, for whom rice provides the main

Country Report : Indonesia
C - 17
source of calories and protein in the diet, and who cannot afford to buy adequate amounts ofrice when prices are high;
• Rice prices are closely linked to wages for unskilled laborers. Sudden changes in the riceprice can reduce labor demand and have an adverse impact on employment;
• Rice price stability is closely linked to political stability. If consumers fear that there areinadequate supplies of rice or that rice has become unaffordable, than hoarding, public protestsand a breakdown of law-and-order can result.
• Excessively volatile rice prices will reduce the signaling-effect of food markets and induceconsumers to make costly substitutions of one food grain for another. Very poor consumersmay not be able to afford to make these substitutions.
To meet these objectives, the Government has public procurement, buffer stocks and administrativerice sales to meet these different consumer food security objectives. Rice rations for budgetgroups (civil service and the military) were used to ensure that these groups could afford anadequate diet. General rice price subsidies were used to blunt off-seasonal increases in rice pricesduring the lean season. Since 1998, the sale of rice at below-market prices to poor households (theOPK) program was used to augment the purchasing power of the poor. And the provision of riceat no cost to households in emergency situations was employed to offset location-specific marketfailure. But changes have taken place in Indonesia’s food economy which call into question thecontinued rationale for some of these objectives, and suggest the possibility of more cost-effectivemeans of assuring other ones.
4.3 ASEAN Food Security Reserve
Quote to Indonesia for ASEAN Food Security Reserve is 12,000 ton in milled rice. This quantityis included in the national rice reserve. The government’s policy is not to classify the rice betweenthe ASEAN food reserve and the national food reserve. Moreover, country quota for the ASEANFood Reserve is supposed to require changing by the government.
5 Supply and Demand
Rice as industrial raw material is growing along with the development of various rice-based productssuch as rice flour, semi-finished products such as noodle and various chips, traditional snacks or driedsnacks. In addition to the development of the types of products, the amount and capacity of rice-basedindustry kept increasing. With the help of Input-Output table, the use of rice for indirect demandssuch as for industries, hotel, restaurants and other food vendors will increase from 7.8 % in 1990 to15.6 % in 1995, and 18.8 % in 1999. With the acceleration in food industry, it is assumed that the needof rice need growth as raw material will increase in the coming years. Aside from that need, ataggregate level rice is still in demand for other various activities such as public and governmentadditional stock, food aid distribution, or other activities. For those activities, the numbers varied inthe area or time, depending on the specific condition at the time. The State Logistics Agency

Country Report : Indonesia
C - 18
(BULOG) data shows that in every end of the year, the secured BULOG stock is 1.0--1.5 million MT,whereas the rice in public is 4.0 million MT. It means that the total need of rice in a year is stillsufficient, however rice import is still needed for stockpile.
Based on household consumption and indirect consumer calculations, the estimated consumptiondemand per capita is obtained of approximately 127.7 kg per capita per year in 1990, that increased to134.8 kg in 1996 and re-decreased to 130.0 per capita in 1999. It is assumed that consumption needincreased around 3.4 % per three years.
Table 7: Estimated Rice Consumption per Capita 1990-1999 (Unit : kg/capita/year)
Year Household RiceConsumption
Indirect ConsumerDemand
Total Consumption percapita
1990 117.7 10.0 127.71993 116.8 17.4 134.21996 111.2 23.6 134.81999 103.5 26.6 130.0
Growth1990—1999 (%)
-4.16 40.89 3.39
Source/Notes:- Consumption per capita 1990,1993,1996,1999 from the National Social-Economic Survey, 2001
assumption- Indirect consumers include processing industries, hotels, restaurants, other food vendors, estimated based
on Input-Output Table- Growth ratio of other than rice demand including those of 1993 - 1999 (not including that of 1990)
The strategic directions are stable production, Increase of %age of rice self-sufficient, Stable importquantity. There is a system to control and monitor the national stock of the rice by Bulog. It issupposed that balance of supply-demand for rice is on the borderline being in deficit side. NationalFood Security Committee is the final organization for reservation and for stock control including withimport quantity through Bulog’s data. Bulog is holding 1 to 2 million MT of milled rice as bufferstock included with ASEAN Food Reserve. The government’s policy is not to classify the ricebetween the ASEAN food reserve and the national food reserve.
Table 8: Rice Balances (Unit : 1,000 MT)Supply Domestic Use
ProductionYearPaddy Milled rice
Import Total FoodLoss, Seed& Other Total
Annualbalance
1997 49,377 31,206 782 31,988 26,371 5,617 31,988 0
1998 49,237 31,118 6,076 37,194 31,593 5,601 37,194 0
1999 50,866 32,147 4,183 36,330 30,544 5,786 36,330 0
2000 51,179 32,345 1,512 33,857 28,034 5,822 33,856 1
2001 50,080 31,661 1,396 33,057 27,351 5,707 33,058 -1Source: Ministry of Agriculture, Population data, BCS and data on production & availability to consume (2001)Note: There is no clear record for informal trade transaction of rice.

Country Report : Indonesia
C - 19
6 Activity for Poverty and Aid
6.1 Measures for Poverty
Special Rice Market Operation (OPK) was improved in 2002 and the name of the operationchanged into RASKIN (Rice Program for Poor People). This program was designed as incometransfer and designated for among others: (a) preventing negative impact on the local foodconsumption pattern, and (b) preventing the encouragement of too strong tendency towards rice orwheat consumption pattern. Rice distribution was planned to comprise 2,167,000 ton for 9.7 poorhouseholds.
Table 9: OPK Realization 2001 and RASKIN Target 2002 (Unit : MT)
No. Province 2001 RealizationOPK & PPD-PSE
2002 TargetRASKIN & PPD-PSE
1234567891011121314151617181920212223242526
D.I. ACEHSUMATERA UTARARIAUSUMATERA BARATJAMBISUMATERA SELATANBENGKULULAMPUNGDKI JAKARTAJAWA BARATJAWA TENGAHDIYJAWA TIMURKALIMANTAN BARATKALIMANTAN TIMURKALIMANTAN SELATANKALIMANTAN TENGAHSULAWESI UTARASULAWESI TENGAHSULAWESI TENGGARASULAWESI SELATANBALINUSA TENG. BARATNUSA TENG. TIMURMALUKUIRIAN JAYA
58,97730,68924,47217,97514,49842,11917,37172,32420,559
233,026325,65831,829
245,73225,18412,95624,90413,52322,81928,51119,37532,875
7,23542,44243,90028,79130,574
77,97740,31024,78933,85620,42664,32723,315
114,13928,278
315,215498,00743,385
428,76330,43134,18717,59919,96929,88419,90230,60440,37011,00365,78464,35531,62938,596
Total 1,468,318 2,167,100Notes:- 2001 OPK Realization includes PPD-PSE- The number of head of families served for OPK is 7.5 million households, and 1.1 million households
for PPD-PSE- RASKIN limit for 2002 is for 9.7 million households
The inter-island pattern for the implementation of RASKIN distribution in 2002 is almost similar tothat of 2001 comprising mostly in Java, and the distribution was conducted all year long with quitesubstantial proportion (>10%) during the months of September – November (Table 10). In the
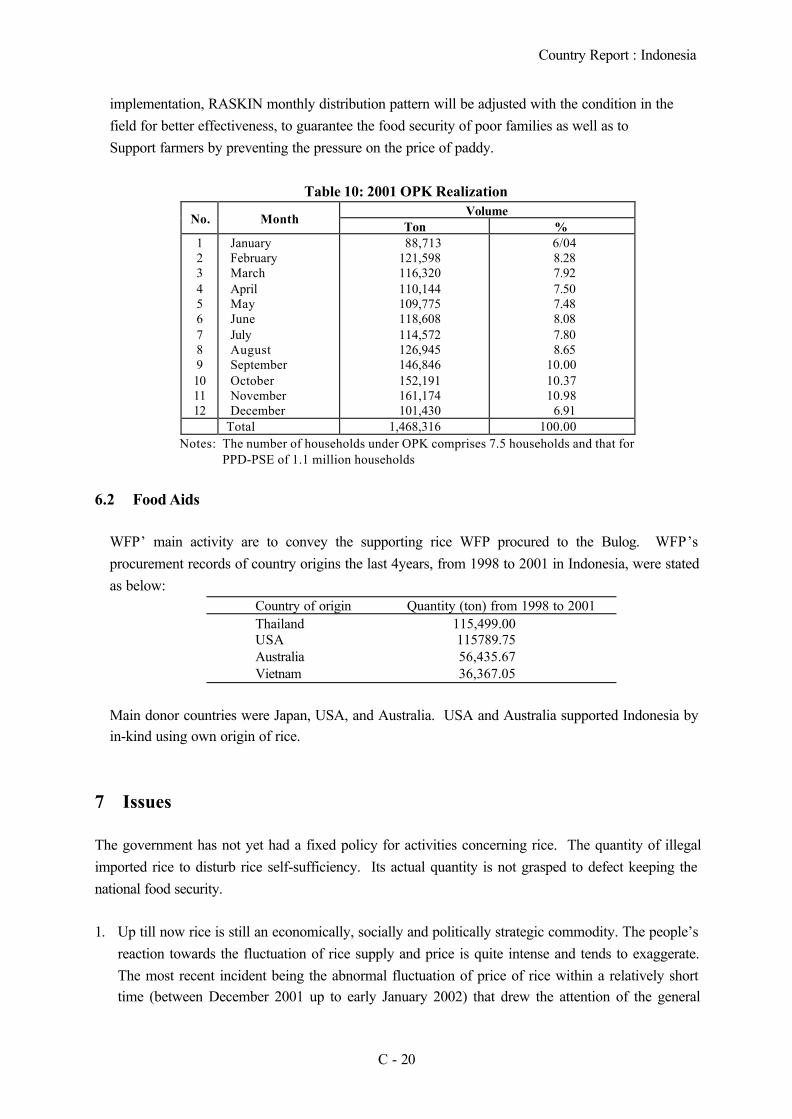
Country Report : Indonesia
C - 20
implementation, RASKIN monthly distribution pattern will be adjusted with the condition in thefield for better effectiveness, to guarantee the food security of poor families as well as toSupport farmers by preventing the pressure on the price of paddy.
Table 10: 2001 OPK RealizationVolume
No. MonthTon %
123456789101112
JanuaryFebruaryMarchAprilMayJuneJulyAugustSeptemberOctoberNovemberDecember
88,713121,598116,320110,144109,775118,608114,572126,945146,846152,191161,174101,430
6/048.287.927.507.488.087.808.65
10.0010.3710.98
6.91Total 1,468,316 100.00
Notes: The number of households under OPK comprises 7.5 households and that forPPD-PSE of 1.1 million households
6.2 Food Aids
WFP’ main activity are to convey the supporting rice WFP procured to the Bulog. WFP’sprocurement records of country origins the last 4years, from 1998 to 2001 in Indonesia, were statedas below:
Country of origin Quantity (ton) from 1998 to 2001Thailand 115,499.00USA 115789.75Australia 56,435.67Vietnam 36,367.05
Main donor countries were Japan, USA, and Australia. USA and Australia supported Indonesia byin-kind using own origin of rice.
7 Issues
The government has not yet had a fixed policy for activities concerning rice. The quantity of illegalimported rice to disturb rice self-sufficiency. Its actual quantity is not grasped to defect keeping thenational food security.
1. Up till now rice is still an economically, socially and politically strategic commodity. The people’sreaction towards the fluctuation of rice supply and price is quite intense and tends to exaggerate.The most recent incident being the abnormal fluctuation of price of rice within a relatively shorttime (between December 2001 up to early January 2002) that drew the attention of the general

Country Report : Indonesia
C - 21
public. This is quite understandable since rice is the staple food for 95% of the Indonesianinhabitants, and 30 percent of poor family expense is allocated for rice. Furthermore, paddyagribusiness constitutes the source income for 21 million farmer families.
2. The government is fully aware of the strategic position of rice in the national economy, thepeople’s social life, and the possible political impacts. In this regard, national rice handling thatcan protect the interests of producers and consumers is made one of the priorities of the nationaldevelopment program.
3. In addressing the fluctuation of the price of rice from December 2001 up to early January 2002,the government realized that if such fluctuation continued resulting in uncontrolled escalatingprice, the impact would affect the economic recovery process through the increasing inflation ratethat may trigger social unrest. In this regard, the government made a short term policy to solve thisproblem by implementing Pure Rice Market Operation (OPM), combined with other programs,namely rice distribution for poor families (RASKIN) and the implementation of “green track” forrice import. With this operational policy, within two weeks the price fluctuation could beovercome. The most recent monitoring (26 January 2002) at the Cipinang Central Rice Marketindicated that the price of medium quality rice consumed by the majority was back to normal at areasonable level namely back to the price before 7 January 2002.
4. This success, aside from owing to the correct anticipation of the government, was also resulted bythe anticipation taken by the market players of the upcoming paddy main harvest in February 2002.The constant problem coming up at main harvest is the low price of paddy received by the farmers.To solve this problem, in 2002 the government (through BULOG) planned to perform domesticpaddy/rice supply of 2.2 million ton with a price based on the government’s basic procurementprice, namely Rp. 1,529,-/kg/GKG or Rp. 2,490,-/kg. Under normal condition, the volume of ricepurchase by the government is capable to increase the price of paddy in the market, in line with orapproaching the basic procurement price.
5. During the New Order government era, the efforts to stabilize the supply and price of rice wassupported by sufficient policies and instruments, including the insulation of international marketthrough rice import monopoly by BULOG, nearly unlimited central bank’s credit facility fordomestic food supply operations, and providing input subsidies. During the transition period(1998-2000) the government liberated the national rice economy by opening domestic rice marketand eliminating input subsidies.
6. The findings of the analysis on monthly fluctuation of the price of rice during the two policyperiods indicate that the volatility of the price of rice in the liberation era turns out to be no higherthan that during the more controlled era. During the period of 1980-1997 the coefficient ofvariation value was 4.2 percent, whereas during the period of 1999-2000 it was only 3.9 percent. Itindicates that (a) the stabilization policy by strong government intervention did not guarantee thecapacity to overcome the fluctuation of price of rice altogether, and (b) during the liberation era,

Country Report : Indonesia
C - 22
sharp fluctuation of price did not occur due to the role of the private sector (such as what was doneby BULOG during the New Order era) in reducing the fluctuation of supply and price throughimport policy.
7. Comprehensive rice policy was given a controlling main policy by the issuance of PresidentialInstruction no. 9/2001 regarding the stipulation of rice policy. This presidential instructionobligates that rice policy shall not only be limited to the regulation of the price of paddy/rice, butshall also include the development of rice as a whole. Policies regulated in this presidentialinstruction comprise efforts to encourage: (a) improvement of farmers’ productivity and riceproduction, (b) improvement of farmers’ income through economic diversity, (c) regulating of thestability of supply and price of paddy/rice through procuring paddy/rice at the government’s basicprocurement price, regulating of import (tariff and procedures) to protect farmers and consumers,and (d) guaranteeing food supply for poor and food restricted people.
8. The basis of the consideration behind the rice policy in the Presidential Instruction No. 9/2001
does not intent to totally hand over the rice economy to the market mechanism (free marketmechanism), on the other hand, neither does it intend to turn back to the strict government’scontrol/intervention such as previously in practice during the New Order era creating excess inthe use of opportunity to make use of economic interest for the interest of individuals or groups.Rice policy developed in this presidential instruction follows the approach of managed marketmechanism in the efforts to protect the interest of producers and consumers. As mentioned in theprevious point, during the normal condition, the private sector can respond immediately in the caseof need of supply (high price) by importing. However, as rice is a strategic commodity, it cannottotally be handed over to the market mechanism. The government still has to have instruments toovercome market failure in order to protect producers and consumers. Presidential Instruction No.9/2001 still provides such instruments namely government’s basic procurement price, importregulating (tariff and procedures), and subsidized rice distribution for poor people.
9. In the long term, the national food policy is directed at food diversification efforts towards varied,nutritious, and balanced food consumption. This policy is capable of improving the quality of thehuman resources and at the same time the diversification of food consumption towards that of non-rice. In the long-term context, this policy will be able to establish sustainable food security,considering that by the reduced rice consumption per capita, the growth of national rice demandwill decrease. This will reduce the national economic expense, considering those land arearesources as a basis of developing food production is limited and becomes increasinglycompetitive in the utilization with the other economic activities. Rice relative price policy againstthe other higher food products, is one of the policies that can accelerate this food consumptiondiversification.
10. The above description reaffirms the fact that Presidential Instruction No. 9/2001 constitutes themain governing comprehensive rice policy. To make it effective, this regulation requiresoperational explanation by the Technical Department and the Regional Government, in a synergic

Country Report : Indonesia
C - 23
development program to enable people’s empowerment in the development of rice and foodagribusiness that can provide interest for farmers and consumers. In handling cases of foodsecurity as a local phenomena, regional governments should tale more proactive role in accordancewith the regional autonomic authority. Therefore, the coordination forum of the National andRegional Food Security Council need to take initiatives for the synergy in the operational policy ofthe inter-departmental development program in developing food agribusiness.
***********

Country Report : Indonesia
C - 24
Annexes
1. Indonesia at a glance & Social Indicators
2. Rice imports by type and by country of origin, 1993 - 2000

Indonesia at a glance 9/10/01
EastPOVERTY and SOCIAL Asia & Low-
Indonesia Pacific income2000Population, mid-year (millions) 210.4 1,853 2,459GNI per capita (Atlas method, US$) 570 1,060 420GNI (Atlas method, US$ billions) 119.9 1,964 1,030
Average annual growth, 1994-00
Population (%) 1.5 1.1 1.9Labor force (%) 2.5 1.4 2.4
Most recent estimate (latest year available, 1994-00)
Poverty (% of population below national poverty line) 24 .. ..Urban population (% of total population) 41 35 32Life expectancy at birth (years) 66 69 59Infant mortality (per 1,000 live births) 46 35 77Child malnutrition (% of children under 5) 70 13 ..Access to an improved water source (% of population) 76 75 76Illiteracy (% of population age 15+) 10 14 38Gross primary enrollment (% of school-age population) 113 119 96
Male 115 121 102Female 110 121 86
KEY ECONOMIC RATIOS and LONG-TERM TRENDS
1980 1990 1999 2000
GDP (US$ billions) 76.4 114.4 141.3 153.3
Gross domestic investment/GDP 24.6 30.7 12.2 17.9Exports of goods and services/GDP 34.9 25.3 35.2 38.5Gross domestic savings/GDP 38.8 32.3 20.2 25.7Gross national savings/GDP .. 28.1 13.1 19.2
Current account balance/GDP .. -2.6 3.3 4.9Interest payments/GDP 1.5 3.0 3.4 4.7Total debt/GDP 27.4 61.1 106.7 92.5Total debt service/exports .. 33.3 30.5 25.4Present value of debt/GDP .. .. 106.0 ..Present value of debt/exports .. .. 254.9 ..
1980-90 1990-00 1999 2000 2000-04(average annual growth)GDP 6.1 4.2 0.8 4.8 4.9GDP per capita 4.2 2.5 -0.8 3.1 3.4Exports of goods and services 2.9 5.4 -31.6 16.1 4.0
STRUCTURE of the ECONOMY1980 1990 1999 2000
(% of GDP)Agriculture 24.5 19.4 19.5 16.9Industry 42.6 39.1 43.7 47.3
Manufacturing 13.3 20.7 25.9 26.0Services 32.9 41.5 36.7 35.8
Private consumption 50.4 58.9 73.3 67.3General government consumption 10.7 8.8 6.5 7.0Imports of goods and services 20.6 23.7 27.2 30.7
1980-90 1990-00 1999 2000(average annual growth)Agriculture 3.6 2.1 2.7 1.7Industry 6.9 5.8 1.9 5.5
Manufacturing 12.6 6.9 3.8 6.2Services 6.9 3.5 -1.0 5.3
Private consumption 5.6 6.5 4.6 3.6General government consumption 4.6 0.1 0.7 6.5Gross domestic investment 6.7 -0.3 -23.3 8.9Imports of goods and services 1.2 5.5 -40.7 18.2
Note: 2000 data are preliminary estimates.
* The diamonds show four key indicators in the country (in bold) compared with its income-group average. If data are missing, the diamond willbe incomplete.
-60
-40
-20
0
20
95 96 97 98 99 00
GDI GDP
Growth of investment and GDP (%)
Indonesia
Low-income group
Development diamond*
Life expectancy
Access to improved water source
GNIpercapita
Grossprimary
enrollment
-60
-40
-20
0
20
40
95 96 97 98 99 00
Exports Imports
Growth of exports and imports (%)
Indonesia
Low-income group
Economic ratios*
Trade
Domesticsavings
Investment
Indebtedness
Kondo
C-25

Indonesia
PRICES and GOVERNMENT FINANCE1980 1990 1999 2000
Domestic prices(% change)Consumer prices 17.7 7.8 20.5 3.7Implicit GDP deflator 28.3 7.7 15.2 11.0
Government finance(% of GDP, includes current grants)Current revenue .. 19.3 18.0 20.1Current budget balance .. -2.0 2.8 3.6Overall surplus/deficit .. .. -2.4 -1.1
TRADE1980 1990 1999 2000
(US$ millions)Total exports (fob) .. 26,807 51,242 65,408
Fuel .. 11,071 9,885 14,386Estate crops .. 840 1,289 1,111Manufactures .. 8,508 19,253 22,287
Total imports (cif) 10,834 21,837 24,003 31,962Food .. 852 3,237 2,782Fuel and energy .. 1,937 3,726 6,071Capital goods .. 9,328 5,710 9,212
Export price index (1995=100) .. 63 131 129Import price index (1995=100) .. 87 90 90Terms of trade (1995=100) .. 72 146 143
BALANCE of PAYMENTS1980 1990 1999 2000
(US$ millions)Exports of goods and services .. 29,295 55,741 70,541Imports of goods and services .. 27,511 42,071 55,293Resource balance .. 1,784 13,670 15,248
Net income .. -5,190 -8,997 -8,440Net current transfers .. 418 0 672
Current account balance .. -2,988 4,674 7,480
Financing items (net) .. 5,239 -2,702 -5,140Changes in net reserves .. -2,251 -1,972 -2,340
Memo:Reserves including gold (US$ millions) .. .. 27,054 29,394Conversion rate (DEC, local/US$) 627.0 1,842.8 7,855.1 8,421.8
EXTERNAL DEBT and RESOURCE FLOWS1980 1990 1999 2000
(US$ millions)Total debt outstanding and disbursed 20,938 69,872 150,844 141,802
IBRD 1,040 9,542 11,424 11,715IDA 566 842 682 714
Total debt service 3,084 9,946 17,900 18,810IBRD 120 1,281 1,584 1,710IDA 5 18 29 31
Composition of net resource flowsOfficial grants 109 283 0 0Official creditors 806 2,384 3,389 1,700Private creditors 807 1,830 -7,021 -7,040Foreign direct investment 180 1,093 -2,745 -4,550Portfolio equity 0 312 -1,793 -1,911
World Bank programCommitments 734 1,565 1,693 164Disbursements 373 987 1,506 1,110Principal repayments 32 562 786 787Net flows 341 425 720 324Interest payments 93 737 827 955Net transfers 248 -312 -107 -631
The World Bank Group: http://www.worldbank.org/data/ 9/10/01
-4
-2
0
2
4
6
94 95 96 97 98 99 00
Current account balance to GDP (%)
0
25,000
50,000
75,000
94 95 96 97 98 99 00
Exports Imports
Export and import levels (US$ mill.)
0
20
40
60
80
95 96 97 98 99 00
GDP deflator CPI
Inflation (%)
E: 36,070
F: 53,537
B: 714
C: 10,838
D: 6,293
A: 11,715
G: 22,635
Composition of 2000 debt (US$ mill.)
A - IBRDB - IDAC - IMF
D - Other multilateralE - BilateralF - PrivateG - Short-term
Kondo
C-26

Indonesia Social IndicatorsLatest single year Same region/income group
East
Asia & Low-1970-75 1980-85 1993-99 Pacific income
POPULATION Total population, mid-year (millions) 132.6 163.0 207.0 1,836.6 2,417.1 Growth rate (% annual average for period) 2.4 1.9 1.6 1.2 1.9Urban population (% of population) 19.4 26.1 39.8 34.5 31.4Total fertility rate (births per woman) 5.0 3.6 2.6 2.1 3.7
POVERTY(% of population)National headcount index .. .. 27.1 .. .. Urban headcount index .. .. .. .. .. Rural headcount index .. .. .. .. ..
INCOMEGNI per capita (US$) 230 530 600 1,010 420Consumer price index (1995=100) 15 46 219 136 138Food price index (1995=100) .. 40 119 .. ..
INCOME/CONSUMPTION DISTRIBUTIONGini index .. .. 31.7 .. ..Lowest quintile (% of income or consumption) 6.8 .. 9.0 .. ..Highest quintile (% of income or consumption) 52.0 .. 41.1 .. ..
SOCIAL INDICATORSPublic expenditure Health (% of GDP) .. .. 0.7 1.7 1.2 Education (% of GNI) 2.8 2.0 1.4 2.9 3.3 Social security and welfare (% of GDP) .. .. 1.1 .. ..Net primary school enrollment rate(% of age group) Total 72 98 95 100 .. Male 78 101 96 100 .. Female 67 95 93 100 ..Access to an improved water source(% of population) Total .. 39 76 75 76 Urban .. 60 91 93 88 Rural .. 32 65 66 70Immunization rate(% under 12 months) Measles .. 15 71 83 64 DPT .. 15 64 82 70Child malnutrition (% under 5 years) .. .. 34 12 ..Life expectancy at birth(years) Total 51 59 66 69 59 Male 50 57 64 67 58 Female 53 60 68 71 60Mortality Infant (per 1,000 live births) 109 75 42 35 77 Under 5 (per 1,000 live births) 172 125 52 44 116 Adult (15-59) Male (per 1,000 population) 478 368 235 184 288 Female (per 1,000 population) 405 308 183 141 258 Maternal (per 100,000 live births) .. .. 450 .. ..Births attended by skilled health staff (%) 10 31 43 .. ..
Note: 0 or 0.0 means zero or less than half the unit shown. Net enrollment ratios exceeding 100 indicate discrepanciesbetween the estimates of school-age population and reported enrollment data. Latest year for access to improved watersource data is 2000.
2001 World Development Indicators CD-ROM, World Bank
Kondo
C-27

2. Rice import by type and by country of originYear Year 1993 Year 1995 Year 1998Unit kgs kgs kgs kgs US$ kgs US$
Rice in the husk (paddy or rough) - HS 1006.10.000Total 580 1,051,018 460,874 9,538,638 2,263,543 1,795,284 451,913Thailand 1,050,000 663,638 174,269 1,472,000 381,564Vietnam 1,100,000 231,508 210,020 52,337Malaysia 11,873 1,597Philippines 40 19Singapore 540 71,387 10,782Korea 39China 6,500,000 1,482,000India 2 1Pakistan 275,000 60,500Australia 960 1,000,000 315,266USA 460,350Hong Kong 524Indonesia 30,002 5,632Husked (brown) rice - HS 1006.20.000Total 5,407,650 676,153 11,413,175 768,375,900 297,519,523 160,493,919 51,069,560Thailand 5,800,000 9,626,693 108,371,137 24,504,198 44,408,023 11,161,979Vietnam 7,140,000 11,025,000 250,973,268 56,630,353 62,535,425 13,275,038Malaysia 750,000 538,000 97,890Myanmar 10,342,858 3,225,257 707,581Philippines 3,898,332Singapore 50,000 325,252 1,111,561 501,624 56,059 17,048Korea 45 57 28 210 118China 42,005 12,526,142 3,221,853Japan 20 5,003,331 372,401,965 199,320,310 35,000,000 20,528,127Taiwan 21,000 5,250India 1,695,099 294,801 108 68Pakistan 2,647,000 507,171 1,823,089 404,955Australia 555 1,734 455 215,735 41,237 8,601,216 3,033,328USA 5,357,050 674,399 6,041,140 14,849,465 11,696,399 7,238,240 2,494,967Saudi Arabia 992US. Virgin Islands 283,000 44,795Venezuela 7,500 3,230Switzerland 3,049 8,017United Arab Emirates 640 1,306Tunisia 215,516 45,150Austria 64,500 31,282Bulgaria 31,000 6,300Indonesia 26,558 4,680Semi-milled or Wholly milled rice, whether or not polished or glazed - HS 1006.30.000Total 4,742,650 1,309,510,154 2,798,289,778 3,055,414,022 817,591,111 803,356,590 187,545,518Thailand 1,650,000 249,997,119 924,690,547 970,481,381 260,826,477 149,583,774 34,610,552Vietnam 291,451,903 1,130,000,000 997,617,930 243,487,458 112,802,205 27,166,382Malaysia 3,453,500 15,105,000 3,855,627 5,165,495 735,421Myanmar 249,565,638 210,000 25,993,339 6,706,330PhilippinesSingapore 1,150 750,000 95,640 8,455,907 1,724,464 2,144,443 410,683Cambodia 11,895,263China 330,796,579 821,281,963 233,207,189 451,556,048 102,197,982Japan 30,317,287 5,000,000 967,312 20,000 1,020Taiwan 67,600,000 39,500,000 10,574,700India 139,657,000 8,000,000 10 9Pakistan 151,432,480 347,561,638 109,210,525 27,538,483 17,815,000 4,716,319Australia 480 763,116 171,130 4,362 4,973USA 3,090,000 36,282,877 15,569,096 60,106,629 28,017,400 40,740,341 10,837,597Bangladesh 11,774,074Hong Kong 15,750,000Uganda 1,728,663Turkey 4,972,100Sri Lanka 12,523,400Saudi Arabia 1,500 3,901,000Ireland 10,921,059Canada 31,286,311 17,814 11,953 27,742 16,992Armenia 12,050,000Peru 6,988,000Tunisia 5,000,000 42,000 10,130Italy 554,418 221,552 3,097,180 914,197Venezuela 1,200,000 252,000Anguilla 83,990 18,897Others 1,578,278Indonesia 20,400,000 5,933,400
Year 2000Year 1999
C - 28

Year Year 1993 Year 1995 Year 1998Unit kgs kgs kgs kgs US$ kgs US$
Year 2000Year 1999
Broken rice - HS 1006.40.000Total 14,166,415 469,456,569 67,934,585 918,069,600 210,084,795 389,975,110 80,063,053Thailand 14,125,000 406,324,490 61,016,005 294,100,456 72,091,142 166,270,992 37,253,938Vietnam 6,917,797 554,267,307 121,599,347 193,999,180 36,581,841Malaysia 30,000 4,500 1,897,984 277,774Myanmar 10,665,938 1,878,242 286,752 198,380 13,772Singapore 39,332 7,603,968 1,807,251 225,020 45,801Cambodia 769,000 119,473China 35,515,615 8,134,665 25,220,606 5,230,466Taiwan 5,500,000India 46,966,141 96,000 13,024Pakistan 16,676,500 3,857,404 501,000 109,789Australia 199,004 31,000USA 268 1,426,642 496,385France 1,815United Arab Emirates 301,000 60,199Togo 62,985 11,337Venezuela 1,197,000 261,599Netherlands 77 520Italy 2,271,450 1,061,332Bulgaria 3,300,000 776,250Maldives 25,302 3,211Tunisia 5,000 17,500Others 783Indonesia 6,000 1,576Total 24,317,295 1,780,693,894 2,878,098,412 4,751,398,160 1,327,458,972 1,355,620,903 319,130,044Source : Biro Pusat Statistik, Jakarta - Indonesia (Import Statistic)
C - 29

COUNTRY REPORT
Laos

Country Report : Laos
D - 1
1. Rice Production
The People's Democratic Republic of Lao (Laos), is a landlocked country with borders with China inthe North, Vietnam to the east, Cambodia in the South and Thailand and Myanmar to the West andNorth West respectively. The country is well endowed with forests and extensive river systems ofwhich the most important is the Mekong River, constituting a natural border with Thailand andMyanmar. Laos has about 25 % of the total area of the highly productive Mekong River basin.
Agriculture is the principle economic sector in Laos, accounting for about 52% of total GDPemploying 85.5 % of the labor force. Rice is the predominant crop grown in Laos, for 614,000agricultural holding in Laos grows this crop, accounting for 77% of all households in the country.Typically agricultural holdings in Laos is produced mainly for home consumption.
1.1 Production Zone
Rice production area in Laos can be divided into 3 groups:1. Rainfed Lowland,2. Rainfed Upland, and3. Irrigated area.
Major rice production zones locate in 7 provinces along the Mekong River, namely, Vientiane,Vientiane Municipality, Bolikhamxay, Khammuane, Savannakhet, Saravane, Champasak.
Of all harvested areas, the Central region of Laos where rice is most produced, accounting for 50 %of the total land area. In term of production ecology, rice is growing at varying altitudes. During1995-2000 period, it is estimated that 70% of the harvested rice area come from rainfed lowlandarea and 21% come from upland area.
1.2 Rice Cropping Systems and Rice Production by Type of Land
Most farmers engage in rice farming. Three predominant systems of rice production exist in thecountry:
1. Wet season lowland,2. Wet season upland, and3. Dry season.
In term of production by type of land, approximately 70% of rice production appeared in the Lowland Area. From 1998-2000, there was increasing trend in rice production in the irrigated landarea: from 13% in 1998 to 18% in 2002. During the wet season various varieties of rice are cultivated, though the proportion of high yieldingvarieties has increased phenomenally. Irrigated dry season cropping is under high yielding varieties.The following diagram sows the cropping sequence of various types of rice varieties in Laos.

Country Report : Laos
D - 2
Rice Cultivation Pattern in Laos
Type of Rice Jan Feb Mar Apr May Jun Jul Aug Sep Oct Nov DecShort Variety
-Land preparation
-Seeding-Transplanting
-Harvesting
Medium Variety-Land preparation
-Seeding
-Transplanting-Harvesting
Late Variety
-Land preparation
-Seeding-Transplanting
-Harvesting
Dry Season rice-Land preparation
-Seeding
-Transplanting-Harvesting
WetSeasonLowland
DrySeasonrice
Source: Ministry of Agriculture and Forestry, Complied by FAO Special Report FAO/WFP Crop and FoodSupply Assessment Mission to Laos. 15 March 2001
1.3 Crop Management
Most farmers employ one of two cultivation systems: either the wet-field paddy system, practicedprimarily in the plains and valleys, or the swidden cultivation system (slash-and-burn cultivation),practiced primarily in the hills.
Until recently, with the exception of production in irrigated environments, where extension serviceshave been better developed, most rice production in Laos has been based on systems of minimuminputs, concentrating on family labour.
1.4 Overview of Rice Production
(1) During 1975 - 1990
Rice production in Laos doubled between 1974 and 1986, from fewer than 700,000 tons to 1.4million tons; however, drought in 1987 and 1988 decreased annual yields by nearly one-third, toabout 1 million tons, forcing the government to rely on food aid for its domestic requirements. In1988 and 1989, some 140,000 tons of rice were donated or sold to Laos. With improved weather

Country Report : Laos
D - 3
and the gradual decollectivization of agriculture--an important measure under the New EconomicMechanism--rice production surged by 40 % in 1989.
Production continued to increase in 1990, although at a much slower rate, and the point of self-sufficiency in rice was reached: a record 1.5 million tons. Though this amount was sufficient at anational level, there were considerable regional differences in rice yields. The southern Mekongprovinces of Khammouan, Savannakhet, and Champasak regularly produce surpluses, as doVientiane and Oudomxai provinces, where the northern provinces experienced shortages. Aninadequate transportation system, however, often makes it easier for provinces with shortages topurchase rice from Thailand or Vietnam than to purchase it from other domestic provinces.
The overall increase in rice production throughout the 1980s was the result of higher productivityper hectare, rather than of an increase in the land area planted in rice; in fact, the area planted in ricedecreased during the 1980s, from 732,000 hectares in 1980 to 657,000 hectares in 1990. Becausefarmers make little use of fertilizers or irrigation, however, most land still yielded only one annualcrop in the early 1990s, despite government efforts to foster the use of double-crop rice. 1
(2) In the 1990s
Approximately 645,000 ha, represented more than 80% of the cropped land area engaged in ricecultivation in 1997. Total rice production in 1997 was 1.66 million tons. Severe flooding anddrought conditions in the rainfed lowland environment in 1995 and 1996 significantly reduced riceproduction by about 20% to 1.45 million tons.
Wet season rice cultivation accounts for about 96% of the rice area and about 97% of totalproduction. In 1997, the rainfed lowland ecosystem accounted for about 70.5% of the rice areas andabout 78.3% of production; the rainfed uplands accounted for a further 25.4% and 14.9% of the areaand production, respectively. The area planted to dry season irrigated rice in the 1996/97 dry seasonwas approximately 25,000 ha. This expansion of the irrigated are reflects official policy to reducethe large fluctuations in production that have been a usual characteristic of the rainfed dependentnature of rice production in Laos.
From 1997-2001 total of paddy production increased over period, namely, it increased 40% from1.66 million tons to 2.3 million tons in 2001. This is partly due to expanding in area harvested from600 thousand ha in 1997 to 746 thousand ha in 2001, respectively. This correlates with increasing inyield of paddy rice, which gradually increased from 28 thousand Hg/ha in 1997 to 30 thousandHg/ha in 2001.
1 Library of Congress, Federal Research Division, Country Study, Area Handbook Series, Laos.

Country Report : Laos
D - 4
Rice Production, Harvested Area and Yield 1997-20011997 1998 1999 2000 2001
Area Harvested (ha) 599,400 617,538 718,200 719,370 746,775
Yield (Hg/ha) 27,694 27,116 29,279 30,606 31,300
Production (MT) 1,660,000 1,674,500 2,102,815 2,201,700 2,334,500
Source: FAO online statistics and Ministry of Agriculture and Forestry, Laos
This remarkable achievement is attained through the increase in planted area and the improvementof yield. The main production areas are in the central and south regions where more land is stillavailable for rice cultivation. With better infrastructure such as irrigation and road, this rate ofproduction growth can be sustained for the next few years.
1.5 Agricultural Population, Land used, Fertilizer Consumption, and Tractor Used
Total population in Laos gradually increases over 5 years. Among these, agricultural populationaccounts for more than 75% of the country population.
Agricultural Population 1997 – 2000 (Unit : x 1,000)
1997 1998 1999 2000
Total population 4,918 5,036 4,156 5,279
Agricultural population 3,786 3,868 3,952 4,037
Source: FAO online statistics
Agricultural area accounts for 7% of total land of the country. It, however, has a tendency toincrease gradually over time as witnessed by increasing in agricultural area from 1,700 (1000 ha) in1995 to 1,805 (1000 ha) in 1999. Fertilizer consumption increased sharply from 1995 to 1998.
Land Area, Fertilizer and Tractor Used
Unit 1995 1996 1997 1998 1999
Total Area 1000 ha 23,680 23,680 23,680 23,680 23,680
Agricultural Area 1000 ha 1,700 1,700 1,756 1,780 1,805
Irrigation: AgriculturalArea 1000 ha 155 156 164 168 172
Total FertilizerConsumption MT 6,189 N/A N/A 10,166 NA
Tractors AgriculturalTotal in Use 890 N/A N/A 890F N/A
Source: FAO Online Statistics and FAO’s CORIFA, Laos
Agricultural Census 1998/1999 indicates that 64% of the result of total land used was for riceproduction, and Central area is where rice is most grown.

Country Report : Laos
D - 5
1.6 Main Production Constraints
During the last five years, rice yield has steadily increased. In order to further increase in riceyield, not only development of irrigation facilities is required, but also several constraints tosustainable rice production should be aware. These include:
- Drought in rainfed areas- Soil erosion and fertility losses in upland rice cultivation- Periodic flooding due to the swelling of Mekong River- Sandy soils with low level of fertility, especially P and K- Weeds, insects and diseases- Inadequate infrastructures- Inadequate credits and input supply-fertilizer and other agro-chemical- Small farm size- Price fluctuation- Storage- Popular preference to glutinous rice
1.7 Planted Varieties
Information from Ministry of Agriculture and Forestry, Laos states that Laos has rice variety of total14,000 types. Of these 80% are glutinous rice type Kor, Khor from Thailand. Others aretraditional rice with some was adapted from Vientiane. One of the high yield rice titled “Kai Noi”is only available in northern province of Laos, and is not available in the market.
1.8 Law/Decree/Regulation/Order regarding the Rice Production
Related laws with rice production in Laos include:1. Decree on Decree of the Prime Minister on the management and use of forests and forest land2. Land on Land (Law No. 01/97 NA, 1997)3. Law on the Promotion and Management of Foreign Investment4. Agricultural Law5. Land Tax Law
1.9 National Agricultural Development Plan 2
Economic policy since 1986 has emphasised reforms from a centrally planned to a market driveneconomy. Extensive privatisation of former state owned enterprises were part of this process. Thenumber of state owned enterprises fell dramatically from some 800 in 1990 to 29 in 2000. As themajority of the population depend on farming in rural areas as their main livelihood, economic
2 Excerpt from Library of Congress. Federal Research Division. Country Studies. Area Handbook Series. Laos and Special
Report FAO/WFP Crop and Food Supply Assessment Mission to Lao PDR 15 March 2001.

Country Report : Laos
D - 6
development is strongly linked to rural development. The Government focus in these areas is todevelop access to markets, improve rural and micro finance and credit, expand the irrigationnetwork and strengthen technology transfer.
Agriculture (including forestry and fisheries) is the most important sector in the economy,accounting for over 50 % of GDP. This sector is dominated by subsistence farmers, mainly engagedin wet season and, to a lesser extent, dry season rice production. In recent years, however,agriculture policy has strongly emphasised the development of irrigated dry season farming, toenhance rice production.
The introduction of the New Economic Mechanism in 1986 clearly benefited the agricultural sector.The changes positively affected performance by establishing a consistent policy that inducedincreased agricultural production over a number of years, especially in paddy production.
In June 1988, the government of Laos passed a resolution to reform the agricultural sector. Theprincipal goal was to reorient the sector toward a market economy. The abolition of agricultural taxand the restrictions on marketing assisted creating necessary incentives for farmers.
The major change was in the pricing policy. The practice of setting low producer prices for a widerange of crops was ended, boosting incomes in rural areas. (In 1987 the procurement price of ricewas only 30 % of the market price). Other changes were implemented. Restrictions on internal tradeof agricultural products were removed allowing free markets to operate, at least for important cropssuch as rice. Laws also were enacted to guarantee farmers' rights to private ownership of land,including the right to use, transfer commercially, and bequeath. Tax exemptions for specifiedperiods also were decreed. 3
The reforms emphasize the government's belief that further increasing and diversifying agriculturalproduction requires the participation encouragement of the private sector. Food security, as always,remains a key objective, but the focus of the new agricultural policy is on the production of cashcrops that can be processed--to increase their value--and then exported. The means for reaching thatgoal include the popular 1989 measure of abandoning the poorly developed attempts at establishingthe socialist infrastructure of agriculture--a cooperative farming system. 4
In March 1991, at the Fifth Party Congress, the government reiterated the basic objective of itsagricultural policy: a shift from subsistence production to cash crop production through cropdiversification and improved linkages to export markets. At the congress, the government alsoaffirmed its support for the private ownership of land and its intent to protect farmers' rights to long-term use of land, to bequeath land to their children, and to transfer their land rights in exchange forcompensation.
3 Ditto4 Ditto

Country Report : Laos
D - 7
Rice is considered as first priority commodity by the Government to increase level of its productionin the context of a market-oriented economy in accordance with the application of the NewEconomic Mechanism. Rainfed lowland rice and irrigated rice are considered as a priority foodsource before upland rice. Rice self-sufficiency at the national level is always the main governmentobjective.
Another important objectives of the national agricultural policy are the reduction of upland slash-and-burn agriculture and promote rainfed lowland and irrigated rice production. Governmentintends to develop at the maximum the potential of regions with comparative advantage for rainfedlowland rice production. Crop diversification is promoted in the rice-based production systems. Aprogressive intensification of rice production techniques and the utilization of the availabletechnology from research are also part of the Government policy. 5
1.10 National Rice Production Plan
Ministry of Agriculture and Forestry has planned targeted of rice production for Year 2002-2005that the yield shall increase gradually from 3.22 ton/ha in 2002 to 3.42 ton/ha in 2005. In term ofharvested area, it is planned that rice harvested area will expand 2.5% from Year 2002 to Year 2005.Production is expected to increase at the average 1 hundred thousand tons per year.
2. Rice Marketing System
An important objective of the government of Laos since the initiation of the economic reform in 1986,has been the development of an efficient market economy. The primary focus is to privatize formerstate enterprises and to greater promote domestic and international trade. Currently, the privatesector plays a more important role in the distribution of agricultural inputs, the procurement and tradeof rice. Despite of these developments, the level of market integration and development remains low,due to various problems of communications systems and access, inadequate market information and
5 ASEAN Secretariat. Country Report: Lao PDR.
2,300,000
2,400,000
2,500,000
2,600,000
2,700,000
2,800,000
Ton
s
Y2002 Plan Y2003 Plan Y2004 Plan Y2005 Plan
Year Plan
Lao Rice Production Plan Y2002-2005

Country Report : Laos
D - 8
low agricultural incomes. This is particularly witnessed amongst the rural poor.
As rice is mainly cultivated on family land holdings mostly for home consumption, the proportion soldis relatively small. From the interview with government officers of Ministry of Agriculture andForestry, 88% of rice production is for home consumption, whereas 12% is for domestic selling. Asmarket integration and communications remain highly under-developed, there is wide variation inprices among provinces.
2.1 Mechanism
The government has major role in the market of paddy/rice. The State Enterprise Food & CorpPromotion (SEFCP) is the agency involve in rice marketing and trade in Laos. There are also someprivate enterprise dealing with trading of rice in Laos. Most of them are import-export companies orprivate rice mill enterprises. The SEFCP intervenes in rice milling and marketing to differentdegrees from one province to another. It procures rice mainly for civil servants in its provinces, andexports rice when possible to neighboring countries. Where the SEFCP gives contracts to privatemillers, this adds an additional intermediary in the marketing chain and will probably increaseoverall marketing costs. In provinces where the SEFCP operates its own mills, there is a danger ofunfair competition with the private sector, as the SEFCP will be exempt from payment of licenses,taxes and free of certain restrictions concerning inter-provincial or export trade. 6
2.2 Marketing Channels
A large number of different marketing channels for paddy and rice are available in Laos. Farmerseither sell paddy or have it milled at a small village mill or a bigger mill at District level for sell asmilled rice and also for their home consumption. Paddy may be sold to collectors who visit the ruralareas or delivered to a mill via road or near the bigger towns, for slightly higher price. In manycases, middlemen visit household at farm level and buy paddy after harvesting and sell the paddy tothe SEFCP or to private rice mills. Private rice mills often purchase paddy at rice mill gate. Thepaddy is then processed and milled rice is distributed to retail markets in the province, and tohousehold processing units for noodle and alcohol distillery.
In addition, large rice farmers often have their own thresher. They thresh the paddy of smallerfarmers in the area for certain amount of payment. In some cases, the large farmer not only operatesa village mill, but also engages in role of being farmer, collector, miller and rice trader.
Generally, rice was transported by car via route 13, and by boat along the Mekong River. Given thatthe road condition is not in a good shape, transportation cost is one of the concerns for traders. Most of paddy and milled is channeled to the market through middlemen/collector, rice miller and
6 Information received from Ministry of Agriculture and Forestry, Lao PDR.

Country Report : Laos
D - 9
SEFCP. According to sampling made at producer level by the Ministry of Agriculture and Forestry,45% of domestic traded rice was sold to SEFCP, where as 35% to other private sectors, and 20%direct to consumer, respectively.
2.3 Type of Millers
Information from Ministry of Agriculture and Forestry, Laos reveals that thee are 3 types of millersin general. Combinations of the following miller types are usually be seen.
- Customs Milling: This begins with farmers or small traders bring their paddy to the mill.Milling can be free of charge in exchange with bran. This practice is most common in Laos. Thebran is then sold to poultry farmers. In some cases, milling fee is approximately K1,500/12 kg.However, in Vientiane province, a milling fee of K10,000/ 100 kg paddy is charge. Small andmedium sized mills usually carry out customs milling.
- Commercial Milling: The miller will by paddy and sell rice directly to the market retailers orvia intermediary traders. Millers who has storage capacity may store paddy up to 10 months, totake advantage of higher prices in August and September, before the new harvest begin.
- Contract Milling: This is for Government Institution, Department of Commerce in provincialgovernments, for SEFCP, and very rarely for international organizations such as World FoodProgram (WFP).
2.4 Domestic Rice Trade Flow
Domestic marketing channel of paddy/rice in Laos is shown in the following diagram:
Householdprocessing
CivilServants
Rice MillOther
Provinces/Export
HouseholdConsumption
45%35%
20%
12%-46%
88%-54%
Shop
Middlemen SEFCP
Producer
Selling
Retailer
Source: Ministry of Agriculture and Forestry, Laos.
In some cases, farmers sell paddy to Provincial miller, who then sell to Vientiane Miller before sell

Country Report : Laos
D - 10
to market retailer and to the consumer.
Consumer
ProvincialMiller
Farmer
MarketRetailer
VientianeMiller
3. Rice Price Policy
In supporting free market mechanism, the Government of Laos has no policy in fixing rice price in themarket. The Ministry of Commerce, however, announces minimum-buying price from farmersannually. The SEFCP is obliged to buy rice not lower than announced by the Ministry. Most recently,in November 2001, the minimum-buying price announced was 900 Kip/ paddy Kg. 7 (Equivalent toApproximately 5 Baht)
Some provincial government or SEFCP branches have objective of price stabilization. They issue aguideline floor price to paddy farmers and a ceiling retail price of rice. However, in practice theseprices can not be enforces since it would require a large budget for paddy procurement in good cropyears and a large stock of rice for release in time of shortage. The problem with stock lies in cost ofstorage and maintenance facilities. In case of Laos, with borders with Thailand and Vietnam, it will notplausible to maintain price that are very different from those across the border.
4. Rice Trade (Overseas)
4.1 Imports
Statistics from Ministry of Finance shows that imported rice doubled from 1985-1990. In addition,Lao’s rice import increased largely from 1995 to 1996 due to flooding in Mekong River whichresulted in decrease of local rice production in that year. Generally large number of imported riceinto Laos is for purpose of food aid.
7 Announcement of Ministry of Commerce and Tourism, Lao PDR.

Country Report : Laos
D - 11
Among the traders, Thailand is the major rice trade partner. Department of Foreign Trade, Ministryof Commerce, Thailand, provides the data on quantity of rice export from the Kingdom during 1997to 2001. It clearly shows that rice imported from Thailand is also decreasing. From 2000 to 2001,total rice export from Thailand to Laos decreased by 76%, namely, from 5,120 tons to 1,220 tons.Rice export from Thailand to Laos accounts for less than 1% of the total amount of rice export toAsia.
Volume of Imported Rice from Thailand to Laos during 1997-2001 (Unit: tons)
1997 1998 1999 2000 2001 % Change
To Asia 2,380,003 3,199,656 2,503,699 1,949,741 2,011,383 3.16
To Laos 38,203 15,196 3,804 5,120 1,220 -76.17
Source: Department of Foreign Trade, Statistics on Rice exportation during Y 1997-2001
The decreasing trend of rice import into Laos is due to government’s policy to have rice sufficiencyand to reduce importation. Some source informed that from Y2000 to present, Laos has notimported rice since there was enough rice in the country, with some surplus amount. However,imported rice still exists in form of food aid from foreign donors especially Japan, WFP.
In term of import location, Laos imported a small quantity of rice in the north in spite of the surplusin the south. This is owing to the transportation cost from the South to the North is high.Therefore, it would be cheaper to use the road network in Thailand. The market takes care of thisby exporting rice from the South and importing rice in the North.
Two main factors related to the import of Thai rice are the preference of wealthy people for qualityrice, and the drop of rice price in Thailand.
Imported rice into Lao PDR 1976-1999
0
5000
10000
15000
20000
25000
30000
35000
40000
45000
50000
1976 1980 1985 1990 1995 1996 1997 1998 1999
Year
To
ns

Country Report : Laos
D - 12
4.2 Exports
With a 40% increase in production and steady increase in consumption, the logical deduction wouldbe that there must be at least a 50% increase in export. It is a well accepted fact that there areunofficial exports along the border to its neighboring countries i.e. Vietnam, Thailand, and China.Some source mentioned that volume of export to Vietnam is much higher than the export toThailand. Approximately 50,000 tons of rice was exported from Laos to Vietnam in Y2001. Withthe potential increase in rice production in Laos, it is likely that the export from Laos will increasefurther in the future.
5. Rice Reservation
5.1 Rice Reservation by the Government
Rice reserve is considered as one of important procedures aiming to guarantee and stabilize ricesupplying. Laos has established rice reserve for stabilizing market prices, preventing andovercoming consequences of natural disasters, and supporting the defense security.
Though there is no law/regulation on rice reservation, the Government realizes the need of havesome sort of reserve for food security in the country. Generally if there is surplus amount of rice in ayear, this stock usually kept by the farmers around the country. It is expected that rice reserved inLaos is stored in form of paddy, glutinous rice. Approximate rice reserve is 3 months.
The government of Laos allocates budget for rice reserve annually. Since 1994, rice reserve capitalis provided by the government budget (approximately 10,000 tons of rice paddy) for purchasingreservation volume and assigned to the SECFP to manage the reserve.
Ministry of Agriculture and Forestry estimates that by the year 2005, total rice reserve will beapproximately 30,000-40,000 tons (the national rice reserve is about 4-5 kg. per person). In 2010,total rice reserve volume will double to 60,000-85,000 tons (national rice reserve is 8-10 kg. of rice/person.)
5.2 Rice Reservation for AFSR
Under the commitment of ASEAN Food Security Reserve Board (AFSR), Laos reserve 3,000 tonsof paddy, glutinous rice.

Country Report : Laos
D - 13
6. Rice Demand/ Consumption
6.1 Rice Stock
There is no clear evidence regarding rice stock in Laos. The FAO/WFP Special Mission to theLaos in the year 1999 concluded that official stocks held at national, provincial and district levels orin Government shops are limited and complete data do not exist. As the bulk of the harvest isavailable shortly before the end of the year, significant on-farm or trade inter-annual carryovers arelikely to be minimal. None of the villagers interviewed the Mission reported carryovers. In theabsence of complete and reliable data, it is assumed, in line with the previous missions, that therewill be zero net draws down. 8
6.2 Rice Supply/Demand Balance
A calculation from available information, namely data on production, import, consumption, andexport were summarized in the following table.
Rice Balance in Year 1995 - 2001 (Unit: million tons)Supply Demand
Year BeginningStock Production Import Total Local
Consumption Export EndingStock Total
1995/1996 - 0.851 0.016 0.867 0.978 - - 0.9781996/1997 - 0.848 0.027 0.875 0.998 - - 0.9981997/1998 - 0.996 0.020 1.016 1.030 - - 1.0301998/1999 - 1.005 0.006 1.011 1.056 - - 1.0561999/2000 - 1.262 0.005 1.266 1.082 - - 1.0822000/2001 - 1.321 0.010 1.331 1.109 - - 1.109
Source: Ministry of Agriculture and Forestry and Department of Customs and Electrical EnterpriseItalic: U.S. Department of Agriculture, World Agricultural Supply and Demand EstimatesProduction: Milled RiceConversion rate: Paddy/Milled = 60%Consumption per Capita: 212.43 kg./year (National Statistical Center, Expenditure and Consumption Survey
1997/98 )
Ministry of Agriculture and Forestry, Laos calculates the net availability of rice for humanconsumption in 2000-2002, under the assumption that per capita consumption is 180 milled rice.It finds that per capita net availability increased over the period of 2000-2002. The rice surpluswas witnesses since 2000, and continues to grow in 2002, specifically, from +110,000 metric tons to+178,200 metric tons. These findings also correlate with FAO/WPF Special Mission to Laos in1999’s report situation of rice supply/demand balance sheet for the 2001 marketing year (Jan/Dec)that there is zero import requirement for rice in Laos.
8 Special Report FAO/WFP Crop and Food Supply Assessment Mission to Lao PDR 4 March 1999.

Country Report : Laos
D - 14
6.3 Rice Consumption
With the 50% increase in production and no report on export, it implies that per capita consumptionof rice in Laos has increased enormously during the past 5 years. The level of consumption isabout 180 kg/cap/yr or about 0.5 kg/cap/day. This is supported by the household survey, which putthe per capita consumption at 358 kg. in paddy basis. However, the consumption for feed andseeds are property taken into account, the direct consumption may not be as high. If the properstatistic is account for the export, it is likely that the level of rice consumption in Laos is at beststaying the same or even declining.
6.4 Picture of Rice Surplus and Deficit by Region 9
From the estimation of 300 consumption of paddy per capita, we can map the surplus and deficitregion of Laos as shown in the table below. Of the overall picture, Laos has surplus rice ofapproximate 573,000 and 630,000 tons in 1999 and 2000, respectively. Northern region comprisingof 7 provinces experience rice deficit every year. This is, however, not to say the population has norice to eat, but they has no rice availability due to various factors e.g. limited planting area or thoseare area which emphasize on livestock promotion. Average rice deficit is 5-6 months.
Rice Surplus/ Deficit by Region ( Unit: tons )
Region 1997 1998 1999 2000
Northern (56,290) (62,844) (46,470) (59,061)
Central 173,180 208,346 413,801 449,061
Southern 89,430 38,922 208,154 245,700
Total 204,323 182,426 573,486 633,700
7. Rice/Paddy Price
Rice price in Laos varies from province and region. Market price in Vientiane is generally higherthan that in other rural areas. It is noticeable that Non-Glutinous rice price is higher than glutinous riceprice.
The disparity in price between the provinces is from 14% to 24.6% for glutinous rice and from 14.5%to 41.7% for non-glutinous rice. The number of population in one part and the large number ofindustries/businesses and agencies on the other part justify higher demand and price in VientianeMunicipality.
This price difference is also due to domestic consumption pattern, that majority of the population
9 Data on production and population is received from Ministry of Agriculture and Forestry, Lao PDR. Refer to Annex for
calculation.

Country Report : Laos
D - 15
prefers Glutinous rice to Non-Glutinous rice. Another point can be noticed is that Thai non-glutinousrice price is much higher than Lao glutinous rice price. 10
Imported rice from Thailand is reported in 5 market localities. The price of imported rice is higherthan the local rice from 9.6% in Vientiane Municipality to 68% in Pakse. There has been no recordson the import of rice by the municipal and provincial trade offices, therefore almost Thai rice havebeen smuggled and it is a serious shortcoming influencing the rice market.
William E Worner, the Lecturer in Economics University of Western Sydney, Nepean studied thecomparison of retail glutinous rice prices in Vientiane and in Thailand under assumption that rice is animportant wage good so the price of rice impacts on the real wage of workers in the monetary sector.The study reveals the findings that the market price of glutinous rice in Vientiane approximates theprice in the Northeast of Thailand, at least in the long run. Any short run divergence between the twoprices in response to exogenous shocks in one or both of the markets, such as drought or domesticmacroeconomic policies, could be expected but the forces of competitive arbitrage would eventuallyset them on a convergent path. 11 His finding was supported by statistical comparison of priceindexes in two economies.
8. Food Aid
Between 1975 and 1990, total foreign aid to Laos, including grants and loans, was approximatelyUS$2.3 billion. Of this sum, only 65 % had been spent as of 1989, of which grants and loans made upapproximately equal quantities. 55 % of spent aid derived from the nonconvertible currency area,17.8 % from convertible currency area countries, and 27.2 % from international organizations andfinancial institutions. 12
10 See detail rice price in Annex11 Worner, William E. The Retail Glutinous Rice Price in Vientiane12 Library of Congress. Federal Research Division. Country Studies. Area Handbook Series. Laos
Trend in Market Rice Price in Vientiane Municipality 1980-1999
0
500
1000
1500
2000
2500
3000
1980 1985 1990 1995 1996 1997 1998 1999
Year
Kip
/ Kg
Glutinous RiceOrdinary Rice

Country Report : Laos
D - 16
Other kinds of aid are provided by international organizations such as the UNDP, the AsianDevelopment Bank, the International Development Association, and the IMF. Multilateralorganizations provide large loans in support of government reforms--in 1990 and 1991, the IMF andthe Asian Development Bank made loans worth US$37 million for this purpose. Aid to Laos covers awide range of activities, including technical and capital assistance for such projects as hydroelectricpower stations (Sweden), a livestock vaccination program (the UNDP), and scholarships foragricultural study (Thailand).
Other types of aid include loan forgiveness: in 1991 Japan and Germany forgave loan liabilities worthUS$32.3 million. Despite the country's continued striving to reach food self-sufficiency, it relies onfood aid for its domestic needs during years of poor harvest. In 1988 and 1989, for example, 140,000tons of food aid were donated or sold to Laos to make up for shortfalls caused by drought. Food aid incash or in kind was donated to Laos in 1991 by the Food and Agriculture Organization and the UNDP,and by the United States, Australia, Thailand, and the Netherlands. 13
8.1 Food Assistance Needs in 2001
Although the rice balance prepared by FAO/WFP special mission year 1999 indicates that in 2001,Laos will have a satisfactory rice situation overall, however, the food security situation in any givenyear remains susceptible to natural catastrophes such as floods and droughts and, therefore,precarious for large numbers of vulnerable people who are on the borderline between subsistenceand food insecurity.
8.2 Analysis of Food Insecurity in Laos
The FAO/WFP Special Mission in 1999 analyzes the food insecurity in Laos as follows: 14
Food insecurity in Laos is primarily defined in terms of rice self-sufficiency as the crop constitutesthe main staple and accounts for almost all cereal consumption in the diet. Although nationally thereis no problem of rice this year, there are large spatial variations in the production and access to rice.Nine out of 18 provinces and 69 out of 141 districts still face food supply shortages. Combined withweak infrastructure, and low non-farm/natural resource based income opportunities, the purchasingpower of food deficit populations is highly constrained.
A preliminary draft of a household survey, estimates that some 27 % of households face riceshortages annually, whilst the LECS II 1997/98 study estimated that about 30 % of the householdsare below the food poverty line. In addition, health and nutrition indicators point to seriousproblems amongst sizeable segments of the population. Over 40 % of the children are malnourished,and the infant mortality rate is 82 per 1000 live births.
13 Ditto14 Special Report FAO/WFP Crop and Food Supply Assessment Mission to Lao PDR 15 March 2001

Country Report : Laos
D - 17
As in most developing countries, rice/food access and hence vulnerabilities (or lack thereof) arelargely based on natural resources and geography especially for the rural poor. Laos can be broadlyclassified into six food economy/access areas based on geography. These areas are primarilyselected on differences in access to food.
8.3 Types of Food Aid Intervention
Study by FAO/WFP indicates that Laos still need food aid intervention. This is being servedthrough the WFP food for work mechanism. This scheme helps villagers plan their priorities anduses food assistance to enable them to implement activities identified by the community (roads,canals, etc.). WFP works closely with the Ministry of Labor and Social Welfare to implement itsprojects and NGO's/other bilateral and international agencies.
The Ministry and WFP jointly decide on areas of intervention. Appropriate NGO's who can bring incomplementary resources are also involved in the planning and implementation of the projects. Ajoint list of districts and villages are decided upon and a village planning exercise decides on thetype of intervention.
In addition, WFP has set up a decentralized coordination structure with Provincial departments ofRural Development, Labor and Social Welfare, Agriculture and others. This group in conjunctionwith govt. district officers makes decisions at village level for food aid interventions. Detailedanalysis of crop loss, and coping strategies are done both using quantitative data at central level andqualitative analysis at Province level and the overlaps between them are chosen.
8.4 Rice Aid in Year 1992 - 2001
A key operation of rice aid in Laos is under the World Food Program. Statistically, Laos receivedrice aid from 1992-2001 total of 73,549 MT, or equal to average of 8,200 MT.
Year Rice Distributed (MT) Year Rice Distributed (MT)1992 11,000 1997 27,8071993 2,986 1998 3,4101994 9,680 1999 -1995 4,284 2000/01 4,4921996 9,890 Total 73,549
Source: World Food Program
In 2001, Laos received food aid, specifically, 4,100 MT rice aid from United States of America.This amount was in form of rice via the World Food Program, which worth 1.086.50 thousanddollar. 15
15 Foreign Agricultural Service, Food Aid Statistics, USDA, Online Edition

Country Report : Laos
D - 18
Several other projects of food aid via World Food Program to Laos include: 16
- Primary Education for Girls and Boys in Remote Areas of Laos (1 August 2001-31 July 2004)- Improvement of household food security (3 years, through July 2003)- Emergency operation under Assistance to Flood Affected People in Laos (November 2000 to
March 2002)- Emergency operation under Support for Worst Affected Flood Victims (1 October 2000- 31
December 2000)
In most programs above, rice will be bought from Thailand, Vietnam or China. Other parts will besource locally where there is surplus in rice.
Summary of Aid to Laos via World Food Program
Name of Program Duration Type of Aid Total Commitments(tons)
Primary Education forGirls and Boys inRemote Areas of Laos
36 Months(August 2001 - July 2004)
Morning SnacksTake home rationincluding riceWeekly ration
7,306
Improvement ofHousehold FoodSecurity
3 years, through July 2003
Remuneration in foodas wageRation of 5 KG of riceThe long-termobjective of the projectis to assist food-insecure villagers tobecome more self-reliant through village-based communitydevelopment
Rice: 8,644
Assistance to FloodAffected People inLaos
Nov. 2000 - March 2002 Glutinous Rice (30 KGper person) Glutinous Rice: 8,160
Support for WorstAffected FloodVictims
Three months(Oct. 2000 - 31 Dec. 2000)
Glutinous Rice (30 KGper person) Glutinous Rice:520
Source: World Food Program, WFP-Assisted Projects, Laos.
16 World Food Program, Projects –Laos, WFP assisted projects, Online Edition

Country Report : Laos
D - 19
9. Poverty
Laos is considered as a least developed country. It received several aids from foreign donorsspecifically Japan, and USA. 46.1 % of population is below the poverty line. Information fromAsian Development regarding the poverty situation is shown in the table below:
1990 Most recent
Population, mid-year, Million 4.1 5.1 (1999)Annual Growth Rate, 1990 - 1999 (%) 2.4Life Expectancy at Birth (Years) Female 51 55 (1998) Male 49 53 (1998)
Per Capita GNP (US$) 400 (1996) 280 (1999)
Poverty Incidence (National Poverty Line) … 46.1 (1993) Rural … 53.0 Urban … 24.0Income Ratio: Highest 20% / Lowest 20% … 4.2 (1992)Gini Coefficient … 0.30 (1992)
Adult Literacy Rate (%) Female 39 49 (1996) Male 65 74 (1996)Gross Primary School Enrollment Ratio (%) Girls 92 101 (1996) Boys 118 123 (1996)
Maternal Mortality Rate (per 100,000 live births) … 650 (1990-98)Infant Mortality Rate (per 1,000 live births) 108 96 (1998)Child Malnutrition (% of children under 5) 37 (1980-85) 40 (1992-98)
Population with Access to Safe Water (%) Rural … 39 (1990-96) Urban … 40 (1990-96)Population with Access to Sanitation (%) Rural … 13 (1990-96) Urban … 70 (1990-96)Source: Selected poverty and related indicators, Asian Development Bank (Main source of poverty
data: World Bank, World Development Indicators 2000)
The IRRI, provides projected population of Laos in the next 50 years as follow. The number ofpopulation is expected increased 70% for 1998 to 2020, and more than 100% from 1998 to 2050.
Given the situation of existing poverty, Laos has requested aids from international organization such asWorld Bank, International Monetary Fund (IMF), World Food Program, etc. The policy paperregarding poverty reduction appears in the Country Poverty Reduction Strategy Paper, which wasprepared by each country’s government.

Country Report : Laos
D - 20
Population (million)Estimated Projected GNP per capita
Year 1998 Year2020
Year2050
InfantMortality (Per
1000 livebirths)1998
Lifeexpectancy
at birth(Years) 1998 ($)
Average annualgrowth rate (%)
1990-19985.2 8.8 13.3 96 53.7 320 3.5
Source: www.riceweb.org, IRRI
In 2001, the government of Laos submitted the Interim Poverty Reduction Strategy Paper to the IMFand International Development Association, based on five-year National Socio-EconomicDevelopment Plan (NSEDP) for 2001-2005. The Interim Poverty Reduction Strategy Paper (I-PRSP)summarizes the government’s key objectives and policies to reduce poverty in the long run andhighlights the participatory process followed in preparing the document, especially on consultationswith various national groups and development partners. 17
17 International Monetary Fund, Assessment of the Interim Poverty Reduction Strategy Paper, Poverty Net Library

Country Report : Laos
D - 21
10. National Food Security Policy
The attempts to reduce poverty and stabilize food security were witnessed in form of NationalAgricultural Policy and Food Security Policy. Even though there is no separate Food Security Policy,the government’s concern of food security is reflected from New Economic Mechanism, which aimsto improve agricultural production as well as expand market integration.
Most recently, the policy matrix in the government Interim Poverty Reduction Strategy Paper (I-PRSP) submitted to the IMF on March 20, 2001 emphasizes several policies of Laos to be takenduring 2001-2003. Below is the excerpt from the matrix regarding agricultural policy:
Policy Area Objective Strategies and Measures Timing
Promote the area based on decentralized development 2001-03
Develop comprehensive network of Focal Sites as akey tool to develop potentialities in the rural areas:Intensify rice production through improved support tofarmersImprove and diversify farming systems with increasedand diversified cash crop, livestock and fisheriesproduction.Promote value added agro-processing industries,especially SMEsPromote catchment area-based integrated andparticipatory development in the uplandsIntensify efficient small-scale irrigation schemesDevelop road systems, particularly in the focal sitesReduce shifting cultivation in particular area
2001-03
Agriculturaland RuralDevelopment
Ensure food security,Promote market-basedfarming, Reducedisparities betweenlowland and slopingland farming
Improve research and extension system includingrural finance to promote diversification andintensification of agriculture.
2001-03
Source: IMF, Laos: Interim Poverty Reduction Strategy Paper (I-PRSP): POLICY MATRIX
In addition, the draft of Food Security Strategy, Ministry of Agriculture and Forestry Y2000 revealsthe objectives of 10-year food security plan of Laos as below:
- Year 2000-2005: To produce enough and stabilize food production at an average of 450-500 kg. ofpaddy caput (average yield will be 2.7-3 millon tons by 2005), basically to solve a problem offood distribution in the remote areas, and to improve level of food security for household scale.Daily energy requirement is expected no less than 2,300 kcal per capita.
- Year 2005-2010: To achieve foodstuff security in the aspects of an average of 500 kg of paddy percapita (paddy equivalent yield of approximately 3.5-4 million tons by the year 2010), daily energyrequirement is expected in between 2,400-2,500 kcal per capita and satisfaction of other foodstuffdemands.
- Year v2010-2020: To achieve nutrition security in the aspects of sustaining proper daily intake anddaily requirement would be 2,600-2,700 kcal per capita.

Country Report : Laos
D - 22
References
1. Asian Development Bank. Selected poverty and related indicators.2. CIA World Fact Book. On-line Edition.3. Country Paper from the meeting of ASEAN Secretariat. Laos.4. Department of Foreign Trade. Thailand Ministry of Commerce. Statistic on Rice exportation
during Y1997-2001.5. FAO Country Rice Fact. Laos6. FAO Special Report FAO/WFP Crop and Food Supply Assessment Mission to Laos. 15 March
2001.7. FAO Special Report. FAO/WFP Crop and Food Supply Assesment Mission to Laos. 4 March
1999.8. Foreign Agricultural Service. Food Aid Statistics. USDA. On-line edition9. Foreign Agricultural Service. Time Series Statistic. USDA.10. International Monetary Fund. Assessment of the Interim Poverty Reduction Strategy Paper.
Poverty Net Library.11. International Monetary Fund. Laos: Interim Poverty Reduction Strategy Paper (I-PRSP): Policy
Matrix.12. Interview with senior government officers of Ministry of Agriculture and Forestry. Laos during
the visit 19-21 March 2002.13. Library of Congress. Federal Research Division. Country Studies. Area Handbook Series. Laos.14. Ministry of Agriculture and Forestry, Laos (Main Statistics and polices)15. Ministry of Commerce and Tourism, Laos. Announcement of buying rice price.16. National Statistic Center, Expenditure and Consumption Survey 1997/199817. National Statistical Center, Basic Statistics of the Laos 1975-200018. Royal Thai Embassy, Vientiane19. World Food Program. WFP Assisted Project. Laos.20. Worner, William E. The Retail Glutinous Rice Price in Vientiane.

Country Report : Laos
D - 23
Annexes
1. Lao PDR at a glance & Social Indicators (World Bank Data)
2. Rice (paddy) Production by region, 1976 - 2000
3. Rice (paddy) Harvested area by region, 1976 - 2000
4. Rice (paddy) Yield by region, 1976 - 2000
5. Area of holdings and Land used in 1998/1999
6. Rice production by types of land, 1998 - 2000
7. Rice production zone in Lao PDR
8. Rice variety in Lao PDR
9. Rice production in 2001, and Rice production plan for 2002-2005
10. Daily rice intake per person by region in 1997/1998
11. Rice consumption in Asian countries (for reference)
12. Overview of situation of rice balance by region
13. Market price of rice in Vientiane Minicipality, 1980-1999
14. Comparison of market prices of rice/paddy (Week of 6-13 March 2002)
15. Rice import, 1976 - 1999
16. List of Prohibited Crops import to Lao PDR
17. Distribution of Rice Aid to Lao PDR Y1992-2001
18. Agricultural Census 1998/99

Lao PDR at a glance 9/21/01
EastPOVERTY and SOCIAL Lao Asia & Low-
PDR Pacific income2000Population, mid-year (millions) 5.2 1,853 2,459GNI per capita (Atlas method, US$) 330 1,060 420GNI (Atlas method, US$ billions) 1.7 1,964 1,030
Average annual growth, 1994-00
Population (%) 2.5 1.1 1.9Labor force (%) 2.2 1.4 2.4
Most recent estimate (latest year available, 1994-00)
Poverty (% of population below national poverty line) .. .. ..Urban population (% of total population) 24 35 32Life expectancy at birth (years) 54 69 59Infant mortality (per 1,000 live births) 93 35 77Child malnutrition (% of children under 5) 40 13 ..Access to an improved water source (% of population) 90 75 76Illiteracy (% of population age 15+) 51 14 38Gross primary enrollment (% of school-age population) 112 119 96
Male 123 121 102Female 101 121 86
KEY ECONOMIC RATIOS and LONG-TERM TRENDS
1980 1990 1999 2000
GDP (US$ billions) .. 0.86 1.8 2.1
Gross domestic investment/GDP .. .. 22.7 20.4Exports of goods and services/GDP .. 11.3 24.7 22.9Gross domestic savings/GDP .. .. .. ..Gross national savings/GDP .. .. 16.4 14.6
Current account balance/GDP .. -11.8 -5.2 -4.6Interest payments/GDP .. 0.3 0.5 0.5Total debt/GDP .. 204.5 143.8 116.4Total debt service/exports .. 8.7 7.1 7.5Present value of debt/GDP .. .. 78.9 ..Present value of debt/exports .. .. 267.2 ..
1980-90 1990-00 1999 2000 2000-04(average annual growth)GDP .. 6.5 7.3 5.7 6.6GDP per capita .. 3.8 4.7 3.3 4.0Exports of goods and services .. .. .. .. ..
STRUCTURE of the ECONOMY1980 1990 1999 2000
(% of GDP)Agriculture .. 61.2 53.5 52.9Industry .. 14.5 22.5 22.8
Manufacturing .. 10.0 16.9 17.2Services .. 24.3 24.0 24.3
Private consumption .. .. .. ..General government consumption .. .. .. ..Imports of goods and services .. 24.5 .. ..
1980-90 1990-00 1999 2000(average annual growth)Agriculture 3.5 4.9 8.2 5.0Industry 6.1 11.0 8.0 7.6
Manufacturing 8.9 11.7 7.1 7.8Services 3.3 6.6 6.7 6.0
Private consumption .. .. .. ..General government consumption .. .. .. ..Gross domestic investment .. .. .. ..Imports of goods and services .. .. .. ..
Note: 2000 data are preliminary estimates.
* The diamonds show four key indicators in the country (in bold) compared with its income-group average. If data are missing, the diamond willbe incomplete.
0
5
10
95 96 97 98 99 00
GDI GDP
Growth of investment and GDP (%)
Lao PDR
Low-income group
Development diamond*
Life expectancy
Access to improved water source
GNIpercapita
Grossprimary
enrollment
Lao PDR
Low-income group
Economic ratios*
Trade
Domesticsavings
Investment
Indebtedness
Kondo
D-24

Lao PDR
PRICES and GOVERNMENT FINANCE1980 1990 1999 2000
Domestic prices(% change)Consumer prices .. .. 134.0 27.1Implicit GDP deflator .. 38.0 126.5 23.8
Government finance(% of GDP, includes current grants)Current revenue .. 10.0 19.6 19.4Current budget balance .. .. 9.6 8.9Overall surplus/deficit .. .. -6.2 -5.7
TRADE1980 1990 1999 2000
(US$ millions)Total exports (fob) .. .. 363 393
Wood products .. .. 106 120Agriculture .. .. 8 13Manufactures .. .. 100 88
Total imports (cif) .. .. 554 591Food .. .. .. ..Fuel and energy .. .. .. ..Capital goods .. .. 147 74
Export price index (1995=100) .. .. .. ..Import price index (1995=100) .. .. .. ..Terms of trade (1995=100) .. .. .. ..
BALANCE of PAYMENTS1980 1990 1999 2000
(US$ millions)Exports of goods and services .. 102 509 544Imports of goods and services .. 214 601 636Resource balance .. -111 -93 -93
Net income .. -1 -28 -37Net current transfers .. 11 30 30
Current account balance .. -102 -91 -99
Financing items (net) .. 135 94 143Changes in net reserves 3 -34 -3 -44
Memo:Reserves including gold (US$ millions) .. 0 106 140Conversion rate (DEC, local/US$) 10.2 708.6 5,864.4 6,280.8
EXTERNAL DEBT and RESOURCE FLOWS1980 1990 1999 2000
(US$ millions)Total debt outstanding and disbursed 350 1,768 2,527 2,499
IBRD 0 0 0 0IDA 6 131 405 403
Total debt service 3 9 37 42IBRD 0 0 0 0IDA 0 1 5 7
Composition of net resource flowsOfficial grants 16 47 56 65Official creditors 54 146 61 55Private creditors 0 0 0 0Foreign direct investment 0 6 79 30Portfolio equity 0 0 0 0
World Bank programCommitments 13 48 2 0Disbursements 5 32 21 20Principal repayments 0 0 2 4Net flows 5 32 19 17Interest payments 0 1 3 3Net transfers 5 31 16 14
The World Bank Group: http://www.worldbank.org/data/ 9/21/01
-20
-15
-10
-5
0
94 95 96 97 98 99 00
Current account balance to GDP (%)
0
200
400
600
800
94 95 96 97 98 99 00
Exports Imports
Export and import levels (US$ mill.)
0
50
100
150
95 96 97 98 99 00
GDP deflator CPI
Inflation (%)
G: 7
D: 655
C: 42
B: 403
E: 1,392
Composition of 2000 debt (US$ mill.)
A - IBRDB - IDAC - IMF
D - Other multilateralE - BilateralF - PrivateG - Short-term
Kondo
D-25
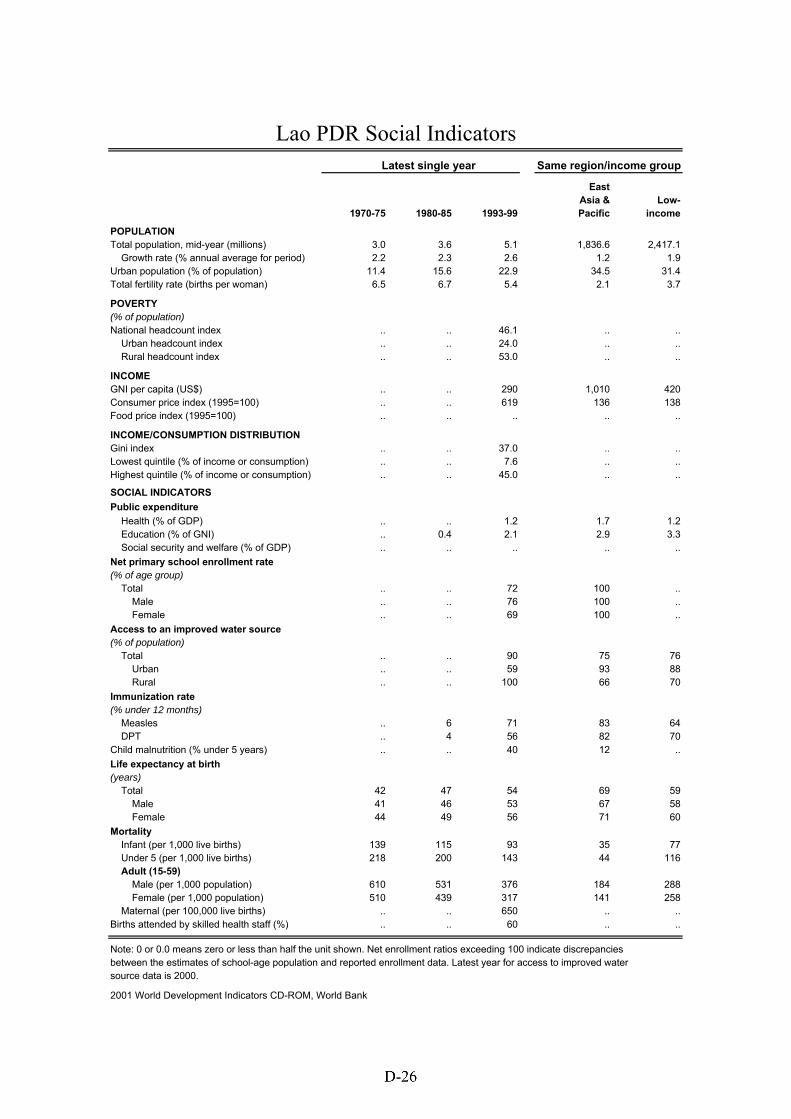
Lao PDR Social IndicatorsLatest single year Same region/income group
East
Asia & Low-1970-75 1980-85 1993-99 Pacific income
POPULATION Total population, mid-year (millions) 3.0 3.6 5.1 1,836.6 2,417.1 Growth rate (% annual average for period) 2.2 2.3 2.6 1.2 1.9Urban population (% of population) 11.4 15.6 22.9 34.5 31.4Total fertility rate (births per woman) 6.5 6.7 5.4 2.1 3.7
POVERTY(% of population)National headcount index .. .. 46.1 .. .. Urban headcount index .. .. 24.0 .. .. Rural headcount index .. .. 53.0 .. ..
INCOMEGNI per capita (US$) .. .. 290 1,010 420Consumer price index (1995=100) .. .. 619 136 138Food price index (1995=100) .. .. .. .. ..
INCOME/CONSUMPTION DISTRIBUTIONGini index .. .. 37.0 .. ..Lowest quintile (% of income or consumption) .. .. 7.6 .. ..Highest quintile (% of income or consumption) .. .. 45.0 .. ..
SOCIAL INDICATORSPublic expenditure Health (% of GDP) .. .. 1.2 1.7 1.2 Education (% of GNI) .. 0.4 2.1 2.9 3.3 Social security and welfare (% of GDP) .. .. .. .. ..Net primary school enrollment rate(% of age group) Total .. .. 72 100 .. Male .. .. 76 100 .. Female .. .. 69 100 ..Access to an improved water source(% of population) Total .. .. 90 75 76 Urban .. .. 59 93 88 Rural .. .. 100 66 70Immunization rate(% under 12 months) Measles .. 6 71 83 64 DPT .. 4 56 82 70Child malnutrition (% under 5 years) .. .. 40 12 ..Life expectancy at birth(years) Total 42 47 54 69 59 Male 41 46 53 67 58 Female 44 49 56 71 60Mortality Infant (per 1,000 live births) 139 115 93 35 77 Under 5 (per 1,000 live births) 218 200 143 44 116 Adult (15-59) Male (per 1,000 population) 610 531 376 184 288 Female (per 1,000 population) 510 439 317 141 258 Maternal (per 100,000 live births) .. .. 650 .. ..Births attended by skilled health staff (%) .. .. 60 .. ..
Note: 0 or 0.0 means zero or less than half the unit shown. Net enrollment ratios exceeding 100 indicate discrepanciesbetween the estimates of school-age population and reported enrollment data. Latest year for access to improved watersource data is 2000.
2001 World Development Indicators CD-ROM, World Bank
Kondo
D-26

2. Lao PDR : Rice (paddy) Production by region, 1976 - 2000 Unit: Tons
Region 1976 1980 1985 1990 1995 1996 1997 1998 1999 2000
Northern 206,244 313,720 344,615 420,713 431,720 419,873 417,980 423,333 451,860 451,839
Central 253,347 468,785 677,362 730,887 650,734 690,941 863,720 916,169 1,139,321 1,193,061
Southern 201,347 270,623 373,200 339,895 335,375 302,686 378,300 334,998 511,634 556,800
Total 660,938 1,053,128 1,395,177 1,491,495 1,417,829 1,413,500 1,660,000 1,674,500 2,102,815 2,201,700 Source: Ministry of Agriculture and Forestry, Lao PDR
3. Lao PDR : Rice (paddy) Harvested area by region, 1976 - 2000 Unit: Thousand ha
Region 1976 1980 1985 1990 1995 1996 1997 1998 1999 2000
Northern 185,030 254,170 232,750 224,080 195,920 191,920 178,330 175,410 194,320 190,220
Central 214,970 309,500 289,980 285,100 228,600 239,970 280,690 298,040 354,040 357,010
Southern 124,570 168,380 140,760 141,120 135,370 121,850 142,270 114,090 169,220 172,140
Total 524,570 732,050 663,490 650,300 559,890 553,740 601,290 587,540 717,580 719,370 Source : Ministry of Agricultural and Forestry, Lao PDR
4. Lao PDR : Rice (paddy) Yield by region, 1976 - 2000 Unit: Tons/Hectare
Region 1976 1980 1985 1990 1995 1996 1997 1998 1999 2000
Northern 1.11 1.23 1.48 1.88 2.20 2.19 2.34 2.41 2.33 2.38
Central 1.18 1.51 2.34 2.56 2.85 2.88 3.08 3.07 3.22 3.34
Southern 1.62 1.61 2.65 2.41 2.48 2.48 2.66 2.94 3.02 3.23
Average 1.26 1.44 2.10 2.29 2.53 2.55 2.76 2.85 2.93 3.06 Source : Ministry of Agricultural and Forestry, Lao PDR
Year
Year
Year
Paddy : Production by region
-
500,000
1,000,000
1,500,000
2,000,000
2,500,000
1976 1980 1985 1990 1995 1996 1997 1998 1999 2000
To
ns
Northern Central Southern Total
Paddy: Total Harvested area (1997-2000)
0
100,000
200,000
300,000
400,000
500,000
600,000
700,000
800,000
1976 1980 1985 1990 1995 1996 1997 1998 1999 2000
Th
ou
san
d H
ecta
res
Rice Paddy:Average Yied (1976-2000)
0.50
1.00
1.50
2.00
2.50
3.00
3.50
1976 1980 1985 1990 1995 1996 1997 1998 1999 2000
To
ns/
Hec
tare
s
Laos D - 27

5. Area of holdings and Land used in 1998/1999Unit: Thousand ha
Rice Other
Northern 324.4 205.3 40.7 50.4 296.4 11.9 0.8 15.0 20% 4% 5% 1% 0% 1%
Central 455.2 308.6 34.1 39.4 382.1 14.8 15.0 43.3 29% 3% 4% 1% 1% 4%
Southern 268.2 165.7 10.6 22.4 198.7 54.5 1.5 13.3 16% 1% 2% 5% 0% 1%
Total 1,047.8 679.6 85.4 112.2 877.2 81.2 17.3 71.6 65% 8% 11% 8% 2% 7%
Source: Lao Agricultural Census, 1998/99. Ministry of Agriculture and Forestry, Lao PDR
6. Rice production by types of land, 1998 - 2000
Land Type 1998 1999 2000(%) (%) (%)
Lowland 74% 71% 70%
Irrigated 13% 17% 18%
Upland 13% 12% 12%
Total 100% 100% 100%
Source: Ministry of Agriculture and Forestry, Lao PDR
354,000
246,790
2,104,814
1,248,890
212,110
213,500
1,676,498
1,502,025 1,552,800
390,150
258,750
2,203,700
Region
Agricultural Land
Arable Land
Temporary Crop FallowLand
TotalArableLand
Permanent
Crops
Area ofHoldings
OtherLand
Percentage of Land Used
RiceOtherCrop
Fallowland
Permanent
Crop
(Tons) (Tons) (Tons)
GrazingLand
GrazingLand
OtherLand
Year
1998 1999 2000
Land Use of Holdings, 1998/99
Rice64%
Other Crop8%
Fallow land11%
PermanentCrop8%
Grazing Land2%
Other Land7%
Rice Production by Types of Land Y2000
Lowland70%
Upland12%
Irrigated18%
Laos D - 28

7. Rice production zone in Lao PDRMajor Production Zones
Savannakhet
Champasak
Luang Prabang
Vientaine Municipal
Saravane
Vientaine
Oudomxay
Houaphanh
Khammouane
Sayabouly
Phongsaly
Borikhamxay
Xieng Khouang
Total of above zonesSource: FAO's Country Rice Fact, Lao PRD
8. Rice variety in Lao PDR
Variety Name Released period Growth duration (days) Varietal type OtherThadokkham 1 1993 135-140 Glutinous Resistant to BPHThadokkham 2 1993 135-140 Glutinous Resistant to blastPhone Ngam 1 1994 125-130 Glutinous Resistant to blastPhone Ngam 1995 Flowering Mid October Glutinous Resistant to bacterial leaf blight and blastThadokkham 3 1997 130 Glutinous Resistant to bacterial leaf blight and blast and BPHNamtane 2 1998 130 Glutinous Resistant to blastThadokkham 4 1998 Flowering Mid October Glutinous Resistant to bacterial leaf blight and blast and BPHThasano 1 1998 130 Glutinous Resistant to bacterial leaf blight and blast1266 1980-95 Resistant to leaf blightCR203 1980-95 130 non glutinous Resistant to bacterial leaf blight and blastHang yi 71 1980-95KMD 105 1980-95 AromaticNSG 19 1980-95RD10 1980-95 GlutinousRD23 1980-95 GlutinousRD6 1980-95 Glutinous Resistant to blastRD8 1980-95 Glutinous Resistant to blastDok mai Traditional GlutinousDok-tiaw Traditional GlutinousHom nang nuan Traditional GlutinousLay-keaw Traditional GlutinousMak-hing Traditional GlutinousMak-yom Traditional GlutinousMuang-nga Traditional Glutinous Resistant to blastNang nuan Traditional GlutinousTa-khiat Traditional Glutinous Resistant to blastSource: FAO. CORIFA (Country Rice Fact). Online Edition.
7.83%
6.90%
6.53%
4.59%
5.65%
% in total harvested area
15.41%
12.63%
10.65%
3.66%
3.29%
89.71%
4.59%
4.15%
3.83%
Laos D - 29

9. Lao PDR : Rice production in 2001, and Rice production plan for 2002-2005
Total of Rice 746,775 3.13 2,334,500 770,900 3.22 2,481,000 782,100 3.29 2,570,000 789,600 3.36 2,654,000 804,400 3.42 2,752,000
Lowland rainfed 486,770 3.33 1,619,700 530,000 3.34 1,770,000 540,000 3.36 1,813,000 550,000 3.39 1,866,000 560,000 3.41 1,907,000
Upland rainfed 55,080 2.00 110,170 57,000 2.02 115,000 59,000 2.03 119,500 62,000 2.05 127,000 65,000 2.05 133,000
Upland Slash and Burn 102,925 1.64 168,430 73,900 1.65 122,000 58,100 1.66 96,500 42,600 1.67 71,000 29,400 1.68 49,500
Irrigated rice 102,000 4.28 436,200 110,000 4.31 474,000 125,000 4.33 541,000 135,000 4.37 590,000 150,000 4.42 662,500
Source: Ministry of Agriculture and Forestry, Lao PDR
Production(tons)
Achieved in Y2001
Item HarvestedArea (ha)
Yield(Ton/ha)
Y2002 Plan
HarvestedArea (ha)
Yield(ton/ha)
Production(tons)
Y2003 Plan
HarvestedArea (ha)
Yield(Ton/ha)
Production(tons)
Y2004 Plan
HarvestedArea (ha)
Yield(Ton/ha)
Production(tons)
Y2005 Plan
HarvestedArea (ha)
Yield(Ton/ha)
Production(tons)
2,300,000
2,400,000
2,500,000
2,600,000
2,700,000
2,800,000
Ton
s
Y2002 Plan Y2003 Plan Y2004 Plan Y2005 Plan
Lao PDR : Rice Production Plan Y2002-2005
Laos
D-30
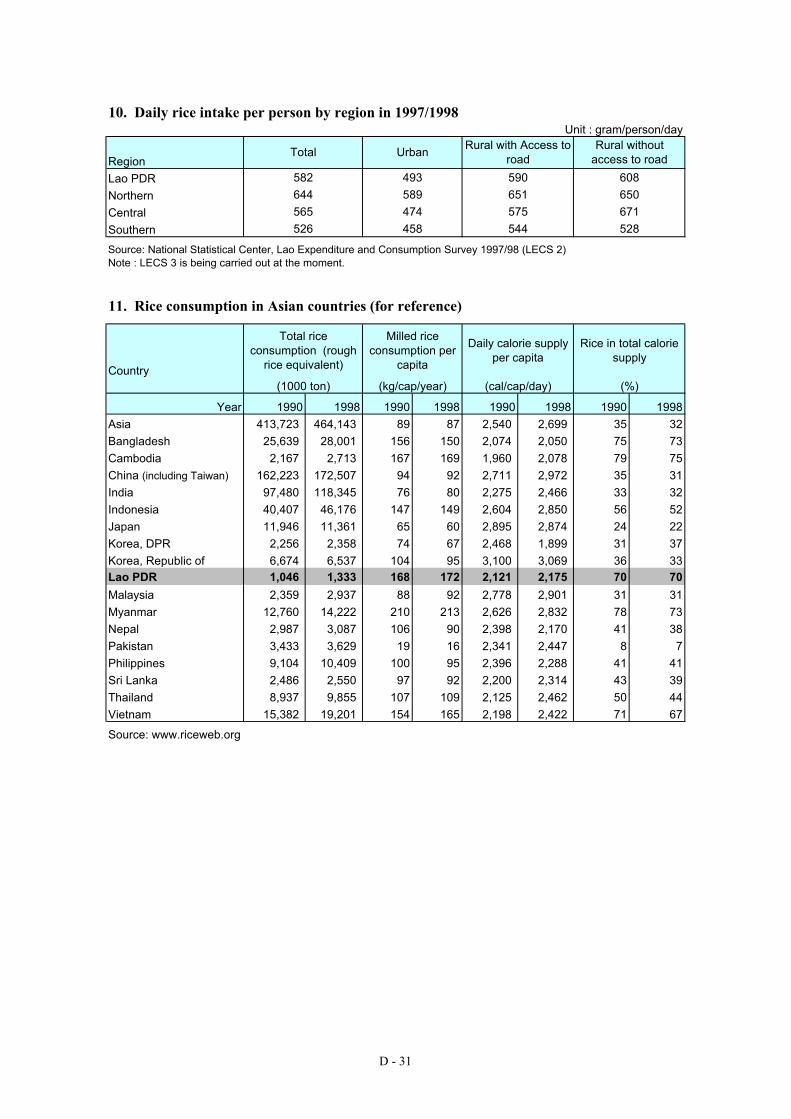
10. Daily rice intake per person by region in 1997/1998Unit : gram/person/day
RegionLao PDRNorthernCentralSouthern
Source: National Statistical Center, Lao Expenditure and Consumption Survey 1997/98 (LECS 2)Note : LECS 3 is being carried out at the moment.
11. Rice consumption in Asian countries (for reference)
Country
Year 1990 1998 1990 1998 1990 1998 1990 1998Asia 413,723 464,143 89 87 2,540 2,699 35 32Bangladesh 25,639 28,001 156 150 2,074 2,050 75 73Cambodia 2,167 2,713 167 169 1,960 2,078 79 75China (including Taiwan) 162,223 172,507 94 92 2,711 2,972 35 31India 97,480 118,345 76 80 2,275 2,466 33 32Indonesia 40,407 46,176 147 149 2,604 2,850 56 52Japan 11,946 11,361 65 60 2,895 2,874 24 22Korea, DPR 2,256 2,358 74 67 2,468 1,899 31 37Korea, Republic of 6,674 6,537 104 95 3,100 3,069 36 33Lao PDR 1,046 1,333 168 172 2,121 2,175 70 70
Malaysia 2,359 2,937 88 92 2,778 2,901 31 31Myanmar 12,760 14,222 210 213 2,626 2,832 78 73Nepal 2,987 3,087 106 90 2,398 2,170 41 38Pakistan 3,433 3,629 19 16 2,341 2,447 8 7Philippines 9,104 10,409 100 95 2,396 2,288 41 41Sri Lanka 2,486 2,550 97 92 2,200 2,314 43 39Thailand 8,937 9,855 107 109 2,125 2,462 50 44Vietnam 15,382 19,201 154 165 2,198 2,422 71 67
Source: www.riceweb.org
526 528
(%)
Daily calorie supplyper capita
Rice in total caloriesupply
Total riceconsumption (rough
rice equivalent)
Milled riceconsumption per
capita
(1000 ton) (kg/cap/year) (cal/cap/day)
608650
458 544671575
Urban
493589474
Rural with Access toroad
590651
Rural withoutaccess to road
Total
582644565
D - 31

12. Overview of situation of rice balance by region
Production by region Unit: Tons
Region 1997 1998 1999 2000Northern 417,980 423,333 451,860 451,839 Central 863,720 916,169 1,139,321 1,193,061 Southern 378,300 334,998 511,634 556,800
Total 1,660,000 1,674,500 2,102,815 2,201,700
Population Unit: Person
Region 1997 1998 1999 2000Northern 1,580,900 1,620,590 1,661,100 1,703,000 Central 2,301,800 2,359,410 2,418,400 2,480,000 Southern 962,900 986,920 1,011,600 1,037,000 Total 4,847,597 4,968,918 5,093,099 5,222,000
Consumption (if per capita =300 kg/parson/year) Unit: Tons
Region 1997 1998 1999 2000Northern 474,270 486,177 498,330 510,900 Central 690,540 707,823 725,520 744,000 Southern 288,870 296,076 303,480 311,100 Total 1,455,677 1,492,074 1,529,329 1,568,000
Surplus/ Deficit (Estimate) Unit: Tons
Region 1997 1998 1999 2000Northern (56,290) (62,844) (46,470) (59,061) Central 173,180 208,346 413,801 449,061 Southern 89,430 38,922 208,154 245,700 Total 204,323 182,426 573,486 633,700 Note* a) Source: Ministry of Agricultural and Forestry, and National Statistical Center, Lao PDRb) Consumption per capita (300kg/person) is estimated value given by Ministry of Agricultural and Forestry, Lao PDR
Year
Year
Year
Year
Surplus and Defecit of rice
(100,000)
-
100,000
200,000
300,000
400,000
500,000
600,000
700,000
1997 1998 1999 2000
Ton
s
Northern
Central
Southern
Total
D - 32

13. Market price of rice in Vientiane Minicipality, 1980-1999
Item Unit 1980 1985 1990 1995 1996 1997 1998 1999Glutinous Rice Kip/kg 6 42 203 400 382 540 1,026 1,613 Ordinary Rice Kip/kg 12 64 225 500 469 661 1,670 2,641
Source: National Statistical Center, Lao PDR
14. Comparison of market prices of rice/paddy (Week of 6-13 March 2002)
Place
Type of rice/paddy Unit 2002/3/6 2002/3/13 2002/3/6 2002/1/13 2002/3/6 2002/1/13 2002/3/6 2002/1/13 2002/3/6 2002/1/13Paddy Rice: Glutinous Kip/kg 950 950 900 900 800 800 1,000 1,000 1,150 1,150
% 100% 100% 95% 95% 84% 84% 105% 105% 121% 121%Paddy Rice: Non-Glutinous Kip/kg 1,100 1,100 950 950 850 850 1,000 1,000 1,300 1,300
% 100% 100% 86% 86% 77% 77% 91% 91% 118% 118%Milled Rice: Glutinious 1 Kip/kg 2,300 2,300 2,175 2,250 1,800 1,800 2,200 2,200 1,900 1,900
% 100% 100% 95% 98% 78% 78% 96% 96% 83% 83%Milled Rice: Glutinious 2 Kip/kg 1,950 1,950 1,750 1,750 1,700 1,700 1,800 1,800 1,700 1,700
% 100% 100% 90% 90% 87% 87% 92% 92% 87% 87%Milled Rice: Non-Glutinous 1 Kip/kg 2,500 2,500 2,200 2,250 2,000 2,000 2,200 2,200 2,500 2,500
% 100% 100% 88% 90% 80% 80% 88% 88% 100% 100%Milled Rice: Non-Glutinous 2 Kip/kg 2,300 2,300 1,875 1,925 1,800 1,800 1,800 1,800 2,200 2,200
% 100% 100% 82% 84% 78% 78% 78% 78% 96% 96%Milled Rice: Thai Jusmine Kip/kg 3,000 3,000 4,250 4,250 1,800 1,800 4,200 4,200
% 100% 100% 142% 142% 60% 60% 140% 140%
Source: Division of Market Price Protection, Department of Internal Trade, Ministry of Commerce and Tourism, Lao PDRVientinane Municipality = 100%
Year
KhammuaneVientiane Municipality Savannakhet Champasack Luangprabang
Trend in Market Rice Price in Vientiane Municipality 1980-1999
0
500
1000
1500
2000
2500
3000
1980 1985 1990 1995 1996 1997 1998 1999
Kip
/ Kg
GlutinousRice
OrdinaryRice
Laos
D-33

15. Lao PDR : Rice import, 1976 - 1999
Year 1976 1980 1985 1990 1995 1996 1997 1998 1999 *
Import volume (MT) 45,000 1,000 7,000 20,000 15,939 26,731 19,927 5,914 4,707
Source: Department of Customs and Electrical Enterprise of Lao PDR*Note : Data for 1999 is estimated data.
16. List of Prohibited Crops import to Lao PDR
No. Commodity/Plants Common Name Scientific name/Casual Organism1 Rice White tip nematode Aphelenchoides oryzae2 Rice Rice Stem nematode Ditylenchus angustus3 Rice White leaf (hoja blanca) Virus4 Rice Black streaked dwarf Virus5 Rice Stripe Virus
Source: Department of Agriculture, Ministry of Agriculture and Forestry, 1998
17. Distribution of Rice Aid to Lao PDR Y1992-2001
Rice Distributed (MT)11,000
2,986 9,680 4,284 9,890
27,807 3,410
- 4,492
73,549
Source: World Food Programme (WFP)(Information received from Ministry of Agriculture and Forestry, Lao PDR)
19992000/01
Total
1995199619971998
Year199219931994
Imported rice in to Lao PDR 1976-1999
-5,000
10,00015,00020,00025,00030,00035,00040,00045,00050,000
1976 1980 1985 1990 1995 1996 1997 1998 1999 *
MT
D - 34

18. Lao PDR : Agricultural Census 1998/99
# Items Units Amount1 No. of Agricultural Holdings 000 hh 668.0 2 Agricultural Population 000 4,058.2
Male 2,001.0 Female 2,057.2
3 Land Tennure 000 ha 1,047.8 Owned Land 1,013.3 Rented Land 26.9 Other Land 7.6
4 Cultivation Intensity % 91.0 5 Area of Holding by Land Use 000 ha 1,047.8
Agricultural Land 958.6 Arable Land 877.3 Temporary Crops 765.0 Fallow Land 112.3 Permanent Crops 81.3 Grazing Land 17.6 Forest Land 54.1 Other Land 17.5
6 No. of agricultural holding using agriculturalmachinery
000 hh 275.2
Genarator 4.4 Tractor 137.7 Water pump 25.5 Thresher, Miller, Grain Dryer 100.3 Other 7.3
7 No. of agricultural holdings usingpesticides/fertilizers
000 hh 347.0
Use of fertilizers 278.6 Organic fertilizer only 96.0 Mineral fertilizer only 64.1 Both 118.5 Use of pesticides 68.4
8 Rice CultivationWet season lowland, 1998 000 ha 481Wet season upland, 1998 000 ha 199Dry season, 1998/99 000 ha 56
9 Glutinous rice % of rice area 93
Souce: Agricultural Census 1998/99, Ministry of Agriculture and Forestry
D - 35

COUNTRY REPORT
Malaysia

Country Report : Malaysia
E - 1
1. Introduction
Paddy cultivation is an important and strategic activity in Malaysia as rice is a staple food commodityin the country. In this respect, over the years, the Malaysian government undertook substantialinvestment to develop the industry. Among the major development programs implemented by thegovernment include the provision of infrastructure facilities, provision of technical and advisorysupport services and undertaking a price support and fertilizer support scheme. These measures areaimed at sustaining profitability and producer incomes and thereby ensuring that local production issufficient to meet the country’s minimum self-sufficiency level for rice.
Table 1: Rice Balance (Unit: 1,000 tons)Year Supply Demand
BeginningStock
Production(milled rice)
Import Total DomesticUse
Export EndingStocks
Total
95/96 300 1,270 440 2,010 1,800 - 210 2,01096/97 210 1,380 480 2,070 1,830 - 240 2,07097/98 240 1,370 660 2,270 2,010 - 260 2,27098/99 260 1,280 610 2,150 1,780 - 370 2,15099/00 370 1,470 550 2,390 2,120 - 270 2,390
Source: Ministry of Agriculture
2. Rice Production
2.1 Land Use
The total physical area in Malaysia for the year 2000 is estimated at 540,000 hectares of which 6 %of the paddy areas are in Peninsular, 7 % of the paddy areas area in Sabah, and 24 % of the paddyareas are in Sarawak. The area under paddy cultivation in 1999 totaled 692,000 hectares. Wetpaddy constituted 88 % of the total cultivated paddy areas in the country with the remaining 12 %being made up of dry land paddy. In Peninsular Malaysia, 85 % of the paddy areas are providedwith extensive irrigation and drainage facilities while only 19 % of the paddy areas in East Malaysiais under irrigation.
Table 2: Harvested AreaYear Harvested area (ha) Year Harvested area (ha)1985 654,974 1994 698,6241986 650,875 1995 672,7871987 658,954 1996 685,4681988 671,755 1997 690,9751989 664,137 1998 674,4041990 680,647 1999 692,3891991 683,640 2000 665,0001992 672,753 2001 672,0001993 693,434 2002 673,000
Source: Department of Agriculture Malaysia

Country Report : Malaysia
E - 2
The harvested area in the country had a net decrease over the past 5 years. More rice land is simplyabandoned and left idle, rather than used for other short-term food crops. The government has beenencouraging cultivation of rice in large-scale farms to reduce costs and increase farmer incomes.
Table 3: Harvested Area (hectares) by State, 1995 – 1999State 1995 1996 1997 1998 1999 % Average
Johor 1,303 1,918 1,395 1,134 2,323 0.24%Kedah 213,356 216,644 211,944 202,126 208,410 30.81%Kelantan 71,437 79,349 80,689 77,743 79,179 11.37%Melaka 3,195 2,105 1,096 726 1,261 0.25%N.Sembilan 1,120 668 640 698 1,409 0.13%Pahang 2,391 4,865 3,654 5,350 5,772 0.64%Perak 73,536 70,583 82,123 82,442 81,022 11.41%Perlis 45,378 45,584 46,907 47,441 48,111 6.83%P.Pinang 28,236 26,759 28,379 28,560 28,125 4.10%Selangor 36,254 36,948 36,898 38,074 38,159 5.46%Terengganu 20,336 18,510 20,922 19,903 19,609 2.91%Sem. Malaysia 496,542 503,933 514,647 504,197 513,380 74.14%Sabah 53,095 52,604 49,828 42,623 47,401 7.19%Sarawak 123,150 128,931 126,500 127,614 131,608 18.67%MALAYSIA 672,787 685,468 690,975 674,434 692,389 100%
Source: Department of Agriculture Malaysia
2.2 Designating Paddy Producing Areas
Paddy is mainly grown in eight granary areas, which accounts for more than 70 % of the domesticproduction. These eight granary areas have been designated as permanent paddy producing areas torealize a minimum self-sufficient of 65 %. Suitable areas especially in Sabah and Sarawak havebeen identified for large-scale commercial paddy production. The yield in these eight areasrecorded in increase from 3.3 tonnes per hectare in 1985 to 3.7 tonnes per hectare in 1999.
Table 4: Agricultural PopulationYear Population1980 13,763,0001985 15,677,0001990 17,891,0001995 20,140,000
Source: Food and Agriculture Organization
Table 5: Use of Farm MachineryYear Agricultural tractors (No.)1980 7,4301985 12,0001990 26,0001995 43,295
Source: Food and Agriculture Organization

Country Report : Malaysia
E - 3
2.3 Farming Scale & Number of Farm household
Paddy is produced mainly by small holders with an average farm size of about 1.06 hectares. Thereare approximately 296,000 paddy farmers of which 116,000 or 39 % are full-time paddy farmers.65 % of the paddy farmers have farms of less than one hectare while only 4 % have more than 3hectares.
These small farm units pose constraints in efforts to increase productivity and producer income. Itrestricts efficient mobilization and utilization of resources leading to inefficiencies in production.Post-harvest losses for rice during harvesting, handling, transportation, drying, milling and storageare estimated to vary between 10 % to 37 % at the different stages.
2.4 Cropping Patterns
About two-thirds of the 400,000 ha of rice in Peninsular Malaysia are irrigated and double-cropped.Not much of the 50,000 ha in Sabah are fully irrigated; most of the 150,000 ha in Sarawak arerainfed and upland. Indica varieties are most common. Cropping season for planting andharvesting in Penisular Malaysia and East Malaysia are varied as the following table.
Table 6: Cropping Season for Planting and HarvestingCropping season / Reagion Planting Harvesting
Main season / Peninsular September-October November-March
Main season / Sabah June-August January-March
Main season / Sarawak October-November March-April
Source: Food and Agriculture Organization
2.5 Use of Fertilizer
In 1950's and 1960's organic fertilizer was the main fertilizer type used in rice cultivation. Since1970's inorganic fertilizer usage increased from 19 kg/ha to 140 kg/ha presently. This has increasedthe average rice yield from 1.8 tonnes/ha in 1950 to 3.7 tonnes/ha.
2.6 Rice Environment
The four main rice environments in Malaysia are classified as irrigated, partially irrigated, rainfedlowland, and upland. The irrigated lowland predominates in Peninsular Malaysia; rainfed rice ismore common in Sabah and Sarawak where upland rice prevails.
Crop establishment in the irrigated areas is by manual or mechanical transplanting; direct seeding,usually broadcast and only seldom row-sown or drilled; and a double nursery technique. Machineharvesting is common in some irrigated areas such as the Muda irrigation system in Kedah. In the

Country Report : Malaysia
E - 4
partially irrigated (upgraded rainfed lowland) area, rice is mostly direct seeded instead oftransplanted. Rice is mainly transplanted in the rainfed lowlands, and drill seeded in the uplands.
2.7 Rice Production in Malaysia
Table 7: Rice Production (milled rice) in MalaysiaYear Production (MT) Year Production (MT)1985 1,122,324 1992 1,297,9141986 1,104,501 1993 1,357,4321987 1,046,467 1994 1,378,9451988 1,091,478 1995 1,372,5841989 1,122,617 1996 1,438,7941990 1,215,065 1997 1,367,9511991 1,241,796 1998 1,256,854
Source: Department of Agriculture Malaysia
Figure 1: Rice Production
Malaysia produced 1.34 million tonnes of rice in 2000. This increased production in the midst ofdeclining paddy hectare was due mainly through increasing yields as a result of the government’sprograms such as increasing farm mechanization, provision of high quality seeds and paddy variety,improvements in water management, intensifying Integrated Pest Management practices andintegrating small paddy land for commercial production.
2.8 Production Constraints
One of the main production constraints is fluctuating yield, with strong indication of a gradualdecline over time. The shrinking of the areas for rice production overrides any advantage that mightbe expected from higher yields.
R i c e P r o d u c t i o n ( M T )
0
2 0 0 , 0 0 0
4 0 0 , 0 0 0
6 0 0 , 0 0 0
8 0 0 , 0 0 0
1 , 0 0 0 , 0 0 0
1 , 2 0 0 , 0 0 0
1 , 4 0 0 , 0 0 0
1 , 6 0 0 , 0 0 0
1 9 8 5 1 9 8 7 1 9 8 9 1 9 9 1 1 9 9 3 1 9 9 5 1 9 9 7
Y e a r
Met
ric
Ton
nes

Country Report : Malaysia
E - 5
An extreme labor shortage has prompted steps to expedite farm mechanization. Still, the shortageof affordable farm labor has caused a consistent decline in rice area. Periodic drought, irregularrainfall, and seasonal monsoon floods are a threat to the rice crop. Malaysia also experiencesshortages of irrigation water.
Topography also plays a role in overall rice production. The intrusion of coastal seawater into areasbelow sea level is a continuing problem. Ineffective terracing of upland slopes and inefficient,gravity-fed irrigation systems lead to water deficits.
Soil-related constraints include suspected nutrient imbalance and deficiency and low cationexchange capacity. The use of organic materials is limited in favor of the blanket application ofchemical fertilizers. Other major constraints faced by the industry include the relatively high cost ofproduction and small farm size which constraint efforts to increase productivity throughmechanization.
2.9 Production Cost
While the Government of Malaysia (GOM) targets 70 % self-sufficiency, the local cost ofproduction is much higher than neighboring countries. The cost of production of local paddy ishigher than Thailand, Vietnam and Indonesia as the following table .
Table 8: Production Costs by CountriesCountry Cost of Production (US$/MT)Malaysia 171Thailand 144Vietnam 118Indonesia 92
Source: Oryza Market Report
2.10 Production Control
The Malaysian rice industry was regulated and promoted by the National Paddy and Rice Board(LPN). In 1994 the LPN was corporatized. The Government took over the regulatory functions onLPN. This move was aimed at reducing the government’s direct involvement in commercialactivities and further liberalizing the industry.
In recent year, Malaysia has applied a policy consistent with a rice self-sufficiency target of 65 %.In 2000, the target was raised to 70 % and direct assistance to farmers was intensified. In particular,an ambitious program focusing on productivity increases and quality improvements was announcedat the end of 2000. The country has kept the level of price support to rice farmers unchanged since1998, resulting in a 6 % decline in real terms by 2000.

Country Report : Malaysia
E - 6
2.11 Production Policy
Strategic Direction : The objectives of the rice industry are to ensure minimum self-sufficiencylevel of 65 %, to increase production of higher quality, specialty and fragrant rice, and to maintainstrategic quantity of rice stockpile .
In order to cut cost of imports, the Government (GOM) is reviewing its rice policy to increase selfsufficiency from 65 % to 72 %. However, the target is not within sight unless the GOM is able toaddress the various issues such as yield improvements, the restructuring of farm production systemsincluding greater mechanization, improved farm management practices, and the reduction of post-harvest losses. It will take some time before any significant increase in hectares take place.
3. Rice Marketing
The three main categories of rice currently marketed in the country consist of white rice, specialty riceand fragrant rice. With increasing income and higher standards of living there is a changingpreference towards higher quality rice. At present, it is estimated that the domestic market consists ofabout 6 % specialty and fragrant rice 80 % of Malaysian Super Grade and the balance of Standard andPremium grade rice.
Figure 2: Trade flows (Domestic Market)
The marketing and distribution of rice in the country is undertaken by BERNAS 1, a state tradingcompany and other private concerns which operate at the milling, wholesale and retail levels.Presently there are 236 millers in the country of which 32 are owned by BERNAS. However, rice isallowed to be imported only by BERNAS. BERNAS together with other private companies undertakethe domestic marketing and distribution of rice.
BERNAS’ involvement in local rice production is through its paddy procurement, processing, tradingactivities as well as providing support services to complement the paddy and rice industry. During
1 Padiberas Nasional Berhad (BERNAS) web site (reference no. 25)
PaddyFarmers
PrivateDomesticMillers
BERNAS Wholesalers
Retail Outlets
Padiberas Nasional BerhadGOM subsidized / price controlled
Rice Wholesales LicenseOwned outlets / warehouses

Country Report : Malaysia
E - 7
2000, BERNAS procured 635,000 metric tonnes of paddy, an increment of 25% from 509,000 metrictonnes in 1999, which commands 37% of local paddy market share.
Distribution has been given priority and responsibility to maintain and expand market presence.BERNAS currently manages 29 warehouses serving as distribution centers throughout the country tofacilitate the distribution of the Group’s imported rice.
From that time on, in keeping with the original philosophy, BERNAS has continued to developthrough wholesaling and retailing development and acquisitions, allowing materialization of overseasbusiness ventures in China, Pakistan, Thailand and Africa. Over 6 years, a number of companiesamalgamated with BERNAS. An extensive distribution network was established and the companygrew through the financial crisis of 1998.
Moreover, the management of the rice stockpile in Malaysia is undertaken by BERNAS, which wasprivatized as a company in 1996. Through this privatization agreement, BERNAS has to take over thecommercial and non-commercial activities of the government. For the non-commercial activities,BERNAS on behalf of the government has to manage the national rice stockpile, the disbursement ofthe price support payment and the procurement of paddy from farmers as the buyer of last resort. Inreturn BERNAS has been given the exclusive right to import rice into the country. The amount to beimported is based on the shortfall between total rice requirement in the country and the domesticproduction.
4. Rice Policy
Since rice is an important staple in the Malaysian diet, the government has taken measures to ensurethat the country maintains at least a 65 % level of self-sufficiency in rice. The government supportsrice farmers by several means, including input subsidies and output incentives. Furthermore, it hasassisted paddy farmers in the application of pest control methods, farm management and theconsolidation of small farms. Each rice producer is eligible for a fertilizer grant and for loans from theBank Pertanian Malaysia at a virtually interest-free rate. When the crop is produced, the governmentguarantees producers a price of $M 496 (1995 value) per ton of paddy. In addition, each producer iseligible to receive a government “income” supplement.
5. Rice Trade (Overseas)
Table 9: Rice TradeYear Imports (MT) Exports (MT)
Jan – Dec 1997 648,000 -Jan – Dec 1998 658,000 -Jan – Dec 1999 611,000 -Jan – Dec 2000 593,000 6,000 (to Brunei)
Source: GAIN Report, U.S. Department of Agriculture

Country Report : Malaysia
E - 8
5.1 Rice Imports 2
Malaysia imports rice in various forms, that is semi milled or wholly milled either polished orglazed and broken rice. Malaysia imports mainly from Thailand, China, Vietnam, Pakistan, USA,Myanmar, Australia and India.
Malaysia’s imports slipped 2.6 % in 1998 as millersworked down their stocks. From available statisticaldata, Thailand dominated 55 % of the rice importmarket, followed by Vietnam (25%), China (14%) andIndia (4%). The U.S. managed to export only 1,000tonnes. As for 1999, Malaysia is likely to increaserice imports to meet growing domestic demand as wellas building up stocks for the current year.
With an increase in domestic rice output, Malaysia’srice imports slipped 2.7 % in 1999. From availablestatistical data, Thailand dominated 46 % of the riceimport market, followed by China (26%), Vietnam(20%) and Pakistan (8%). India dropped out off themarket. The U.S. managed to export only 1,000tonnes. As for 2000, Malaysia is likely to decreaserice imports in view of further improvement indomestic rice production as well as working downstocks.
In 1999 importation of rice amounted to 612,466tonnes valued at RM719.2 million. It was forecastedthat the importation of rice would decrease from612,466 metric tonnes to 550,000 metric tonnes, dueto the good production forecasted in year 2000.
With an increase in domestic rice output, Malaysia’srice imports slipped 2 % in 2000. From availablestatistical data, Thailand dominated 47 % of the riceimport market, followed by China (20%), Vietnam(23%) and Pakistan (7%). No sales from U.S. wererecorded.
2 Malaysia Grain and Feed – Annual 1999-2002, GAIN Report, U.S, Department of Agriculture (reference no.6 - 9)
Figure 5:2000 Imports Statistic
U.S.
0.17%Pakistan
7.08%China
20.07%
Vietnam
22.60%
Thailand
47.22%
India
1.69%
Australia
0.67% Burma
0.51%
1999 Imports Statistic
U.S.0.16%
Pakistan7.86%
Vietnam20.13%
China25.53%
Thailand46.32%
Figure 4:
1998 Imports Statist
Thaiand54.86%Vietnam
25.23%
China13.83%
India3.80%
Pakistan2.13%
U.S.0.15%
Figure 3:

Country Report : Malaysia
E - 9
As for 2001, Malaysia is likely to decrease rice imports in view of further improvement in domesticrice production as well as working down stocks. With an increase in domestic rice output,Malaysia’s rice imports declined 19 % in 2001. Thailand and Vietnam were the top suppliersfollowed by Pakistan, Australia and China. Rice sales from U.S. amounted to only 1,000 MT. Sincethe rice output growth is expected to be insignificant in 2002, rice imports should rebound to 580TMT in order to meet domestic consumption as well as to rebuild stocks.
5.2 Bilateral/Multilateral International Agreement on Rice Trade 3
In 1999, the government of Malaysia (GOM) signed two Memoranda of Understanding (MOU) forbarter trade with China and Burma. Under the MOU with China, Malaysia will be allowed to tradepalm oil up to the equivalent value of 150,000 tonnes of rice from China. The deal with Burmaenables both parties to trade export commodities up to a value of US$10 million per annum.
5.3 Government Control System of Import
Rice import policy: The sole authorized importer is a government corporation (BERNAS) with theresponsibility of ensuring purchase of the domestic crop and wide power to regulate imports.
Figure 6: Import Procedures
Upon privatisation, BERNAS was also granted the sole right to import rice into Malaysia. To ensuresecurity and sustainability of supply in terms of quality and pricing, BERNAS practices multi-sourcing of rice from different countries. In 2000, BERNAS imported a total of 605,000 metrictonnes of rice, the majority from Thailand, Vietnam, China and Pakistan as well as some newsupply option, such as India, Australia, Myanmar, Cambodia, USA and Argentina.
6. Rice Reservation
6.1 Rice Reservation by the Government
To strengthen food security in the country especially in times of unexpected emergencies, thegovernment has established a national rice stockpile. The management of this rice stockpile hasbeen entrusted to BERNAS under an agreement with the government. BERNAS is required tomaintain a rice stockpile totaling 92,000 tonnes at all times. This stockpile is maintained in 3 forms,
3 Malaysia Grain and Feed – Annual 2000, GAIN Report (reference no. 7)
Imports
ThailandVietnamChinaetc.
BERNAS Hold StockOwned warehouse
Malaysia

Country Report : Malaysia
E - 10
namely rice estimated from paddy and rice either from local or imported sources. However theactual amount held by BERNAS normally exceeds this level and will vary depending upon thedomestic and global demand and supply of rice. The stockpile held is normally sufficient to cater tothe country’s requirement for a period of between 1-3 months.
6.2 Quantitative of Reserve
In normal years, Malaysia needs to keep only two to two and a half months of stocks. Being anelection year, there was a build-up in stocks during 1999. However, smuggling of rice fromThailand resulted in the build-up in stocks at the end of 2000. Government of Malaysia (GOM)imposed a temporary ban on rice imports in December 2000 as part of measures to clear some of therice stockpile. Post expects a work-down on stocks in 2000.
Table 10: Quantitative of ReserveYear Beginning Stocks (MT) Ending Stocks (MT)
1995/1996 300,000 210,0001996/1997 210,000 240,0001997/1998 240,000 260,0001998/1999 260,000 370,0001999/2000 370,000 270,000
Source: Department of Agriculture Malaysia
6.3 Control of Paddy and Rice Act 4, 1974 (Ministry of Agriculture )
An Act to control (store and manage) the supply of paddy and rice domestically and ensure a stableprice for both farmers and consumers. To ensure adequate supply of rice in any situation, especiallyduring national emergencies.
7. Rice Demand / Consumption
7.1 Per Capita Consumption
The per capital consumption of rice declined from 102.2 kg in 1985 to 78.2 kg in 1999. Howeverthe national consumption of rice is projected to increase from 1.8 million tonnes in 1995 to 2.12million tonnes in 2000 due to population increase. The domestic demand for rice is met throughdomestic production and importation.
Rice remains the staple food although per capita consumption has dropped from 110 to 78.2 kg overthe past 20 years. Despite a population growth that exceeds 2.3% annually, the national requirementfor rice has increased less drastically because of declining per capita consumption.
4 Issues Related to Competition Laws from APEC (reference no. 17)

Country Report : Malaysia
E - 11
7.2 Current Consumption
Domestic consumption increased by about 3.2 % in 1998 to reflect the shift from wheat-based torice-based products amidst the economic downturn. Domestic consumption increased by about3.1 % in 1999. The increase in consumption is above the average population growth rate, reflectingan increase in inflows of migrant workers from neighboring countries.
Table 11: Domestic ConsumptionYear Domestic Consumption (MT)
1995/1996 1,800,0001996/1997 1,830,0001997/1998 2,010,0001998/1999 1,780,0001999/2000 2,120,000
Source: Department of Agriculture Malaysia
Domestic consumption increased by about 1.5 % in 2000. The small increase in consumption ispartly due to unofficial rice imports from neighboring Thailand. Domestic consumption is expectedto increase by 2.6 % in 2001. The small increase in consumption is partly due to unofficial riceimports from neighboring Thailand.
8. Rice Price
Rice retail prices remain unchanged since 1993, wheat flour prices have seen two hikes since 1996.The government added the local super grade rice to the controlled rice retail price structure in 1998.The ceiling price structure is as follows (in RM per kg):
Table 12: Ceiling Price Structure of Rice
Zone Standard Grade Premium Super
A) Kedah, Kelantan, Perlis, Seberang,Krian K. Selangor & S. Bernam 0.98 0.01 1.65
B) Trengganu, Penang & Perak 0.99 1.06 1.70C) Federal Territory & Selangor 1.01 1.07 1.75D) N. Sembilan & Malacca 1.03 1.09 1.75E) Johor, Gua Musang & Pahang 1.04 1.11 1.80
Source: GAIN Report, U.S. Department of Agriculture
The government has taken measures to stabilize the domestic price of rice through the imposition of afixed ceiling price of the standard, premium and super grades. The retail ceiling price of standard isfixed at between RM 0.98 and RM 1.04 a kilogram, premium is between RM 1.04 and RM 1.11 andsuper at 15% broken is between RM 1.65 and RM 1.80. The support prices for padi rice has beenincreased from RM49.61 to RM55.00 per 100 kg for long grain and from RM46.30 to RM51.69 per
Country Report : Malaysia
E - 12
100 kg for medium grain since December 1997. In addition, all rice farmers receive a subsidy ofRM25 per 100 kg of padi delivered to a licensed mill or drying facility.
For higher quality rice, specialty and fragrant rice, the government has allowed the price to be freelyfloated in the domestic market and the domestic price is determined by market demand and supplyconditions. The enforcement of the controlled price and other requirements such as grading andlabeling is undertaken jointly by the Ministry of Agriculture and the Ministry of Domestic Trade andConsumer Protection.
9. Food Security
To ensure an adequate level of food security relating to the availability of rice at affordable prices, thegovernment is undertaking measures to develop the eight granary areas, which has been designated aspermanent paddy producing areas to realize a minimum self-sufficiency level of rice of 65%. Inaddition new areas especially in Sabah and Sarawak are being identified and utilized for large-scalecommercial paddy production by the private sector. The government will continue to undertakeprograms to increase productivity and paddy yields through increased mechanization, research anddevelopment, land consolidation and introduction of better and higher yielding varieties.
The national rice stockpile will continue to be maintained by BERNAS on behalf of the government.As it is not the policy of the government to be 100% self sufficient in rice, the government throughBERNAS will continue to source rice in the international market from sources which provides the bestoffers in terms of price and quality. Sources of supply of rice will be imported from various countriesand Malaysia currently imports from Thailand, Vietnam, Australia, China, India, and Pakistan. Thepresent practice of multi-sourcing or diversifying the number of countries, which are import sourceswill be continued. Reverse investment are also encouraged and this is private sector led in conformitywith the government’s stated objective of enhancing private sector role in food production.

Country Report : Malaysia
E - 13
References
1. Data/Information on the Agreement of the ASEAN Food Security Reserve(http://agrolink.moa.my/afsrb/history.htm)
2. Rice Situation and OutlookYearbook. Market and Trade Economics Division, EconomicResearch Service, U.S. Department of Agriculture, November 1999, RCS-1999
3. Rice Situation and OutlookYearbook. Market and Trade Economics Division, EconomicResearch Service, U.S. Department of Agriculture, November 2000, RCS-2000
4. Rice Situation and OutlookYearbook. Market and Trade Economics Division, EconomicResearch Service, U.S. Department of Agriculture, November 2001, RCS-2001
5. Rice Outlook, Electronic Outlook Report from the Economic Research Service, U.S,Department of Agriculture, January 2002, RCS-0102
6. Malaysia Grain and Feed – Annual 1999, GAIN Report # MY90147. Malaysia Grain and Feed – Annual 2000, GAIN Report # MY00148. Malaysia Grain and Feed – Annual 2001, GAIN Report # MY10109. Malaysia Grain and Feed – Annual 2002, GAIN Report # MY201110. Malaysia at a glance 2001 – The World Bank Group11. Review of Basic Food Policies, Commodities and Trade Division, Food and Agriculture
Organization of the United Nations, 200112. State Trading Enterprises: Research Issues – Organization for Economic Co-operation and
Development (OECD) Workshop on Emerging Trade Issues in Agriculture, October 199813. Central Intelligence Agency (CIA) – The World Factbook – Malaysia14. Foodcrops and Shortages - Food and Agriculture Organization (FAO)/Global Information and
Early Warning System on Food and Agriculture (GIEWS), February 200215. Food Security in Malaysia by Fatimah Mohd Arshad, Mad Nasir Shamsudin, and Rosli Salleh16. Hectareage on Paddy 1985 – 1999 from Department of Agriculture Malaysia
(http://agrolink.moa.my/doa/english/mapstat/padi0.html)17. Issues Related to Competition Laws from APEC– Malaysia18. Malaysia: 1998 Country Report On Economic Policy and Trade Practices, The Department of
State, United States of America, 199919. 2000 Country Reports on Economic Policy and Trade Practices – Released by the Bureau of
Economic and Business Affairs U.S. Department of State, March 200120. The State of Food and Agriculture 1998 – Malaysia21. The Malaysian Agricultural Research and Development Institute (MARDI) – Malaysia22. Sustainable Agriculture System in Malaysia by Faridah Ahmad23. National Reports: Malaysia 1997-200224. Status of the Rice Industry in Malaysia – The First Technical Meeting on Rice Reserve
(TMRR) under the development study on East Asia / ASEAN Rice Reserve System25. Padiberas Nasional Berhad (BERNAS) web site (http://www.bernas.com.my/bernas/)26. Oryza Market Report – Malaysia – February 2001 (http://www.oryza.com)

Malaysia at a glance 9/5/01
East Upper-POVERTY and SOCIAL Asia & middle-
Malaysia Pacific income2000Population, mid-year (millions) 23.3 1,853 647GNI per capita (Atlas method, US$) 3,370 1,060 4,620GNI (Atlas method, US$ billions) 78.5 1,964 2,986
Average annual growth, 1994-00
Population (%) 2.4 1.1 1.3Labor force (%) 3.0 1.4 2.0
Most recent estimate (latest year available, 1994-00)
Poverty (% of population below national poverty line) 8 .. ..Urban population (% of total population) 57 35 76Life expectancy at birth (years) 72 69 69Infant mortality (per 1,000 live births) 8 35 28Child malnutrition (% of children under 5) 20 13 ..Access to an improved water source (% of population) 89 75 87Illiteracy (% of population age 15+) 13 14 10Gross primary enrollment (% of school-age population) 101 119 107
Male 101 121 106Female 101 121 105
KEY ECONOMIC RATIOS and LONG-TERM TRENDS
1980 1990 1999 2000
GDP (US$ billions) 24.9 44.0 79.0 89.7
Gross domestic investment/GDP 27.4 32.2 22.1 25.6Exports of goods and services/GDP 56.7 74.5 121.7 125.4Gross domestic savings/GDP 29.8 34.3 47.3 45.5Gross national savings/GDP .. 30.2 38.2 34.9
Current account balance/GDP -1.1 -2.1 15.9 9.3Interest payments/GDP 1.4 2.3 2.3 2.5Total debt/GDP 26.5 34.8 58.1 49.7Total debt service/exports 6.3 12.6 4.8 4.7Present value of debt/GDP .. .. 59.5 ..Present value of debt/exports .. .. 48.0 ..
1980-90 1990-00 1999 2000 2000-04(average annual growth)GDP 5.3 7.0 6.1 8.3 5.5GDP per capita 2.4 4.4 3.6 5.7 2.6Exports of goods and services 10.6 12.0 13.4 16.0 9.0
STRUCTURE of the ECONOMY1980 1990 1999 2000
(% of GDP)Agriculture 22.6 15.2 10.9 8.6Industry 41.0 42.2 46.4 45.1
Manufacturing 21.6 24.2 31.5 27.7Services 36.3 42.6 42.7 46.3
Private consumption 54.2 51.9 41.6 43.8General government consumption 16.0 13.8 11.1 10.6Imports of goods and services 54.3 72.4 96.6 105.4
1980-90 1990-00 1999 2000(average annual growth)Agriculture 3.4 0.0 0.4 0.6Industry 6.8 8.6 8.5 15.3
Manufacturing 9.3 9.8 13.5 21.0Services 4.9 7.3 5.0 3.1
Private consumption 3.8 3.8 0.8 10.7General government consumption 2.7 9.2 21.0 8.3Gross domestic investment 3.1 5.1 -5.1 27.9Imports of goods and services 6.9 10.3 10.8 24.1
Note: 2000 data are preliminary estimates.
* The diamonds show four key indicators in the country (in bold) compared with its income-group average. If data are missing, the diamond willbe incomplete.
-50
-25
0
25
50
95 96 97 98 99 00
GDI GDP
Growth of investment and GDP (%)
Malaysia
Upper-middle-income group
Development diamond*
Life expectancy
Access to improved water source
GNIpercapita
Grossprimary
enrollment
-30
-15
0
15
30
95 96 97 98 99 00
Exports Imports
Growth of exports and imports (%)
Malaysia
Upper-middle-income group
Economic ratios*
Trade
Domesticsavings
Investment
Indebtedness
Kondo
E-14

Malaysia
PRICES and GOVERNMENT FINANCE1980 1990 1999 2000
Domestic prices(% change)Consumer prices 6.7 2.7 2.8 1.5Implicit GDP deflator 6.9 3.8 0.0 4.7
Government finance(% of GDP, includes current grants)Current revenue 25.7 24.3 19.7 18.3Current budget balance 6.7 2.9 3.4 1.4Overall surplus/deficit -6.8 -3.0 -4.1 -4.2
TRADE1980 1990 1999 2000
(US$ millions)Total exports (fob) .. 28,636 83,933 98,208
Fuel .. 3,932 3,809 2,618Rubber .. 1,119 859 830Manufactures .. 17,317 71,508 83,668
Total imports (cif) .. 26,014 68,295 83,707Food .. 1,694 2,138 3,194Fuel and energy .. 2,366 1,417 3,628Capital goods .. 11,497 21,121 53,780
Export price index (1995=100) .. .. .. ..Import price index (1995=100) .. .. .. ..Terms of trade (1995=100) .. .. .. ..
BALANCE of PAYMENTS1980 1990 1999 2000
(US$ millions)Exports of goods and services 14,098 32,665 96,266 112,359Imports of goods and services 13,489 31,765 76,614 94,657Resource balance 609 900 19,652 17,702
Net income -873 -1,872 -5,336 -7,364Net current transfers -21 54 -1,728 -2,000
Current account balance -285 -918 12,588 8,338
Financing items (net) 753 2,871 -7,876 -7,338Changes in net reserves -468 -1,953 -4,712 -1,000
Memo:Reserves including gold (US$ millions) 4,586 10,006 30,853 29,879Conversion rate (DEC, local/US$) 2.2 2.7 3.8 3.8
EXTERNAL DEBT and RESOURCE FLOWS1980 1990 1999 2000
(US$ millions)Total debt outstanding and disbursed 6,611 15,328 45,939 44,575
IBRD 504 1,102 900 812IDA 0 0 0 0
Total debt service 934 4,333 4,695 5,328IBRD 65 250 177 166IDA 0 0 0 0
Composition of net resource flowsOfficial grants 6 42 11 10Official creditors 133 372 358 287Private creditors 979 -1,856 1,173 1,050Foreign direct investment 934 2,333 1,553 1,900Portfolio equity 0 293 522 515
World Bank programCommitments 105 154 404 0Disbursements 80 205 42 15Principal repayments 26 164 111 100Net flows 54 41 -69 -86Interest payments 39 86 67 66Net transfers 15 -46 -135 -152
The World Bank Group: http://www.worldbank.org/data/ 9/5/01
-20
-10
0
10
20
94 95 96 97 98 99 00
Current account balance to GDP (%)
0
25,000
50,000
75,000
100,000
125,000
94 95 96 97 98 99 00
Exports Imports
Export and import levels (US$ mill.)
-2
0
2
4
6
8
10
95 96 97 98 99 00
GDP deflator CPI
Inflation (%)
G: 7,420A: 812
D: 129
F: 33,711
E: 2,503
Composition of 2000 debt (US$ mill.)
A - IBRDB - IDAC - IMF
D - Other multilateralE - BilateralF - PrivateG - Short-term
Kondo
E-15

Malaysia Social IndicatorsLatest single year Same region/income group
East Upper-
Asia & middle-1970-75 1980-85 1993-99 Pacific income
POPULATION Total population, mid-year (millions) 12.3 15.7 22.7 1,836.6 571.5 Growth rate (% annual average for period) 2.4 2.6 2.4 1.2 1.4Urban population (% of population) 37.7 45.9 56.7 34.5 75.4Total fertility rate (births per woman) 4.6 4.1 3.0 2.1 2.4
POVERTY(% of population)National headcount index .. .. .. .. .. Urban headcount index .. .. .. .. .. Rural headcount index .. .. .. .. ..
INCOMEGNI per capita (US$) 910 1,940 3,390 1,010 4,870Consumer price index (1995=100) 47 74 115 136 131Food price index (1995=100) .. 71 125 .. ..
INCOME/CONSUMPTION DISTRIBUTIONGini index .. .. 49.2 .. ..Lowest quintile (% of income or consumption) 3.5 .. 4.4 .. ..Highest quintile (% of income or consumption) 56.1 .. 54.3 .. ..
SOCIAL INDICATORSPublic expenditure Health (% of GDP) .. .. 1.4 1.7 3.3 Education (% of GNI) 6.0 6.6 5.0 2.9 5.0 Social security and welfare (% of GDP) 0.7 1.0 1.4 .. 7.9Net primary school enrollment rate(% of age group) Total 88 .. 102 100 94 Male 93 .. 102 100 .. Female 83 .. 102 100 ..Access to an improved water source(% of population) Total .. 71 89 75 87 Urban .. .. 100 93 94 Rural .. .. 94 66 68Immunization rate(% under 12 months) Measles .. 20 88 83 90 DPT .. 59 89 82 88Child malnutrition (% under 5 years) .. .. 20 12 ..Life expectancy at birth(years) Total 64 69 72 69 69 Male 63 67 70 67 66 Female 66 71 75 71 73Mortality Infant (per 1,000 live births) 37 21 8 35 27 Under 5 (per 1,000 live births) 63 42 10 44 34 Adult (15-59) Male (per 1,000 population) 282 230 183 184 233 Female (per 1,000 population) 230 149 111 141 143 Maternal (per 100,000 live births) .. .. 39 .. ..Births attended by skilled health staff (%) .. 98 98 .. ..
Note: 0 or 0.0 means zero or less than half the unit shown. Net enrollment ratios exceeding 100 indicate discrepanciesbetween the estimates of school-age population and reported enrollment data. Latest year for access to improved watersource data is 2000.
2001 World Development Indicators CD-ROM, World Bank
Kondo
E-16

COUNTRY REPORT
Myanmar
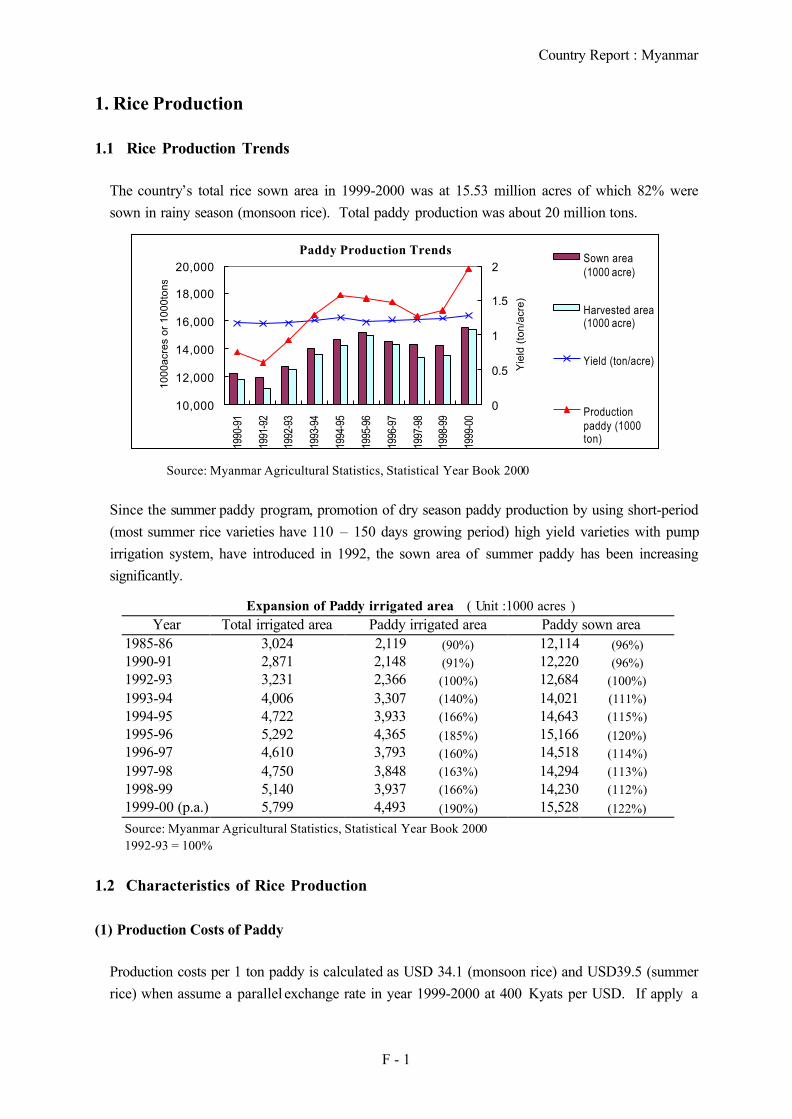
Country Report : Myanmar
F - 1
1. Rice Production
1.1 Rice Production Trends
The country’s total rice sown area in 1999-2000 was at 15.53 million acres of which 82% weresown in rainy season (monsoon rice). Total paddy production was about 20 million tons.
Paddy Production Trends
10,000
12,000
14,000
16,000
18,000
20,000
1990
-91
1991
-92
1992
-93
1993
-94
1994
-95
1995
-96
1996
-97
1997
-98
1998
-99
1999
-00
1000
acre
s or
100
0ton
s
0
0.5
1
1.5
2
Yie
ld (
ton/
acre
)
Sown area(1000 acre)
Harvested area(1000 acre)
Yield (ton/acre)
Productionpaddy (1000ton)
Source: Myanmar Agricultural Statistics, Statistical Year Book 2000
Since the summer paddy program, promotion of dry season paddy production by using short-period(most summer rice varieties have 110 – 150 days growing period) high yield varieties with pumpirrigation system, have introduced in 1992, the sown area of summer paddy has been increasingsignificantly.
Expansion of Paddy irrigated area ( Unit :1000 acres )Year Total irrigated area Paddy irrigated area Paddy sown area
1985-86 3,024 2,119 (90%) 12,114 (96%)1990-91 2,871 2,148 (91%) 12,220 (96%)1992-93 3,231 2,366 (100%) 12,684 (100%)1993-94 4,006 3,307 (140%) 14,021 (111%)1994-95 4,722 3,933 (166%) 14,643 (115%)1995-96 5,292 4,365 (185%) 15,166 (120%)1996-97 4,610 3,793 (160%) 14,518 (114%)1997-98 4,750 3,848 (163%) 14,294 (113%)1998-99 5,140 3,937 (166%) 14,230 (112%)1999-00 (p.a.) 5,799 4,493 (190%) 15,528 (122%)
Source: Myanmar Agricultural Statistics, Statistical Year Book 20001992-93 = 100%
1.2 Characteristics of Rice Production
(1) Production Costs of Paddy
Production costs per 1 ton paddy is calculated as USD 34.1 (monsoon rice) and USD39.5 (summerrice) when assume a parallel exchange rate in year 1999-2000 at 400 Kyats per USD. If apply a

Country Report : Myanmar
F - 2
official exchange rate, production costs is USD 2,100 and USD 2,433, respectively.
Costs of Cultivation per 10 acres in 1999 - 2000Monsoon Rice Summer Rice Type of Works
(Kyats) (Kyats)1 Nursery preparation 2,700 -2 Land preparation 24,250 30,0003 Crop management 26,400 8,0004 Harvesting 30,100 41,0005 Inputs 84,503 182,5006 Fertilizer handling 450 -7 Bank interest 2,400 2,4008 Land tax 50 50Total costs for 10 acres 170,850 263,950Total costs for 1ha 42,217 65,222Total costs for 1 ton paddy 13,649 1/ 15,815 1/
Total costs for 1 ton paddy (US$) 34.1 2/ 39.5 2/Source : MOAI1/ Yield : Monsoon Rice : 60 baskets of paddy/acre ( = 3.09 ton/ha)
Summer Rice : 80 baskets of paddy/acre ( = 4.12 ton/ha)2/ Converted by 400 Kyats/USD
Official exchange rate in 2000 : 6.5 Kyats/USDMarket exchange rate in early 2000 : 350 – 500 Kyats/USD (Data source: OMIC Yangon)
(2) Number and Scale of Farm Households
Total number of farm households and holding areas have both increased at 4% during last 20 years,though there is no change in the structure of land holding. The average size of holding area iscalculated as 2.25 ha per farm household.
Number of Farm Households by size (Unit: 1000 households, 1000 ha)1981 - 1982 1997 – 1998 (p)
Size of landholding Number of farm
households Holding area Number of farmhouseholds Holding area
less 2 ha 2,622.4 (60%) 2,455 (25%) 2,804.0 (62%) 2,721 (27%)
2 – 4 ha 1,052.0 (24%) 3,046 (31%) 1,139.4 (25%) 3,294 (32%)
4 – 8 ha 503.0 (12%) 2,854 (29%) 493.4 (11%) 2,775 (27%)
8 – 20 ha 112.9 (2.6%) 1,244 (13%) 101.0 (2.2%) 1,127 (11%)
20 – 40 ha 2.0 (0.05%) 55 (0.6%) 1.9 (0.04%) 49 (0.5%)
over 40 ha 0.7 (0.02%) 172 (1.8%) 1.1 (0.02%) 243 (2.4%)
Total 4,351.9 (100%) 9,816 (100%) 4,540.8 (100%) 10,210 (100%)
Source : Collected information/data by Embassy of Japan

Country Report : Myanmar
F - 3
1.3 Policies on Rice Production
(1) Agricultural Development Plan
Agriculture sector contributes 34% of GDP, 23% of total export earnings, and employs 63% of thelabour force. 75% of the total population reside in rural areas and are principally engaged inagriculture, livestock and fishery sector for their livelihood.The State has laid down 12 political, economical and social objectives in its endeavours to establisha peaceful modern and developed nation. One of the major economic objectives is “ developmentof agriculture as a base and all-round development of other sectors of the economy as well”. Riceis the staple food and is designated as national crop to highlight its importance as the main food ofthe increasing population. The “ achievement of surplus in paddy production” has been set as oneof three main objectives in the integrated agricultural development strategy since 1992-93, theEconomic Development Year.
Agricultural Development Strategy
Main Objective (1) To achieve surplus in paddy production(2) To achieve self-sufficiency in edible oil(3) To step up the production of exportable pulses and industrial crops
Policies - to allow freedom of choice in agricultural production- to expand agricultural land and to safeguard the rights to farmers- to permit commercial production of industrial crops and perennial crops- to encourage the participation of private sector in the distribution of farm
machinery and other inputs
Strategic Measures (1) Development of new agricultural land(2) Provision of sufficient irrigation water(3) Provision and support for agricultural mechanization(4) Application of modern agro-technologies, and(5) Development and utilization of modern varieties
Source : Myanmar Agriculture in Brief, March 2001, MOAI
(2) Production Target
In accordance with National Planning Targets, cultivation of paddy is being implemented, aiming tomeet total area of 18 million acres (approx. 7.3 million ha) comprising 14 million acres undermonsoon paddy and 4 million acres under summer paddy. Yield per acre is targeted to reach 100baskets/acre (5.7 tons/ha). To generate increasing production measures are also undertaken ingrowing high-yield varieties, including introduction of hybrid rice varieties (Myanmar Agriculture
in Brief, March 2001, MOAI).
In the Mid-Term Plan (2001-2002 to 2005-2006), the sown area, yield and production are set as follows.

Country Report : Myanmar
F - 4
Production Target in the Mid-Term PlanFiscal Year Sown area Production Yield
(1000 ha) (1000 ton) (ton/ha)2001/2002 6,600 22,710 3.42002/2003 6,708 24,047 3.62003/2004 6,815 25,252 3.72004/2005 6,924 26,829 3.92005/2006 7,038 28,184 4.0Source : MOAI
Box Hybrid rice production
Some private entrepreneurs and farmers have started to seed hybrid paddy (rice) variety. Thelocal hybrid variety jointly produced by Marubeni and the Myanma Agriculture Service, anagency under the Ministry of Agriculture and Irrigation and Sima variety from China. The localhybrid variety eating quality is poor. The Sima hybrid seeds are expensive and since the farmerscould not follow the agricultural practices as instructed for the Sima variety, the farmers wereonly able to get 4.64 ton tons per hectare instead of 10.30 tons per hectare as mentioned. Due tothe high cost for hybrid seeds, farmers are still reluctant to grow hybrid varieties and there was nosignificant increase on that area.(USDA/FAS GAIN Report #BM0008 “Grain and Feed Annual – Revised 2000” May 2000)
(3) Land Reclamation Project
In 1998, Myanmar government adopted a two-pronged strategy to revitalize domestic paddyproduction, based on land reclamation and large-scale irrigation schemes. The new plan aims atexpanding the paddy land base from 5.8 million ha to 7.3 million ha. The private sector isexpected to play a key role in achieving these objectives. To stimulate private investments in riceproduction, the Government has offered 30-year long land leases, free provision of irrigationinfrastructure and tax and tariff exemptions on machinery and equipment imports. In addition,large-scale producers were granted the right to export directly up to 50 % of their output. Since1998, the private sector has also been called upon to participate in the import and distribution ofagricultural commodities and basic inputs.
(4) Change to “Quantity” to “Quality”
The official of MOAI expressed that it is necessary to change the nature of Myanmar rice export byputting more emphasis on “quality” rather than on “quantity” considering the currentsituation/trends of the international rice market, and a change of the rice varieties is necessary toprovide a better quality of material for export processing.
(5) Government Support on Rice Production
Myanmar government has been notifying to WTO that Myanmar did not use any domestic support.

Country Report : Myanmar
F - 5
2. Demand
2.1 Per Capita Consumption
Per capita consumption of rice is set at 15 baskets of paddy per annum (equivalent to 187.8 kg ofrice per annum) in the balance calculations of MOAI.
According the Household Income & Expenditure Survey 1997, per capita consumption wasestimated at 134.2 kg for the urban and 158.5 kg for the rural. Per capita consumption variesdepending on the States/Divisions. The largest amount was recorded at Rakhine State, both forurban and rural. Only in Chin State, rice consumption in the rural was smaller than that of theurban.
Per Capita Rice Consumption (1997) (Unit : Kg per annum)Urban Rural
Union (whole nation) 134.2 158.5States & Division 149.5 180.2
Largest State 175.3 (Rakhine State) 219.8 (Rakhine State)Smallest State 129.6 (Shan State) 134.4 (Chin State)
Yangon City 138.3 --Source : Report of Household Income & Expenditure Survey (1997)
Monthly household expenditure on rice and cereals for the nation average was estimated as 20% ofthe monthly household expenditure, 16% for the urban and 22% for the rural.
2.2 Consumer’s Preference
Rice prices vary according to variety, quality, new rice and old rice. Each variety also has threedifferent qualities: first quality (a-htat-sa), medium quality (a-lat-sa) and the lowest quality (auk-sa).
Regarding the old-new, consumers prefer old rice (in general 6 to 10 months old after harvest)because new rice is little sticky after cooking and normally price of old rice is higher than that ofnew rice. Price difference between old and new rice occurs from November to the end ofDecember in the market.Regarding the variety, Pawsan rice variety is high-priced compare to other varieties. The price ofdifferent varieties is highly variable, depending on quality and local preferences. Consumers in thelower part of the country generally prefer slightly sticky varieties and non-sticky varieties ispreferred in the central part. In the Northern Shan State area, the local varieties are sticky and , forexample, the variety “Immayebaw” from western Bago is preferred.
According to the hearing from the rice wholesalers, rice demand increases in Feb. – May becausethe people keep some stock for rainy season. But the demand in Yangon City is stable throughoutthe year.

Country Report : Myanmar
F - 6
3. Supply-Demand Balance
3.1 National Balance
National rice balance (paddy utilization) in recent years is estimated as shown in below, accordingthe MOAI’s norms for estimation.
National Rice Balance 1996-97 to 1999-00 (Unit : 1000 tons)Paddy Rice
UtilizationProduction
Seed Loss Consumption Total
Deficit / Surplus
1996-97 17,676 596 596 14,258 15,450 2,223 1,3341997-98 16,654 594 594 14,520 15,708 943 5661998-99 17,078 648 648 14,787 16,083 992 595
1999-2000 20,126 682 682 15,060 16,424 3,698 2,219Source : Myanmar Agricultural Service, MOAI
Norms for estimation used by MOAI (paddy basis) :Seed use : 2 baskets per acre (103 kg per ha) nation’s average
Post-harvest Losses : 2 baskets per acre (103 kg per ha) includes no storage loss
Per capita consumption : 15 baskets per annum (187.8 kg of rice per annum)
Milling recovery : 60% by weight
3.2 Regional Balance
According the Agricultural Statistic data, out of total 14 states/divisions, 10 states/divisions weredeficit during the three-year of 1996/97 – 1998/99 and it reduced to 7 states/divisions in 1999/00.State/Division-wise rice balance is shown in ANNEX.
In 1999/00, major deficit areas were in central part of the country, namely Magway, MandalayDivisions and Shan State. These three state/divisions account for about 90 % of total deficitvolume. Major surplus areas were Ayeyarwady, Bago Divisions and Mon, Rakhine State.Ayeyarwady Division has largest surplus in the nation, accounting for about 70% of total surplusvolume (2,625 thousand ton of milled rice) in 1999/00.
The volume of surplus is not stable. In 1999-2000, all the States/Divisions has increased theproduction and surplus volume reached to 2,219 thousand tons, and Sagaing State and Kachin Stateturned to surplus situation. According the statistic data on production, these changes werebrought by the increase of both sown areas and yield.
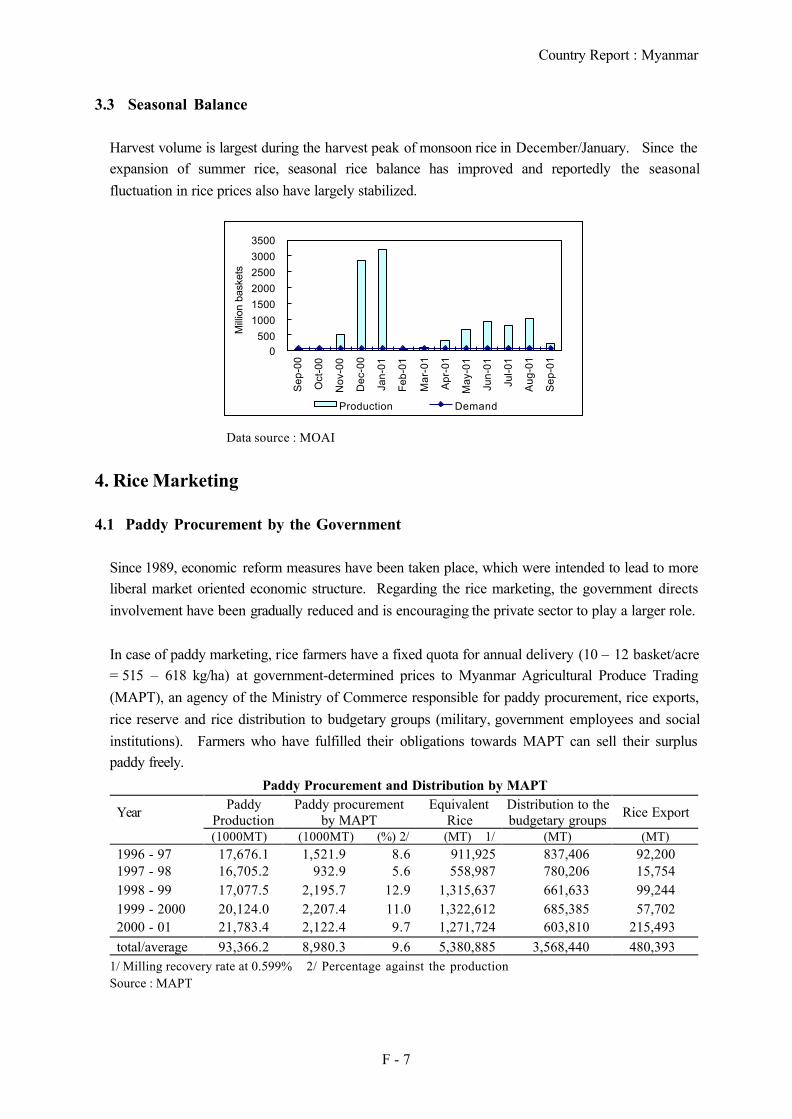
Country Report : Myanmar
F - 7
3.3 Seasonal Balance
Harvest volume is largest during the harvest peak of monsoon rice in December/January. Since theexpansion of summer rice, seasonal rice balance has improved and reportedly the seasonalfluctuation in rice prices also have largely stabilized.
0500
1000
1500
2000
2500
3000
3500
Sep
-00
Oct
-00
Nov
-00
Dec
-00
Jan-
01
Feb
-01
Mar
-01
Apr
-01
May
-01
Jun-
01
Jul-0
1
Aug
-01
Sep
-01
Mill
ion
bask
ets
Production Demand
Data source : MOAI
4. Rice Marketing
4.1 Paddy Procurement by the Government
Since 1989, economic reform measures have been taken place, which were intended to lead to moreliberal market oriented economic structure. Regarding the rice marketing, the government directsinvolvement have been gradually reduced and is encouraging the private sector to play a larger role.
In case of paddy marketing, rice farmers have a fixed quota for annual delivery (10 – 12 basket/acre= 515 – 618 kg/ha) at government-determined prices to Myanmar Agricultural Produce Trading(MAPT), an agency of the Ministry of Commerce responsible for paddy procurement, rice exports,rice reserve and rice distribution to budgetary groups (military, government employees and socialinstitutions). Farmers who have fulfilled their obligations towards MAPT can sell their surpluspaddy freely.
Paddy Procurement and Distribution by MAPT
Year PaddyProduction
Paddy procurementby MAPT
EquivalentRice
Distribution to thebudgetary groups Rice Export
(1000MT) (1000MT) (%) 2/ (MT) 1/ (MT) (MT)1996 - 97 17,676.1 1,521.9 8.6 911,925 837,406 92,2001997 - 98 16,705.2 932.9 5.6 558,987 780,206 15,7541998 - 99 17,077.5 2,195.7 12.9 1,315,637 661,633 99,2441999 - 2000 20,124.0 2,207.4 11.0 1,322,612 685,385 57,7022000 - 01 21,783.4 2,122.4 9.7 1,271,724 603,810 215,493total/average 93,366.2 8,980.3 9.6 5,380,885 3,568,440 480,393
1/ Milling recovery rate at 0.599% 2/ Percentage against the productionSource : MAPT

Country Report : Myanmar
F - 8
MAPT currently purchases 10 – 12 % of total production which is about 2 million tons of paddyeach year to yield about 1.2 million tons of milled rice. Excludes the farmer’s consumption forabout 30%, remaining 60% which is about 16 million tons of paddy (about 9.6 million tons ofmilled rice) is marketed by the private sector.
4.2 Major Rice/Paddy Flow
The major rice flows are from the surplus areas in lower part of the country (Ayeyarwady, Bago,Yangon Divisions and Mon State) where account for about 60 % in total country rice area, to therice deficit areas in the central part (Magway, Sagaing, Mandalay Division) and hilly region (ShanState). A chart of rice/paddy flows is attached to Annex.
Different varieties such as Manawthukha, Zeeya, Shwewahthun, Theethatyin, Inmayebaw fromAyeyarwady, Yangon and Bogo Division are marketed to the deficit area. Nagaya, Ban-kauk andShwetasoke rice varieties from Mon State are marketed to Mandalay Division.
4.3 Price Trends
The domestic rice market for rice has been insulated from international price movements as a directeffect of the government export monopoly. Paddy and rice prices have been increasing because ofthe inflation.
Average Retail Prices at Yangon (Unit : Kyats/kg)
1990 1992 1993 1994 1995 1996 1997 1998 1999Nominal PricesNgakywe 38% 6.7 14.2 21.6 22.5 31.0 36.7 41.9 54.1 75.4Emata 35% 5.6 10.7 18.3 16.9 24.0 27.2 29.4 40.4 59.7Ngasein 35% 4.8 10.0 17.0 15.7 22.6 25.4 27.9 37.1 50.3Real Prices (deflated by General CPI 1990=100)Ngakywe 38% 6.7 9.0 10.2 8.7 9.4 9.7 8.4 7.2 8.4Emata 35% 5.6 6.8 8.7 6.5 7.3 7.2 5.9 5.4 6.7Ngasein 35% 4.8 6.3 8.1 6.1 6.8 6.7 5.6 4.9 5.6Data source : Central Statistical Organization (Statistical Yearbook 2000)
Seasonal Price TrendsDue to the cropping pattern, paddy and rice prices go up in the rainy season, July-August-September and the prices go down substantially after the harvest of monsoon rice from October toJanuary.

Country Report : Myanmar
F - 9
Time of Planting and harvesting of RiceMonsoon Rice Summer Rice
Planting Harvesting Planting HarvestingLower part May – Sep. Nov. – Jan. Nov. – Feb. March - MayCentral part July – Sep. Oct. – Jan. Jan. - April Apr. - July
Southern Shan State June – Sep. Oct. – Dec. Mar. - April Jan. - July
500
1,000
1,500
2,000
2,500
3,000
3,500
4,000
4,500
5,000Ja
n-00
Mar
-00
May
-00
Jul-0
0
Sep
-00
Nov
-00
Jan-
01
Mar
-01
May
-01
Jul-0
1
Sep
-01
Nov
-01
Kya
t/30
viss
Pawsan
Manawthukha
Shwebo-Manaw
Ngasein
Monthly average wholesale price (Mandalay Market), medium qualitySource : MOAI
4.4 Government Price Control (Rice Price Policy)
(1) Paddy Price Control
MAPT currently purchases 10 – 12 % of total production which is about 2 million tons of paddyeach year to yield about 1.2 million tons of milled rice. In general, about 50% of the procurement(about 600,000 tons of milled rice) is allocated for rice distribution to the budgetary groups andanother 50 % is allocated for the National reserve, ASEAN Food Security reserve and rice export.
Since 1999, MAPT disburse advance payment loans (which is about 100% of the procurementprice) to the contract farmers at the time of cultivation to secure the procurement and to support thefarmers. This procurement system is termed as Full Advance Payment Paddy Purchase system.Procurement prices of paddy are set by MAPT and they have been kept in the same prices sinceyear 1998-99 until year 2001-02. In year 2001-02, procurement prices range from the lowest of14,380 Kyats/ton to the highest of 19,175 Kyats/ton depending on variety and States/Division.MAPT currently do not procure the dry season paddy.

Country Report : Myanmar
F - 10
Paddy Procurement Price of MAPT (Unit : Kyats/ton)Nominal price Real Prices
(deflated by General CPI 1997=100)
Varieties 1996-97 1997-98 1998-99 1999-00 2000-01 1996-97 1997-98 1998-99 1999-00 2000-01 1/ 1/ 1/ 1/ 1/ 1/ 1/ 1/
1.Ngasein 6,711 16,209 15,580 15,580 15,580 6,711 15,794 11,670 10,091 10,2682.Medone 7,670 18,157 17,977 17,977 17,977 7,670 17,691 13,465 11,643 11,8473.Emata 7,191 17,448 16,299 16,299 16,299 7,191 17,001 12,208 10,556 10,7414.Ngakywe 7,670 18,217 19,175 19,175 19,175 7,670 17,750 14,363 12,419 12,6375.Kauknyin 6,711 19,175 19,175 19,175 19,175 6,711 18,684 14,363 12,419 12,6371/ Average purchasing price for the whole country.Data Sources : 1996-97 ; Statistic Year Book 2000 (Table 5.14 Prices of Selected Crops at Harvest time)
: 1999-2000 to 2001-2002 ; Myanmar Agricultural Produce Trading.: CPI ; Selected Monthly Economic Indicators Mar.-Apr.2001, Central Statistical Organization 1997 =100, 1997-98=102.63, 1998-99=133.51, 1999-00=154.40, 2000-2001=151.74
Although the procurement prices are called as support prices or floor prices by the government, theyare lower than the market price. Therefore, under the current MAPT procurement system, betterquality paddy is sold to traders or consumed by farmers and the poor quality paddy is generallydelivered to the MAPT.
In 1998/99 the price paid for those deliveries was reportedly 50 % below farm gate market prices(Review of Basic Food Policies, FAO 2001). A World Bank study estimated that farmgate pricesare substantially below world prices at around 35 % less than the F.O.B. price (World Bank, 1999).The trend of rice prices of Emata variety as well as the paddy procurement prices of Emata isillustrated in the following chart. It is presumed that the procurement price in 1998-99 and 1999-2000 were 1/2 to 2/3 of the market price.
Variety : Emata
0.0
10.0
20.0
30.0
40.0
50.0
60.0
70.0
1985
-86
1990
-91
1992
-93
1993
-94
1994
-95
19
95-9
6
199
6-97
199
7-98
199
8-99
1999
-00
Kya
t/kg
Paddy procurementprice of MAPT
Rice wholesale price(broken 35%)
Rice retail price(broken 35%)
MAPT Paddy Procurement Price and Rice Price (variety : Emata)
(2) Milled Rice Price Control (Market intervention)
In principle, rice distribution to the supply/demand imbalance areas is in the hands of the privatesector (i.e. marketing mechanism). But MAPT did market interventions, released its rice stock to

Country Report : Myanmar
F - 11
the market through Myanmar Rice & Paddy Wholesaler’s Association to lower the rice prices in1992 and in 1999. The release in 1999 was 70,000 tons from MAPT stock and 5,000 tons from theassociation’s stock and retail price was set as 80 Kyats/kg. Regarding a guideline of the marketintervention, no clear information has obtained.
(3) Food Subsidy Program
Myanmar government defines the government employees, military and their family as mostvulnerable groups and total of about 600,000 tons rice is distributed to them with very low price(6.8 Kyats/kg, Emata 25% Broken). Amount of rice distribution to the government employee is 25kg/month/official for unmarried or 30 kg/month/official for married.
4.5 Marketing channels and characteristics of the agents
Marketing channel of paddy/rice is illustrated as follow. Generally, about 30 % of the productionis consumed by the farmers and about 10 % is handled by MAPT, remaining 60% is distributed bythe private sector.
PaddyRice
# : in the same town
Farmer
60% of Production30% of Production
Consumer
Market retailer
Town wholesaler
Primary collector
Village mill
Large mill
Market wholesaler
# #
Bugetary Groups
MAPT
State-owned mill
Reserve(paddy)
Reserve(rice)
Exports
Distribution(rice)
10% of Production
(Prepared based on a chart in “Agricultural marketing in Myanmar, MOAI” and a chart provided by MAPT)
Marketing Channels of Rice
Farmer : Most farmers sell their crop as paddy. In most cases the farmers do not sell always tothe same trader. Farmers store their paddy for home consumption, seed use, labour wage and alsowith the expectation to sell at a higher price later in season. The period of storage ranges fromthree to ten months, depending on the price movement and on their financial condition.

Country Report : Myanmar
F - 12
Village mill : Small scale village mills are found in large number in the rural areas. They providemilling services both for milling part of farmers’ marketable surplus and for milling farmers’ homeconsumption.
Town wholesaler : Most of town wholesalers are involved in inter-State/Division trade. Most ofthem collect from primary collectors. The period of rice storage varies 2-3 days to 5 months.
Market wholesaler : Mainly sell to market retailers. The selling price varies according to varietyand quality. The volume of stock is for 10 days in usual. Sales unit is 50 kg bag.
Market retailer : Most of them buy rice from market wholesalers and town wholesalers. Salesunit is “pyi”. ( 1 pyi = 2.13 kg = 4.69 lbs)
5. Rice Trade
5.1 Rice Export System
Since 1989, economic reform measures have been taken place, which were intended to lead to moreliberal market oriented economic structure. Regarding the grain marketing, the government directsinvolvement have been gradually reduced and export of pulses and other agricultural crops anddomestic marketing of rice and oilseeds have been liberalized while the export of rice, sugar, cotton,jute and rubber are still under government control.
MAPT is the only government agency undertaking the rice export. Although the government hasallowed to the private entrepreneurs engaged in reclaiming virgin and fallow lands and wet lands togrow paddy to export 50 % of their production, for the time being there are no rice exports from theprivate sector.
Myanmar Government has given more attention to availability and price stability of rice. Basicstance on rice export is to export only when there is a surplus in the MAPT rice stock. Accordingthe hearing from MOAI official, it is observed that government has intention to promote export ofother surplus agricultural commodities (neighboring China and India is potential markets) than rice.Due to low prices in the international rice market, also due to it requires a lot of efforts and time toimprove rice quality and to take a lost-markets back in hand from Thailand and Vietnam.
Exportable amount is estimated by MAPT and it is authorized within the Ministry of Commerce. 3kinds of offer prices (selling prices) are set according the destinations and they are publicizedthrough the MAPT’s homepage. These prices are set to be a competitive price by looking at theinternational market conditions, not by looking at the domestic rice prices.
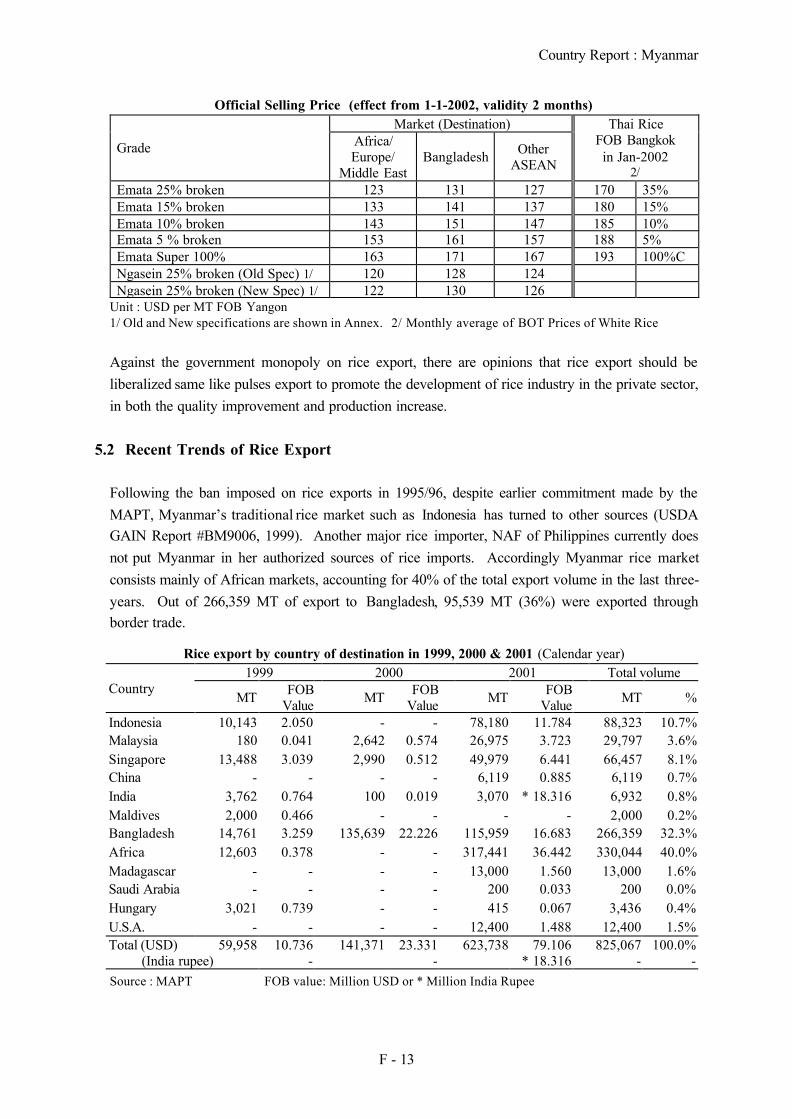
Country Report : Myanmar
F - 13
Official Selling Price (effect from 1-1-2002, validity 2 months)Market (Destination)
Grade Africa/Europe/
Middle EastBangladesh Other
ASEAN
Thai RiceFOB Bangkokin Jan-2002
2/Emata 25% broken 123 131 127 170 35%Emata 15% broken 133 141 137 180 15%Emata 10% broken 143 151 147 185 10%Emata 5 % broken 153 161 157 188 5%Emata Super 100% 163 171 167 193 100%CNgasein 25% broken (Old Spec) 1/ 120 128 124Ngasein 25% broken (New Spec) 1/ 122 130 126
Unit : USD per MT FOB Yangon1/ Old and New specifications are shown in Annex. 2/ Monthly average of BOT Prices of White Rice
Against the government monopoly on rice export, there are opinions that rice export should beliberalized same like pulses export to promote the development of rice industry in the private sector,in both the quality improvement and production increase.
5.2 Recent Trends of Rice Export
Following the ban imposed on rice exports in 1995/96, despite earlier commitment made by theMAPT, Myanmar’s traditional rice market such as Indonesia has turned to other sources (USDAGAIN Report #BM9006, 1999). Another major rice importer, NAF of Philippines currently doesnot put Myanmar in her authorized sources of rice imports. Accordingly Myanmar rice marketconsists mainly of African markets, accounting for 40% of the total export volume in the last three-years. Out of 266,359 MT of export to Bangladesh, 95,539 MT (36%) were exported throughborder trade.
Rice export by country of destination in 1999, 2000 & 2001 (Calendar year)1999 2000 2001 Total volume
CountryMT FOB
Value MT FOBValue MT FOB
Value MT %
Indonesia 10,143 2.050 - - 78,180 11.784 88,323 10.7%Malaysia 180 0.041 2,642 0.574 26,975 3.723 29,797 3.6%Singapore 13,488 3.039 2,990 0.512 49,979 6.441 66,457 8.1%China - - - - 6,119 0.885 6,119 0.7%India 3,762 0.764 100 0.019 3,070 * 18.316 6,932 0.8%Maldives 2,000 0.466 - - - - 2,000 0.2%Bangladesh 14,761 3.259 135,639 22.226 115,959 16.683 266,359 32.3%Africa 12,603 0.378 - - 317,441 36.442 330,044 40.0%Madagascar - - - - 13,000 1.560 13,000 1.6%Saudi Arabia - - - - 200 0.033 200 0.0%Hungary 3,021 0.739 - - 415 0.067 3,436 0.4%U.S.A. - - - - 12,400 1.488 12,400 1.5%Total (USD) 59,958 10.736 141,371 23.331 623,738 79.106 825,067 100.0%
(India rupee) - - * 18.316 - -Source : MAPT FOB value: Million USD or * Million India Rupee

Country Report : Myanmar
F - 14
5.3 Border Trade
Apart from the trade by ocean shipment, a large variety of agricultural commodities are alsoexported by road and by coastal shipping. According the MAPT officials, border trade ofrice/paddy is in the trend toward expanding.
Rice /paddy export through Boarder Trade in 1999, 2000 & 2001 (Calendar year)1999 2000 2001 Total volumeCountry
MT Value MT Value MT Value MT %Bangladesh Border 10,044 2.302 34,161 6.518 51,334 7.692 95,539 92.2%China Boarder - - - - 4,919 0.720 4,919 4.7%India Boarder - - 100 0.019 3,070 * 18.316 3,170 3.1%Total (USD) 10,044 2.302 34,261 6.537 59,323 8.412 103,628 100.0%
(India rupee) - - * 18.316Source : MAPT Value: Million USD or * Million India Rupee
Boarder trade of rice/paddy also under government control and MAPT is solo exporter, although itis reportedly that there is some smuggling. Bangladesh is a main country accounting 92% of thetotal trade volume in the last three-years. Trade with India is settled with Indian Rupee.
5.4 Tax on Export
8% Commercial tax + 2% Income tax (2% Income tax is waived for MAPT)
5.5 Export subsidies
Myanmar government has been notifying to WTO that Myanmar did not use any export subsidies.
5.6 Bilateral/Multilateral Agreements on Rice Trade
Barter trade agreement between MAPT and BERNAS (Malaysia)Products to be supplied by BERNAS to MAPT are: rice milling machine, equipment and spare partsfor upgrading of rice mills. Products to be supplied by MAPT are: rice, onions, spices, garlic oilseeds, pulses and other agricultural produce
Reportedly some portion of the payment for importation of crude oil from PETRONAS (Malaysia)is made by rice.
5.7 Rice / Paddy Import
Importation of commodities are under strict government control. Although no statements/papershave obtained, it assumed that a real import is banned.

Country Report : Myanmar
F - 15
6. Rice Reserve by the Government
MAPT currently purchases 10 – 12 % of total production which is about 2 million tons of paddyeach year to yield about 1.2 million tons of milled rice. Rice reserve is managed under this MAPTprocurement system.
Based on the data obtained from MAPT, annual rice balance (volume of end stocks) in the MAPTprocurement system is calculated as shown in the following table. Due to the accumulation ofannual balance, MAPT holds over 1 million tons stocks and targets to export the 1 million tons ofrice in year 2001 – 2002.
Annual Balance of MAPT’s Procured Rice (Unit :1000 MT)
YearPaddy
procurement byMAPT
EquivalentRice1/
Distribution to thebudgetary groups
Rice Export Balance
1996 - 97 1,521.9 911.9 837.4 92.2 -17.71997 - 98 932.9 559.0 780.2 15.8 -237.01998 - 99 2,195.7 1,315.6 661.6 99.2 554.81999 - 2000 2,207.4 1,322.6 685.4 57.7 579.52000 - 2001 2,122.4 1,271.7 603.8 215.5 452.4Total 8,980.3 5,380.9 3,568.4 480.4 1,332.1
1/ Milling recovery rate 0.599%Source : Myanmar Agricultural Produce Trading.
According the hearing from MAPT, rice reserve / stock situation in year 2000 – 2001 is as follows:
National ReserveMAPT held a stock of 25,000 tons milled rice plus 41,700 tons paddy (approximately 50,000 tonsof milled rice in total) as a national reserve in 2000 – 2001.
ASEAN Food Security Reserve (AFSR)Oblige amount of AFSR is 14,000 ton (milled rice). Rice reservation for AFSR is also managedby MAPT and it is clearly separated from the national reserve. That amount of rice is stored at14 warehouses (1,000 tons each) in the suburbs of Yangon and is turned over every 3 months tomaintain the quality.
7. Food Aids
Myanmar government has no activity to support the poor/vulnerable people by distributing supportrice except the rice distribution to the budgetary groups.
WFP has started its operation in the North Rakhine State in 1994, bordering Bangladesh and thereturnee comprise approximately 29% of the population of the area. In the year 2000, approx.8,100 ton of low-grade domestic rice (Emata 35% broken rice) was procured through MAPT andsupplied to about 470,000 beneficiaries.

Country Report : Myanmar
F - 16
Distributed volume of rice by WFP (Unit : ton)
Year 1997 1998 1999 2000 2001
Distributed volume 4,577 3,670 7,971 8,124 5,276
Source : WFP Myanmar
8. Poverty
The Central Statistical Organization has estimated the parentage of households in poverty on thebasis of 1997 Households Income & Expenditure Survey by using the norm of minimumsubsistence costs based on nutritional norms of 2,400 calories of energy per person per day and asmall allowance for non-food consumption to cover basic items.
Poverty Line in Myanmar (1997) (Unit : Kyats)Myanmar Rural Urban
Daily food expenditure per person 42.95 40.71 48.47Daily non-food expenditure per person 1/ 10.74 10.18 12.12
Monthly minimum subsistence costs per household 2/ 8,456.18 8,015.18 9,542.93Source : Central Statistical Organization & World Bank1/ food expenditure x125%2/ 30 days per month, 5.25 persons per household(Average monthly household expenditure was 13,784.50 Kyats for Myanmar, 13,091.00 Kyats for the ruraland 15,266.00 Kyats for the urban in 1997.)
According the 1997’s data, poverty rate was estimated at 22.9% for the nation, and 23.9% for theurban and 22.4% for rural. Food poverty rate for the nation was estimated at 19.6%. 58% of thehouseholds were at below the average household expenditures.
Situation of the Poverty (1997) (Unit : %)Urban Rural Total
Myanmar 23.9 22.4 22.9States / Divisions
Chin State 19.8 47.1 42.1Magway Division 44.9 36.3 37.9Kayah State 30.8 37.4 35.4Sagaing Division 27.6 24.3 24.9Bago Division 26.6 25.4 24.7Ayeyarwady Division 47.0 17.3 22.7Mandalay Division 18.8 23.9 22.3Rakhine State 34.5 19.2 22.0Mon State 27.1 16.1 19.9Yamgon State 16.6 16.7 16.7Kayin State 11.8 12.8 12.7Shan State 7.1 13.4 12.0Kachin State 4.6 11.9 10.1Tanintharyi Division 9.8 7.4 8.1
Source : The Poverty Ration in Myanmar, Central Statistical Organization(Paper prepared for UNSD Workshop on Development Indicators, Oct. 2001, Manila)

Country Report : Myanmar
F - 17
There is significant regional variation in poverty rates with the highest levels for Chin and KayahStates and Maqway Division. The poverty is not concentrated in outlying regions away frommetropolitan area. Some of remote areas such as Kachin State, Shan State have relatively lowpoverty incidence.
Poverty rates are approximately same in urban and rural areas, but most of the poor, about 70% livein rural areas. A substantial share of the rural poor has either no land or plots that are too small tobe available. Rural poverty can therefore be traced to low outputs and low prices for the outputs ofsmall farmers, as well as to the limited availability of off-farm work.
According the Household Income & Expenditure Survey 1997, monthly household expenditure onfood and beverages for the nation was 71% of the total monthly household expenditure, 68% for theurban and 72% for the rural.
**************************
Conversions Relevant1 kilogram (kg) = 2.205 pounds (lb)1 basket of paddy = 20.86 kg or 46 lb1 basket of milled rice = 34.01 kg or 75 lb1 basket of broken rice = 32.65 kg or 72 lb1 basket of bran = 20.41 kg or 45 lb
1 hectare (ha) = 2.471 acres (ac)1 viss = 1.54 kg or 3.6 lb(30 viss = 1 bag of milled rice)1 pyi = 2.13 kg or 4.69 lb(16 pyi = 1 basket of milled rice)
Exchange Rate (Kyats per US dollar)
Official rate6.5972 (January 2001), 6.5167 (2000),6.2858 (1999), 6.3432 (1998), 6.2418 (1997),5.9176 (1996), 5.6670 (1995)(source: CIA Country Data)
Parallel rateYear 2000 :500 (Jan.), 500 (Feb.), 600 (Mar.), 600 (Apr.),650 (May), 590 (Jun.), 590 (Jul.), 590 (Aug.),650 (Sep.), 650 (Oct.), 650 (Nov.), 650 (Dec.)Year 2001 :500 (Jan.), 500 (Feb.), 800 (Mar.), 740 (Apr.),700 (May), 700 (Jun.), 650 (Jul.), 650 (Aug.),650 (Sep.), 750 (Oct.), 750 (Nov.), 750 (Dec.)(source : OMIC Yangon Office)

Country Report : Myanmar
F - 18
References
1. Myanmar Agriculture in Brief, March 2001, MOAI2. Agricultural Marketing in Myanmar, Oct. 2000, MOAI and FAO3. Marketing Cost and Margin for Agricultural Produce in Myanmar, July 2001, MOAI and FAO4. Myanmar Agricultural Statistics (1989-90 to 1999-2000), 2001, Central Statistical Organization
and MOAI5. Statistical Yearbook 1997, Central Statistical Organization6. Statistical Yearbook 2000, Central Statistical Organization7. Selected Monthly Economic indicators, Sep.-Oct. 2001, Central Statistical Organization8. Selected Monthly Economic indicators, March-April 2001, Central Statistical Organization9. Selected Monthly Economic indicators, Jan.-Feb. 2000, Central Statistical Organization10. Report of 1997 Household Income and Expenditure Survey 1999, Central Statistical
Organization11. An Economic Assessment of the Myanmar Rice Sector: Current Development and Prospects,
Feb. 1998, University of Arakansas Research Bulletin 95812. Myanmar Grain and Feed - Annual 2000, GAIN Report #BM0008, USDA13. Myanmar Grain and Feed - Annual 1999, GAIN Report #BM9006, USDA14. The Poverty Ratio in Myanmar (Paper prepared for UNSD Workshop on Development
Indicators, October 1-5, 2001, Manila, Philippines), Central Statistical Organization15. Free Trade Area Membership as a Stepping Stone to Development -The Case of ASEAN, Feb.
2001, World Bank Discussion Paper No. 42116. Review of Basic Food Policies 2001, Commodities and Trade Division, FAO17. Cereal Policies Review, 1997/98, Commodities and Trade Division, FAO

Country Report : Myanmar
F - 19
Annexes
1. Myanmar at a glance & Social Indicators (World Bank Data)2. Sown/harvested areas and production of paddy, 1990-91 to 1999-20003. Third five-years mid-term plan for sown area and production of paddy4. Area of crops under irrigation5. Area by type of irrigation6. Utilization of fertilizers by crop7. Utilization of pesticides by crop8. Data on paddy procurement by MAPT9. Data on paddy and rice prices10. MAPT’s rice mills, owned and hired by State/Division11. Capacity of rice mills owned by MAPT12. Regional rice balance in 1999-200013. Trends of paddy/rice balance by State/Division14. Rice export by country of destination in 1999, 2000 & 200115. Rice export by month in 1999, 2000 & 200116. Rice export by sector in 1999, 2000 & 200117. Rice export by grade/type in 1999, 2000 & 200118. Rice export through boarder trade in 1999, 2000 & 200119. Rice export by country of destination, 1985-86 to 1999-200020. New and old specifications for Myanmar rice21. Per capita consumption of rice in 199722. Cropping pattern in Lower Myanmar23. Cropping pattern in Upper Myanmar24. Major Interstate/Division trade flow of rice (Map5-2)

Myanmar at a glance 9/13/01
EastPOVERTY and SOCIAL Asia & Low-
Myanmar Pacific income2000Population, mid-year (millions) 45.6 1,853 2,459GNI per capita (Atlas method, US$) .. 1,060 420GNI (Atlas method, US$ billions) .. 1,964 1,030
Average annual growth, 1994-00
Population (%) 1.2 1.1 1.9Labor force (%) 1.5 1.4 2.4
Most recent estimate (latest year available, 1994-00)
Poverty (% of population below national poverty line) .. .. ..Urban population (% of total population) .. 35 32Life expectancy at birth (years) .. 69 59Infant mortality (per 1,000 live births) 79 35 77Child malnutrition (% of children under 5) .. 13 ..Access to an improved water source (% of population) .. 75 76Illiteracy (% of population age 15+) 15 14 38Gross primary enrollment (% of school-age population) 80 119 96
Male .. 121 102Female .. 121 86
KEY ECONOMIC RATIOS and LONG-TERM TRENDS
1980 1990 1999 2000
GDP (US$ billions) .. .. .. ..
Gross domestic investment/GDP 21.5 13.4 13.2 ..Exports of goods and services/GDP 9.1 2.6 0.4 ..Gross domestic savings/GDP 17.6 11.2 13.0 ..Gross national savings/GDP .. .. 13.2 ..
Current account balance/GDP .. .. .. ..Interest payments/GDP .. .. .. ..Total debt/GDP .. .. .. ..Total debt service/exports 25.4 9.0 .. ..Present value of debt/GDP .. .. .. ..Present value of debt/exports .. .. .. ..
1980-90 1990-00 1999 2000 2000-04(average annual growth)GDP 0.6 6.6 10.9 .. ..GDP per capita -1.2 4.8 16.6 .. ..Exports of goods and services 1.9 8.7 23.9 .. ..
STRUCTURE of the ECONOMY1980 1990 1999 2000
(% of GDP)Agriculture 46.5 57.3 59.9 ..Industry 12.7 10.5 8.9 ..
Manufacturing 9.5 7.8 6.5 ..Services 40.8 32.2 31.2 ..
Private consumption .. .. .. ..General government consumption .. .. .. ..Imports of goods and services 12.9 4.8 0.7 ..
1980-90 1990-00 1999 2000(average annual growth)Agriculture 0.5 5.3 11.5 ..Industry 0.5 10.0 15.8 ..
Manufacturing -0.2 7.0 14.5 ..Services 0.8 6.8 9.2 ..
Private consumption .. .. .. ..General government consumption .. .. .. ..Gross domestic investment -4.1 15.4 13.3 ..Imports of goods and services -6.8 5.2 -10.9 ..
Note: 2000 data are preliminary estimates.
* The diamonds show four key indicators in the country (in bold) compared with its income-group average. If data are missing, the diamond willbe incomplete.
0
10
20
30
95 96 97 98 99 00
GDI GDP
Growth of investment and GDP (%)
Myanmar
Low-income group
Development diamond*
Life expectancy
Access to improved water source
GNIpercapita
Grossprimary
enrollment
-60
-40
-20
0
20
40
95 96 97 98 99 00
Exports Imports
Growth of exports and imports (%)
Myanmar
Low-income group
Economic ratios*
Trade
Domesticsavings
Investment
Indebtedness
Kondo
F-20

Myanmar
PRICES and GOVERNMENT FINANCE1980 1990 1999 2000
Domestic prices(% change)Consumer prices .. 17.6 9.3 ..Implicit GDP deflator 1.2 18.5 22.7 ..
Government finance(% of GDP, includes current grants)Current revenue .. 10.0 0.2 ..Current budget balance .. 0.0 0.0 ..Overall surplus/deficit .. 0.0 0.0 ..
TRADE1980 1990 1999 2000
(US$ millions)Total exports (fob) .. 477 1,132 ..
Timber .. 161 0 ..Rice .. 28 11 ..Manufactures .. 12 .. ..
Total imports (cif) .. 970 2,539 ..Food .. 18 160 ..Fuel and energy .. .. 0 ..Capital goods .. 388 1,040 ..
Export price index (1995=100) .. 90 .. 0Import price index (1995=100) .. 87 .. 0Terms of trade (1995=100) .. 103 .. ..
BALANCE of PAYMENTS1980 1990 1999 2000
(US$ millions)Exports of goods and services 539 641 .. ..Imports of goods and services 806 1,182 2,539 ..Resource balance -266 -541 .. ..
Net income -48 -61 .. ..Net current transfers 7 77 581 545
Current account balance -307 -526 -931 -710
Financing items (net) 346 372 877 ..Changes in net reserves -39 155 54 ..
Memo:Reserves including gold (US$ millions) .. 325 343 ..Conversion rate (DEC, local/US$) .. .. .. ..
EXTERNAL DEBT and RESOURCE FLOWS1980 1990 1999 2000
(US$ millions)Total debt outstanding and disbursed 1,500 4,695 5,999 4,044
IBRD 0 0 0 0IDA 146 716 723 657
Total debt service 141 60 96 300IBRD 0 0 0 0IDA 1 9 0 0
Composition of net resource flowsOfficial grants 66 37 29 ..Official creditors 173 86 13 -162Private creditors 29 -8 -13 -66Foreign direct investment 0 161 216 ..Portfolio equity 0 0 0 ..
World Bank programCommitments 146 0 0 0Disbursements 23 57 0 0Principal repayments 0 4 0 0Net flows 23 53 0 0Interest payments 1 5 0 0Net transfers 22 48 0 0
The World Bank Group: http://www.worldbank.org/data/ 9/13/01
0
1,000
2,000
3,000
94 95 96 97 98 99 00
Exports Imports
Export and import levels (US$ mill.)
0
20
40
60
95 96 97 98 99 00
GDP deflator CPI
Inflation (%)
G: 648
D: 463
B: 657
F: 362
E: 1,914
Composition of 2000 debt (US$ mill.)
A - IBRDB - IDAC - IMF
D - Other multilateralE - BilateralF - PrivateG - Short-term
Kondo
F-21

Myanmar Social IndicatorsLatest single year Same region/income group
East
Asia & Low-1970-75 1980-85 1993-99 Pacific income
POPULATION Total population, mid-year (millions) 30.4 37.5 45.0 1,836.6 2,417.1 Growth rate (% annual average for period) 2.3 2.1 1.2 1.2 1.9Urban population (% of population) 23.9 24.0 27.3 34.5 31.4Total fertility rate (births per woman) 5.5 4.2 3.1 2.1 3.7
POVERTY(% of population)National headcount index .. .. .. .. .. Urban headcount index .. .. .. .. .. Rural headcount index .. .. .. .. ..
INCOMEGNI per capita (US$) .. .. .. 1,010 420Consumer price index (1995=100) 8 13 270 136 138Food price index (1995=100) .. 11 282 .. ..
INCOME/CONSUMPTION DISTRIBUTIONGini index .. .. .. .. ..Lowest quintile (% of income or consumption) 8.0 .. .. .. ..Highest quintile (% of income or consumption) 40.0 .. .. .. ..
SOCIAL INDICATORSPublic expenditure Health (% of GDP) .. .. 0.2 1.7 1.2 Education (% of GNI) 1.7 2.0 1.2 2.9 3.3 Social security and welfare (% of GDP) 0.6 0.9 0.1 .. ..Net primary school enrollment rate(% of age group) Total 63 .. .. 100 .. Male 65 .. .. 100 .. Female 61 .. .. 100 ..Access to an improved water source(% of population) Total .. 27 68 75 76 Urban .. 36 88 93 88 Rural .. 21 60 66 70Immunization rate(% under 12 months) Measles .. .. 85 83 64 DPT .. 16 73 82 70Child malnutrition (% under 5 years) .. 38 28 12 ..Life expectancy at birth(years) Total 51 54 60 69 59 Male 49 53 58 67 58 Female 52 56 61 71 60Mortality Infant (per 1,000 live births) 117 103 77 35 77 Under 5 (per 1,000 live births) 179 134 120 44 116 Adult (15-59) Male (per 1,000 population) .. 384 278 184 288 Female (per 1,000 population) .. 313 228 141 258 Maternal (per 100,000 live births) .. .. 230 .. ..Births attended by skilled health staff (%) .. 57 57 .. ..
Note: 0 or 0.0 means zero or less than half the unit shown. Net enrollment ratios exceeding 100 indicate discrepanciesbetween the estimates of school-age population and reported enrollment data. Latest year for access to improved watersource data is 2000.
2001 World Development Indicators CD-ROM, World Bank
Kondo
F-22

2. Sown/harvested areas and Production of paddy, 1990-91 to 1999-00 Yield
(1000 acre) (1000 ha) (1000 acre) (1000 ha) (ton/ha)1990-91 12,220 4,945 11,762 4,760 2.91991-92 11,935 4,830 11,130 4,504 2.91992-93 12,684 5,133 12,494 5,056 2.91993-94 14,021 5,674 13,558 5,487 3.01994-95 14,643 5,926 14,191 5,743 3.11995-96 15,166 6,138 14,907 6,033 2.91996-97 14,518 5,875 14,254 5,769 3.01997-98 14,294 5,785 13,364 5,408 3.01998-99 14,230 5,759 13,488 5,459 3.11999-00 15,528 6,284 15,347 6,211 3.2
Source: Myanmar Agricultural Statistics, Statistical Year Book 2000
3. Third five-years mid-term Plan (2001/2002 to 2005/2006) for Sown area and Production of paddyFiscal year 2001/2002 2002/2003 2003/2004 2004/2005 2005/2006
Sown area Production Yield Sown area Production Yield Sown area Production Yield Sown area Production Yield Sown area Production YieldState /Division (1000 ha) (1000 tons) (ton/ha) (1000 ha) (1000 tons) (ton/ha) (1000 ha) (1000 tons) (ton/ha) (1000 ha) (1000 tons) (ton/ha) (1000 ha) (1000 tons) (ton/ha)Kachin State 166.7 506.4 3.0 169.2 541.8 3.2 171.2 580.7 3.4 173.6 623.6 3.6 175.6 670.4 3.8Kayah State 30.8 81.9 2.7 31.2 85.9 2.8 31.6 92.0 2.9 32.0 97.5 3.0 32.8 106.1 3.2Kayin State 186.6 527.8 2.8 191.4 559.1 2.9 195.1 596.6 3.1 199.9 639.4 3.2 205.2 703.0 3.4Chin State 43.3 83.4 1.9 43.7 88.4 2.0 44.1 93.5 2.1 44.5 98.7 2.2 45.3 103.8 2.3Sagaing State 693.2 2,232.4 3.2 705.0 2,385.9 3.4 717.1 2,536.7 3.5 728.9 2,654.9 3.6 740.6 2,803.0 3.8Taninthayi Division 98.3 304.0 3.1 102.0 321.2 3.1 105.6 337.8 3.2 109.3 353.7 3.2 112.5 368.7 3.3Bago Division 1,089.8 3,627.7 3.3 1,108.5 3,805.4 3.4 1,129.5 3,921.7 3.5 1,151.4 4,084.8 3.5 1,173.2 4,232.1 3.6Magway Division 235.5 828.9 3.5 249.3 884.0 3.5 263.1 990.0 3.8 273.2 1,043.5 3.8 283.3 1,094.6 3.9Mandalay Division 322.1 1,280.4 4.0 331.4 1,381.3 4.2 337.1 1,427.4 4.2 343.6 1,492.0 4.3 351.7 1,570.3 4.5Mon State 327.0 1,096.5 3.4 329.0 1,175.0 3.6 333.1 1,276.7 3.8 339.5 1,424.9 4.2 342.4 1,558.0 4.6Rakhine State 387.7 1,265.7 3.3 388.9 1,339.4 3.4 390.9 1,419.8 3.6 394.6 1,507.4 3.8 399.4 1,562.6 3.9Yangon Division 585.2 2,104.3 3.6 595.7 2,240.4 3.8 605.8 2,369.9 3.9 615.9 2,541.0 4.1 629.7 2,653.0 4.2Shan State (east) 80.5 248.4 3.1 81.3 263.7 3.2 82.6 276.4 3.3 83.4 297.2 3.6 85.4 318.3 3.7Shan State (south) 152.2 452.1 3.0 153.8 465.2 3.0 155.8 475.8 3.1 157.4 492.8 3.1 159.0 513.9 3.2Shan State (north) 165.9 513.6 3.1 173.6 549.2 3.2 181.7 588.1 3.2 190.2 631.7 3.3 198.7 674.3 3.4Ayeyarwady Division 2,035.2 7,556.3 3.7 2,054.2 7,961.1 3.9 2,070.4 8,268.8 4.0 2,086.6 8,846.4 4.2 2,102.8 9,252.4 4.4Total 6,600.2 22,709.7 3.4 6,708.2 24,047.0 3.6 6,814.6 25,251.8 3.7 6,923.9 26,829.4 3.9 7,037.6 28,184.4 4.0Source : Ministry of Agriculture and Irrigation
16,80819,808
17,90817,67017,39716,391
Harvested area Sown area Production paddy(1000 ton)
13,74812,99314,60316,495
Paddy Production Results 1990 to 1999, and Plan 2001 to 2005
0
5,000
10,000
15,000
20,000
25,000
30,000
1990
-91
1992
-93
1994
-95
1996
-97
1998
-99
2001
-02
2003
-04
2004
-06
1000
tons
or 1
000
ha
0.0
0.5
1.0
1.5
2.0
2.5
3.0
3.5
4.0
4.5
ton/
ha
Sown area(1000ha)
Production(1000 ton)
Yield(ton/ha)
F-23

4. Area of crops under irrigation (Thousand acres)Total Other Other
Year Irrigated Paddy Wheat Maize Ground- Sesa- Pulses Sugar food Cotton Jute non-foodArea nut mum cane crops crops
1985-1986 3,024.1 2,119.1 44.4 5.3 14.9 280.1 80.4 17.7 269.3 66.0 111.8 15.01990-1991 2,871.1 2,147.5 43.5 9.9 8.0 174.6 77.9 21.0 269.6 34.5 67.9 16.71992-1993 3,231.1 2,365.5 52.9 12.6 9.9 185.0 98.9 18.0 317.7 52.7 102.0 16.01993-1994 4,005.9 3,307.4 48.0 8.9 10.4 145.6 79.6 17.4 277.9 36.5 56.9 17.41994-1995 4,722.4 3,933.0 52.2 15.1 11.4 176.0 102.1 17.4 293.8 29.0 73.9 18.51995-1996 5,292.2 4,365.2 42.6 13.7 13.4 264.3 102.4 15.7 313.6 42.2 99.6 19.51996-1997 4,609.8 3,793.4 42.7 12.4 15.0 142.3 114.4 14.8 326.5 52.3 75.1 20.71997-1998 4,750.0 3,847.8 44.6 22.8 26.9 147.8 147.2 14.2 343.2 53.5 67.1 34.91998-1999 5,140.5 3,937.5 57.8 16.6 42.1 285.6 192.7 15.7 428.0 61.2 75.1 28.31999-2000 (p.a.) 5,799.1 4,493.2 62.9 21.5 37.0 293.9 231.4 18.5 497.7 31.7 79.6 31.7 Source: Settlement and Land Records Department. (Statistical Yearbook 2000 Table 5.04)
5. Area by type of irrigation (Thousand acres)
Year Canals Tanks Canals TanksAcreage % Acreage % Acreage % Acreage % Acreage % Acreage % Acreage %
1985-1986 2,616 100 757 28.9 216 8.3 700 26.8 88 3.4 43 1.6 812 31.01990-1991 2,479 100 613 24.7 388 15.6 665 26.8 92 3.8 53 2.1 668 27.01992-1993 2,743 100 637 23.2 416 15.2 645 23.5 95 3.5 69 2.5 880 32.11993-1994 3,303 100 651 19.7 418 12.6 601 18.2 70 2.1 75 2.3 1,488 45.11994-1995 3,843 100 702 18.3 389 10.1 618 16.1 89 2.3 92 2.4 1,953 50.81995-1996 4,341 100 685 15.8 350 8.0 608 14.0 94 2.2 99 2.3 2,505 57.71996-1997 3,846 100 668 17.4 435 11.3 636 16.5 95 2.5 123 3.2 1,889 49.11997-1998 3,933 100 726 18.5 455 11.6 634 16.1 74 1.9 135 3.4 1,907 48.51998-1999 4,182 100 761 18.2 408 9.8 600 14.3 44 1.1 164 3.9 2,205 52.71999-2000 (p.a.) 4,550 100 806 17.7 462 10.2 611 13.4 34 0.7 199 4.4 2,438 53.6Source: Settlement and Land Records Department. (Statistical Yearbook 2000 Table 5.03)
TotalIrrigated area
Wells Other Sources Private IrrigationGovernment Irrigation
F-24

6. Utilization of fertilizers by cropCrop Unit 1985-86 1990-91 1992-93 1993-94 1994-95 1995-96 1996-97 1997-98 1998-99 1999-2000
p
Paddy MT 324,972 109,098 149,745 248,423 298,488 305,109 262,480 149,922 182,003 168,891Wheat MT 8,925 1,155 531 3,315 5,108 4 - - - -Maize MT 8,987 5,150 3,983 2,562 2,859 7 435 166 - -Millet MT 1,714 331 30 - - - - - - -Groundnut MT 15,662 2,970 888 - - 6,000 1,810 817 519 792Sesamum MT 12,925 2,753 3,697 861 1,031 7,300 2,419 1,313 2,360 1,955Oil Palm MT 1,105 214 200 - - 794 398 357 40 123Sunflower MT 9,447 2,808 158 477 862 5,300 1,849 837 1,172 1,121Cotton MT 8,469 1,667 1,276 581 913 14,751 16,077 9,324 9,825 10,454Jute MT 6,066 7,462 4,339 2,362 2,583 7,656 7,944 5,347 3,852 4,002Rubber MT 2,173 1,111 975 179 214 1,698 2,051 886 778 720Pulses MT 5,103 9,098 2,092 486 612 7,002 1,895 2,639 1,642 1,870Potato MT 1,204 - 400 - - - - - - -Tobacco MT 33 267 72 - - - - - - -Sugarcane MT 7,115 1,358 1,504 380 438 13,244 14,038 6,798 7,013 3,696Fruits and Vegetables MT 20 1,212 1,588 798 1,054 - 290 178 76 34Others MT 1,310 4,911 7,083 1,002 1,289 624 9,586 10,376 765 4,719TOTAL MT 415,108 151,565 178,561 261,426 315,451 369,489 321,272 188,960 210,045 198,377Source: Myanma Agriculture Service. (Statistical Yearbook 2000 Table 5.08)
7. Utilization of pesticides by cropCrop Unit 1985-86 1990-91 1992-93 1993-94 1994-95 1995-96 1996-97 1997-98 1998-99 1999-2000
p
Paddy pound 516,307 105,662 24,570 109,595 66,968 127,670 95,907 134,653 91,898 65,597gallon 27,472 20,232 35,871 33,724 67,845 71,568 37,064 41,038 34,459 70,962
Wheat pound 43,405 2,948 - 902 1,857 1,615 3,344 - - 220gallon 2,450 202 645 272 356 822 333 245 26 578
Maize pound 120,009 28,442 961 - 2,510 1,496 5,685 - - 2,860gallon 1,922 - 1,127 2,031 3,855 2,364 2,686 1,467 445 3,622
Groundnut pound 528,945 42,544 9,805 19,180 26,224 15,096 27,126 2,739 2,319 17,334gallon 13,198 5,930 1,439 1,218 2,404 5,163 5,543 5,794 4,523 8,802
Sesamum pound 63,089 26,195 3,080 1,417 1,760 990 2,200 - - 220gallon 711 1,460 889 865 1,978 3,682 2,933 2,763 2,356 4,000
Sunflower pound 76,300 8,664 3,076 - 1,639 660 880 - - 1,100gallon 319 300 994 547 2,460 3,381 1,967 2,368 2,222 4,989
Pulses pound 17,514 20,172 968 2,394 7,805 10,890 2,528 2,200 29,275 24,869gallon 9,605 1,549 1,668 910 5,158 12,936 5,682 9,123 10,519 23,431
Cotton pound 127,922 22,838 - - - 2,860 49,753 25,476 101,105 63,628gallon 9,927 9,358 23,735 36,634 22,882 50,175 30,633 40,454 23,946 24,088
Jute pound 7,168 638 1,184 - - - - - - -gallon 1,263 2,051 1,556 1,504 156 503 444 274 - -
Sugarcane pound 129,623 27,665 6,435 16,544 4,444 770 508 95 205 -gallon 1,471 716 222 407 - 752 476 58 152 43
Potato pound 20,100 8,400 3,590 18,792 22,480 16,892 14,120 319 93 392gallon 35 37 75 477 1,027 1,640 378 210 7 526
Fruits and Vegetables pound 14,342 6,750 1,470 7,359 12,309 9,123 4,803 1,212 306 -gallon 1,551 962 2,187 2,795 5,543 11,748 5,553 8,095 2,494 11,482
Others pound 42,624 7,546 2,050 119 3,025 4,376 1,923 1,206 389 70gallon 2,660 1,103 811 550 4,862 2,134 6,225 2,181 3,977 9,748
TOTAL pound 1,707,348 308,464 57,189 176,302 151,021 192,438 208,776 167,900 225,590 176,290gallon 72,590 43,900 71,218 81,934 118,526 166,868 99,918 114,067 85,126 162,271
Source: Myanma Agriculture Service. (Statistical Yearbook 2000 Table 5.09 )
F - 25

8. Data on Pappy Procurement by MAPT
(1) Trends of Procuremt Prices (Kyat per 100 baskets)Varieries 1985-86 1990-91 1992-93 1993-94 1994-95 1995-96 1996-97 1997-98 1998-99 1999-00 2000-01 2001-02
1/ 1/ 1/ 1/ 1/1.Ngasein 900 4,700 4,700 7,000 7,000 8,000 14,000 33,812 32,500 32,500 32,500 32,5002.Medone 940 5,000 5,000 8,500 8,500 9,500 16,000 37,875 37,500 37,500 37,500 37,5003.Emata 955 4,900 4,900 7,500 7,500 8,500 15,000 36,397 34,000 34,000 34,000 34,0004.Ngakywe 1,090 5,200 5,200 9,000 9,000 10,000 16,000 38,000 40,000 40,000 40,000 40,0005.Kauknyin 900 4,700 4,700 7,000 7,000 8,000 14,000 40,000 40,000 40,000 40,000 40,0001/ Average purchasing price for the whole Union. 1 basket of paddy = 20.86 Kg or 46 lb
Data Source : 1985-86 to 1989-99 = Statistic Year Book 2000 (Table 5.14 Prices of Selected Crops at Harvest time): 1999-2000 to 2001-2002 = Myanmar Agricultural Produce Trading.
(2) Procurement Prices according to States and Division in 2001-2002 (Kyat per 100 baskets)
1.Ngasein 35,0002.Medone 40,0003.Emata 36,0004.Ngakywe 40,0005.Kauknyin 40,0006. Special Emata (no production)
Source : Myanmar Agricultural Produce Trading.
(3) Procured Volume
YearPaddy
ProductionEquivalent
RiceRice Export Balance
(1000MT) (1000MT) (%) (MT) (MT) (MT)3/ 2/ 1/
1996 - 97 17,676.1 1,521.9 8.6% 911,925 92,200 -17,6811997 - 98 16,705.2 932.9 5.6% 558,987 15,754 -236,9731998 - 99 17,077.5 2,195.7 12.9% 1,315,637 99,244 554,7601999 - 2000 20,124.0 2,207.4 11.0% 1,322,612 57,702 579,5252000 - 2001 21,783.4 2,122.4 9.7% 1,271,724 215,493 452,421Total 93,366.2 8,980.3 9.6% 5,380,885 480,393 1,332,0521/ Milling recovery rate 0.599% 2/ Percentage in production3/ Figures are not same with the production data of MOAI.
Source : Myanmar Agricultural Produce Trading.
40,00035,000
Paddy procurement byMAPT
Distribution to thebudgetary groups
837,406
3,568,440
(MT)
30,00035,00032,00040,000
Kachin, Kayah, Kayin, Sagaing, Taninthayi,Magway, Mandalay, Mon, Shan
(deficit/self-suffiient areas)
Ayeyawady, Bago, Yangon, Rakhine
(surplus areas)
780,206661,633685,385603,810
F-26

9. Data on Paddy and Rice Prices
(1) Paddy Procurement Price of MAPTVariety Unit 1985-86 1990-91 1992-93 1993-94 1994-95 1995-96 1996-97 1997-98 1998-99 1999-00
1/ 1/ 1/1.Ngasein Kg 0.43 2.25 2.25 3.36 3.36 3.84 6.71 16.21 15.58 15.582.Medone Kg 0.45 2.40 2.40 4.07 4.07 4.55 7.67 18.16 17.98 17.983.Emata Kg 0.46 2.35 2.35 3.60 3.60 4.07 7.19 17.45 16.30 16.304.Ngakywe Kg 0.52 2.49 2.49 4.31 4.31 4.79 7.67 18.22 19.18 19.185.Kauknyin Kg 0.43 2.25 2.25 3.36 3.36 3.84 6.71 19.18 19.18 19.181/ Average purchasing price for the whole Union.
Data Source : 1985-86 to 1989-99 = Statistic Year Book 2000 (Table 5.14 Prices of Selected Crops at Harvest time): 1999-2000 to 2001-2002 = Myanmar Agricultural Produce Trading.
Note : Procurement prices in 2000-01 and 2001-2002 were same with 1999-00
(2) Average Wholesale Prices of Rice in YangonSpecification Unit 1985 1990 1992 1993 1994 1995 1996 1997 1998 1999Ngakywe 38% Kg 1.00 6.46 13.52 21.10 21.74 28.34 40.04 41.26 54.36 72.16Emata 35% Kg 0.92 5.34 9.80 17.34 16.38 23.28 26.38 27.72 38.00 51.12Ngasein 35% Kg 0.86 4.66 8.98 15.88 14.82 21.90 23.74 23.92 35.48 46.72Source: Central Statistical Organization. (Statistical Yearbook 2000 Table 11.02)Note: Up to 1985 prices of rice were controlled prices.
(3) Average Retail Prices of Rice in YangonSpecification Unit 1985 1990 1992 1993 1994 1995 1996 1997 1998 1999Ngakywe 38% Kg 3.4 6.7 14.2 21.6 22.5 31.0 36.7 41.9 54.1 75.4Emata 35% Kg 2.1 5.6 10.7 18.3 16.9 24.0 27.2 29.4 40.4 59.7Ngasein 35% Kg 1.8 4.8 10.0 17.0 15.7 22.6 25.4 27.9 37.1 50.3Source :Central Statistical Organization. (Statistical Yearbook 2000 Table 11.01)
Paddy - Rice Prices of Emata
0.010.020.030.040.050.060.070.0
1985
-86
1990
-91
1992
-93
1993
-94
1994
-95
19
95-9
6
199
6-97
199
7-98
199
8-99
1999
-00
Kya
t/kg
Paddy procurementprice of MAPT
Rice wholesale price (broken 35%)
Rice retail price (broken 35%)
F - 27
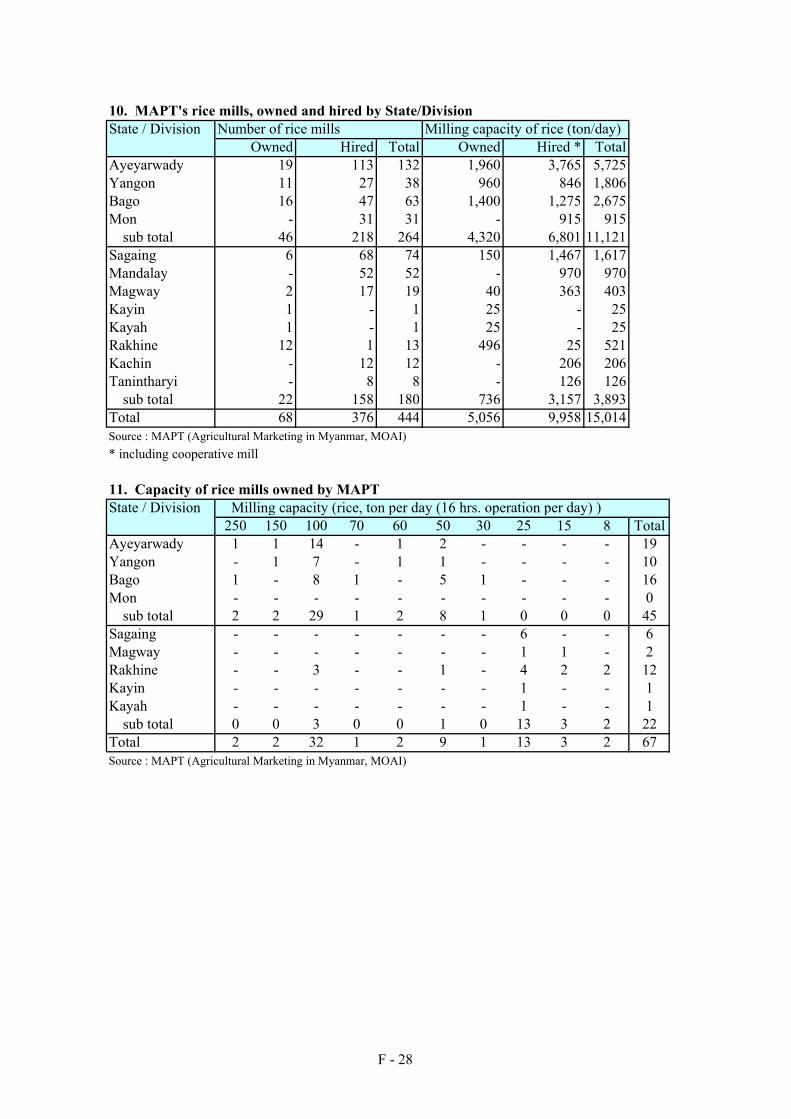
10. MAPT's rice mills, owned and hired by State/DivisionState / Division Number of rice mills Milling capacity of rice (ton/day)
Owned Hired Total Owned Hired * TotalAyeyarwady 19 113 132 1,960 3,765 5,725Yangon 11 27 38 960 846 1,806Bago 16 47 63 1,400 1,275 2,675Mon - 31 31 - 915 915
sub total 46 218 264 4,320 6,801 11,121Sagaing 6 68 74 150 1,467 1,617Mandalay - 52 52 - 970 970Magway 2 17 19 40 363 403Kayin 1 - 1 25 - 25Kayah 1 - 1 25 - 25Rakhine 12 1 13 496 25 521Kachin - 12 12 - 206 206Tanintharyi - 8 8 - 126 126
sub total 22 158 180 736 3,157 3,893Total 68 376 444 5,056 9,958 15,014Source : MAPT (Agricultural Marketing in Myanmar, MOAI)* including cooperative mill
11. Capacity of rice mills owned by MAPTState / Division Milling capacity (rice, ton per day (16 hrs. operation per day) )
250 150 100 70 60 50 30 25 15 8 TotalAyeyarwady 1 1 14 - 1 2 - - - - 19Yangon - 1 7 - 1 1 - - - - 10Bago 1 - 8 1 - 5 1 - - - 16Mon - - - - - - - - - - 0
sub total 2 2 29 1 2 8 1 0 0 0 45Sagaing - - - - - - - 6 - - 6Magway - - - - - - - 1 1 - 2Rakhine - - 3 - - 1 - 4 2 2 12Kayin - - - - - - - 1 - - 1Kayah - - - - - - - 1 - - 1
sub total 0 0 3 0 0 1 0 13 3 2 22Total 2 2 32 1 2 9 1 13 3 2 67Source : MAPT (Agricultural Marketing in Myanmar, MOAI)
F - 28

12. Regional rice balance in 1999-2000 Unit : 1000 tonsRice
State /Division Production Deficit / SurplusSeed Loss Consumption Total
Kachin State 453 17 17 391 425 28 16.8Kayah State 59 3 3 81 87 -28 -16.8Kayin State 482 19 19 457 495 -13 -7.8Chin State 77 4 4 148 156 -79 -47.4Sagaing State 1,875 67 67 1,685 1,819 56 33.6Taninthayi Division 269 10 10 415 435 -166 -99.6Bago Division 3,366 112 112 1,569 1,793 1,573 943.8Magway Division 631 26 26 1,397 1,449 -818 -490.8Mandalay Division 987 36 36 2,016 2,088 -1,101 -660.6Mon State 1,000 34 34 765 833 167 100.2Rakhine State 1,162 39 39 844 922 240 144.0Yangon Division 1,828 59 59 1,712 1,830 -2 -1.2Shan State 1,041 40 40 1,495 1,575 -534 -320.4Ayeyarwady Division 6,892 216 216 2,085 2,517 4,375 2,625.0Total 20,126 682 682 15,060 16,424 3,698 2,218.8Source : Myanmar Agricultural Service, MOAI (Agricultural Statistics)
13. Trends of paddy/rice balance by State/Division
State /Division 1996-97 1997-98 1998-99 1999-00 1996-97 1997-98 1998-99 1999-00Kachin State -75 -75 -33 28 -45 -45 -20 17Kayah State -4 -5 -49 -28 -2 -3 -29 -17Kayin State -5 -36 -33 -13 -3 -22 -20 -8Chin State -82 -84 -86 -79 -49 -50 -52 -47Sagaing State -117 -245 -605 56 -70 -147 -363 34Taninthayi Division -171 -187 -183 -166 -103 -112 -110 -100Bago Division 1,294 798 949 1,573 776 479 569 944Magway Division -778 -817 -950 -818 -467 -490 -570 -491Mandalay Division -1,037 -1,126 -1,356 -1,101 -622 -676 -814 -661Mon State 128 39 80 167 77 23 48 100Rakhine State 64 88 131 240 38 53 79 144Yangon Division -90 -276 -122 -2 -54 -166 -73 -1Shan State -537 -617 -661 -534 -322 -370 -397 -320Ayeyarwady Division 3,633 3,486 3,910 4,375 2,180 2,092 2,346 2,625Total 2223 943 992 3,698 1,334 566 595 2,219
PaddyUtilization
Paddy Rice
F - 29

14. Rice export by country of destination in 1999, 2000 & 2001 (Calendar year)1999 2000 2001
Country Net weight FOB Value Net weight FOB Value Net weight FOB Value(ton) (US$ million) (ton) (US$ million) (ton) (US$ million)
Indonesia 10,143 2.050 - - 78,180 11.784
Bangladesh 14,761 3.259 135,639 22.226 115,959 16.683
Singapore 13,488 3.039 2,990 0.512 49,979 6.441
Africa 12,603 0.378 - - 317,441 36.442
Malaysia 180 0.041 2,642 0.574 26,975 3.723
China - - - - 6,119 0.885
Saudi Arabia - - - - 200 0.033
Madagascar - - - - 13,000 1.56
Hungary 3,021 0.739 - - 415 0.067
U.S.A. - - - - 12,400 1.488
India 3,762 0.764 100 0.019 3,070 * 18.316 India Rp
Maldives 2,000 0.466 - - -
Total 59,958 10.736 141,371 23.331 623,738 79.106 US$
- - * 18.316 India Rp
15. Rice export by month in 1999, 2000 & 20011999 2000 2001
Month Net weight FOB Value Net weight FOB Value Net weight FOB Value(ton) (US$ million) (ton) (US$ million) (ton) (US$ million)
January 2,500 0.611 3,416 0.682 13,725 1.958February 1,000 0.290 4,052 0.778 37,611 5.195March 16,365 1.141 10,141 2.052 40,395 5.407April 5,968 1.431 7,999 1.413 24,817 3.697May 1,912 0.407 4,880 0.852 15,162 1.936June 7,595 1.996 3,182 0.603 6,891 2.629July 5,453 0.762 18,631 3.057 44,171 5.505August 4,535 0.921 31,022 5.123 72,022 8.384September 8,505 1.943 26,738 3.999 90,625 11.268October 896 0.187 16,688 2.452 114,495 11.381November 2,308 0.452 1,629 0.310 102,225 11.835December 2,921 0.595 12,993 2.010 61,599 9.911
Total 59,958 10.736 141,371 23.331 623,738 79.106 US$
- - 18.316 India Rp
16. Rice export by Sector/Exporter in 1999, 2000 & 2001 (Calendar Year)1999 2000 2001
Importers Net weight Net weight Net weight(ton) (ton) (ton)
Government Sector (total)
1) MAPT 59,958 141,371 623,7382) Others
Private Sector (total) 0 0 0
Total 59,958 141,371 623,738
17. Rice Export by Grade/Type of White Rice in 1998 - 2001Year 1998 1999 2000 2001 TotalTYPE (Variety) & GRADEMiller Rice Emata
Super 100% 1,900 4,605 2,642 8,480 17,627Broken 25% 84,673 41,605 114,631 546,004 786,913Broken 15% 9,419 14,730 24,149Broken 10% 4,987 4,987Broken 5% 140 140
Milled Rice Zeera 0Super 100% 1,000 1,400 200 2,600Broken 35% 508 110 618Broken 25% 1,280 1,960 14,180 17,420Broken 10% 80 80Broken 5% 100 100
Milled Rice Ngasein 0Broken 35% 3,841 9,002 8,257 21,100Broken 25% 100 1,323 20,352 21,775
Parboiled 3,900 2,000 1,806 11,325 19,031Total 91,473 59,958 141,371 623,738 916,540
18. Rice Export through Boarder Trade in 1999 - 20011999 2000 2001
MT US$ million MT US$ million MT US$ millionBangladesh Border 10,044 2.302 34,161 6.518 51,334 7.692China Boarder - - - - 4,919 0.720India Boarder - - 100 0.019 3,070 * 18.316 India RpTotal 10,044 2.302 34,261 6.537 59,323 8.412 US$
- - * 18.316 India Rp
All data obtained from MAPT on Feb. 2002
F - 30

19. Myanmar : Rice Export by country of destination, 1985-86 to 1999-2000 (Kyat million)(Quantity in thousand)
Country of Destination Unit 1985-86 1990-91 1992-93 1993-94 1994-95 1995-96 1996-97 1997-98 1998-99 1999-2000 p.a.
SOUTH EAST ASIA K 225.34 17.07 5.07 14.13 743.86 323.36 63.27 2.08 97.94 23.62Malaysia K 64.28 10.46 - - - - - - 0.09 0.49Indonesia K - - - - 717.45 204.03 15.95 - 76.89 14.88Singapore K - 6.61 5.07 12.81 26.41 0.25 17.44 2.08 20.96 8.25Cambodia K 14.65 - - - - - - - - -Philippines K - - - 1.32 - 119.08 29.88 - - -Vietnam K 146.41 - - - - - - - - -Others K - - - - - - - - - -REST OF ASIA K 204.25 81.12 92.36 63.93 107.99 54.65 28.79 35.34 28.32 14.06China K 98.10 - - - - 23.56 - - - 0.29Sri Lanka K 53.74 66.98 79.68 38.88 66.44 - - 14.61 - -India K - - - 4.33 - - - - - 3.51Maldives K 9.41 14.14 12.68 11.99 8.06 6.86 28.79 4.99 12.42 -Korea, Republic of K - - - - - - - - - -Bangladesh K 43.00 - - - 33.49 24.23 - 15.69 15.27 10.26Others K - - - 8.73 - * - 0.05 0.63 -MIDDLE EAST K - 5.49 9.46 3.63 - - 0.64 - - -Iran K - - - - - - 0.52 - - -Oman K - 5.49 8.54 - - - - - - -Others K - - 0.92 3.63 - - 0.12 - - -AMERICA K 27.78 14.59 - - 13.68 33.76 - - 0.05 -United States K - - - - 13.68 - - - - -Others K 27.78 14.59 - - - 33.76 - - 0.05 -EUROPE K 37.43 - - 7.30 11.44 - 1.98 0.09 5.13 27.26Belgium K 4.42 - - - - - - - - -Netherlands K 6.37 - - - - - 0.04 0.09 - -Yugoslavia K 6.77 - - - - - - - - -Others K 19.87 - - 7.30 11.44 - 1.94 - 5.13 27.26AFRICA K 267.99 53.89 142.32 178.67 288.82 28.03 31.10 0.20 35.35 -Sierra Leone K 4.14 - - - - - - - - -Mauritius K 15.56 - 27.04 - - 12.60 12.88 - - -Gambia K 4.06 - 0.75 - - - - - - -Ivory Coast K 4.11 - 34.51 28.42 9.95 - - - - -Guinea K - - 5.06 10.17 - - - - - -Others K 240.12 53.89 74.96 140.08 278.87 15.43 18.22 0.20 35.35 -OCEANIA K - - - - - - - - - -TOTAL K 762.79 172.16 249.21 267.66 1165.79 439.80 125.78 37.71 166.79 64.94
SOUTH EAST ASIA M.T. 182 15 4 16 635 261 47 1 66 20Malaysia M.T. 40 10 - - - - - - * *Indonesia M.T. - - - - 613 169 12 - 52 12Singapore M.T. - 5 4 14 22 * 12 1 14 8Cambodia M.T. 11 - - - - - - - - -Philippines M.T. - - - 2 - 92 23 - - -Vietnam M.T. 131 - - - - - - - - -Others M.T. - - - - - - - - - -
REST OF ASIA M.T. 149 66 75 57 99 44 20 27 20 23China M.T. 73 - - - - 18 - - - *Sri Lanka M.T. 40 56 65 35 59 - - 11 - -India M.T. - - - 4 - - - - - 6Maldives M.T. 7 10 10 10 7 6 20 4 8 -Korea, Republic of M.T. - - - - - - - - - -Bangladesh M.T. 29 - - - 33 20 - 12 11 17Others M.T. - - - 8 - * - * 1 -
MIDDLE EAST M.T. - 3 6 3 - - * - - -Iran M.T. - - - - - - * - - -Oman M.T. - 3 5 - - - - - - -Others M.T. - - 1 3 - - * - - -
AMERICA M.T. 20 10 - - 15 26 - - * -United States M.T. - - - - 15 - - - - -Others M.T. 20 10 - - - 26 - - * -
EUROPE M.T. 43 - - 11 16 - 1 * 3 12Belgium M.T. 5 - - - - - - - - -Netherlands M.T. 22 - - - - - * * - -Yugoslavia M.T. 4 - - - - - - - - -Others M.T. 12 - - 11 16 - 1 - 3 12
AFRICA M.T. 210 40 114 174 276 23 25 * 31 -Sierra Leone M.T. 3 - - - - - - - - -Mauritius M.T. 10 - 22 - - 10 10 - - -Gambia M.T. 3 - 1 - - - - - - -Ivory Coast M.T. 4 - 28 24 10 - - - - -Guinea M.T. - - 4 12 - - - - - -Others M.T. 190 40 59 138 266 13 15 * 31 -
OCEANIA M.T. - - - - - - - - - -TOTAL M.T. 604 134 199 261 1041 354 93 28 120 55
includes broken rice K = KyatSource : Statistical Year Book 2000 Table 10.04 DIRECTION OF RICE EXPORT TRADE M.T. = Metoric Ton (original data source : Myanma Agricultural Produce Trading)
F - 31
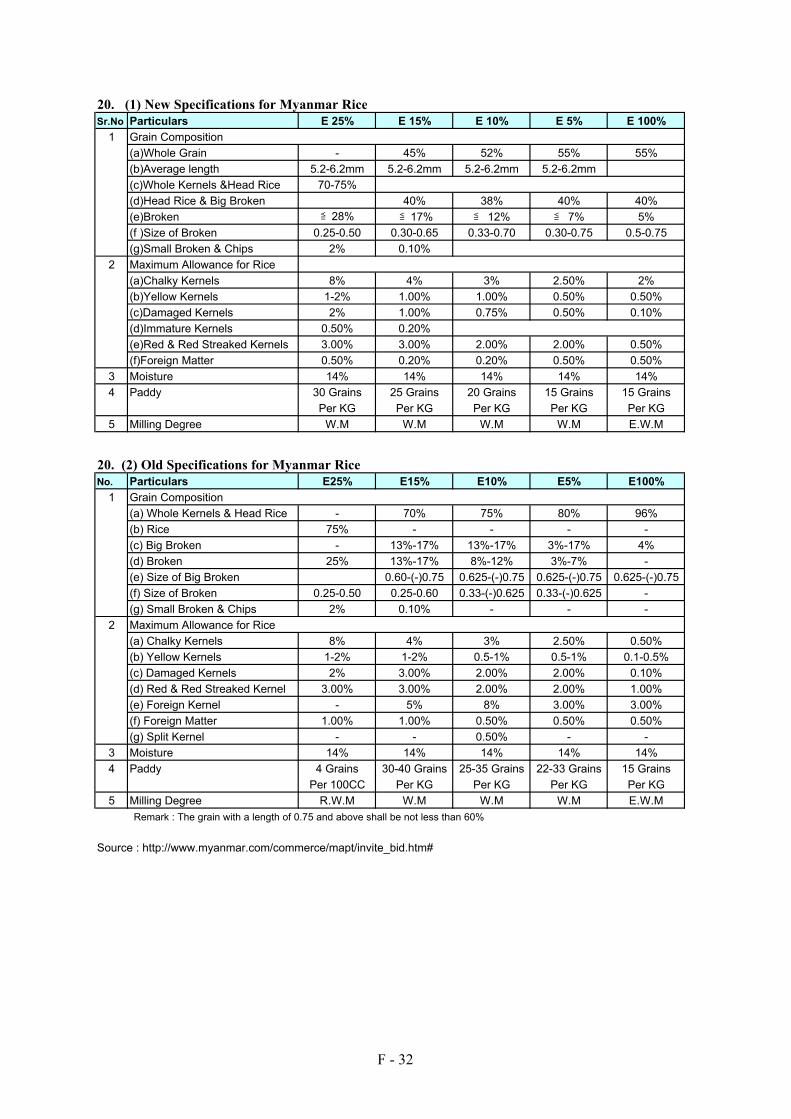
20. (1) New Specifications for Myanmar RiceSr.No Particulars E 25% E 15% E 10% E 5% E 100%
1 Grain Composition(a)Whole Grain - 45% 52% 55% 55%(b)Average length 5.2-6.2mm 5.2-6.2mm 5.2-6.2mm 5.2-6.2mm(c)Whole Kernels &Head Rice 70-75%(d)Head Rice & Big Broken 40% 38% 40% 40%(e)Broken ≦28% ≦17% ≦ 12% ≦ 7% 5%(f )Size of Broken 0.25-0.50 0.30-0.65 0.33-0.70 0.30-0.75 0.5-0.75(g)Small Broken & Chips 2% 0.10%
2 Maximum Allowance for Rice(a)Chalky Kernels 8% 4% 3% 2.50% 2%(b)Yellow Kernels 1-2% 1.00% 1.00% 0.50% 0.50%(c)Damaged Kernels 2% 1.00% 0.75% 0.50% 0.10%(d)Immature Kernels 0.50% 0.20%(e)Red & Red Streaked Kernels 3.00% 3.00% 2.00% 2.00% 0.50%(f)Foreign Matter 0.50% 0.20% 0.20% 0.50% 0.50%
3 Moisture 14% 14% 14% 14% 14%4 Paddy 30 Grains 25 Grains 20 Grains 15 Grains 15 Grains
Per KG Per KG Per KG Per KG Per KG5 Milling Degree W.M W.M W.M W.M E.W.M
20. (2) Old Specifications for Myanmar RiceSrNo. Particulars E25% E15% E10% E5% E100%
1 Grain Composition(a) Whole Kernels & Head Rice - 70% 75% 80% 96%(b) Rice 75% - - - -(c) Big Broken - 13%-17% 13%-17% 3%-17% 4%(d) Broken 25% 13%-17% 8%-12% 3%-7% -(e) Size of Big Broken 0.60-(-)0.75 0.625-(-)0.75 0.625-(-)0.75 0.625-(-)0.75(f) Size of Broken 0.25-0.50 0.25-0.60 0.33-(-)0.625 0.33-(-)0.625 -(g) Small Broken & Chips 2% 0.10% - - -
2 Maximum Allowance for Rice(a) Chalky Kernels 8% 4% 3% 2.50% 0.50%(b) Yellow Kernels 1-2% 1-2% 0.5-1% 0.5-1% 0.1-0.5%(c) Damaged Kernels 2% 3.00% 2.00% 2.00% 0.10%(d) Red & Red Streaked Kernel 3.00% 3.00% 2.00% 2.00% 1.00%(e) Foreign Kernel - 5% 8% 3.00% 3.00%(f) Foreign Matter 1.00% 1.00% 0.50% 0.50% 0.50%(g) Split Kernel - - 0.50% - -
3 Moisture 14% 14% 14% 14% 14%4 Paddy 4 Grains 30-40 Grains 25-35 Grains 22-33 Grains 15 Grains
Per 100CC Per KG Per KG Per KG Per KG5 Milling Degree R.W.M W.M W.M W.M E.W.M
Remark : The grain with a length of 0.75 and above shall be not less than 60%
Source : http://www.myanmar.com/commerce/mapt/invite_bid.htm#
F - 32

21. Per capita consumption of rice in 1997 Unit : KG
Urban Rural Urban RuralUnion 11.2 13.2 134.2 158.5States & Division 12.5 15.0 149.5 180.2
Kachin State 11.7 14.8 140.3 177.1Kayah State 13.4 14.9 160.3 178.9Kayin State 10.9 14.0 130.6 167.4Chin State 12.3 11.2 147.7 134.4Sagaing Division 12.5 15.7 149.8 188.1Tanintharyi Division 11.8 15.8 141.9 189.1Bago Division 11.0 15.6 131.6 187.1Magway Division 14.2 14.4 170.7 172.3Mandalay Division 12.3 14.3 147.7 172.0Mon State 14.1 16.1 169.0 193.7Rakhine State 14.6 18.3 175.3 219.8Yangon State 11.8 15.6 141.1 186.8Shan State 10.8 14.7 129.6 175.9Ayeyarwady Division 13.1 15.0 157.4 179.4
Yangon City 11.5 138.3Mandalay City 13.0 155.9Source : Household Income and Expenditure Survey (1997)
Month Annum
F - 33

Kondo
F-34
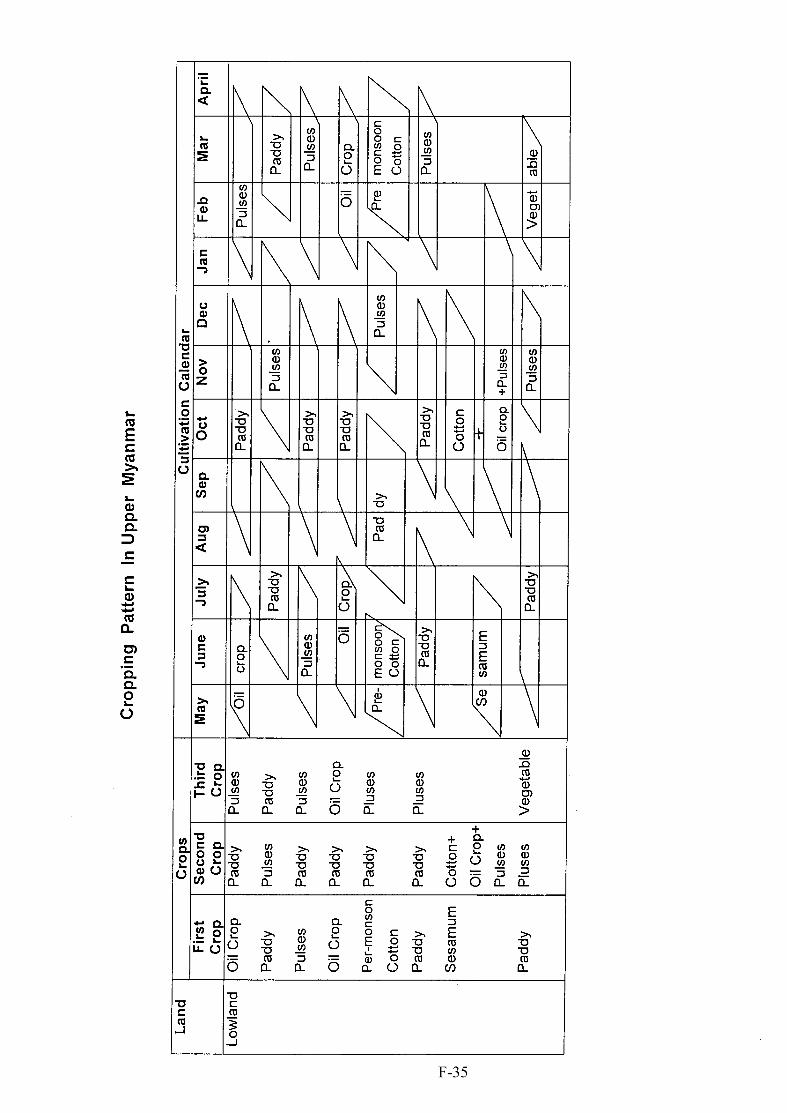
Kondo
F-35
Kondo
F-35

Kondo
F-36

COUNTRY REPORT
Philippines

Country Report : Philippines
G - 1
1. Rice Production
1.1 Basic Information on Rice Production
(1) Production of Rice
The following tables show the basic statistics on agriculture/ rice production in Philippines.
Agricultural Production (MT)1996 1997 1998 1999 2000P
Crops 69,128,500 68,301,400 57,931,500 68,124,600 68,112,100 Cereals 15,434,900 15,601,400 12,378,000 16,371,200 16,900,500 Paddy 11,283,600 11,269,000 8,554,800 11,786,600 12,389,400 Corn 4,151,300 4,332,400 3,823,200 4,584,600 4,511,100Source: Selected Statistics on Agriculture, June 2001 P- Preliminary
Paddy Production by Type and Half-term (MT)1996R 1997R 1998R 1999R 2000P
TOTAL 11,280,000 11,270,000 8,550,000 11,790,000 12,390,000Irrigated 8,230,000 8,480,000 6,680,000 8,920,000 9,410,000Rain-fed 3,050,000 2,790,000 1,870,000 2,870,000 2,980,000
JANUARY-JUNE 4,950,000 4,840,000 3,550,000 5,270,000 5,440,000Irrigated 3,980,000 3,960,000 3,140,000 4,330,000 4,510,000Rain-fed 970,000 880,000 410,000 940,000 930,000
JULY-DECEMBER 6,330,000 6,420,000 5,000,000 6,520,000 6,950,000Irrigated 4,250,000 4,520,000 3,540,000 4,590,000 4,900,000Rain-fed 2,080,000 1,910,000 1,460,000 1,930,000 2,050,000
Source: Selected Statistics on Agriculture, June 2001 R- Revised
Paddy Area by Type and Half-term (ha)1996R 1997R 1998R 1999R 2000P
TOTAL 3,950,000 3,840,000 3,170,000 3,990,000 4,040,000Irrigated 2,480,000 2,500,000 2,180,000 2,660,000 2,710,000Rain-fed 1,470,000 1,340,000 990,000 1,330,000 1,330,000
JANUARY-JUNE 1,660,000 1,620,000 1,280,000 1,740,000 1,740,000Irrigated 1,160,000 1,150,000 1,000,000 1,270,000 1,270,000Rain-fed 50,000 47,000 28,000 47,000 47,000
JULY-DECEMBER 2,290,000 2,220,000 1,890,000 2,250,000 2,230,000Irrigated 1,320,000 1,350,000 1,180,000 1,390,000 1,440,000Rain-fed 970,000 87,000 71,000 86,000 86,000
Source: Selected Statistics on Agriculture, June 2001
Paddy Yield by Type and Half-term 1/ (MT/ ha)1996R 1997R 1998R 1999R 2000P
TOTAL 2.86 2.93 2.70 2.95 3.07Irrigated 3.31 3.39 3.06 3.35 3.48Rain-fed 2.08 2.08 1.90 2.15 2.23
JANUARY-JUNE 2.97 2.98 2.77 3.02 3.13Irrigated 3.42 3.45 3.15 3.41 3.56Rain-fed 1.93 1.86 1.46 2.00 1.98
JULY-DECEMBER 2.77 2.90 2.65 2.89 3.02Irrigated 3.22 3.35 2.99 3.29 3.41Rain-fed 2.16 2.19 2.07 2.23 2.37
Source: Selected Statistics on Agriculture, June 20011/ Yield per hectare derived prior to rounding off figure on productionR- Revised due to change in MRR from 65.4% to 65.0% and update on import data

Country Report : Philippines
G - 2
(2) Land UseLand Classification (ha)
1999 2000Land classification 30,000,000 30,000,000Alienable and disposable 14,145,027 14,145,078Forest land 15,854,973 15,854,922 Classified 14,765,804 14,765,804 Unclassified 1,089,169 1,089,118
Source: 2001 Philippine Statistical yearbook
Philippines has approximately 4.0 million ha of rice-lands, with an average yield of 3.0 MT per haper crop.
Agricultural Crop Area (‘000 ha)1996 1997 1998 1999 2000P
Harvested area 13,015.6 13,024.7 11,664.6 13,074.4 12,891.6Cereals 6,686.8 6,568.2 5,524.2 6,642.0 6,548.4
Paddy 3,951.1 3,842.3 3,170.0 3,999.8 4,038.1Corn 2,735.7 2,725.9 2,354.2 2,642.2 2,510.3
Major crops 5,133.7 5,269.8 5,476.1 5,888.2 5,858.7Other crops 1,195.1 1,186.7 664.3 544.2 484.5Source: Selected Statistics on Agriculture, June 2001P- Preliminary, except for paddy and corn
(3) Number of Farm household
No statistics on number of farm house hold. It is said that a large number of landless farmers workfor land owners as agricultural laborers.
(4) Agricultural Population
In 2000, the country’s population stood at 76.5 million. About 40% of them were dependent onagriculture for their livelihood. The agriculture employed an average of 10.9 million in the last 10years. Agricultural employment was decreasing, although slow at the rate of 0.05%. It shares to totalemployment was likewise going down, from about 45% in the early 90s, the sector’s share droppedto 37% in 2000.
Population (Million persons)1996 1997 1998R 1999R 2000P
Philippines 69.95 71.55 73.15 74.74 76.50 Male 35.25 36.05 36.85 37.65 ----- Female 34.70 35.50 36.30 37.09 -----Employment inAgriculture
11.64 11.31 10.93 10.77 10.18
Source: Selected Statistics on Agriculture, June 2001
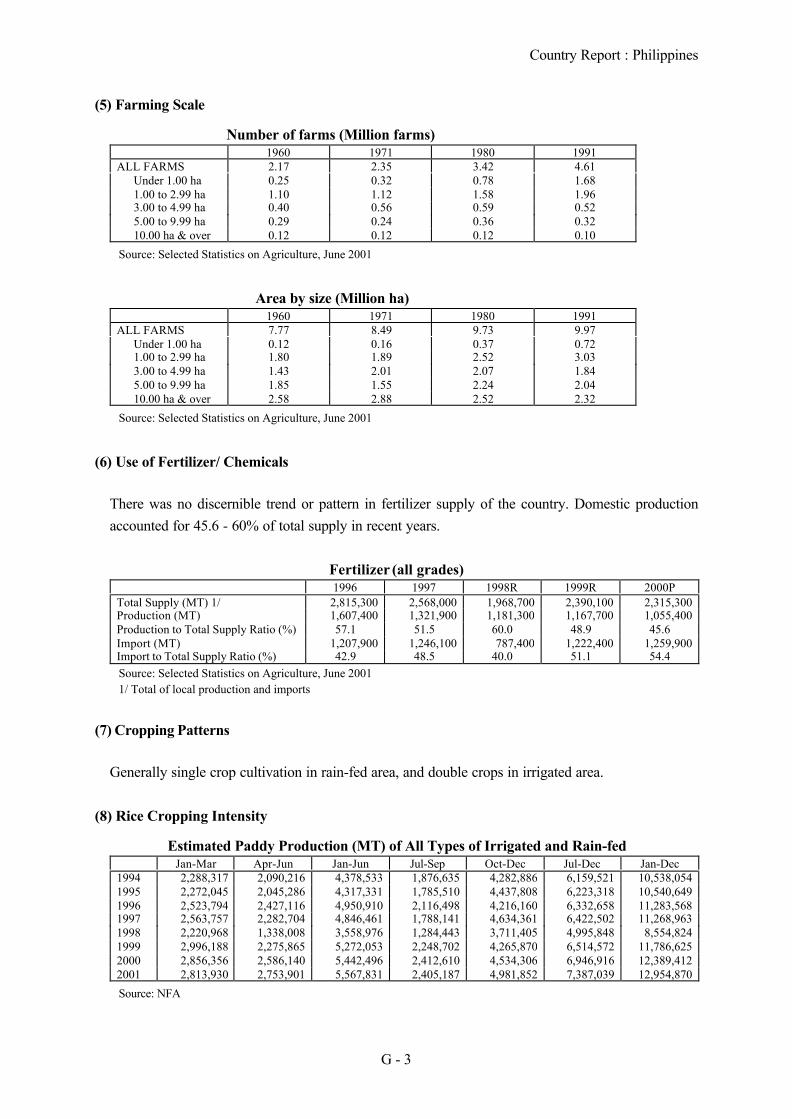
Country Report : Philippines
G - 3
(5) Farming Scale
Number of farms (Million farms)1960 1971 1980 1991
ALL FARMS 2.17 2.35 3.42 4.61Under 1.00 ha 0.25 0.32 0.78 1.681.00 to 2.99 ha 1.10 1.12 1.58 1.963.00 to 4.99 ha 0.40 0.56 0.59 0.525.00 to 9.99 ha 0.29 0.24 0.36 0.3210.00 ha & over 0.12 0.12 0.12 0.10
Source: Selected Statistics on Agriculture, June 2001
Area by size (Million ha)1960 1971 1980 1991
ALL FARMS 7.77 8.49 9.73 9.97Under 1.00 ha 0.12 0.16 0.37 0.721.00 to 2.99 ha 1.80 1.89 2.52 3.033.00 to 4.99 ha 1.43 2.01 2.07 1.845.00 to 9.99 ha 1.85 1.55 2.24 2.0410.00 ha & over 2.58 2.88 2.52 2.32
Source: Selected Statistics on Agriculture, June 2001
(6) Use of Fertilizer/ Chemicals
There was no discernible trend or pattern in fertilizer supply of the country. Domestic productionaccounted for 45.6 - 60% of total supply in recent years.
Fertilizer (all grades)1996 1997 1998R 1999R 2000P
Total Supply (MT) 1/ 2,815,300 2,568,000 1,968,700 2,390,100 2,315,300Production (MT) 1,607,400 1,321,900 1,181,300 1,167,700 1,055,400Production to Total Supply Ratio (%) 57.1 51.5 60.0 48.9 45.6Import (MT) 1,207,900 1,246,100 787,400 1,222,400 1,259,900Import to Total Supply Ratio (%) 42.9 48.5 40.0 51.1 54.4Source: Selected Statistics on Agriculture, June 20011/ Total of local production and imports
(7) Cropping Patterns
Generally single crop cultivation in rain-fed area, and double crops in irrigated area.
(8) Rice Cropping Intensity
Estimated Paddy Production (MT) of All Types of Irrigated and Rain-fedJan-Mar Apr-Jun Jan-Jun Jul-Sep Oct-Dec Jul-Dec Jan-Dec
1994 2,288,317 2,090,216 4,378,533 1,876,635 4,282,886 6,159,521 10,538,0541995 2,272,045 2,045,286 4,317,331 1,785,510 4,437,808 6,223,318 10,540,6491996 2,523,794 2,427,116 4,950,910 2,116,498 4,216,160 6,332,658 11,283,5681997 2,563,757 2,282,704 4,846,461 1,788,141 4,634,361 6,422,502 11,268,9631998 2,220,968 1,338,008 3,558,976 1,284,443 3,711,405 4,995,848 8,554,8241999 2,996,188 2,275,865 5,272,053 2,248,702 4,265,870 6,514,572 11,786,6252000 2,856,356 2,586,140 5,442,496 2,412,610 4,534,306 6,946,916 12,389,4122001 2,813,930 2,753,901 5,567,831 2,405,187 4,981,852 7,387,039 12,954,870
Source: NFA

Country Report : Philippines
G - 4
Paddy harvest quantity relatively averaged in the year round for an agricultural product as per 22%during Jan.~Mar., 21% during Apr.~Jun., 19% during Jul.~Sep., 38% during Oct.~Dec. in 2001 as aquarterly base because of various types of cultivation locally.
Estimated Paddy Area harvested (ha) of All Types of Irrigated and Rain-fedJan-Mar Apr-Jun Jan-Jun Jul-Sep Oct-Dec Jul-Dec Jan-Dec
1994 851,510 631,820 1,483,330 674,000 1,494,200 2,168,200 3,651,5301995 856,561 644,847 1,501,408 636,695 1,620,588 2,257,283 3,758,6911996 913,607 752,876 1,666,483 768,295 1,516,358 2,284,653 3,951,1361997 919,289 704,952 1,624,241 625,002 1,593,027 2,218,029 3,842,2701998 834,414 448,783 1,283,197 446,723 1,440,122 1,886,845 3,170,0421999 1,016,030 726,996 1,743,026 808,719 1,448,094 2,256,813 3,999,8392000 971,294 766,329 1,737,623 797,624 1,502,838 2,300,462 4,038,0852001 932,225 796,871 1,729,096 779,519 1,556,826 2,336,345 4,065,441
Source: NFA
(9) Farmers Organization
Cooperative Development Incentive Fund is designed to enhance farmers’ productivity andmarketing of their produce by giving monetary incentives to farmers who sell their produce to NFA.But the present organization ratio of farmers is not reported so far.
Post-Harvest Facility Services by NFA is to provide farmers with priority access to post-harvestfacilities at reasonable service rates.
(10) Production Costs
Average Costs and Returns of Paddy Production (Peso/ha)All Types Irrigated Non-Irrigated
Gross Returns 25,853 29,214 18,710Cash Cost 9,132 10,362 6,301Non-Cash Cost 5615 7,097 2,200Imputed Cost 6,987 7,401 6,106Total Cost 21,733 24,861 14,606Net Returns 4,119 4,353 4,104Net Profit Cost Ratio 0.19 0.18 0.28
Source: Selected Statistics on Agriculture, June 2001 (data for year 2000 Crop)
The both prices of farmers-gate and consumer are comparatively higher than in other ASEANcountries. Consequently, domestic rice production in future may come across less competitivenessin price.
(11) Subsidy/ loan (Production promotion)
The government promotes to increase rice production through the activities by NFA. The mostimportant system is paddy procurement program by NFA for individual and organized farmers atsupport prices, and Local Food Security Program provides production loan (max. P14,000/ ha) in
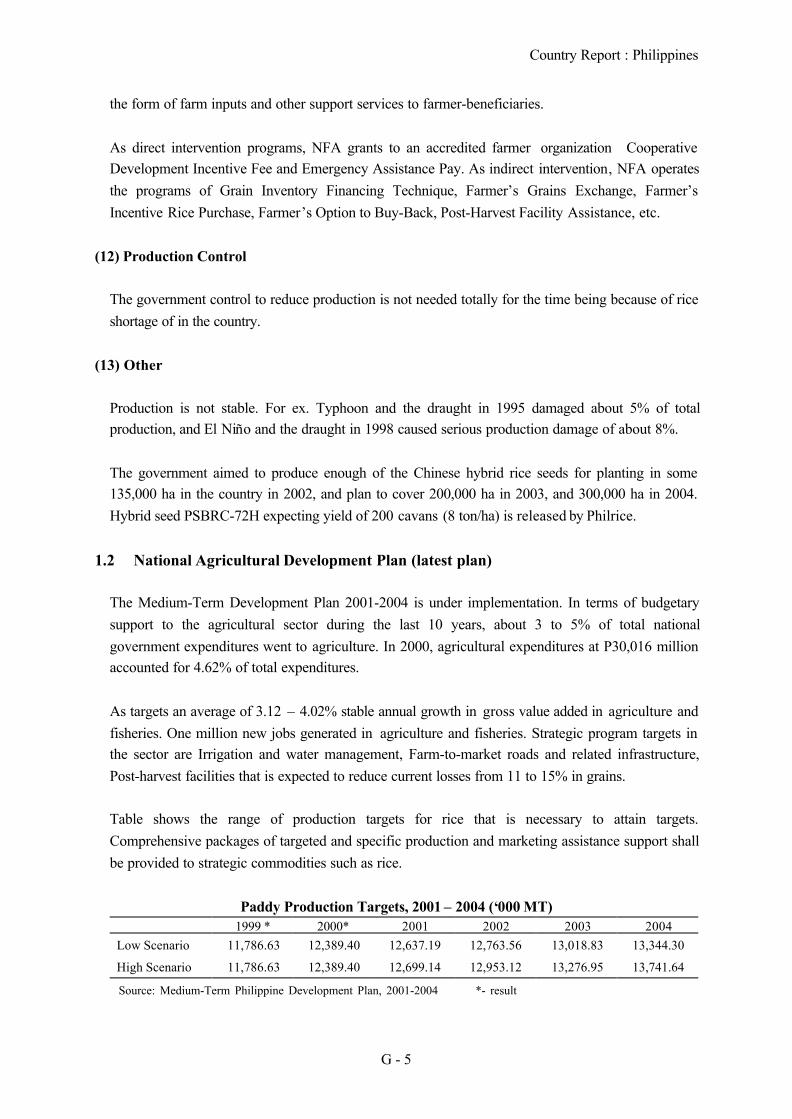
Country Report : Philippines
G - 5
the form of farm inputs and other support services to farmer-beneficiaries.
As direct intervention programs, NFA grants to an accredited farmer organization CooperativeDevelopment Incentive Fee and Emergency Assistance Pay. As indirect intervention, NFA operatesthe programs of Grain Inventory Financing Technique, Farmer’s Grains Exchange, Farmer’sIncentive Rice Purchase, Farmer’s Option to Buy-Back, Post-Harvest Facility Assistance, etc.
(12) Production Control
The government control to reduce production is not needed totally for the time being because of riceshortage of in the country.
(13) Other
Production is not stable. For ex. Typhoon and the draught in 1995 damaged about 5% of totalproduction, and El Niño and the draught in 1998 caused serious production damage of about 8%.
The government aimed to produce enough of the Chinese hybrid rice seeds for planting in some135,000 ha in the country in 2002, and plan to cover 200,000 ha in 2003, and 300,000 ha in 2004.Hybrid seed PSBRC-72H expecting yield of 200 cavans (8 ton/ha) is released by Philrice.
1.2 National Agricultural Development Plan (latest plan)
The Medium-Term Development Plan 2001-2004 is under implementation. In terms of budgetarysupport to the agricultural sector during the last 10 years, about 3 to 5% of total nationalgovernment expenditures went to agriculture. In 2000, agricultural expenditures at P30,016 millionaccounted for 4.62% of total expenditures.
As targets an average of 3.12 – 4.02% stable annual growth in gross value added in agriculture andfisheries. One million new jobs generated in agriculture and fisheries. Strategic program targets inthe sector are Irrigation and water management, Farm-to-market roads and related infrastructure,Post-harvest facilities that is expected to reduce current losses from 11 to 15% in grains.
Table shows the range of production targets for rice that is necessary to attain targets.Comprehensive packages of targeted and specific production and marketing assistance support shallbe provided to strategic commodities such as rice.
Paddy Production Targets, 2001 – 2004 (‘000 MT)1999 * 2000* 2001 2002 2003 2004
Low Scenario 11,786.63 12,389.40 12,637.19 12,763.56 13,018.83 13,344.30
High Scenario 11,786.63 12,389.40 12,699.14 12,953.12 13,276.95 13,741.64
Source: Medium-Term Philippine Development Plan, 2001-2004 *- result

Country Report : Philippines
G - 6
2. Rice Marketing
2.1 Marketing Channels
The stakeholders concern many steps of rice marketing from farmers as a producer to consumers.Modernization of marketing channels is not developed well. This probably causes a retail pricerather expensive. General channels of rice marketing from farmers to the consumers are stated asbelow;
Farmers↓
Assembly traders or agentsThese are the traders who deal directly with the farmers who are specially located at “barangays” farfrom milling areas.↓
Paddy buying stationsThese are also called “paddy traders” as this group do not have mills to process the paddy, but onlysell paddy. Their investment is more on warehousing and transportation facilities.↓
Rice millsThey are classified as custom and commercial millers. (a) Custom millers operate with a single passmilling equipment to process the rice requirement of farmers and small traders. Milling fees areeither paid in kind or cash with the bran taken by the client. (b) Commercial millers have biggercapital for procurement and a sizeable amount of fixed assets such as warehouse, multi-pass millingequipment and big trucks. Traders, rather than individual farmers comprise the bulk of their sourceof paddy.↓
HaulersHaulers transport the rice from different provinces to the town center or city where rice is traded.↓
WholesalerThese are licensed wholesalers or so-called “rice traders” as they only buy and sell rice at thedemand areas. Their investments are similar to the paddy traders.↓
Wholesalers/ RetailersThis group transacts business on a medium scale that is licensed for wholesale operation. They dealton per bag sale rather than on a per kilogram basis.↓
RetailersThis is the retail store in the markets. They can easily identified with their rice boxes andcorresponding price tags.

Country Report : Philippines
G - 7
2.2 Trade Flows
Distribution channels for NFA (imported) rice are illustrated below;
Source: Agricultural Marketing Services Statistics Analysis Division, BAS
2.3 Rice Milling
Majority of commercial rice mills are still equipped with obsolete machines. And custom-millsgenerally operate “one-pass type” milling machine. Standard recovery shows 63% for well milling,and 65% for regular milling from paddy on the basis of 97% purity and 14% MC .
2.4 Transport
Domestic transportation means are normally by truck. It costs 20 P/bag(50 kg) for the distance of300 km from Nueva Ecija to Manila.
2.5 Storage
Storage covers management of storage facility, warehouses constructed by NFA and equipped withbasic administrative and post harvest facilities for farmers/ farmers’ organizations that commit tosell paddy to the agency. The warehouses are designed to provide local farmers with solar dryingpavement to serve not only as storage but also as food security deport.
Stocks shall be positioned in provinces susceptible to emergencies and isolation. They arepositioned in the 80 provincial and 14 regional offices.
The Municipal Level Grains Center is 2,500 bag capacity warehouse with a 120 m2 solar dryingpavement designed to save as food security deports of selected municipalities.
NFA SUPPLIER(100%)
MILLER / WHOLESALER
WHOLE SALER
WHOLESALER /RETAILER
RETAILER
CONSUMER(100%)
91%
8%
83%
8%
8%
86%
14%
2%

Country Report : Philippines
G - 8
2.6 Marketing Costs & Margins
Rice Traders Association estimates the marketing margins as 0.5-1.0 Peso/kg for assembly trader oragent, max.0.5 Peso/kg for paddy buying station, 2% or 90 Peso/bag(50 kg) for miller, 3-30Peso/bag for wholesaler, 50-100 Peso/bag for retailer.
2.7 Characteristics of Marketing Agencies
Monitoring and enforcing of rules and regulations governing grains business. Licensing andregistration of all grains businessmen for the purpose of acquiring industry information andensuring rationalized development of grains business harmonious and productive interrelationshipamong grains industry stakeholders to achieve institutional efficiency and growth.
Licensed Grains Business per Line of ActivityBusiness Type No. of Registered and Licensed
Retailing 76,286Wholesaling 3,589Retailing/wholesaling 11,365Milling 10,444Warehousing 10,622Threshing 1,111Shelling 329Mechanical Drying 471Transporting 5,051Others 2,226Total 121,494
(As of December 31, 2000)Source: BDPD-Statistics, Corporate Profile, NFA
Informal imports of rice mainly from Vietnam are not recorded though it might be a substantial bigamount. Recently the incident of 10,000 MT was exposed in Luson.
2.8 Outline of Traders’ Association
Rice traders’ association was established in 1950. About 5,800 members presently register to theassociation out of about 11,000 that resister to NFA as rice millers and traders. It has activities inissuing position papers of the sector to the government and public. Recent papers insists on theopposition of rice trade liberalization, ex. The abolition of quantity restriction and abolition of theimport control by NFA. And it also requires special low rate of electricity for rice mills, andconsistent rice policy.
2.9 Rice Procurement and Distribution by Government (police/ army)
The government through NFA operates rice procurement and distribution system with support prices.The below table shows monthly paddy procurement by NAF from 1997 to 2001. It resulted in4.8%(1999)-5.4%(2000) against country production.

Country Report : Philippines
G - 9
NFA Monthly Total Paddy Procurement, 1997-2001 (MT)1997 1998 1999 2000 2001
January 15,531 2,908 6,789 22,522 35,817February 1,459 466 8,850 7,257 16,404March 348 1,352 16,373 24,595 38,396April 735 1,753 43,821 76,828 69,655May 2,340 337 58,857 100,807 79,112June 1,078 92 36,318 56,969 28,471July 35 29 16,085 7,795 6,993August - 8 21,921 15,794 6,285September 207 356 28,208 24,202 8,711October 10,046 9,355 84,382 90,271 44,390November 46,352 23,200 132,600 140,549 90,943December 22,496 21,852 106,299 95,737 52,264
Total 100,627 61,708 560,503 663,326 477,441
Source: NFA
Executive Order No.51 directs all government agencies/ bureaus/ units to purchase their employees’rice from NFA. The table shows NFA rice distribution by month.
NFA Monthly Total Rice Distribution, 1995-2000 (MT)1995 1996 1997 1998 1999 2000
January 3,870 30,283 10,852 38,369 114,228 106,272February 4,475 59,321 18,590 43,694 137,621 60,559March 6,589 70,448 24,194 58,019 122,044 94,914April 4,223 60,877 17,353 106,809 74,301 58,091May 5,805 69,374 23,528 185,974 64,568 73,077June 4,161 84,417 63,505 191,109 106,325 94,143Jan.- June 29,123 374,720 158,022 623,974 619,087 487,056
July 7,072 132,106 141,956 247,078 133,306 126,065August 63,041 119,321 144,320 245,290 177,199 150,396September 66,368 62,017 91,446 190,698 101,916 145,586October 59,060 20,911 43,089 123,972 94,210 105,129November 20,033 13,234 22,142 97,315 99,296 74,479December 11,988 10,597 21,809 98,416 147,315 68,025Jul.– Dec. 227,562 358,186 464,762 1,002,769 753,242 674,680
Total 256,685 732,906 622,784 1,626,743 1,372,329 1,161,736
Source: NFA
2.10 Roles of concern Administrative Government Agencies
National Food Authority (NFA) was created as National Grains Authority through PresidentialDecree No.4 on September 26. 1972. On January 14, 1981, NGA was transformed into NFA thoughPresidential Decree No.1770. In 1986 NFA was reorganized, and efforts were geared towardsachieving four missions; namely stabilization, marketing development, industry regulation andcorporate administration.
NFA acts as the sole agency of the government support price, and is the custodian of a governmentrice buffer stock for food security and stabilization purposes. For procurement system, NFAmandate by the government to undertake domestic paddy procurement for food security and price/supply stabilization purposes. Distribution program involves selling rice direct to institutional or

Country Report : Philippines
G - 10
individual consumers or indirectly though licensed and accredited retailers. Under the helm of NFA,rolling stores are being deployed nationwide to distribute/ sell reasonably priced rice and other basiccommodities to depressed areas.
2.11 Rice Quality Inspection/ Standard
NFA implements National Grains Standards throughout the country through continuing advocacycampaigns particularly among farmers, retailers, grains businessmen and consumers on grainsquality, weighing and packaging.
The Consumers Act of Philippines mandated to establish and enforce the national grainsstandards(Primer on Philippine Grains Standardization Program, 1998). National Grains Standardstakes full effect starting January 1, 1998. The grain commodities initially covered by the NationalGrains Standards for Rice and Corn as mandated by NFA Letter Circular No.AO-97-08-001, arepaddy, milled rice, shelled corn and corn grits. Philippine Grains Standardization Program (PGSP)officially launched in May 1996.
2.12 Market Information System
To be able to serve the information needs of marketing participants, the Bureau of AgriculturalStatistics (BAS) by virtue of Republic Act 4148 implemented in 1968 the Agricultural MarketingNews Service (AMNEWSS). For years, the implementers have followed the procedures forcollecting, processing, analyzing and disseminating agricultural marketing information as specifiedby AMNEWSS.
In the early 1990s, BAS has formulated an improvement in the delivery of the information servicethrough Agricultural Marketing Information System (AGMARIS). AGMARIS provides themechanism that addresses limitations of AMNEWSS. The design will balance the information needsof farmers, agribusiness community and the consumers with the statistical requirements forgovernment policy makers as responsiveness required to adopt the changes in the marketingenvironment.
2.13 Other
NFA operates Special Marketing Programs in the activities as follows;
- Executive Order No.51 directs all government agencies/ bureaus/units to purchase theiremployees’ rice requirement from NFA.
- Executive Order No.88 grants rice allowance to soldiers on combat duty in Mindanao.- Grains Exchange Program (PHI5478), the Australian government through AUSAID donated to
Philippines 122,270 bags of Australian rice, with DILG as project beneficiary. To cover morebeneficiaries, Australian rice is being swapped with NFA rice at a ratio of 1 bag of Australian

Country Report : Philippines
G - 11
rice to 1.3 bags of NFA rice.- Street and Urban Working Project is a project where NFA sells rice DILG for the street children.- Enhanced Retail Access Program.- Rolling Stores, NFA rolling/ mobile stores carrying basic food commodities are fielded in areas
without Sari-Sari Stores and/ or when the need arises.- Palengkeng Bayan, it is a retail store carrying basic food commodities, located inside public/
private markets in cities, towns or urban areas, which is operated by either Bigasang BayanOperator or Grains Retailer.
- Sari-Sari Stores, these retail stores carry/ basic food commodities, located in depressed/ remotebarangays, which is operated by barangay entrepreneur, FO of LGU.
- Tinda Bangka, it is NFA motor boat carrying basic food commodities, which is deployed inareas along seashores and river banks.
- NFA-Operated SSS, this is NFA-owned stationary retail store carrying basic food commodities.
3. Rice Price Policy
3.1 Price Policy & Government Price Control System
(1) Price Policy
NFA is mandated to ensure food security during emergencies/ calamities and provide the nationwith adequate and continuous food supply at a stabilized price.
The pricing policy for rice of the government is designed to specifically protect both farmers andconsumers. The government support price for paddy is one of the main marketing supportmechanisms implemented by the government through NFA grains procurement program. It speciallyaims to safeguard farmers from several price fluctuations. In setting the government support price,an Inter-Agency Committee on Rice and Corn (IACRC) conducts a quarterly study and evaluationof the demand, supply and appropriateness of the existing government price considering thefollowing factors:
- Cost of production- Consumer price index and inflation rate- Domestic/ world market situation- Government capability to implement
(2) Price Mechanism
The government employs basic strategies in attaining the objective of stabilization by means ofprice support, buffer stock and procurement and distribution.
Pricing policy for rice of the government is designed to specifically protect both farmers and

Country Report : Philippines
G - 12
consumers. In stabilizing the supply and price of rice, the government aims to keep farm gate pricesat levels that provide reasonable returns and at the same time maintain consumer prices withinaffordable levels. This means ensuring farm-gate price levels that enable farmers to derivereasonable returns (21%/1998) on their production investment on the one hand, and ensuringreasonable prices for consumers on the order.
The government is constrained to implement a two-tiered pricing scheme in the procurement ofpaddy. This is in accordance with the terms and conditions of the Grain Sector DevelopmentProgram under ADB loan.
Grains Sector Development Program, the government signed a Memorandum of Understandingwith ADB, on policy and institutional changes which are largely grains marketing- related, inexchange for $175 million loan to finance largely production-related technology. Among thechanges called for by the loan is for NFA: to peg its procurement price at current levels and eliminatecash incentives granted to farmers; increase its rice selling price at close to market prices except fortarget subsidy areas; limit its local and imported procurement volumes to only what is needed to buildits 30 day buffer stock; lift quantitative restrictions on rice imports; divest itself of facilities andservices that have nothing to do with rice and corn; adopt tariff on rice imports based on FOB insteadof C&F price; and privatize NFA grains trading functions.
(3) Price Interventions
Intervention can be either direct or indirect. Direct intervention is the procurement of stocks inquantities and in locations as required in order to maintain and manage buffer stocks forstabilization. Indirect intervention is the strategy of controlling or causing the procurement of stocksthrough the provision of marketing support services. Such support services include NFA programsaimed at developing the marketing/ entrepreneurial skills of farmers.
Distribution is done when consumer prices go beyond the desired or affordable levels. Whencommercial prices of rice are beyond the reach of consumers, this signals NFA to inject its stocksinto the market through the accredited grains retailers/ wholesalers nationwide.
Direct market intervention strategy effects of allowing NFA to engage in actual grains procurementand distribution using government buffer stock and subsidized pricing system as main interventioninstruments.
- Procurement program involves actual procurement from individual and organized small farmersat the following government support price:
Wet season (September – February) P9.00/ kgDry season (March – August) P10.00/ kg
- The objectives of rice distribution program are to adequate supply of rice especially in deficit
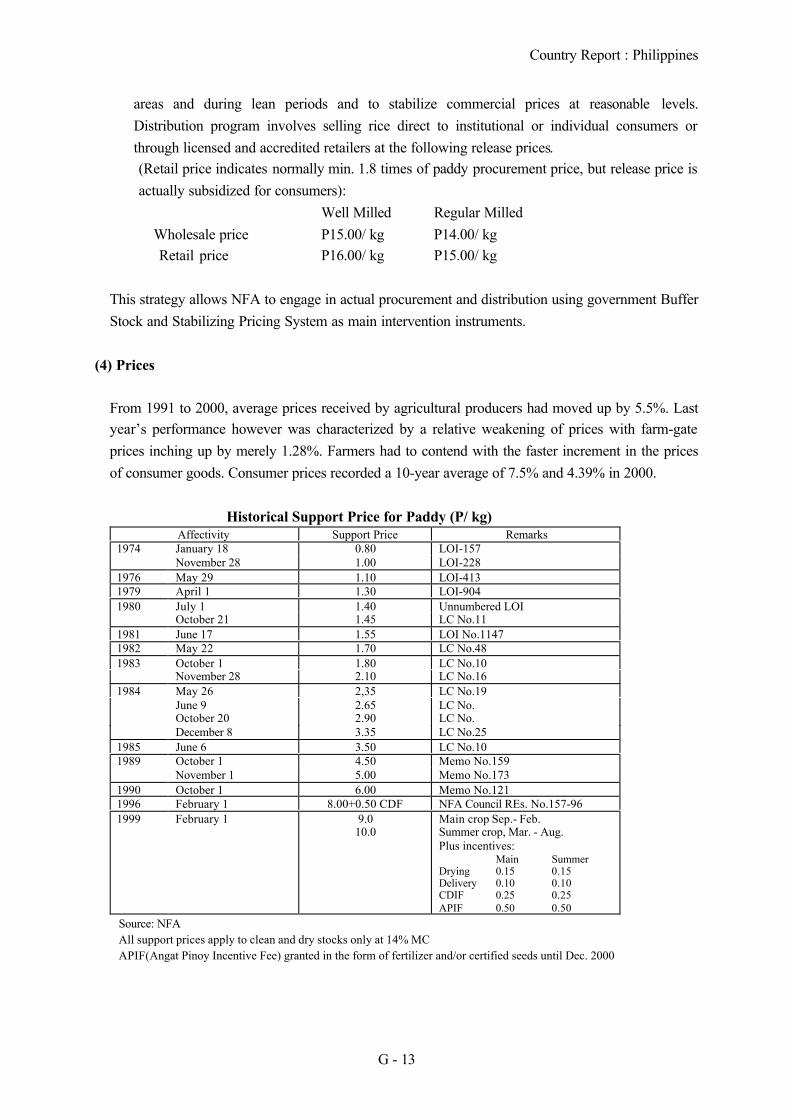
Country Report : Philippines
G - 13
areas and during lean periods and to stabilize commercial prices at reasonable levels.Distribution program involves selling rice direct to institutional or individual consumers orthrough licensed and accredited retailers at the following release prices.(Retail price indicates normally min. 1.8 times of paddy procurement price, but release price isactually subsidized for consumers):
Well Milled Regular MilledWholesale price P15.00/ kg P14.00/ kg Retail price P16.00/ kg P15.00/ kg
This strategy allows NFA to engage in actual procurement and distribution using government BufferStock and Stabilizing Pricing System as main intervention instruments.
(4) Prices
From 1991 to 2000, average prices received by agricultural producers had moved up by 5.5%. Lastyear’s performance however was characterized by a relative weakening of prices with farm-gateprices inching up by merely 1.28%. Farmers had to contend with the faster increment in the pricesof consumer goods. Consumer prices recorded a 10-year average of 7.5% and 4.39% in 2000.
Historical Support Price for Paddy (P/ kg)Affectivity Support Price Remarks
1974 January 18 0.80 LOI-157November 28 1.00 LOI-228
1976 May 29 1.10 LOI-4131979 April 1 1.30 LOI-9041980 July 1 1.40 Unnumbered LOI
October 21 1.45 LC No.111981 June 17 1.55 LOI No.11471982 May 22 1.70 LC No.481983 October 1 1.80 LC No.10
November 28 2.10 LC No.161984 May 26 2,35 LC No.19
June 9 2.65 LC No.October 20 2.90 LC No.December 8 3.35 LC No.25
1985 June 6 3.50 LC No.101989 October 1 4.50 Memo No.159
November 1 5.00 Memo No.1731990 October 1 6.00 Memo No.1211996 February 1 8.00+0.50 CDF NFA Council REs. No.157-961999 February 1 9.0
10.0Main crop Sep.- Feb.Summer crop, Mar. - Aug.Plus incentives: Main SummerDrying 0.15 0.15Delivery 0.10 0.10CDIF 0.25 0.25APIF 0.50 0.50
Source: NFAAll support prices apply to clean and dry stocks only at 14% MCAPIF(Angat Pinoy Incentive Fee) granted in the form of fertilizer and/or certified seeds until Dec. 2000

Country Report : Philippines
G - 14
4. Rice Trade (Overseas)
4.1 Export/ Import
Philippines Rice Import, 1992 - 2001Year Country of Origin Thailand Vietnam Myanmar China India Pakistan
Volume (MT) 01992Value (mil. USD)
Volume (MT) 209,9941993Value (mil. USD) 38.24
Volume (MT) 01994Value (mil. USD)
Volume (MT) 138,966 60,680 23,2301995Value (mil. USD) 42.21 18.60 6.67
Volume (MT) 157,100 364,180 121,920 159,573 68,6501996Value (mil. USD) 123.72 53.25 26.11 23.24 41.20
Volume (MT) 212,485 335,445 170,0461997Value (mil. USD) 63.75 101.21 65.37
Volume (MT) 211,098 578,752 1,306,912 28,9001998Value (mil. USD)
Volume (MT) 53,400 474,541 224,901 28,8751999Value (mil. USD) 65.55 138.67 9.13 8.17
Volume (MT) 496,323 60,9202000Value (mil. USD) 95.33 11.25
Volume (MT) 157,015 480,9022001Value (mil. USD) 22.84 72.27
(Continued)
Country of Origin Australia USA(PL480)
Thailand(Japan Aid)
Sub Total Importedby Private
GrandTotal
Volume (MT) 0 01992Value (mil. USD)
Volume (MT) 209,994 209,9941993Value (mil. USD) 38.24 38.24
Volume (MT) 0 01994Value (mil. USD)
Volume (MT) 4,310 30,077 257,263 257,2631995Value (mil. USD) Grant 8.70 76.18 76.18
Volume (MT) 21,521 892,944 710 893,6541996Value (mil. USD) 11.44 278.96 278.96
Volume (MT) 12,734 730,710 2,670 733,3801997Value (mil. USD) 3.77 234.10 234.10
Volume (MT) 2,125,662 869 2,126,5311998Value (mil. USD)
Volume (MT) 781,717 52,206 833,9231999Value (mil. USD) 221.52 221.52
Volume (MT) 59,275 616,518 19,788 636,3062000Value (mil. USD) 20.15 126.73 126.73
Volume (MT) 107,461 745,378 17,537 762,9152001Value (mil. USD) 37.84 132.95 132.95
Source: NFA
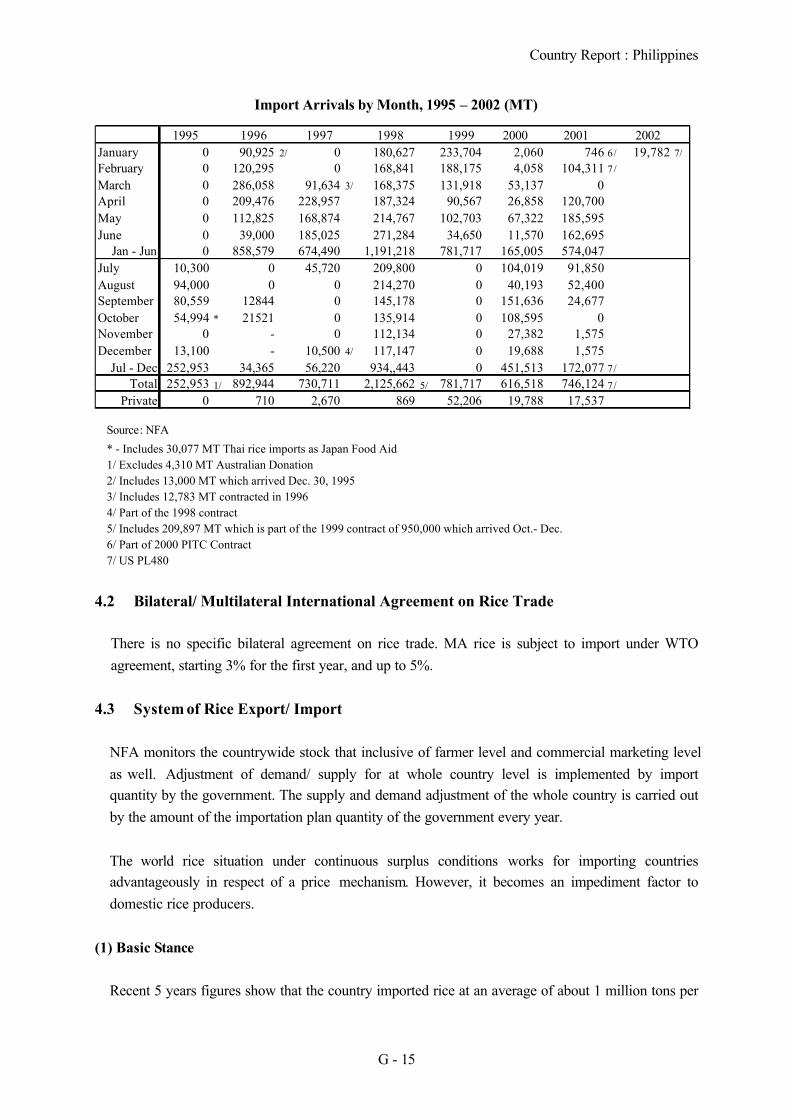
Country Report : Philippines
G - 15
Import Arrivals by Month, 1995 – 2002 (MT)
1995 1996 1997 1998 1999 2000 2001 2002January 0 90,925 2/ 0 180,627 233,704 2,060 746 6/ 19,782 7/
February 0 120,295 0 168,841 188,175 4,058 104,311 7/
March 0 286,058 91,634 3/ 168,375 131,918 53,137 0April 0 209,476 228,957 187,324 90,567 26,858 120,700May 0 112,825 168,874 214,767 102,703 67,322 185,595June 0 39,000 185,025 271,284 34,650 11,570 162,695
Jan - Jun 0 858,579 674,490 1,191,218 781,717 165,005 574,047July 10,300 0 45,720 209,800 0 104,019 91,850August 94,000 0 0 214,270 0 40,193 52,400September 80,559 12844 0 145,178 0 151,636 24,677October 54,994 * 21521 0 135,914 0 108,595 0November 0 - 0 112,134 0 27,382 1,575December 13,100 - 10,500 4/ 117,147 0 19,688 1,575
Jul - Dec 252,953 34,365 56,220 934,,443 0 451,513 172,077 7/
Total 252,953 1/ 892,944 730,711 2,125,662 5/ 781,717 616,518 746,124 7/
Private 0 710 2,670 869 52,206 19,788 17,537
Source: NFA
* - Includes 30,077 MT Thai rice imports as Japan Food Aid1/ Excludes 4,310 MT Australian Donation2/ Includes 13,000 MT which arrived Dec. 30, 19953/ Includes 12,783 MT contracted in 19964/ Part of the 1998 contract5/ Includes 209,897 MT which is part of the 1999 contract of 950,000 which arrived Oct.- Dec.6/ Part of 2000 PITC Contract7/ US PL480
4.2 Bilateral/ Multilateral International Agreement on Rice Trade
There is no specific bilateral agreement on rice trade. MA rice is subject to import under WTOagreement, starting 3% for the first year, and up to 5%.
4.3 System of Rice Export/ Import
NFA monitors the countrywide stock that inclusive of farmer level and commercial marketing levelas well. Adjustment of demand/ supply for at whole country level is implemented by importquantity by the government. The supply and demand adjustment of the whole country is carried outby the amount of the importation plan quantity of the government every year.
The world rice situation under continuous surplus conditions works for importing countriesadvantageously in respect of a price mechanism. However, it becomes an impediment factor todomestic rice producers.
(1) Basic Stance
Recent 5 years figures show that the country imported rice at an average of about 1 million tons per

Country Report : Philippines
G - 16
year from Asia includes Vietnam, China and Thailand, and also imported rice from US. In principlethe government imports rice with own budget, but also imports American rice under USA PL 480Title 1 Agreement as commodity loan.
Although the insufficient volume of domestic production has been imported by NFA, it is alsoexamined to change into privatization. It is not decided specifically, although lean months (Jul. ~Sep.) are getting close.
(2) Management of Imports/ Exports
Philippines under the GATT/ WTO was granted the privilege to maintain quantitative restrictions(QR) on rice. In place of this QR, the government shall allow the importation of rice equivalent tothe Minimum Access Volume (MAV) commitment of the country. Executive Order No.1028provides NFA the exclusive authority to undertake rice importation in the country. However, incases when there is a shortage in production, NFA may undertake importation beyond the MAV butsubject to the approval of the President. This aims to meet the country’s requirement forstabilization and food security purposes. Moreover, the advent of the free market paved the way forchanges in NFA charter. NFA may now allocate rice import quotas among certified and licensed riceimporters. Initially, what is allowed are the premium grade/ fancy/ glutinous type of rice. In order toprotect the local market, the government shall impose an equalization fee to equalize the selling ofsuch imported stocks with the normal prevailing domestic prices.
- Inter-Agency Committee on Rice and Corn (IACRC) proposes the necessary import quantityafter assessment of supply/demand situation.
- Import duties 50% on rice was set by EO334 on January 3, 2001.- NFA imports rice exclusively, and provide issues Import Quota to private importers. Import
Quota for 23,000 MT of quality rice such as Thai fragrant rice was issued in 2001.- Rice imports by NFA in principle require to be completed by May by taking account of lean
months (Jul.-Sep.) and difficulties of domestic transportation in rain season.- House Bill No.3339 that aims to replace QR with tariff as early as 2002 and with finality for by
2005, this would place the country more depending on foreign sources.- Rice is listed in AFTA CEPT: highly sensitive product, and AFTA CEPT ending tariff: not fixed
yet.- The government started to announce the planed import quantity under the conditions of ADB
Loan for GSDP. Import quantity is to be announced by March 1 in case of over 300,000 MT,and by April 1 in case of less 300,000 MT. 390,000 MT for 2002 has been noticed already.
- NFA will submit to the Cabinet its proposal for allowing other sectors to import rice.- Philippine International Trading Corp. (PITC) will start importing rice on behalf of NFA. All
390,000 tons (rice import quota for 2002) will be imported by PITC. PITC will invite tendersfrom state firms in Thailand, Vietnam, Malaysia, India, China and Pakistan for 25% broken rice.
- The government will lift the monopoly of NFA on rice imports from the rice import year of2002, starting in March 2002.

Country Report : Philippines
G - 17
- For replacing the monopoly, Quantitative Restriction system will be introduced to protectdomestic producers from excess rice imports.
- The cheaper rice from the neighbor countries is in tendency to flow into the countrytopographically.
5. Rice Reservation by the Government
5.1 Quantity of Reserve
The table shows rice inventory stock by sector for 1999 and 2000. Paddy seems accumulatedwithout conversion from paddy to rice.
Rice Inventory (MT)As of December 31
Sector & Rice2000 1999
NFA 483,900 761,300 Paddy 233,100 408,100 Milled Rice 250,800 353,200 Imported 198,700 341,000 Local 52,100 122,000Commercial 521,200 540,000Household 1,337,900 1,263,100Total 2,343,000 2,564,400Source: NFA annual report, 2000
Monthly Rice Inventory by Sector, 1998-2002 (1,000 MT)Sector Month 1998 1999 2000 2001 2002
NFAJanuary 443.1 909.3 726.6 461.1 795.6February 575.7 968.6 612.2 466.5March 685.2 1,088.7 552.5 533.9April 810.5 1,121.3 479.3 530.5May 880.1 1,161.1 497.9 589.7June 886.7 1,246.1 550.1 776.9July 929.8 1,234.1 506.3 833.4August 897.2 1,106.1 461.9 875.8September 911.4 950.4 358.0 796.7October 855.6 860.7 343.9 728.3November 859.4 820.5 402.9 700.7December 908.2 806.9 467.8 714.7
CommercialJanuary 448.2 414.5 488.2 492.4 473.7February 397.4 389.7 420.6 487.1March 408.1 303.9 381.0 485.6April 521.0 359.2 441.2 502.7May 534.4 503.5 509.6 610.1June 524.1 488.1 485.5 631.0July 419.8 461.5 456.8 498.1August 334.3 511.5 359.1 408.7September 325.8 401.9 326.4 424.1October 305.4 436.8 410.8 440.3November 358.9 488.9 410.3 524.7December 500.4 540.0 471.9 524.5
(continue..)

Country Report : Philippines
G - 18
Sector Month 1998 1999 2000 2001 2002Household
January 1,088.1 955.5 1,149.7 1,212.6 1,111.8February 898.0 786.3 1,009.5 920.3March 754.8 768.1 832.2 845.3April 890.2 939.3 954.4 1,088.9May 856.1 1,046.3 1,060.0 1,080.4June 708.7 839.9 800.3 859.9July 595.3 685.5 665.5 723.3August 492.3 603.6 551.9 586.7September 417.0 533.8 510.6 503.9October 549.7 735.4 730.4 713.7November 853.6 1,131.5 1,197.6 1,371.9December 1,005.0 1,263.1 1,337.9 1,365.2
TotalJanuary 1,979.4 2,279.3 2,364.5 2,166.1 2,381.1February 1,871.1 2,144.6 2,042.3 1,873.9March 1,848.1 2,160.7 1,765.7 1,864.8April 2,221.7 2,419.8 1,874.9 2,122.1May 2,270.5 2,710.9 2,067.5 1,280.2June 2,119.5 2,574.1 1,835.9 2,267.8July 1,944.9 2,381.1 1,628.6 2,054.8August 1,723.8 2,221.2 1,372.9 1,871.2September 1,654.2 1,886.1 1,195.0 1,724.7October 1,710.7 2,032.9 1,485.1 1,882.3November 2,071.9 2,440.9 2,010.8 2,597.3December 2,413.6 2,610.0 2,277.6 2,604.4
Source: NFA
5.2 System of Rice Reservation
(1) Responsible Agency
The government through NFA shall be the custodian of a government rice buffer stock for foodsecurity and stabilization purposes.
(2) Procurement System
The rice buffer stock shall be built up through domestic procurement and/or when warranted,through importation. NFA is mandated by the government to undertake domestic paddyprocurement for food security and price/ supply stabilization purposes. Funds for domesticprocurement is realized through legislation. The actual procurement from individual and organizedsmall farmers is at government support price and calibrated to provide farmers reasonable returns oninvestment.
(3) Distribution/ sales System
This involves selling rice direct to institutional or individual consumers or indirectly throughlicensed and accredited retailers. Under the helm of NFA, rolling stores are being deployednationwide to distributes/ sell reasonably priced rice and sugar and other basic commodities to

Country Report : Philippines
G - 19
depressed areas.
(4) Management of Storage Facilities
Warehouses constructed by NFA and equipped with basic administrative and post-harvest facilitiesfor farmers/ farmers organizations who commit to sell paddy to NFA. The warehouse is designed toprovide local farmers produce with solar drying pavement to serve not only as storage but also asfood security depot.
(5) Total Capacity of Storage Facilities
There are more than 400 NFA-owned/ leased warehouses around the country, which hold around2,000,000 MT of stocks.
(6) Quality Control
Quality control program is a multi- sector effort spearheaded by NFA to implement National GrainsStandards throughout the country through continuing advocacy campaigns particularly amongfarmers, retailers, grains businessmen and consumers on grains quality, weighing and packaging.
(7) Reserve Strategies
The government through NFA is the custodian of government rice buffer stock which is built upthrough domestic procurement and/or when warranted, through importation. Thus, NFA hasembarked on an all-year round activity of properly positioning the staple.
The government buffer stock shall be at the following mandatory level and time schedule:(a) Strategic Rice Reserve – this is equivalent to a minimum of 15 days national rice consumption
maintenance year-round in government depot for Food Security purposes in times of calamityand emergency.
(b) Rice Buffer Stock – this is equivalent to at least 30 days national rice consumption by July 1 ofevery year, inclusive of the 15 day Strategic Rice Reserve for stabilization purposes in deficitareas and during lean months (July-September). Relations require to replenish rice within 90days when stock level becomes less than 15 days.
(c) Reserve for national level shall be 90 days consumption (24,400 MT/day in 2001), i.e. 30 daysby the government through NFA, 15 days as buffer stock by commercial sector and 45 days byhousehold level.
(d) Stocks shall be positioned in provinces susceptible to emergencies and isolation. There are morethan 400 NFA-owned/ leased ware houses around the country, which can hold around 2,000,000ton of stocks for emergencies. There are positioned in the 80 provincial and 14 regional offices.

Country Report : Philippines
G - 20
5.3 Rice Reservation for ASEAN Food Security Reserve (AFSR)
The commitment to AFSR as actual reserve quantity is 12,000 MT that is based on milled rice eventhough inclusive of National Reserve. National reserve and AFSR of rice is not clearly divided.
6. Rice Demand/ Consumption
6.1 Amount of Domestic Consumption
Regarding the rice self-sufficiency, the population was 12 million in 1945 and that reached 30millions in the beginning of 1970's, and became in the importing country of rice in this point. It isthe place where is maintaining self-support somehow yet, although then HYV, is introduced and theself-support of the rice is achieved once again and the present is exceeding 70 million people.
Production Utilization, Philippines (MT)Food Use
Year TotalPer
Capita(kg)
Seed Feed andWastes
Total Use Production Surplus(Deficit) Population
1980 4,453,043 92.18 169,188 323,065 4,945,296 4,970,220 24,924 48,305,682
1981 4,588,597 92.81 166,673 334,231 5,089,501 5,141,982 52,481 49,440,243
1982 4,646,807 91.83 163,369 352,097 5,162,275 5,416,927 254,652 50,602,207
1983 4,634,422 89.49 148,718 309,163 5,092,303 4,756,283 (336,020) 51,787,071
1984 5,165,021 97.45 155,114 332,806 5,652,940 5,120,089 (532,851) 53,001,511
1985 5,156,027 95.05 162,181 374,327 5,692,536 5,758,860 66,324 54,243,571
1986 5,228,011 94.17 169,919 393,081 5,791,012 6,047,471 256,459 55,513,809
1987 5,393,304 94.93 159,701 363,032 5,916,036 5,585,062 (330,974) 56,813,507
1988 5,497,025 94.54 166,405 381,360 6,044,791 5,867,056 (177,735) 58,143,310
1989 5,620,297 94.45 171,533 402,011 6,193,841 6,186,035 (7,806) 59,503,818
1990 5,919,574 97.21 162,780 396,159 6,478,513 6,094,807 (383,706) 60,895,734
1991 5,519,580 88.57 167,986 411,183 6,098,749 6,326,647 227,898 62,315,557
1992 5,816,151 91.21 156,854 388,055 6,361,061 5,970,327 (390,734) 63,769,137
1993 6,025,078 92.33 160,032 399,025 6,584,135 6,132,410 (451,725) 65,256,326
1994 6,110,132 91.50 201,965 479,500 6,791,597 6,850,368 58,771 66,778,103
1995 6,445,311 94.32 231,985 513,,825 7,191,121 6,851,422 (339,699) 68,335,375
1996 6,990,303 99.95 243,985 586,720 7,821,008 7,334,320 (468,688) 69,935,753
1997 6,996,159 97.75 248,978 622,625 7,867,762 7,324,826 (542,936) 71,574,263
1998 6,711,329 91.62 211,980 500,400 7,423,709 5,560,635 (1,863,074) 73,251,794
1999 7,411,005 98.85 285,991 727,832 8,424,828 7,661,307 (763,521) 74,974,342
2000 7,782,398 101.40 288,726 765,049 8,836,173 8,053,117 (783,056) 76,747,430
Source: NFA

Country Report : Philippines
G - 21
6.2 Seasonal Balance of Supply-Demand
Supply-Use and Related Statistics (MT)Item 1996R 1997R 1998R 1999R 2000P
SUPPLYCarryover Stock 1,422,000 1,797,000 1,976,000 2,284,000 2,355,000Production 7,334,000 7,325,000 5,560,000 7,662,000 8,053,000Imports 1/ 862,000 722,000 2,171,000 834,000 617,000
TOTAL 9,618,000 9,844,000 9,707,000 10,780,000 11,025,000USE
ExportsSeeds 2/ 244,000 249,000 212,000 286,000 289,000Feeds & Wastes 3/ 587,000 623,000 500,000 728,000 765,000Apparent Consumption 6,990,000 6,996,000 6,711,000 7,411,000 7,782,000
TOTAL 7,821,000 7,868,000 7,423,000 8,425,000 8,836,000PER CAPITA (KG) 100.2 98.3 92.5 100.1 103.0RICE STOCKSTOTAL January 1 1,422,200 1,797,100 1,976,500 2,284,100 2,355,500
July 1 1,602,100 1,818,000 1,927,100 2,380,900 1,632,400HOUSEHOLD January 1 1,019,900 1,015,800 1,088,100 955,500 1,149,700
July 1 714,500 683,900 595,300 685,500 665,500COMMERCIAL January 1 325,100 465,600 448,200 413,000 488,200
July 1 362,400 394,800 419,900 461,500 456,800NFA January 1 77,200 315,700 440,200 915,600 717,600
July 1 525,200 739,300 911,900 1,233,900 510,100Source: Selected Statistics on Agriculture, June 20011/ NSO figures 2/ Updated based on seeding rate 3/ Updated based on post-harvest losses
6.3 Regional Balance of Supply-Demand
Rice Production and Use Estimates, by Province, 2000 (MT)
Region Food UsePer
Capita(kg/year)
Seed Feed &Wastes Total Use Production Surplus
(Deficit)Population(persons)
Philippines 7,782,398 101.40 288,726 765,049 8,836,173 8,053,117 (783,056) 76,747,430
Metro Manila 938,950 94.37 0 0 938,950 0 (938,950) 9,950,090
Car 159,308 116.34 6,084 15,797 181,189 166,282 (14,907) 1,369,351
Ilocos 495,619 117.58 25,113 74,586 595,318 785,129 189,811 4,215,247
Cagayan Valley 310,755 110.71 35,244 110,232 456,231 1,160,339 704,108 2,807,046
Central Luzon 851,556 105.48 37,880 116,609 1,006,045 1,227,469 221,424 8,073,523
Southern Tagalog 1,210,196 101.99 29,137 74,533 1,313,866 784,535 (529,331) 11,865,759
Bicol 533,945 113.89 20,722 41,515 596,182 436,990 (159,192) 4,688,055
Western Visayas 741,625 119.14 40,946 99,316 881,887 1,045,419 163,532 6,224,800
Central Visayas 345,499 60.33 7,236 13,288 366,023 139,875 (226,148) 5,727,039
Eastern Visayas 409,145 113.05 15,658 31,959 456,762 336,412 (120,350) 3,619,262
Western Mindanao 261,643 84.34 11,003 27,659 300,305 291,152 (9,153) 3,102,349
Southern Mindanao 528,710 101.44 14,690 43,812 587,212 461,175 (126,037) 5,211,873
Nothern Mindanao 231,462 83.94 6,832 20,766 259,060 218,582 (40,478) 2,757,405
Central Mindanao 231,071 99.99 19,239 54,760 305,070 576,422 271,352 2,310,961
Armm 299,854 110,09 10,556 - 331,604 223,093 (108,511) 2,723,628
Caraga 233,060 110.93 8,386 19,023 260,469 200,243 (60,226) 2,101,042
Source: NFA

Country Report : Philippines
G - 22
6.4 Problem/ Constraints on Rice Supply-demand situation
The country has been consistently relying on importation to supplement domestic production of rice.To wit, the country’s self-sufficiency ratio for rice averaged 92.93 % for the last decade.
The general policy of the government is to produce rice for self-sufficiency. Moreover, importationshall only be resorted to as the last recourse to meet an impending or actual deficit in rice supply.The production output is until now short of attaining self-efficiency. With the present populationannual growth rate, the country’s rice supply trails behind, considering the increasing local ricerequirements.
With the passage of a House Bill No.3339 that aims to replace quantitative restrictions with tariffsas early as 2002 and with finality by 2005, this would place the county more dependent on foreignsources.
7. Rice/ Paddy Price
7.1 Rice prices in the major urban markets
Domestic Rice Price (Peso/ kg)Classification 1996 1997 1998R 1999R 2000P
Farm Paddy Special 8.13 7.92 8.11 7.87 8.39
Wholesale Rice Special 17.39 16.88 17.40 17.46 17.77
Retail Rice Special 19.00 18.55 19.03 19.16 19.45
Source: Selected Statistics on Agriculture, 2001
Monthly Wholesale Prices for Special Rice, Philippines and Metro Manila (Peso/ kg)Year 1997 1998 1999 2000 2001
Month Phil. M.Mla Phil. M.Mla Phil. M.Mla Phil. M.Mla Phil. M.MlaJanuary 16.18 17.16 16.93 17.73 17.66 18.49 17.38 18.44 17.59 18.70February 16.51 17.69 17.18 16.78 17.74 18.49 17.57 18.43 17.54 18.79March 16.85 17.17 17.12 17.18 17.68 18.49 17.64 18.44 17.55 18.67April 16.77 17.00 17.09 17.18 17.57 18.08 17.62 18.44 17.51 18.67May 16.68 16.97 17.24 17.32 17.46 18.08 17.75 18.44 17.48 18.67June 16.80 17.75 17.46 17.47 17.53 18.31 17.86 18.44 17.65 18.67July 17.19 17.56 17.39 17.47 17.68 18.49 18.13 18.51 17.89 18.35August 17.81 17.68 17.90 18.23 17.65 18.10 18.31 18.78 18.00 19.04September 17.46 18.16 17.95 18.49 17.42 18.10 18.16 18.78 17.78 19.14October 17.02 17.57 17.56 18.49 17.07 18.10 17.74 18.78 17.45 18.85November 16.71 17.34 17.47 18.49 16.94 18.10 17.56 18.80 17.37 18.89December 16.66 17.85 17.41 18.49 17.08 18.03 17.51 18.73 17.44 18.60Average 16.88 17.49 17.39 18.49 17.46 18.24 17.77 18.58 17.60 18.75
Source: BAS

Country Report : Philippines
G - 23
Monthly Retail Prices for Special Rice, Philippines and Metro Manila (Peso/ kg)Year 1997 1998 1999 2000 2001
Month Phil. M.Mla Phil. M.Mla Phil. M.Mla Phil. M.Mla Phil. M.MlaJanuary 17.98 21.43 18.58 21.81 19.24 21.50 19.00 21.56 19.37 21.64February 18.16 21.26 18.72 21.81 19.37 21.41 19.12 21.60 19.36 21.62March 18.40 21.16 18.66 21.38 19.32 21.49 19.22 21.68 19.36 21.65April 18.39 21.25 18.72 21.50 19.26 22.21 19.21 21.70 19.29 21.62May 18.34 21.22 18.84 21.52 10.23 21.63 19.27 21.60 19.33 21.87June 18.41 21.66 19.00 21.78 19.20 21.63 19.38 21.59 19.45 21.90July 18.68 21.48 19.11 21.46 19.24 21.57 19.74 21.62 19.61 21.91August 19.08 21.00 19.42 21.49 19.26 21.52 19.99 21.66 19.68 21.89September 19.47 21.36 19.57 21.49 19.10 21.51 19.96 21.70 19.57 21.93October 18.73 21.75 19.32 21.51 18.94 21.52 19.64 21.69 19.47 21.97November 18.46 20.92 19.24 21.40 18.87 21.58 19.48 21.64 19.30 21.92December 18.47 21.92 19.08 21.37 18.83 21.50 19.37 21.59 19.31 21.89Average 18.55 21.00 19.02 21.54 19.16 21.59 19.45 21.64 19.43 21.82
Source: BAS
7.2 Paddy price in some provinces
Paddy Prices in Major Producing Provinces (Peso/ kg)Province 1997 1998 1999 2000 2001P
Pangasinan 8.53 8.92 8.94 9.17 8.92Isabela 7.99 8.63 8.43 8.77 8.76Cagayan 8.48 9.18 8.62 8.95 8.73Nueva Ecija 8.37 8.98 8.72 8.64 9.44Bulacan 7.94 8.44 7.66 8.47 9.02Camarines Sur 7.35 7.04 7.11 7.47 7.37Iloilo 8.98 8.25 8.09 8.48 8.32Zamboanga Sur 7.50 7.98 7.46 8.33 7.98North Cotabato 8.49 8.43 8.10 8.68 8.67
Source: BAS, P- preliminary
Average of Selling Price by Fancy Varieties (Peso/ kg)Domestic Dec. 2001 Jan. 2002 Imported Dec. 2001 Jan. 2002IR64 22.58 - Japanese rice 75.28 75.55Maharlika 24.15 - Jasmine Thai rice 54.75 54.94Fancy Laon 36.75 37.50 Jasmine rice (Milagrosa) 51.84 51.98Azucena 30.51 30.87 Koshihikari 83.22 83.25Intan 22.31 22.66 Fragrant rice 52.25 52.25Standard 24.38 24.52 Calrose 54.73 53.89Dinorado 31.18 31.35Premium 25.66 25.75Milagrosa 28.65 28.73C4 23.96 24.02Candaba 26.46 26.47California rice 23.39 23.39Bitbit Bigas 24.78 24.78Fancy rice 31.38 31.38Healthy rice 23.12 23.12Organically grown B.rice
30.58 30.58
Premium long gain 27.60 27.60Red rice 34.33 34.33Super special 29.00 29.00Wagwag 36.90 36.90Fancy long grain 30.08 30.03Sinandomeng 28.95 28.77
Source: NFA

Country Report : Philippines
G - 24
Paddy Farm Prices in Philippines (other varieties), (Peso/ kg)Jan. Feb. Mar. Apr. May. Jun. Jul. Aug. Sep. Oct. Nov. Dec. Ave.
1999 8.20 8.64 8.66 8.52 8.32 8.52 8.24 7.90 7.41 7.40 7.48 7.62 7.872000 8.08 8.61 8.66 8.84 8.87 8.93 9.01 8.77 8.23 7.96 7.79 7.88 8.422001 7.99 8.09 8.24 8.25 8.35 8.67 8.83 8.67 8.13 7.70 7.66 7.95 8.21
Paddy Farm Prices in Iloilo (other varieties), (Peso/ kg)Jan. Feb. Mar. Apr. May. Jun. Jul. Aug. Sep. Oct. Nov. Dec. Ave.
1999 8.08 8.58 8.57 7.86 8.48 9.16 8.96 7.26 6.98 7.64 8.09 - 8.092000 8.52 8.49 - 9.46 9.40 9.61 9.33 8.69 7.59 7.57 7.92 7.65 8.482001 7.66* 7.58* 7.94* 7.83* 9.25 9.05 10.02 8.02 7.78 7.46 7.74 7.98 8.19
* Adjusted to 14% MC because reported prices were for fresh and skin dry form
Paddy Farm Prices in Cagayan (other varieties), (Peso/ kg)Jan. Feb. Mar. Apr. May. Jun. Jul. Aug. Sep. Oct. Nov. Dec. Ave.
1999 8.84 10.22 9.52 9.52 9.11 9.06 9.76 8.08 7.27 7.40 6.96 7.66 8.622000 7.63 8.65 9.46 9.60 9.59 10.54 10.02 - 8.68 7.95 8.42 7.94 8.952001 - 8.44 - 9.12 9.28 9.42 10.14 8.89 8.69 8.05 7.26 7.87 8.72
Note: For the provinces 1999 prices are for “as it is where is” form
Paddy Farm Prices in Isabela (other varieties), (Peso/ kg)Jan. Feb. Mar. Apr. May. Jun. Jul. Aug. Sep. Oct. Nov. Dec. Ave.
1999 9.20 8.58 9.03 8.67 8.75 8.93 8.50 8.29 7.03 7.11 6.73 7.10 8.432000 8.65 8.51 - 9.11 9.26 9.95 10.10 8.68 9.21 7.84 7.96 7.66 8.772001 7.92 - 8.40 8.56 8.57 9.04 8.63 8.58 8.39 8.12 7.51 8.19 8.36
Paddy Farm Prices in Nueva Ecija (other varieties), (Peso/ kg)Jan. Feb. Mar. Apr. May. Jun. Jul. Aug. Sep. Oct. Nov. Dec. Ave.
1999 10.00 10.00 9.08 8.72 9.40 10.00 10.00 9.91 - 8.26 - 7.92 8.722000 9.46 9.73 9.54 8.88 8.41 10.07 - - 8.84 8.38 8.39 - 8.642001 8.84 9.33 9.83 8.08 8.17 9.17 9.44 10.00 7.38 8.00 8.31 9.28 8.82
Paddy Farm Prices in Pangasian (other varieties), (Peso/ kg)Jan. Feb. Mar. Apr. May. Jun. Jul. Aug. Sep. Oct. Nov. Dec. Ave.
1999 9.31 9.50 9.98 9.15 8.91 9.36 9.51 9.22 8.45 7.78 7.52 8.02 8.942000 9.41 9.46 9.26 9.39 9.55 9.85 - 9.71 8.95 8.17 - 8.59 9.172001 9.08 9.08 9.18 9.14 9.22 9.60 9.40 9.10 8.96 8.15 7.91 7.78 8.88
Rice Wholesale Prices in Metro Manila (special), (Peso/ kg)Jan. Feb. Mar. Apr. May. Jun. Jul. Aug. Sep. Oct. Nov. Dec. Ave.
1999 18.49 18.49 18.49 18.08 18.08 18.31 18.49 18.10 18.10 18.10 18.10 18.03 18.232000 18.44 18.44 18.44 18.44 18.44 18.44 18.51 18.78 18.78 18.78 18.80 18.82 18.562001 18.73 18.79 18.67 18.67 18.67 18.67 18.35 19.04 19.14 18.85 18.89 18.60 18.76
Rice Retail Prices in Metro Manila (special), (Peso/ kg)Jan. Feb. Mar. Apr. May. Jun. Jul. Aug. Sep. Oct. Nov. Dec. Ave.
1999 21.50 21.41 21.49 21.61 21.63 21.68 21.57 21.52 21.51 21.52 21.58 21.50 21.542000 21.56 21.61 21.68 21.70 21.60 21.59 21.62 21.66 21.70 21.69 21.64 21.59 21.642001 21.64 21.62 21.65 21.62 21.77 21.90 21.91 21.89 21.93 21.97 21.92 21.89 21.81
Source: NFA
7.3 Problem/ Constraints on the Rice/ Paddy Price
From 1991 to 2000, average prices received by agricultural producers had moved up by 5.5 %. Lastyear’s performance, however was characterized by a relative weakening of prices with farm-gateprices inching up by merely 1.28 %. Farmers had to contend with the faster increment in the pricesof consumer goods. Consumer prices recorded 10-year average increase of 7.5% and 4.39 % in

Country Report : Philippines
G - 25
2000.
Farmer groups/ cooperatives are requesting for the adoption of only one support price of P10.00/ kgand maintain all incentives to procure more. However, as a policy government believes maintainingthe two-tiered pricing scheme will encourage the farmers to plant more during the dry seasonthereby improving supply during the lean months season (July–September). As a result, there willbe lesser volatility in prices in the market.
8. Food Aid
8.1 Received Amount of Food Aid
In 1995 Japanese government assisted 30,000 MT of Thai rice with soft-loan. And also USA PL 480assisted rice as shown in the table. WFP has no activity so far in this field.
Rice Assistance under USA PL 480Year Rice (MT)1996 21,5211997 12,7342000 59,2752001 107,461
8.2 Rice Procurement System of Food Aid Organizations
As part of the poverty alleviation program, NFA has launched the Targeted Rice DistributionProgram and the Coconut Farmers Food Access Program which will cater directly to the poorest ofthe poor and the small time coconut farmers, respectively. This time, NFA’s low-priced but goodquality rice will only be distributed for the food needs of the beneficiaries identified by theDepartment of Social Welfare and Development and the Philippine Coconut Authority.
In responses to calamities/ Emergencies, Relief Operations in 2000, rice releases to the followingagencies for relief operations totaled to 9,576.75 tons for Philippine National Red Cross, Dept. forSocial Welfare & Development, Non-Government Organizations, National Disaster CoordinatingCenter, Local Government Units, Legislators, Other Government Agencies.
Lingap-Enhanced Sari-Sari Store (Lingap-ESSS) : aims to make rice and other basic foodcommodities available and accessible to the beneficiaries at affordable prices.Lingap Emergency Relief Assistance Project : To ensure immediate response to the rice needs ofthe beneficiaries in times of calamities/ emergencies.Lingap Rice Subsidy Project : To provide support services to the target beneficiaries who areengaged in marginal farming or those who are in marginally farmed areas.Lingap Rice Subsidy Project : is intended to provide NFA rice to 16,600 target beneficiaries or

Country Report : Philippines
G - 26
830 clusters (20 families per cluster) at a lower, subsidized price or a discount of P3.00/ kg. Eachfamily beneficiary is granted a minimum rice subsidy allocation of 2.3 kg per day for a period of 90days. It makes it large in the meaning of the degree that pulls the foot of the market prices insubsidy P3.00/kg, and, whether or not there is not a meaningLingap Farmers ’ Alleviation Project : is to provide support services to the target beneficiarieswho are engaged in marginal farming or those who are in marginally famed areas.
9. Poverty
9.1 Situation of Poverty
Poverty incidence or the proportion of families (a family of 6 members) with per capita incomesbelow the poverty threshold increased from 31.8% in 1997 to 33.7% in 2000. As a proportion to thepopulation, poverty incidence was placed at 39.4% in 2000.
Poverty Incidence (%)1985 1988 1991 1994 1997 2000
Population, country 49.3 49.5 45.3 40.6 36.8 39.4 urban 37.9 34.3 35.6 28.0 21.5 24.3 rural 56.4 52.3 55.1 53.1 50.7 54.0Source: Family Income and Expenditure Surveys, National Statistics Office
9.2 Policy and Projects on Poverty Alleviation
To effectively concretize Presidential Poverty Eradication Program, Executive No.22 in 1998 wasissued authorizing NFA to intervene in the stabilization of the price and supply of basic foodcommodities.
Subsidized rice with low price is distributed for poor people in 2002 under Targeted RiceDistribution Program of ADB loan / Grain Sector Development Program.It targets 1 million people (equivalent to 0.2 million house-household) will get distributed 5kg/person/week of P14/kg, under Targeted Rice Distribution Program of one of ADB loan / GrainSector Development Program conditions.
NFA’s TGL Program is an integrated distribution program designed to provide rice and other basicfood commodities to the poor sector. TGL Program aims to provide market access to consumerswith affordable quality rice and other basic food commodities.
It is comparatively expensive still for the poverty layer, although the subsidized price sales is carriedout. Also, there is the restriction of a budget, although Poverty Alleviation Retail Price is appliedto the targeted poverty layer.

Country Report : Philippines
G - 27
10. National Food Security Policy
The country has been consistently relying on importation to supplement domestic production of rice.To wit, the country’s self-sufficiency ratio for rice averaged 92.93 % for the last decade. ThePhilippines’ nature and a high population growth rate of 2.35% per annum almost equal to thegrowth in rice productivity underscore the need for the government to put into place a system thatwill ensure food security for the nation.
The general policy of the government is to produce rice for self-sufficiency, but is not attained so far.Population reached 30 million in 1970s , Philippines became a rice importing country. Afterintroducing HYV the self- sufficiently for some years were attained. However Philippines’population exceeded 70 million, and consumption by individual person is increasing recently. Thisis another reason why rice self-sufficiency is getting difficult for the country.
Food security is making readily available and adequate supply of food for the entire population ataffordable prices in times and places of calamity or emergency, both natural or man-made. Thisconnotes a social responsibility in which the incurrence of additional costs is necessary andinevitable for effective implementation of a given food security program/ policy, since it involvesvoluminous required stocks which range from half to one million metric tons rice to be sustained intime.
Food security is a core government function. NFA is required to maintain a year-round food securitystocks or strategic rice reserves to address any impending national and/or man-made emergency andcalamity. NFA maintains rice buffer stocks inclusive of the food security stocks for stabilizationpurposes in deficit areas at any given time.
NFA is mandated to provide the nation with adequate and continuous food supply of the staple intimes and places of natural or man-made calamity/ emergency.- 48 hours response time to staple cereal requirements in calamity/ emergency stricken areas.- Restore or maintain within 2 weeks staple cereal supply and prices at levels immediately prior
to a calamity or emergency.
The following measures were outlined to address the food security concern of the nation:- Launch a nationwide program for sustained increase on domestic production (Gintong Ani
Program) through productivity-enhancing measures,- Stabilize price and supply,- Creation of the Executive Committee and a Technical Working Group on Food Security through
Executive Order No.381.
The government is encountering constraints in achieving and maintaining food security. This is dueto a stagnant production that was mainly caused by:- Lack of effort to improve research and development

Country Report : Philippines
G - 28
- Lack of agricultural infrastructure such as farm-to-market roads, irrigation and post-harvestfacilities.
Existing Food Security / Productivity Decision Process
Bureau of Agricultural Statistics (BAS) releases results of thequarterly production forecast (July, October, January and April)
Inter-Agency Committee (IAC) on Rice and Corn meets to assess supply / demand situation
IAC submits report to DA Secretary and NFA Administrator
DA Secretary reports to PresidentNFA Administrator reports to NFA council
NFA Council deliberates report
NFA Council makes recommendation to President
President evaluates report of DA Sec. and NFA Council Approves /disapproves recommendation
NFA undertakes importaion of approved volume

Philippines at a glance 10/3/01
East Lower-POVERTY and SOCIAL Asia & middle-
Philippines Pacific income2000Population, mid-year (millions) 75.6 1,853 2,046GNI per capita (Atlas method, US$) 1,040 1,060 1,140GNI (Atlas method, US$ billions) 78.8 1,964 2,327
Average annual growth, 1994-00
Population (%) 2.1 1.1 1.0Labor force (%) 2.6 1.4 1.3
Most recent estimate (latest year available, 1994-00)
Poverty (% of population below national poverty line) 37 .. ..Urban population (% of total population) 59 35 42Life expectancy at birth (years) 69 69 69Infant mortality (per 1,000 live births) 31 35 32Child malnutrition (% of children under 5) .. 13 11Access to an improved water source (% of population) 87 75 80Illiteracy (% of population age 15+) 5 14 15Gross primary enrollment (% of school-age population) 117 119 114
Male .. 121 116Female .. 121 114
KEY ECONOMIC RATIOS and LONG-TERM TRENDS
1980 1990 1999 2000
GDP (US$ billions) 32.5 44.3 76.2 74.7
Gross domestic investment/GDP 29.1 24.2 18.8 17.8Exports of goods and services/GDP 23.6 27.5 51.5 56.3Gross domestic savings/GDP 24.2 18.4 19.2 24.0Gross national savings/GDP .. 19.5 24.7 30.3
Current account balance/GDP -5.9 -5.8 9.0 12.3Interest payments/GDP 1.8 3.5 2.7 3.3Total debt/GDP 53.6 69.0 68.3 69.4Total debt service/exports 26.6 27.0 14.4 13.7Present value of debt/GDP .. .. 68.1 ..Present value of debt/exports .. .. 111.0 ..
1980-90 1990-00 1999 2000 2000-04(average annual growth)GDP 1.0 3.3 3.4 4.0 ..GDP per capita -1.2 1.0 1.5 2.2 ..Exports of goods and services 3.5 7.3 3.6 6.6 ..
STRUCTURE of the ECONOMY1980 1990 1999 2000
(% of GDP)Agriculture 25.1 21.9 17.1 15.9Industry 38.8 34.5 30.6 31.1
Manufacturing 25.7 24.8 21.6 22.6Services 36.1 43.6 52.2 52.9
Private consumption 66.7 71.5 68.0 63.2General government consumption 9.1 10.1 13.1 12.8Imports of goods and services 28.5 33.3 51.3 50.2
1980-90 1990-00 1999 2000(average annual growth)Agriculture 1.0 1.6 6.5 3.3Industry -0.9 3.2 0.9 3.9
Manufacturing 0.2 3.0 1.6 5.6Services 2.8 4.0 4.0 4.4
Private consumption 2.2 3.9 0.4 1.4General government consumption 0.6 3.4 6.7 -1.1Gross domestic investment -2.1 3.1 -2.0 2.3Imports of goods and services 3.4 7.7 -2.8 0.2
Note: 2000 data are preliminary estimates.
* The diamonds show four key indicators in the country (in bold) compared with its income-group average. If data are missing, the diamond willbe incomplete.
-20
-10
0
10
20
95 96 97 98 99 00
GDI GDP
Growth of investment and GDP (%)
Philippines
Lower-middle-income group
Development diamond*
Life expectancy
Access to improved water source
GNIpercapita
Grossprimary
enrollment
-30
-15
0
15
30
95 96 97 98 99 00
Exports Imports
Growth of exports and imports (%)
Philippines
Lower-middle-income group
Economic ratios*
Trade
Domesticsavings
Investment
Indebtedness
Kondo
G-29

Philippines
PRICES and GOVERNMENT FINANCE1980 1990 1999 2000
Domestic prices(% change)Consumer prices .. 14.2 6.7 4.3Implicit GDP deflator 14.3 13.0 8.0 6.7
Government finance(% of GDP, includes current grants)Current revenue .. 16.8 25.7 23.4Current budget balance .. 0.3 2.8 1.9Overall surplus/deficit .. -3.5 -2.7 -3.6
TRADE1980 1990 1999 2000
(US$ millions)Total exports (fob) .. 8,186 34,210 37,295
n.a. .. .. .. ..n.a. .. .. .. ..Manufactures .. 5,706 31,097 33,394
Total imports (cif) .. 12,206 36,276 36,102Food .. 656 1,982 1,256Fuel and energy .. 1,842 3,395 4,524Capital goods .. 3,122 14,555 15,011
Export price index (1995=100) .. 86 .. ..Import price index (1995=100) .. 94 .. ..Terms of trade (1995=100) .. 92 .. ..
BALANCE of PAYMENTS1980 1990 1999 2000
(US$ millions)Exports of goods and services 7,236 11,430 39,012 41,473Imports of goods and services 9,147 13,967 36,767 36,464Resource balance -1,911 -2,537 2,245 5,009
Net income -439 -744 4,104 3,786Net current transfers 447 714 481 430
Current account balance -1,903 -2,567 6,830 9,225
Financing items (net) 2,794 2,474 -2,889 -9,645Changes in net reserves -891 93 -3,941 420
Memo:Reserves including gold (US$ millions) .. 2,048 14,987 14,910Conversion rate (DEC, local/US$) 7.5 24.3 39.1 44.2
EXTERNAL DEBT and RESOURCE FLOWS1980 1990 1999 2000
(US$ millions)Total debt outstanding and disbursed 17,417 30,580 52,022 51,872
IBRD 926 3,943 4,040 3,627IDA 34 101 206 207
Total debt service 2,183 3,590 6,732 6,832IBRD 106 597 641 572IDA 0 2 4 5
Composition of net resource flowsOfficial grants 59 362 170 ..Official creditors 367 935 -130 -215Private creditors 946 109 3,920 2,138Foreign direct investment -106 530 573 ..Portfolio equity 0 0 422 ..
World Bank programCommitments 695 1,008 208 255Disbursements 230 507 164 162Principal repayments 33 302 387 352Net flows 197 206 -223 -190Interest payments 73 297 258 225Net transfers 124 -91 -481 -415
The World Bank Group: http://www.worldbank.org/data/ 10/3/01
-10
-5
0
5
10
15
94 95 96 97 98 99 00
Current account balance to GDP (%)
0
10,000
20,000
30,000
40,000
94 95 96 97 98 99 00
Exports Imports
Export and import levels (US$ mill.)
0
5
10
15
95 96 97 98 99 00
GDP deflator CPI
Inflation (%)
G: 5,948A: 3,627
D: 3,281
C: 2,032B: 207
F: 24,415
E: 12,362
Composition of 2000 debt (US$ mill.)
A - IBRDB - IDAC - IMF
D - Other multilateralE - BilateralF - PrivateG - Short-term
Kondo
G-30

Philippines Social IndicatorsLatest single year Same region/income group
East Lower-
Asia & middle-1970-75 1980-85 1993-99 Pacific income
POPULATION Total population, mid-year (millions) 43.1 54.7 74.3 1,836.6 2,093.0 Growth rate (% annual average for period) 2.8 2.5 2.2 1.2 1.1Urban population (% of population) 35.6 43.0 57.7 34.5 42.9Total fertility rate (births per woman) 5.2 4.5 3.5 2.1 2.1
POVERTY(% of population)National headcount index .. 52.0 36.8 .. .. Urban headcount index .. 42.0 21.5 .. .. Rural headcount index .. 58.0 50.7 .. ..
INCOMEGNI per capita (US$) 370 520 1,050 1,010 1,200Consumer price index (1995=100) 10 43 135 136 137Food price index (1995=100) .. 45 130 .. ..
INCOME/CONSUMPTION DISTRIBUTIONGini index .. .. 46.2 .. ..Lowest quintile (% of income or consumption) 5.0 .. 5.4 .. ..Highest quintile (% of income or consumption) 56.0 .. 52.3 .. ..
SOCIAL INDICATORSPublic expenditure Health (% of GDP) .. .. 1.7 1.7 2.3 Education (% of GNI) 2.0 1.4 3.4 2.9 4.8 Social security and welfare (% of GDP) .. .. .. .. ..Net primary school enrollment rate(% of age group) Total 97 96 101 100 99 Male 94 97 .. 100 100 Female 99 96 .. 100 99Access to an improved water source(% of population) Total .. 65 87 75 80 Urban .. .. 92 93 94 Rural .. .. 80 66 69Immunization rate(% under 12 months) Measles .. 49 87 83 87 DPT .. 59 87 82 87Child malnutrition (% under 5 years) 50 33 30 12 9Life expectancy at birth(years) Total 59 63 69 69 69 Male 58 61 67 67 67 Female 61 65 71 71 72Mortality Infant (per 1,000 live births) 58 46 31 35 32 Under 5 (per 1,000 live births) 90 72 41 44 40 Adult (15-59) Male (per 1,000 population) 376 323 193 184 191 Female (per 1,000 population) 314 259 146 141 133 Maternal (per 100,000 live births) .. .. 170 .. ..Births attended by skilled health staff (%) 46 57 56 .. ..
Note: 0 or 0.0 means zero or less than half the unit shown. Net enrollment ratios exceeding 100 indicate discrepanciesbetween the estimates of school-age population and reported enrollment data. Latest year for access to improved watersource data is 2000.
2001 World Development Indicators CD-ROM, World Bank
Kondo
G-31

COUNTRY REPORT
Singapore

Country Report : Singapore
H - 1
1. Background
Singapore does not have any production of rice. There are some private investors from Singapore whoinvest in rice production in Myanmar and Vietnam and importing into Singapore. For the purpose ofthis study, this will not be counted as Singapore's production. However, this is an interestingdevelopment which could have an impact on the future arrangement for trade and investment.
2. Population
Singapore has about 4.1 million people. The statistic shows that there is an increase in the populationduring the past 5 years. The increase in the foreigner is an interesting component of the populationincrease.
3. Rice Consumption
The estimated rice consumption per capita in 2001 is about 68 kg. annum which is about the same asin Japan. The total consumption is about 447 thousand tons. level of consumption is However, thismethod of calculation may not be totally reflective of the amount of rice consumed in Singaporebecause import and export statistics to certain country are not reflected in the annual statistics.
Table 1: Rice Balance in Singapore ( Unit : 1,000 tons )Supply Demand
BeginningStock
Production
Import Total Consumption
Export Endingstock
Total
1998/1999 37 - 404 441 400 4 44 4481999/2000 44 - 355 399 352 3 42 3972000/2001 42 - 448 490 447 1 51 499Source: Import/Export - Trade Development Board.
4. Rice Marketing Channel
The import and distribution of rice in Singapore is governed by the Price Control Act (See Annex).
The marketing system for rice consist of importer, wholesalers, packers and retailers. The distributionchain is dominated by rice importers who often also act as the wholesaler due to the small domesticmarket. There are less than 30 rice importers/wholesalers in Singapore. With the exception of 1 or 2large retailers who import directly, most of the retailers purchase their rice from theimporter/wholesaler who will also pack the rice for retailers' in-house brands. The importers willpacked the rice overseas prior to importing to Singapore in view of the high cost of labour inSingapore.
Most of the rice importers are private companies but there are some government linked companies (e.g.NTUC) as well.

Country Report : Singapore
H - 2
There is a rice association in Singapore. It serves mainly as a platform for the rice traders to networkamong themselves and with the visiting delegations.
A government official opined that the importers in Singapore seldom rely on any pricing mechanismin the commodities future market. Instead, importers count on their long standing relationship with thesuppliers in price negotiation. As the Singapore importers are relatively small in size compared toother international players, they are usually a price taker.
5. Rice Imports
About 400 thousand tons of rice is imported (see Table 1). About one third of the rice import isFragrant rice and another third are broken rice. The broken is mostly used for further processing intofood (such as noodle) and disserts.
This patter of consumption is associated with the high income level of the Singapore population. It isinteresting to observe that the proportion of glutinous rice consumed is high (almost 10 times that ofBasmati). This could be the consumption of migrant worker (from Thailand) and also from theincrease in its use for disserts.
Table 2: Import of Rice by Types1999 2000 2001
Quantity Value Quantity Value Quantity ValueFragrant Rice 162.43 129.27 159.37 139.85 163.23 109.43Glutinous 35.07 19.37 23.99 12.22 24.05 10.93Basmati 3.36 3.99 3.29 3.65 3.50 3.89Broken 90.59 34.71 80.33 25.67 171.30 48.44
5% 31.51 13.62 26.27 9.54 23.83 7.6410% 12.43 5.62 7.57 2.83 4.89 1.54
Others 96.24 57.28 73.03 42.79 80.30 40.83Total 431.64 263.87 373.84 236.55 471.10 222.69
Quantity in 1,000 tons Value in million $Source: Trade and Development Board.
6. Import/Export Control System
An importer or wholesaler of rice is required to apply for a license from Singapore TradeDevelopment Board (TDB). TDB issues 3 type of licenses:
a) import for re-exportb) import for local consumptionc) wholesaler
Importers and wholesalers are licensed separately. In other words, an importer needs to apply for awholesaler license to conduit wholesale activities.

Country Report : Singapore
H - 3
All applicants for rice license, have to be a business entity registered in Singapore. An importer forlocal consumption needs to meet additional criteria of having a minimum PUC of S$ 40,000 and localownership (Singaporean & Singapore Permanent Resident) of at least 51%. Foreign companies will beconsidered on a case by case basis.
License holders have to report to TDB movement of rice in and out of Singapore. They also have toreport their inventory levels to TDB on a regular basis.
7. Price Control
The Price Control Act provides the legal basis on which the government controls the prices, movementof goods, dealing in goods, display of prices and punitive actions. Rice of all descriptions is declaredas a controlled item requiring license to import and wholesale under Price Control Order.
Government intervention on rice pricesAlthough the Singapore Government can control the prices, it has never been practiced. The provisionis included in preparation for emergency situations. The prices of the rice in Singapore have beenfairly stable and prices are set by market forces.
8. Reserve Stock
The Price Control Order also lists participation in stockpile as a condition of the license. Theimporters of rice for local consumption have to participate in the Rice Stockpile Scheme (RSS) andsign the Rice Stockpile Agreement. The RSS is operated under the legal framework of Price ControlAct (Cap 244) and Price Control Order 1990.
Type of riceNot all types of rice need to be stockpiled. In general all types and grades of white rice except Basmatirice need to be stockpiled.
QuantitiesUnder the RSS, stockpile participant pre-commit on the quantity they wish to import monthly for localdistribution. The minimum quantity is 50 tonnes. In addition, they are required to stockpile twice themonthly import in a government-designated warehouse as their contribution to the national stockpile.Participants are allowed to adjust their monthly import upon written application to TDB.
Participants are expected to rotate their stockpile or the costs of replacing the damaged rice from thestockpile will be borne by them. The designated warehouse operator is responsible for checking thequality of the rice.

Country Report : Singapore
H - 4
CostThe title of the rice while under stockpile belongs to the participants. The costs of storing and othercharges (e.g. fumigation) related to the stockpile is also borne by the importers. In addition, theimporter has to lodge a banker's guarantee of S$100 for every tonne of its pre-committed import orS$5000, which ever is higher. As provided in the Rice stockpile agreement, the government has theright to buy rice from the participants at a fair & reasonable price.
ControlTo maintain control, TDB will conduct spot-check on the stockpile and on the participants in additionfrom operational reports from the designated warehouse operator. Offender can be compounded orcharged under the Act.
The importers are required to join the RSS for at least 6 months before they can terminate the licenses.They need to give 2 months notification of the termination. Only upon the expiry of the notice, canthey sell half of their stockpile quantity/trading stock. And the other half, one month thereafter.
StorageThe current designated warehouse operator is Singapore Storage & Warehouse Pte Ltd. Other than therequired stockpile quantity, importers are free to keep their trading and excess stock in otherwarehouses.
Level of ReserveThe level of reserve is varied depending on the supply and demand of the domestic rice market. It isestimated to range between 3 to 6 months of domestic consumption.
9. Government Commitment
Bilateral arrangementGeneral agreement with Thailand to facilitate the sale of rice to Singapore at market price whenneeded.
Commitment in WTOAs a member of WTO, Singapore has bound the import tariff rate at 10% compared to the base rate of27%.
Rice Country Tariff Rate %HS 1006.10 Base 27
Bound 10HS 1006.20 Base 27
Bound 10HS 1006.30 Base 27
Bound 10HS 1006.40 Base 27
Bound 10

Country Report : Singapore
H - 5
Annexes
1. Singapore at a glance & Social Indicators (World Bank Data)
2. Price Control Act (Chapter 244)

Singapore at a glance 9/19/01
POVERTY and SOCIAL High-Singapore income
2000Population, mid-year (millions) 4.0 903GNI per capita (Atlas method, US$) 24,740 27,510GNI (Atlas method, US$ billions) 99.4 24,829
Average annual growth, 1994-00
Population (%) 2.7 0.7Labor force (%) 2.6 0.9
Most recent estimate (latest year available, 1994-00)
Poverty (% of population below national poverty line) .. ..Urban population (% of total population) 100 77Life expectancy at birth (years) 78 78Infant mortality (per 1,000 live births) 3 6Child malnutrition (% of children under 5) .. ..Access to an improved water source (% of population) 100 99Illiteracy (% of population age 15+) 8 < 5Gross primary enrollment (% of school-age population) 94 103
Male 95 104Female 93 103
KEY ECONOMIC RATIOS and LONG-TERM TRENDS
1980 1990 1999 2000
GDP (US$ billions) 11.7 36.7 83.8 92.3
Gross domestic investment/GDP 46.3 36.6 32.4 31.3Exports of goods and services/GDP 215.4 201.8 .. ..Gross domestic savings/GDP 38.1 43.6 51.8 49.8Gross national savings/GDP 33.0 45.1 58.3 ..
Current account balance/GDP -13.3 8.5 25.4 ..Interest payments/GDP .. .. .. ..Total debt/GDP .. .. .. ..Total debt service/exports .. .. .. ..Present value of debt/GDP .. .. .. ..Present value of debt/exports .. .. .. ..
1980-90 1990-00 1999 2000 2000-04(average annual growth)GDP 6.7 7.8 5.9 9.9 ..GDP per capita 4.7 4.7 5.1 8.1 ..Exports of goods and services .. .. .. .. ..
STRUCTURE of the ECONOMY1980 1990 1999 2000
(% of GDP)Agriculture 1.6 0.4 0.2 0.1Industry 37.7 34.4 34.6 34.3
Manufacturing 29.1 27.1 25.1 26.5Services 60.8 65.3 65.2 65.6
Private consumption 52.2 46.2 38.4 39.8General government consumption 9.8 10.2 9.8 10.5Imports of goods and services 223.6 194.9 .. ..
1980-90 1990-00 1999 2000(average annual growth)Agriculture -5.3 -1.6 -1.1 -1.5Industry 5.2 7.9 7.1 10.2
Manufacturing 6.6 7.1 13.6 15.2Services 7.6 7.8 5.2 9.8
Private consumption 6.7 5.2 5.0 9.7General government consumption 6.6 8.6 5.0 13.7Gross domestic investment 3.1 7.8 5.3 11.2Imports of goods and services .. .. .. ..
Note: 2000 data are preliminary estimates.This table was produced from the Development Economics central database.
* The diamonds show four key indicators in the country (in bold) compared with its income-group average. If data are missing, the diamond willbe incomplete.
-20
-10
0
10
20
95 96 97 98 99 00
GDI GDP
Growth of investment and GDP (%)
Singapore
High-income group
Development diamond*
Life expectancy
Access to improved water source
GNIpercapita
Grossprimary
enrollment
Singapore
High-income group
Economic ratios*
Trade
Domesticsavings
Investment
Indebtedness
Kondo
H-6

Singapore
PRICES and GOVERNMENT FINANCE1980 1990 1999 2000
Domestic prices(% change)Consumer prices 8.5 3.5 0.0 1.4Implicit GDP deflator 11.5 4.8 -3.1 1.8
Government finance(% of GDP, includes current grants)Current revenue .. .. .. ..Current budget balance .. .. .. ..Overall surplus/deficit 2.1 10.8 .. ..
TRADE1980 1990 1999 2000
(US$ millions)Total exports (fob) 19,376 52,752 114,689 137,953
Food and agricultural raw materials 3,563 4,089 .. ..Fuels, ores, and metals 5,359 10,220 .. ..Manufactures 9,048 37,718 .. ..
Total imports (cif) 24,007 60,899 111,060 134,675Food 2,035 3,675 .. ..Fuel and energy 6,882 9,631 .. ..Manufactures 12,990 44,412 .. ..
Export price index (1995=100) 103 96 .. ..Import price index (1995=100) 84 86 .. ..Terms of trade (1995=100) 122 111 .. ..
BALANCE of PAYMENTS1980 1990 1999 2000
(US$ millions)Exports of goods and services 24,285 67,489 139,333 ..Imports of goods and services 25,312 64,953 123,216 ..Resource balance -1,027 2,537 16,117 ..
Net income -429 1,006 6,300 ..Net current transfers -106 -421 -1,163 ..
Current account balance -1,563 3,122 21,254 ..
Financing items (net) .. .. .. ..Changes in net reserves .. .. .. ..
Memo:Reserves including gold (US$ millions) 6,567 27,748 76,843 80,127Conversion rate (DEC, local/US$) 2.1 1.8 1.7 1.7
EXTERNAL DEBT and RESOURCE FLOWS1980 1990 1999 2000
(US$ millions)Total debt outstanding and disbursed .. .. .. ..
IBRD .. .. .. ..IDA .. .. .. ..
Total debt service .. .. .. ..IBRD .. .. .. ..IDA .. .. .. ..
Composition of net resource flowsOfficial grants .. .. .. ..Official creditors .. .. .. ..Private creditors .. .. .. ..Foreign direct investment 1,236 5,575 6,984 ..Portfolio equity .. .. .. ..
World Bank programCommitments .. .. .. ..Disbursements .. .. .. ..Principal repayments .. .. .. ..Net flows .. .. .. ..Interest payments .. .. .. ..Net transfers .. .. .. ..
The World Bank Group: http://www.worldbank.org/data/ 9/19/01
0
10
20
30
94 95 96 97 98 99 00
Current account balance to GDP (%)
0
50,000
100,000
150,000
94 95 96 97 98 99 00
Exports Imports
Export and import levels (US$ mill.)
-5
0
5
95 96 97 98 99 00
GDP deflator CPI
Inflation (%)
Kondo
H-7

Singapore Social IndicatorsLatest single year Same region/income group
High-1970-75 1980-85 1993-99 income
POPULATION Total population, mid-year (millions) 2.3 2.7 4.0 896.3 Growth rate (% annual average for period) 1.7 2.5 2.9 0.7Urban population (% of population) 100.0 100.0 100.0 76.8Total fertility rate (births per woman) 2.1 1.6 1.5 1.7
POVERTY(% of population)National headcount index .. .. .. .. Urban headcount index .. .. .. .. Rural headcount index .. .. .. ..
INCOMEGNI per capita (US$) 2,770 6,870 24,150 26,440Consumer price index (1995=100) 59 83 103 107Food price index (1995=100) .. 89 105 ..
INCOME/CONSUMPTION DISTRIBUTIONGini index .. .. .. ..Lowest quintile (% of income or consumption) .. .. .. ..Highest quintile (% of income or consumption) .. .. .. ..
SOCIAL INDICATORSPublic expenditure Health (% of GDP) .. .. 1.2 6.1 Education (% of GNI) 2.9 4.4 3.0 5.5 Social security and welfare (% of GDP) 0.3 0.4 0.2 9.8Net primary school enrollment rate(% of age group) Total 101 99 93 95 Male 101 100 93 95 Female 100 99 92 95Access to an improved water source(% of population) Total .. 100 100 .. Urban .. 100 100 .. Rural .. .. .. ..Immunization rate(% under 12 months) Measles .. 75 86 89 DPT .. 78 94 91Child malnutrition (% under 5 years) .. .. .. ..Life expectancy at birth(years) Total 70 73 78 78 Male 68 70 76 75 Female 72 76 80 81Mortality Infant (per 1,000 live births) 14 9 3 6 Under 5 (per 1,000 live births) 27 13 4 6 Adult (15-59) Male (per 1,000 population) 232 199 130 125 Female (per 1,000 population) 138 115 72 63 Maternal (per 100,000 live births) .. .. 6 ..Births attended by skilled health staff (%) .. 100 100 ..
Note: 0 or 0.0 means zero or less than half the unit shown. Net enrollment ratios exceeding 100 indicate discrepanciesbetween the estimates of school-age population and reported enrollment data. Latest year for access to improved watersource data is 2000.
2001 World Development Indicators CD-ROM, World Bank
Kondo
H-8

Country Report : Singapore
H - 9
Annex
PRICE CONTROL ACT
(CHAPTER 244)
Short title.1. This Act may be cited as the Price Control Act.
Interpretation.2. In this Act, and in any rule or order made thereunder, unless the context otherwise requires —
"commission agent" means a person who acts as agent for another in relation to the purchase or sale ofgoods and is remunerated or to be remunerated by way of commission on the price, and includes anagent remunerated or to be remunerated partly by commission and partly in some other manner;
"controlled article" means any goods or classes of goods declared to be controlled articles undersection 5 (a);
"goods" includes all chattels personal other than things in action and money;
"maximum price" means the maximum price at which, under the provisions of this Act, goods may besold;
"offence under this Act" includes any act or omission declared to be an offence under this Act by anyorder or rule made under sections 5 and 18;
"Price Controller" means an officer appointed Price Controller under section 3 and includes anyperson appointed by the Minister to act in the place of the Price Controller during the PriceController’s absence from Singapore or his inability from illness or other causes to perform the dutiesof his office;
"Price Inspector" means any person appointed under section 3 (2) and includes a Chief Price Inspectorand an Assistant Price Inspector;
"price-regulated goods" means goods in respect of which maximum prices have been fixed undersection 4 and includes services for which a maximum has been fixed under that section;
"officer of customs" has the same meaning as in the Customs Act;
Cap. 70.
"sell" , with its grammatical variations and cognate expressions, includes an agreement to sell and anoffer to sell, and an offer to sell shall be deemed to include the exposing of goods for sale, the

Country Report : Singapore
H - 10
publication of a price list, the furnishing of a quotation, or any other act or notification whatsoever bywhich willingness to enter into any transaction of sale is expressed;
"selling price" means the actual net price charged to the purchaser of the goods concerned, less alldiscounts or other allowances;
"trader" includes any person who carries on the business of selling goods and any person carrying onbusiness in the course of which he supplies goods for the purpose of, or in pursuance of a contractmade by him for work, labour and materials.
Appointment of Price Controller and other officers.3. —(1) The Minister may appoint a Price Controller and such Deputy Price Controllers and AssistantPrice Controllers as he may think fit.
(2) The Price Controller may appoint such chief price inspectors, price inspectors or assistant priceinspectors for such areas as he may think fit.
(3) The Minister may appoint advisory committees to advise the Price Controller on questions relatingto the exercise of all or any of the powers conferred on the Price Controller by sections 4, 5 and 8.
Prices and charges.4. —(1) The Price Controller may from time to time by order published in the Gazette —
(a) fix maximum prices, which may include charges for delivery, for the sale of any goods either bydeclaring the maximum sale price, or by prescribing that the sale price of the goods shall not exceedthe price which they cost the seller, plus a stated sum or a stated percentage of that cost price, or byprescribing the manner in which the maximum sale price of the goods shall be ascertained;
(b) fix the maximum charge that may be made by any person for any service in relation to the supply,repair, maintenance, packing, carriage or storage of goods, which shall include the provision of suchmaterials as may be specified in the order;
(c) fix the maximum price, or prescribe the manner in which the maximum price shall be ascertained,of any secondhand goods, whether for sale by persons who trade in those goods, or by the privateowners of those goods; and
(d) prescribe what shall constitute a wholesale or retail quantity or transaction either generally or inrespect of any special class or classes of goods.
(2) Under this section the Price Controller may fix a maximum price or charge for service in respect ofany goods for one area which differs from the maximum price or the charge for services fixed foranother area in respect of like or similar goods.

Country Report : Singapore
H - 11
Control of movement, export and import of and dealing in specified goods.5. The Price Controller with the prior approval of the Minister may by order published in the Gazette—
(a) declare any goods or classes of goods to be controlled articles;
(b) prohibit the purchase, sale or barter of any controlled article for the purpose of resale in or exportfrom any area specified without his written permission;
(c) prohibit or control the import or export of any controlled article for the purpose of resale in orexport from any area specified without his written permission;
(d) prohibit or control the movement of controlled articles between any specified areas;
(e) limit the wholesale or retail dealing in any controlled article to persons holding licences or permitstherefor under this Act or any rules made thereunder;
(f) restrict the sale of any controlled article either by any individual or generally by all persons dealingin the article in any manner in which he thinks fit;
(g) prescribe such forms as he may think necessary in connection with the matters referred to inparagraphs (a) to (f); and
(h) declare any act or omission in contravention of the provisions of any order to be an offence underthis Act and prescribe penalties therefor provided that no penalty so prescribed shall exceed themaximum penalty prescribed by section 16 in corresponding circumstances.
Orders to be presented to Parliament.6. Any order made by the Price Controller under section 4, 5 or 8 shall be published in the Gazette andshall be presented to Parliament as soon as possible after publication and if a resolution is passedpursuant to a motion notice whereof has been given for a sitting day not later than the first availablesitting day of Parliament next after the expiry of one month from the date when an order was sopresented annulling the order or any part thereof as from a specified date, the order or such partthereof, as the case may be, shall thereupon become void as from that date but without prejudice toanything previously done thereunder or to the making of a new order.
Seller to display list of prices.7. Any person who deals in any price-regulated goods shall display in English and in any otherlanguage ordered by the Price Controller, in a prominent manner and in a conspicuous position so thatit can be easily read and is clearly legible to customers in those parts of his business premises whereprice-regulated goods are dealt in, a list of the current maximum prices of the price-regulated goods inwhich he deals and any such person who fails to do so shall be guilty of an offence.
Controller may order display of prices of any goods or class of goods.

Country Report : Singapore
H - 12
8. The Price Controller may by order published in the Gazette from time to time require any personwho sells by retail any goods or class of goods specified in the order to exhibit clearly andconspicuously in such manner as may be prescribed the price demanded by him for the sale of thosegoods and any person failing to comply with any such order shall be guilty of an offence.
Offence to sell above fixed price.9. —(1) Any person who sells any price-regulated goods or performs any service at a price whichexceeds the maximum price fixed therefor shall be guilty of an offence.
(2) Any person who knowingly purchases or offers to purchase any price-regulated goods or whoknowingly pays or offers to pay for a service a charge which exceeds the maximum charge fixedtherefor shall be guilty of an offence.
Refusal to sell goods.10. Any person carrying on a business in the course of which price-regulated goods are normally soldand who has in his possession a stock of such goods, who —
(a) falsely denies that he has those goods in his possession; or
(b) refuses, except with the permission of the Price Controller, to sell those goods in reasonablequantities,
shall be guilty of an offence:
Provided that it shall be a good defence to a charge under paragraph (b) that the accused hadreasonable grounds for believing that the purchaser was unable or unwilling to make immediatepayment of the price of the goods in cash.
General powers of Price Controller.11. The Price Controller or any Deputy Price Controller or any person authorised in writing by any ofthem is hereby empowered —
(a) to enter and inspect any premises in the occupation or under the control of any trader, manufacturer,producer, commission agent, clearing and forwarding agent or auctioneer;
(b) to examine any books, accounts or other documents relating to the trade or business of any trader,manufacturer, producer, commission agent, clearing and forwarding agent or auctioneer, and to requirea copy of any such book, account or other document or of the record of any transaction duly certifiedby the trader, manufacturer, producer, commission agent, clearing and forwarding agent or auctioneerto be produced to him, and further to require that any of those books, accounts or other documents bedeposited at his office for examination; and where any of those books, accounts or other documents orrecords are in a language other than the English language and he is satisfied that the trader,manufacturer, producer, commission agent, clearing and forwarding agent or auctioneer can provide orobtain a translation thereof in the English language, to require such a translation;

Country Report : Singapore
H - 13
(c) to require in such manner as he may consider sufficient, any trader, manufacturer, producer,commission agent, clearing and forwarding agent or auctioneer to furnish verbally or in writing and insuch form as may be required any information in relation to his trade or business; and
(d) to require any trader, manufacturer, producer or commission agent to submit to him samples of anygoods in which he deals.
Powers of arrest and seizure.12. —(1) A price inspector if so authorised by the Price Controller or any Deputy Price Controller inwriting or any police officer or officer of customs if so authorised by the Price Controller in writingmay —
(a) arrest without warrant any person whom he reasonably suspects of having committed an offenceunder this Act if such person refuses to furnish his name and address or furnishes an address outsideSingapore or there are reasonable grounds for believing that he has furnished a false name or addressor that he is likely to abscond:
Provided that when any person has been arrested as aforesaid he shall be thereafter dealt with asprovided by section 32 of the Criminal Procedure Code; and
Cap. 68.
(b) seize any article which he considers it necessary to seize in relation to the evidence necessary toestablish the commission of any such offence.
(2) A price inspector if so authorised by the Price Controller or a Deputy Price Controller and anypolice officer not below the rank of sergeant may without the order of the Public Prosecutor exercisethe special powers in relation to police investigations given by the Criminal Procedure Code in anyseizable case.
34/73.
(3) Any prosecution in respect of an offence under this Act may be conducted by the Public Prosecutoror by a Deputy Public Prosecutor or by the Price Controller or by any officer appointed under this Actor under the Control of Essential Supplies Act or by any police officer not below the rank of sergeant.
21/73.
Cap. 55.
Offence to obstruct authorities.13. Any person who obstructs any person authorised under this Act to enter and inspect any premisesor to examine any books, accounts or other documents, or any person who refuses or delays or fails toproduce any books, accounts or other documents or certified copies or translations thereof relating tohis trade or business, or who refuses to furnish any information or furnishes false information upon

Country Report : Singapore
H - 14
demand being made by a person authorised by this Act, or any person who fails to comply with anyorder given under this Act, shall be guilty of an offence.
Saving.14. No proceedings shall be instituted under this Act against any person duly authorised in that behalfby the Price Controller who has knowingly purchased goods at a price in excess of that fixed, or inexcess of the permitted price, or who has paid a charge for a service in excess of the fixed charge, withthe intention of procuring evidence for the purpose of prosecuting the seller for an offence under thisAct.
Attempts and abetments.15. —(1) Any person attempting to commit or abetting the commission of an offence under this Actshall be guilty of an offence.(2) The expressions “attempting to commit” and “abetting the commission of” an offence used insubsection (1) have the same meaning as they have in the Penal Code.
Cap. 224.
Penalties.16. —(1) Any person, other than a body corporate, but including a director or officer of a bodycorporate, who commits an offence under this Act shall be liable, where no other penalty isspecifically provided for such an offence, to a fine not exceeding $2,000 or to imprisonment for a termnot exceeding 2 years or to both, and in the case of a second or subsequent offence to a fine notexceeding $20,000 or to imprisonment for a term not exceeding 5 years or to both.
(2) Any body corporate which commits an offence under this Act shall be liable on conviction to a finenot exceeding $10,000 and in the case of a second or subsequent offence to a fine not exceeding$20,000.
(3) Where a trader or commission agent is convicted of an offence under this Act the court by whichhe is so convicted may, in addition to any other penalty, make an order debarring him or any firm ofwhich he is a partner or any corporation of which he is an officer, from carrying on business for suchperiod as the court may determine. Any person who fails to comply with any such order shall be guiltyof an offence and shall be liable on conviction to a fine not exceeding $20,000 or to imprisonment fora term not exceeding one year or to both.
(4) Where a person charged with an offence under this Act is a body corporate every person who, atthe time of the commission of the offence, was a director or officer of the body corporate may becharged jointly in the same proceedings with the body corporate, and where the body corporate isconvicted of the offence, every such director or officer shall be deemed to be guilty of that offenceunless he proves that the offence was committed without his knowledge or that he exercised all duediligence to prevent the commission of the offence.

Country Report : Singapore
H - 15
(5) In any proceedings under subsection (4) jointly against a body corporate and a director or officerthereof for an offence under this Act any evidence that the body corporate was guilty of the offenceshall be deemed to be evidence that the director or officer was guilty of that offence.
(6) Any person who would have been liable under any of the provisions of this Act to any penalty foranything done or omitted if the thing had been done or omitted by him personally shall be liable to thesame penalty if the thing has been done or omitted by his partner, agent or servant, unless he proves tothe satisfaction of the court that he took all reasonable precautions to prevent the doing or omission ofthe thing.
(7) A District Court shall have power to try any offence under this Act and may impose the fullpenalty provided by this Act or by any order or rule made under this Act.
Delegation of powers.17. The Price Controller may in writing delegate all or any of his powers, duties or functions under theprovisions of this Act to any Deputy Price Controller, Assistant Price Controller, or any other personapproved by the Minister, and may at any time revoke or vary such a delegation:
Provided that no such delegation shall be deemed to divest the Price Controller of all or any of hispowers, duties or functions and he may if he thinks fit exercise such powers, duties or functions,notwithstanding the fact that he has so delegated them.
Rules.18. —(1) The Minister may from time to time make rules generally to give effect to the provisions ofthis Act and by such rules may confer upon the Price Controller such powers as he thinks fit.
(2) Without prejudice to the generality of subsection (1) the Minister may by such rules —
(a) provide for the keeping of books of account and other records relating to any trade or business inthe course of which price-regulated goods or controlled articles are sold;
(b) prescribe the manner in which such books and records shall be disposed of or preserved;
(c) prescribe such invoices as he may think fit to be supplied to purchasers by any person selling price-regulated goods or controlled articles;
(d) empower the Price Controller to certify any fact in relation to any sale of price-regulated goods orcontrolled articles and provide for the admissibility of any such certificate in evidence in anyproceedings instituted under this Act;
(e) prescribe marks or labels to be affixed to price-regulated goods or controlled articles or containersof such price-regulated goods or controlled articles indicating the quality, grade, price or place oforigin of such price-regulated goods or controlled articles; and

Country Report : Singapore
H - 16
(f) declare any act or omission in contravention of the provisions of any rule to be an offence underthis Act and prescribe penalties therefor:
Provided that no penalty so prescribed shall exceed the maximum penalty prescribed by section 16 incorresponding circumstances.
(3) Any rules made by the Minister under this Act shall be published in the Gazette.
(4) Such rules shall be presented to Parliament as soon as possible after publication.
(5) Such rules shall remain in force until disapproved or altered by a resolution of Parliament.
(6) Any rule altered by a resolution of Parliament shall come into force as altered from the date of thepassing of the resolution and shall have the same force and effect as if enacted in this Act.
Forms.19. The Price Controller may prescribe forms for use under this Act.

COUNTRY REPORT
Thailand

Country Report : Thailand
I - 1
1. Rice Production
Thailand in 2001/02, ranks sixth in the world in terms of rice production volume, trailing behind China,India, Indonesia, Bangladesh, and Vietnam.
World Rice Production (1998/99 – 2001/02)
Country 1998/99 1999/00 2000/01 2001/02
China 198,714 198,480 187,910 186,000India 129,013 134,223 129,463 130,513Indonesia 50,791 52,919 50,633 51,424Bangladesh 29,784 34,602 36,004 35,254Vietnam 30,467 31,706 31,106 31,818Thailand 23,000 25,000 25,500 1/ 25,607Burma 16,034 17,000 17,000 17,000Philippines 10,268 11,957 12,454 12,462Japan 11,201 11,470 11,863 11,676Brazil 11,582 11,424 10,368 10,588United States 8,530 9,345 8,657 8,991Korea, South 6,800 7,066 7,199 7,211Pakistan 7,012 7,735 7,051 6,751Egypt 4,198 5,826 6,000 6,000EU 2,694 2,702 2,462 2,701Taiwan 1,859 1,986 1,906 1,965Australia 1,362 1,101 1,761 1,399Others 42,252 42,879 41,448 41,850World Total 585,589 607,431 588,785 589,210Units : Thousand metric tons
Source: USDA, Foreign Agricultural Services (FAS), August 2001
1/ Thailand Ministry of Agriculture and Cooperative (MOAC)
In general, after a drop in world’s rice production in 2000/01 crop year, global rice output willgradually pick up the speed. In 2001/02, the USDA predicts a slight increase in global rice productionto 589.103 million metric tons, up from 588.785 million metric tons. While Thai rice production in2001/02, according to MOAC is expected to slightly increase at 25.607 million metric tons.
2. Rice Consumption
Thailand consumes 9.9 million metric tons in 2000/01 and is predicted to increase the consumption toapproximately 10 million metric tons in 2001/02. The Thai consumption trend is in line with theworld rice consumption that has increased for the last three years. This upward trend is predicted tocontinue in 2000/01, when the world will consume up to 405.856 million metric tons of rice up from400.971 million metric tons. China, the world’s most populous country, produces and also consumesthe most rice. In general, rice consumption has increased in every country from year to year.

Country Report : Thailand
I - 2
World Rice Consumption (1998/99 – 2001/02)
Country 1998/99 1999/00 2000/01 2001/02
China 136,000 133,763 134,337 136,110India 81,160 82,450 83,500 85,000Indonesia 35,504 25,400 35,877 36,358Bangladesh 20,750 23,666 23,950 24,025Vietnam 16,613 16,767 16,958 17,100Burma 9,276 9,330 9,350 9,450Japan 9,100 9,450 9,300 9,300Thailand 8,900 9,600 9,900 10,000Philippines 8,000 8,400 8,750 8,815Brazil 8,180 7,956 7,958 8,000World Total 388,792 398,518 400,971 405,856
Unit: Thousand metric tons
Source: USDA, Foreign Agricultural Service (FAS), August 2001.
3. Exports
Thailand is projected to remain the world’s top rice exporter for the year 2001, according to the USDA.Following closely behind is Vietnam while the United States is ranked third. Thai rice exports wereexpected to reach 7.55 million metric tons in 2001, representing a 14.4 percent increase from 6.54million tons recorded in 2000. However, in value terms, rice exports generated just US$ 1.57 billion,an 8.8 per cent drop when compared with US$ 1.72 billion recorded in 2000. This is being attributedto the global decline in prices during 2001. The growth in export volume during 2001 can beattributed to several factors. Regular sales and shipments were made to long established markets inAfrica and the Middle East, while there was a high level of production and plenty of stocks. The priceof Thai rice became more competitive when compared with Vietnamese rice, while the governmentstepped in to the market through its paddy intervention program that is budgeted at Baht 20,000million (US$ 450 million) annually.
World Rice Export (1998-2002)
Country 1998 1999 2000 2001 2002
Thailand 6,367 6,679 6,610 1/ 7,550 1/ 7,000Vietnam 3,776 4,555 3,370 4,000 4,300United States 3,165 2,650 2,756 2,650 2,650Pakistan 1,800 1,837 2,026 2,250 2,000China 3,734 2,708 2,951 1,800 2,000India 4,491 2,554 1,449 800 1,000Uruguay 639 685 642 700 650Australia 542 661 617 675 700Burma 94 57 159 350 250EU 346 350 308 350 350Argentina 589 654 473 275 250

Country Report : Thailand
I - 3
Country 1998 1999 2000 2001 2002
Guyana 250 300 167 175 150Others 1,477 1,372 785 940 524World Total 27,270 25,062 22.939 2,255 22,439
Units: Thousand metric tons
Source: USDA, Foreign Agricultural Service (FAS), August 2001.
1/ Thailand, Ministry of Commerce, as of December
Thailand has historically competed with the United States when its come to export of higher varietiesto the E.U, the Middle East and South Africa, while Vietnam, India and Pakistan are Thailand’sgreatest rivals when it comes to exporting low to medium quality varieties.
Due to many emerging markets and an increasingly intense global market competition, Thailand’smajor importers have changed positions from 1999 to 2000. Thailand’s biggest customer, Indonesia,had abandoned its switched from importing rice from Thailand to Vietnam. As a result, in 2000,Indonesia’s imports dropped tremendously from 1,119,826 metric tons to a mere 250,361 metric tons.Nigeria, Senegal, and Iran, in 2000, had taken the first, second and third places as Thailand’s biggestexport destinations. In 2001, most of Thailand biggest customers will be in African region.
Thai Rice Export Classified by DestinationsCountry 1997 1998 1999 2000 2001(Est.)Nigeria 584,567 517,828 683,880 574,151 1,600,000Senegal 90,500 174,339 368,711 625,766 820,000Iran 361,785 369,179 335,895 611,198 320,000South Africa 186,593 293,218 321,082 428,910 340,000Malaysia 485,032 354,905 317,997 330,519 350,000Iraq 187,055 160,150 214,983 288,225China, P.R. 320,887 254,799 174,087 272,298Singapore 274,150 254,365 285,040 263,167 290,000Hong Kong 248,042 228,098 257,154 254,215 270,000Indonesia 513,944 1,736,452 1,119,826 250,361 450,000U.S.A 214,836 224,298 243,548 243,705 280,000Japan 169,320 69,565 140,146 143,617Yemen 68,900 89,829 89,829 140,650United Arab Emirate 28,748 44,643 209,756 140,098Benin 50,604 26,540 122,159 100,250Ghana 30,342 46,130 94,439 93,255Saudi Arabia 66,686 66,146 72,733 67,705Ivory coast 16,664 70,033 119,201 57,005 310,000Togo 132,323 212,993 211,519 53,076Philippines 11,924 89,750 93,477 26,644
Quantity(Metric tons)Source: Department of Foreign Trade, Thailand Ministry of Commerce

Country Report : Thailand
I - 4
Export prospects for 2002The volume of rice traded worldwide in 2002 is expected to reach 23 million tons. Despite intensecompetition in the world market, Thailand’s rice exports should continue to grow. Lower output willlead to a decrease in rice stocks worldwide amid an increase in consumption. Moreover, China’saccession into the World Trade Organization (WTO) should favor Thai rice exports through a muchlarger quota. In light of this ,Thailand’s total rice exports this year are unlikely to fall below 7.00million tons, according to Thailand’s Ministry of Commerce.
4. Rice Stock
Thai Rice Stock Balance (paddy basis)Supply Demand
Year BeginningStock Production Total
LocalConsump
tionExport Ending
Stock Total
1996/97 3.344 22.332 25.676 13.719 7.886(5.025)
4.071 25.676
1997/98 4.071 23.580 27.651 13.651 9.992(6.597)
4.008 27.651
1998/99 4.008 22.999 27.007 13.389 10.093(6.661)
3.525 27.007
1999/00 3.525 24.172 27.697 13.600 9.232(6.093)
4.865 27.697
2000/01 4.865 25.608 30.473 14.163 10.590(6.989)
5.720 30.473
Inc.(%) 6.24 1.67 3.50 0.60 5.24 9.13 3.50Unit: Million tons in paddy
Note: In ( ) milled rice basis
Source: Thai Chamber of Commerce
With the global market share of 23%, Thailand produced approximately 25 million metric tons of ricein the year 2000/01. Local consumption consumed 55% of production or 14.16 million metric tons ofpaddy rice. About 10.59 million metric tons of paddy rice or an equivalent of 6.989 million metrictons of milled rice were expected to export. Thai rice reserve at the end of 2000/01 is expected at 5.72million tons of paddy rice.
5. Present Situation of Rice in Thailand
5.1 Rice Growing
In 2001, Thailand’s Rice Growing area amount to 65.639 million rai (6.25 rai = 1 hectare). Riceproduction is scattered throughout the country’s six major regions:
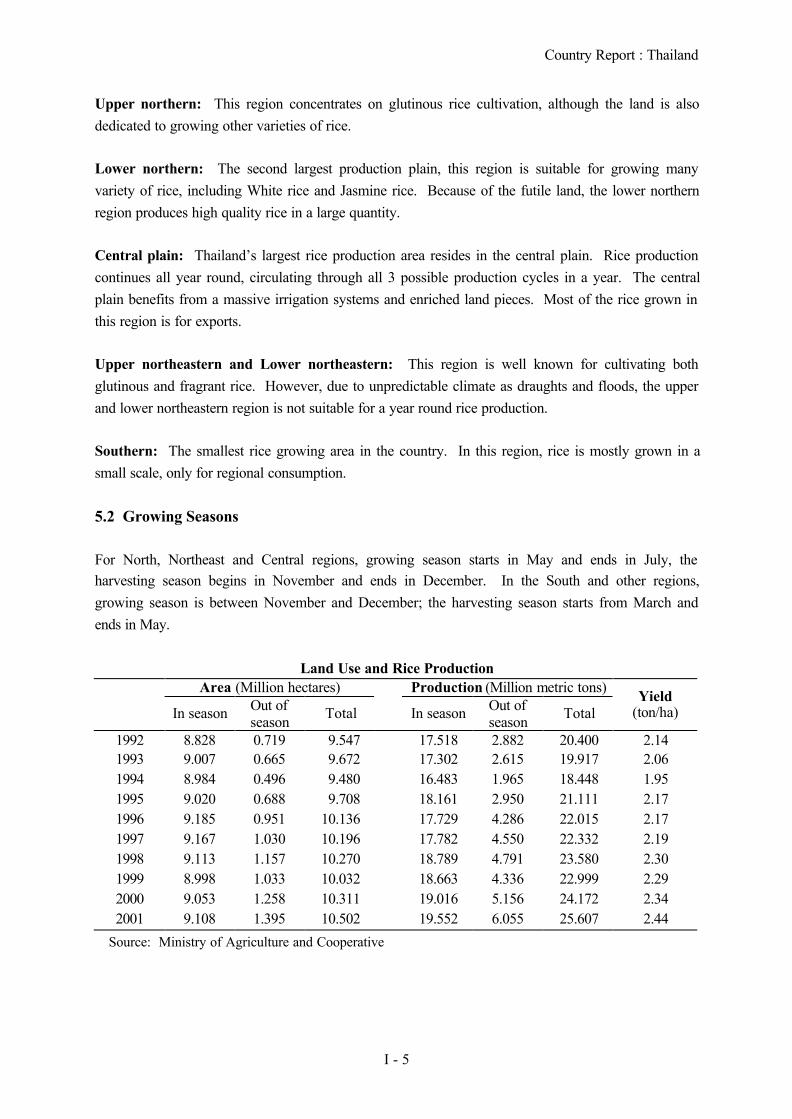
Country Report : Thailand
I - 5
Upper northern: This region concentrates on glutinous rice cultivation, although the land is alsodedicated to growing other varieties of rice.
Lower northern: The second largest production plain, this region is suitable for growing manyvariety of rice, including White rice and Jasmine rice. Because of the futile land, the lower northernregion produces high quality rice in a large quantity.
Central plain: Thailand’s largest rice production area resides in the central plain. Rice productioncontinues all year round, circulating through all 3 possible production cycles in a year. The centralplain benefits from a massive irrigation systems and enriched land pieces. Most of the rice grown inthis region is for exports.
Upper northeastern and Lower northeastern: This region is well known for cultivating bothglutinous and fragrant rice. However, due to unpredictable climate as draughts and floods, the upperand lower northeastern region is not suitable for a year round rice production.
Southern: The smallest rice growing area in the country. In this region, rice is mostly grown in asmall scale, only for regional consumption.
5.2 Growing Seasons
For North, Northeast and Central regions, growing season starts in May and ends in July, theharvesting season begins in November and ends in December. In the South and other regions,growing season is between November and December; the harvesting season starts from March andends in May.
Land Use and Rice ProductionArea (Million hectares) Production (Million metric tons)
In season Out ofseason Total In season Out of
season TotalYield
(ton/ha)
1992 8.828 0.719 9.547 17.518 2.882 20.400 2.141993 9.007 0.665 9.672 17.302 2.615 19.917 2.061994 8.984 0.496 9.480 16.483 1.965 18.448 1.951995 9.020 0.688 9.708 18.161 2.950 21.111 2.171996 9.185 0.951 10.136 17.729 4.286 22.015 2.171997 9.167 1.030 10.196 17.782 4.550 22.332 2.191998 9.113 1.157 10.270 18.789 4.791 23.580 2.301999 8.998 1.033 10.032 18.663 4.336 22.999 2.292000 9.053 1.258 10.311 19.016 5.156 24.172 2.342001 9.108 1.395 10.502 19.552 6.055 25.607 2.44
Source: Ministry of Agriculture and Cooperative

Country Report : Thailand
I - 6
Thailand’s land use in rice production has shown an increasing trend, the total land devoted to riceproduction increased to 10.502 million hectares (1 hectare = 6.25 rai) in 2001. Productivity alsoincreased tremendously from 20.14 million metric tons in 1992 to 25.6 million metric tons in 2001(19.6 million tons of main crop or in season and 6.0 million tons of second crop or out of season),represented 2.44 metric ton per hectare.
The 2002 rice output is expected to be 25.0 million tons (19.0 million tons of main crop and 6.0million tons of second crop). The 2002 main rice crop production in the Northeast is estimated to beslightly than 2001 record production as the rainfall pattern will not be as ideal as last year.
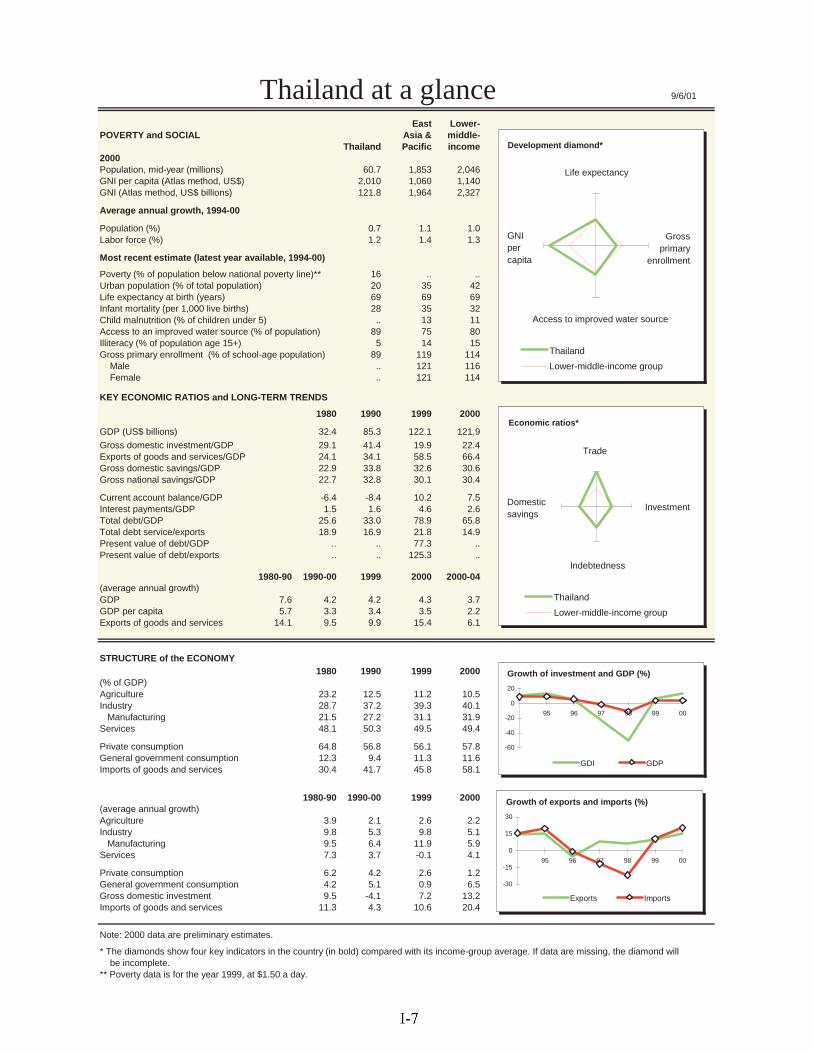
Thailand at a glance 9/6/01
East Lower-POVERTY and SOCIAL Asia & middle-
Thailand Pacific income2000Population, mid-year (millions) 60.7 1,853 2,046GNI per capita (Atlas method, US$) 2,010 1,060 1,140GNI (Atlas method, US$ billions) 121.8 1,964 2,327
Average annual growth, 1994-00
Population (%) 0.7 1.1 1.0Labor force (%) 1.2 1.4 1.3
Most recent estimate (latest year available, 1994-00)
Poverty (% of population below national poverty line)** 16 .. ..Urban population (% of total population) 20 35 42Life expectancy at birth (years) 69 69 69Infant mortality (per 1,000 live births) 28 35 32Child malnutrition (% of children under 5) .. 13 11Access to an improved water source (% of population) 89 75 80Illiteracy (% of population age 15+) 5 14 15Gross primary enrollment (% of school-age population) 89 119 114
Male .. 121 116Female .. 121 114
KEY ECONOMIC RATIOS and LONG-TERM TRENDS
1980 1990 1999 2000
GDP (US$ billions) 32.4 85.3 122.1 121.9
Gross domestic investment/GDP 29.1 41.4 19.9 22.4Exports of goods and services/GDP 24.1 34.1 58.5 66.4Gross domestic savings/GDP 22.9 33.8 32.6 30.6Gross national savings/GDP 22.7 32.8 30.1 30.4
Current account balance/GDP -6.4 -8.4 10.2 7.5Interest payments/GDP 1.5 1.6 4.6 2.6Total debt/GDP 25.6 33.0 78.9 65.8Total debt service/exports 18.9 16.9 21.8 14.9Present value of debt/GDP .. .. 77.3 ..Present value of debt/exports .. .. 125.3 ..
1980-90 1990-00 1999 2000 2000-04(average annual growth)GDP 7.6 4.2 4.2 4.3 3.7GDP per capita 5.7 3.3 3.4 3.5 2.2Exports of goods and services 14.1 9.5 9.9 15.4 6.1
STRUCTURE of the ECONOMY1980 1990 1999 2000
(% of GDP)Agriculture 23.2 12.5 11.2 10.5Industry 28.7 37.2 39.3 40.1
Manufacturing 21.5 27.2 31.1 31.9Services 48.1 50.3 49.5 49.4
Private consumption 64.8 56.8 56.1 57.8General government consumption 12.3 9.4 11.3 11.6Imports of goods and services 30.4 41.7 45.8 58.1
1980-90 1990-00 1999 2000(average annual growth)Agriculture 3.9 2.1 2.6 2.2Industry 9.8 5.3 9.8 5.1
Manufacturing 9.5 6.4 11.9 5.9Services 7.3 3.7 -0.1 4.1
Private consumption 6.2 4.2 2.6 1.2General government consumption 4.2 5.1 0.9 6.5Gross domestic investment 9.5 -4.1 7.2 13.2Imports of goods and services 11.3 4.3 10.6 20.4
Note: 2000 data are preliminary estimates.
* The diamonds show four key indicators in the country (in bold) compared with its income-group average. If data are missing, the diamond willbe incomplete.
** Poverty data is for the year 1999, at $1.50 a day.
-60
-40
-20
0
20
95 96 97 98 99 00
GDI GDP
Growth of investment and GDP (%)
Thailand
Lower-middle-income group
Development diamond*
Life expectancy
Access to improved water source
GNIpercapita
Grossprimary
enrollment
-30
-15
0
15
30
95 96 97 98 99 00
Exports Imports
Growth of exports and imports (%)
Thailand
Lower-middle-income group
Economic ratios*
Trade
Domesticsavings
Investment
Indebtedness
Kondo
I-7

Thailand
PRICES and GOVERNMENT FINANCE1980 1990 1999 2000
Domestic prices(% change)Consumer prices 19.8 5.9 0.3 1.6Implicit GDP deflator 12.7 5.8 -4.3 1.7
Government finance(% of GDP, includes current grants)Current revenue 14.2 18.4 15.5 15.1Current budget balance -0.1 7.2 -3.7 -4.4Overall surplus/deficit -4.6 4.5 -4.6 -5.4
TRADE1980 1990 1999 2000
(US$ millions)Total exports (fob) 6,449 22,881 58,549 67,942
Rice 953 1,089 1,952 1,640Rubber 603 925 1,162 1,525Manufactures .. 16,588 49,339 59,766
Total imports (cif) 9,215 33,006 50,434 62,423Food 356 1,526 1,990 2,003Fuel and energy 2,868 3,062 4,340 6,833Capital goods .. 12,808 24,021 29,942
Export price index (1995=100) .. 115 87 85Import price index (1995=100) .. 125 93 99Terms of trade (1995=100) .. 92 94 86
BALANCE of PAYMENTS1980 1990 1999 2000
(US$ millions)Exports of goods and services 7,939 29,301 71,410 70,221Imports of goods and services 9,996 35,803 56,345 65,932Resource balance -2,057 -6,502 15,065 4,289
Net income -229 -854 -2,991 3,766Net current transfers 216 212 354 1,083
Current account balance -2,070 -7,144 12,428 9,138
Financing items (net) 1,909 10,929 -7,183 -11,258Changes in net reserves 161 -3,785 -5,245 2,120
Memo:Reserves including gold (US$ millions) 3,026 14,273 34,781 32,661Conversion rate (DEC, local/US$) 20.5 25.6 37.8 40.1
EXTERNAL DEBT and RESOURCE FLOWS1980 1990 1999 2000
(US$ millions)Total debt outstanding and disbursed 8,297 28,165 96,335 80,250
IBRD 671 2,421 2,723 2,940IDA 32 109 93 90
Total debt service 1,617 5,295 16,380 11,948IBRD 79 396 353 396IDA 1 2 4 4
Composition of net resource flowsOfficial grants 75 193 .. ..Official creditors 548 98 2,168 457Private creditors 1,274 1,506 -6,269 -6,856Foreign direct investment .. 2,542 3,562 2,812Portfolio equity 0 449 946 897
World Bank programCommitments 632 174 1,000 0Disbursements 150 174 806 456Principal repayments 26 209 183 185Net flows 124 -35 623 272Interest payments 54 189 174 179Net transfers 70 -224 450 92
The World Bank Group: http://www.worldbank.org/data/ 9/6/01
-10
-5
0
5
10
15
94 95 96 97 98 99 00
Current account balance to GDP (%)
0
20,000
40,000
60,000
80,000
94 95 96 97 98 99 00
Exports Imports
Export and import levels (US$ mill.)
-10
-5
0
5
10
15
95 96 97 98 99 00
GDP deflator CPI
Inflation (%)
G: 14,880
A: 2,940
D: 746
C: 3,062B: 90
F: 43,042
E: 15,490
Composition of 2000 debt (US$ mill.)
A - IBRDB - IDAC - IMF
D - Other multilateralE - BilateralF - PrivateG - Short-term
Kondo
I-8

Thailand Social IndicatorsLatest single year Same region/income group
East Lower-
Asia & middle-1970-75 1980-85 1993-99 Pacific income
POPULATION Total population, mid-year (millions) 41.4 51.1 60.2 1,836.6 2,093.0 Growth rate (% annual average for period) 2.9 1.8 0.7 1.2 1.1Urban population (% of population) 15.1 17.9 21.3 34.5 42.9Total fertility rate (births per woman) 4.5 2.8 1.9 2.1 2.1
POVERTY(% of population)National headcount index .. .. .. .. .. Urban headcount index .. .. .. .. .. Rural headcount index .. .. .. .. ..
INCOMEGNI per capita (US$) 390 810 2,010 1,010 1,200Consumer price index (1995=100) 32 65 121 136 137Food price index (1995=100) .. 59 126 .. ..
INCOME/CONSUMPTION DISTRIBUTIONGini index .. .. 41.4 .. ..Lowest quintile (% of income or consumption) 5.6 .. 6.4 .. ..Highest quintile (% of income or consumption) 49.6 .. 48.4 .. ..
SOCIAL INDICATORSPublic expenditure Health (% of GDP) .. .. 1.9 1.7 2.3 Education (% of GNI) 3.5 3.8 4.8 2.9 4.8 Social security and welfare (% of GDP) 0.7 0.6 0.8 .. ..Net primary school enrollment rate(% of age group) Total .. .. .. 100 99 Male .. .. .. 100 100 Female .. .. .. 100 99Access to an improved water source(% of population) Total .. 66 80 75 80 Urban .. .. 89 93 94 Rural .. .. 77 66 69Immunization rate(% under 12 months) Measles .. 22 94 83 87 DPT .. 47 97 82 87Child malnutrition (% under 5 years) .. .. 19 12 9Life expectancy at birth(years) Total 61 66 69 69 69 Male 59 63 67 67 67 Female 63 68 71 71 72Mortality Infant (per 1,000 live births) 60 42 28 35 32 Under 5 (per 1,000 live births) 102 58 33 44 40 Adult (15-59) Male (per 1,000 population) 327 280 240 184 191 Female (per 1,000 population) 259 210 147 141 133 Maternal (per 100,000 live births) .. .. 44 .. ..Births attended by skilled health staff (%) .. 52 95 .. ..
Note: 0 or 0.0 means zero or less than half the unit shown. Net enrollment ratios exceeding 100 indicate discrepanciesbetween the estimates of school-age population and reported enrollment data. Latest year for access to improved watersource data is 2000.
2001 World Development Indicators CD-ROM, World Bank
Kondo
I-9

COUNTRY REPORT
Vietnam

Country Report : Vietnam
J - 1
1. Rice Production
Paddy is the most important food tree of Vietnam. Paddy is planted in over 50% of agricultural landand more than 60% of annual cultivation areas. Rice production accounts for 43% of the gross valueof agricultural products and influences all social aspects of rural life. Renovation process in thedirection of maximizing self-determination of farmers in production and free trade has made greatincentive for encouraging for rice production and export development.
1.1 Overview
ProductionArea :
The Red River Delta in the north : nearly 85% of the area is irrigated.
The Mekong River Delta in the south : farmers in some irrigated areas grow 3 ricecrops a year. New canals built in the region have converted more than 300,000hectares of floating rice areas to irrigation, but more than 60% of the south’sricelands remain rainfed with shallow to medium flood depths, or tidal wetlands.
CroppingPattern :
There are different methods of rice cultivation according to the climatic region.
1. Dry paddy methodFarmers in the north, where the temperature is milder, grow their rice by thedry paddy method.
2. Wet paddy methodIn the south, where the climate is tropical, the rice is grown using the wetpaddy method. The hot, wet and humid climate of the south Mekong Deltasupport the growing of three crops per year. The growing process used by therice farmers determines the varieties of rice grown.
MajorCrops :
Vietnam produces three major crops a year.
1. 10-month cropAccounting for nearly 30% of production and is harvested between Novemberand February in the south. This crop is declining in area and is the lowestyielding of Vietnam’s three crops.
2. Winter-spring cropAccounting for more than 45% of total production and is harvested inFebruary – March.6 The winter-spring crop has expanded more than 75%since 1988/89 and has the highest yield of the three crops. The winter-springcrop accounts for the bulk of Vietnam’s export.
3. Summer-autumn cropAccounting for more than 24% of annual production and is harvested in Julythrough September.
Paddy SownArea :
Increase from 6 million ha in 1990 to 8.3 million ha in 1997 or even 8.9 millionha in 1999.
6 The harvest dates are for production occurring in southern Vietnam. Harvest dates differ in the north, but most riceproduction occurs in the south.

Country Report : Vietnam
J - 2
Crop andSeasonalityStructure :
Since 1999, crop and seasonality structure has been positively changed towardsincreasing land area for planting paddy :- Winter-spring paddy è increased from 2.1 to 2.89 million ha- Summer-autumn paddy è increased from 1.2 to 2.35 million ha- Winter paddy (low yielding) è decreased from 2.74 to 2.4 million ha
New rice varieties have been applied over 87% of the planting area.
Production : 1999/00 crop : 20.30 million tons (milled basis)2000/01 crop : 20.90 million tons (milled basis)Severe flood in late summer and early fall in 2000 is estimated to have reducedplantings of Vietnam’s 2001/02 10-month crops and will likely delay planting ofthe country’s main winter-spring crop as well. The year 2000 saw seriousflooding in some areas, affecting 6% of the summer crop but destroying less than1% of the crop.
Paddy Yield : Higher intensive farming and more advanced technologies have made paddy yieldincrease stably, from 3.69 tons/ha in 1995 to 4.1 tons/ha in 2000.Overall food production in Vietnam increased by 19% between 1996 and 2000.Vietnam produced 32.6 million tons of rice paddy in 2000, up from 26.4 millionsin 1996 (increase of 23%). As a result, paddy production per head increased from361 kg in 1996 to 419 kg per head in 2000.
Rice output& Supply :
The supply of rice in Vietnam is seasonal with food shortages historically beingexperienced just before the Winter-spring harvest in the first few months of theyear.
GovernmentControlSystem :
Vietnam implementing comprehensive reform pointed out by the 6th Session ofVietnam Communist Party (Dec 1986) with its core of economic reform,agricultural sector has made great changes in the agricultural contracted system(1988), land distribution to farmers, considering farmers’ households as economicunits. As a result, from a rice importer of 450,000 tons in 1988, Vietnam becamean exporter of 1 million tons of rice in 1989, making kick start for the appearanceof rice and other agricultural products of Vietnam in the world market. Further bythe 7th and 8th session of Vietnam Communist Party, agriculture sector hasexperienced prompt, robust and comprehensive transformation, from a self-sufficient economy to commercial one.
Table 1 : Area of Food Crop Growing and Rice Production (Unit : 1000ha, 1000tons)
1996 1997 1998 1999 2000(prel.)
2001(est.)
Yearly food crop growing area 8,217.3 8,330.4 8,586.8 8,868.4 N/A N/A
Of which rice 7,003.8 7,099.7 7,362.7 7,648.1 7,654.9 7,400
Food production 29,217.9 30,618.1 31,853.9 34,253.9 N/A N/A
Of which rice 26,396.7 27,523.9 29,145.5 31,393.8 32,554.0 31,900Source : Ministry of Agriculture and Rural Development’s 5-year Plan (2001-2005),
Part I on situation of agricultural and rural areas during 1996-2000
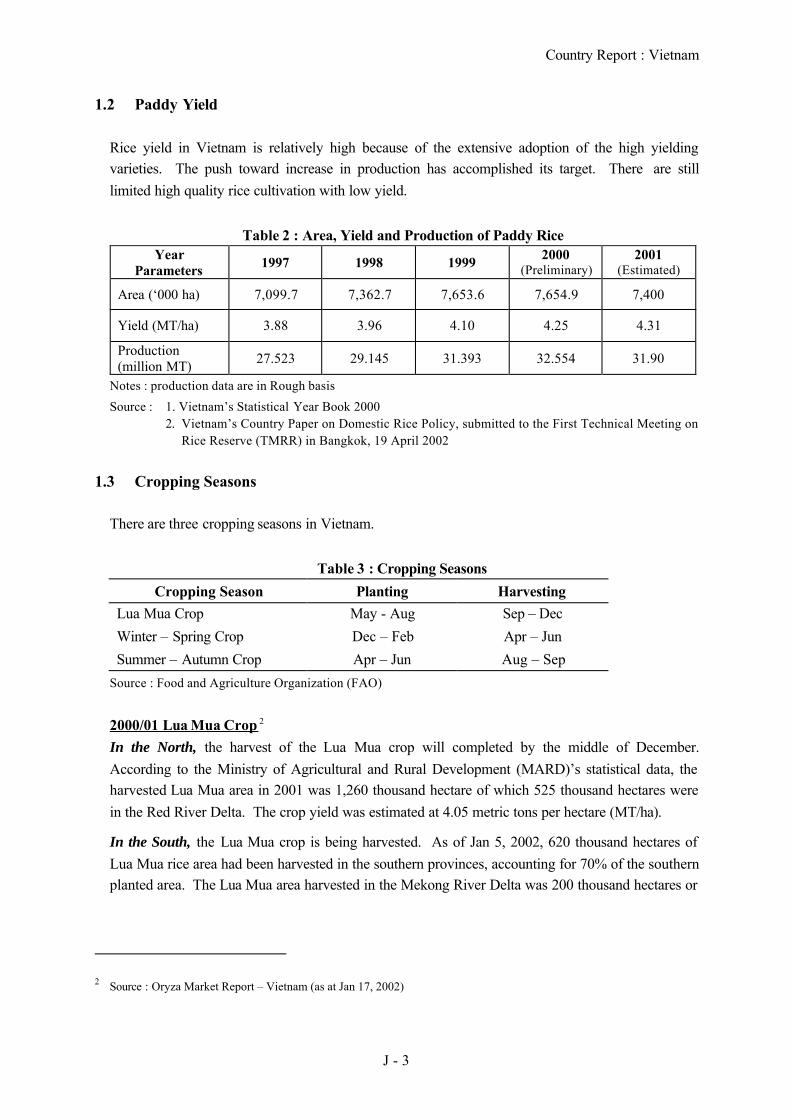
Country Report : Vietnam
J - 3
1.2 Paddy Yield
Rice yield in Vietnam is relatively high because of the extensive adoption of the high yieldingvarieties. The push toward increase in production has accomplished its target. There are stilllimited high quality rice cultivation with low yield.
Table 2 : Area, Yield and Production of Paddy RiceYear
Parameters 1997 1998 1999 2000(Preliminary)
2001(Estimated)
Area (‘000 ha) 7,099.7 7,362.7 7,653.6 7,654.9 7,400
Yield (MT/ha) 3.88 3.96 4.10 4.25 4.31
Production(million MT) 27.523 29.145 31.393 32.554 31.90
Notes : production data are in Rough basis
Source : 1. Vietnam’s Statistical Year Book 2000 2. Vietnam’s Country Paper on Domestic Rice Policy, submitted to the First Technical Meeting on
Rice Reserve (TMRR) in Bangkok, 19 April 2002
1.3 Cropping Seasons
There are three cropping seasons in Vietnam.
Table 3 : Cropping Seasons
Cropping Season Planting HarvestingLua Mua Crop May - Aug Sep – Dec
Winter – Spring Crop Dec – Feb Apr – Jun
Summer – Autumn Crop Apr – Jun Aug – Sep
Source : Food and Agriculture Organization (FAO)
2000/01 Lua Mua Crop 2
In the North, the harvest of the Lua Mua crop will completed by the middle of December.According to the Ministry of Agricultural and Rural Development (MARD)’s statistical data, theharvested Lua Mua area in 2001 was 1,260 thousand hectare of which 525 thousand hectares werein the Red River Delta. The crop yield was estimated at 4.05 metric tons per hectare (MT/ha).
In the South, the Lua Mua crop is being harvested. As of Jan 5, 2002, 620 thousand hectares ofLua Mua rice area had been harvested in the southern provinces, accounting for 70% of the southernplanted area. The Lua Mua area harvested in the Mekong River Delta was 200 thousand hectares or
2 Source : Oryza Market Report – Vietnam (as at Jan 17, 2002)

Country Report : Vietnam
J - 4
about 50% of the Mekong River Delta Lua Mua growing area. MARD estimates the southern cropyield at 2.85 mt/ha.
2002’s Winter-Spring CropIn the North, a small area (about 14 thousand hectares) of the early winter-spring paddy wasplanted in Ha Tinh and Thua Thien Hue provinces of the North Coastal region. The remainder ofthe winter-spring crops will be sown over the next two months.
In the South, the 2002’s winter-spring rice is being sown. As of Jan 5, 2002, farmers in thesouthern provinces have sown 1,535 thousand hectares of which 1,319 thousand hectares is in theMekong River Delta. By the middle of January, the sowing of the winter-spring rice crop will becompleted in the Mekong River Delta. Mekong River Delta provinces plan to grow about 1.49million hectares of winter-spring paddy with an estimated production of 8 million tons.
Table 4 : Production Zones (by region)
Production(unit : million ton, milled basis)Production
Zone RegionHarvested Area
(% of totalharvested area) 1997/98 1998/99 1999/00 2000/01
Production (overall) 18.94 20.40 20.30 20.90
Dac Lac 1.16% 0.22 0.24 0.24 0.24Gia Lai 0.92% 0.17 0.19 0.19 0.19Kon Tum
CentralHighlands
0.29% 0.05 0.06 0.06 0.06Total 0.45 0.48 0.48 0.50
An Giang 6.17% 0.01 1.26 1.25 1.29Kien Giang 5.81% 0.01 1.19 1.18 1.21Dong Thap 5.61% 0.01 1.14 1.14 1.17Can Tho 5.55% 0.01 1.13 1.13 1.16Long An 5.13% 0.01 1.05 1.04 1.07Minh Hai 4.79% 0.01 0.98 0.97 1.00Tien Giang 4.31% 0.01 0.88 0.87 0.90Soc Trang 4.31% 0.01 0.88 0.87 0.90Vinh Long 2.71% 0.01 0.55 0.55 0.57Tra Vinh 2.70% 0.01 0.55 0.55 0.56Ben Tre
MekongRiver Delta
1.50% 0.00 0.31 0.30 0.31Total 0.11 9.91 9.86 10.16
Thanh Hoa 3.96% 0.01 0.81 0.80 0.83Nghe An 2.99% 0.01 0.61 0.61 0.62Ha Tinh 1.71% 0.0038 0.35 0.35 0.36Thua ThienHue 0.78% 0.0017 0.16 0.16 0.16
Quang Binh 0.73% 0.0016 0.15 0.15 0.15Quang Tri
North CentralCoast
0.67% 0.0015 0.14 0.14 0.14Total 0.02 2.21 2.20 2.27
Ha Bac 2.98% 0.01 0.61 0.60 0.62Vinh Phu 2.19% 0.00 0.45 0.44 0.46Bac Thai 1.20% 0.00 0.24 0.24 0.25Lai Chau
NorthMountain &
Midland0.78% 0.00 0.16 0.16 0.16

Country Report : Vietnam
J - 5
Production(unit : million ton, milled basis)Production
Zone RegionHarvested Area
(% of totalharvested area) 1997/98 1998/99 1999/00 2000/01
Quang Ninh 0.73% 0.00 0.15 0.15 0.15Lang Son 0.70% 0.00 0.14 0.14 0.15Hoa Binh 0.70% 0.00 0.14 0.14 0.15Son La 0.69% 0.00 0.14 0.14 0.14Tuyen Quang 0.63% 0.00 0.13 0.13 0.13Yen Bai 0.61% 0.00 0.12 0.12 0.13Cao Bang 0.53% 0.00 0.11 0.11 0.11Lao Cai 0.52% 0.00 0.11 0.11 0.11Ha Giang 0.48% 0.00 0.10 0.10 0.10
Total 0.03 2.60 2.59 2.66Hai Hung 3.83% 0.0084 0.78 0.78 0.80Nam Ha 3.74% 0.0082 0.76 0.76 0.78Thai Binh 2.70% 0.0059 0.55 0.55 0.56Ha Tay 2.66% 0.0058 0.54 0.54 0.56Hai Phong 1.50% 0.0033 0.31 0.30 0.31Ninh Binh 1.09% 0.0024 0.22 0.22 0.23Ha Noi
Red RiverDelta
0.89% 0.0020 0.18 0.18 0.19Total 0.04 3.35 3.33 3.43
Quang NamDa Nang 1.92% 0.0042 0.39 0.39 0.40
Binh Dinh 1.92% 0.0042 0.39 0.39 0.40Quang Ngai 1.45% 0.0032 0.30 0.29 0.30Phu Yen 0.94% 0.0021 0.19 0.19 0.20Binh Thuan 0.93% 0.0020 0.19 0.19 0.19Khanh Hoa 0.62% 0.0014 0.13 0.13 0.13Ninh Thuan
South CentralCoast
0.48% 0.0011 0.10 0.10 0.10Total 0.02 1.69 1.68 1.73
Source : FAO on the harvested area percentage
1.4 Current Situation in Rice Production
(1) Reduction in rice planted area
In 2001, Vietnam has restructured the agricultural production pattern by transforming 130,000hectares of low productivity rice area in coastal provinces like Ca Mau and Sco Trang in theMekong River Delta into shrimp farming. Because of better economic returns from this new pattern,farmers along the coast has shifted from rice product to aquaculture farming, causing a shrink in therice planted area, particularly the Summer-Autumn cropping area.

Country Report : Vietnam
J - 6
Table 5 : Vietnam Rice Supply and Utilization (Unit : million tons)Crop Year
Description1997/98 1998/99 1999/00 2000/01
Beginning stocks 3.69 4.35 5.42 7.06Production (milled) 18.94 20.40 20.30 20.90Import 0 0 0 0Total Supply 22.63 24.70 25.67 27.50Domestic use 14.58 14.82 15.06 16.75Export 3.70 4.51 3.60 4.00Ending stocks 4.35 5.42 7.06 7.21Population (million) 76.52 77.52 78.50 79.94Consumption per capita 0.19 0.19 0.19 0.21
Notes : Data in the above table are in milled basis.Source : ASEAN Food Security Reserve Board’s Country Paper, submitted in the
22nd AFSRB Meeting in Phnom Penh, Cambodia, 28-29 June 2001.
(2) Risks, hazards and shocks affecting rice productions
Typhoons that regularly strike central Vietnam during June to December each year causes heavyrains and brings flooding to all parts of the country, causing widespread damages to its rice crop,particularly Summer/Autumn crop. In each typical year, up to 10% of the summer/autumn crop isaffected by floods. However, much of the crop can be recovered with only 1-2% of the crop iscompletely destroyed. Serious flooding in 1996 and 1997 caused at least 10% crop loss while thedamage in the 2000 flooding reportedly caused less than 1% of total crop.
Key indicators of risks, hazards and shocks in VietnamIndicator 1996 2000
Summer paddy affected by flood (% of area)
Summer paddy lost by flood (% of area)
17.6%
4.7%
5.6%
0.4%
Source : The State of Food Security in Vietnam, by Food Security Information Unit, MARD
1.5 Relevant Laws
Decree 199/2001/QD-Ttg : Exemption of land use tax for farmerIn order to assist farmers to obtain higher returns from agricultural production, VietnamGovernment (by the Prime Minister), on December 28, 2001, signed the Decree 199/2001/QD-Ttgto exempt land use tax for farmers. Accordingly, poor farmers (who meet the criteria defined inDecision 1143/QDLD-TBXH signed on Nov 11, 2000 by Ministry of Labor) are exempted fromagricultural land use tax. A 50% reduction in the tax will be applied to other farmers for theiragricultural land which meets the conditions set by Vietnam’s Land Law. This is one of theVietnam Government’s actions to assist farmers to obtain higher returns.

Country Report : Vietnam
J - 7
1.6 Government Support on Rice Production
To support and sustain the agricultural sector which is one of the most important sector contributingmajor income to the country, Vietnam government has allocated the capital construction investmentresources from the State budget to agriculture activities as follows :
Table 6 : State Budget allocated to Rice Production1996 1997 1998 1999 2000
Irrigated area for whole year (1000 ha) 5,919 6,105 6,321 6,507 6,690
Of which - Spring-winter rice crop 2,457 2,579 2,688 2,751 2,860
- Autumn-summer rice crop 1,780 1,817 1,921 2,088 2,190
- Summer rice crop 1,682 1,709 1,712 1,668 1,640
Unit : Billion Vietnam Dong (VND)Source : Agriculture and Rural Development 5-year Plan, Situation of agriculture and rural area (1996-2000)
1.7 International Support on Rice Production
Vietnamese farmers have received the support from the Australian Agency for InternationalProgram through the FAO Integrated Pest Management (IPM) program. The aim is to limit the useof pesticides and increase the rice production. The mechanism is through educating Vietnam ricefarmers to learn how to select, adapt and apply a sustainable farming technology which limits theuse of pesticides which eventually contributes to the increase in rice production.
1.8 Agriculture and Rural Development 5-Year Plan (2001-2005)
(1) Plan on Food Production- Ensuring the firm food security at national level and household level as well as increasing food
resources for export;- Continue to develop irrigation, combine with seed production, post harvest storing and
processing technologies;- Seeking for stable market in order to encourage farmers to invest to intensive farming, increased
productivity, producing much rice with high quality and low price;- Invest to small irrigation structures, transfer new varieties and advanced farming technologies in
order to supply farmers in upland areas, expanding areas for rice production, raising capacity offood supply on the spot, and reduce and gradually stop deforestation for slash and burncultivation.
(2) Plan on Agriculture in Red River Delta- Develop commodity-oriented agriculture;- Plan of high yielding rice areas;- Forming export rice producing areas in the provinces of Hai Duong, Ha Tay and other
provinces in south of Red River Delta.
Country Report : Vietnam
J - 8
2. Rice Marketing
2.1 Rice Marketing Overview 3
Before the Renovation, Vietnam had ever been a big importer of rice and other food commodities.The marketing system in the country then were driven by state-run companies. Since theRenovation process, the economic has shifted to market mechanism and agricultural land were re-allocated to farmers. The production after then marks with significant and continuous growth(about 4.3% average for last decade) and Vietnam becomes a second largest rice exporter. In orderto promote the rice production and diversify its marketing, the Government of Vietnam hadremoved quota and any other related to rice marketing legislative barriers. Rice business in localmarket is carrying out by multi-sectoral rice buying and supply network, and private, small businessremained a key factor. However, buying from farmers, processing and export of rice is carrying outby big state-owned enterprises.
2.2 Past policy Restrictions on Rice Flows across Regions
Due to the problem of food deficiency in northern part of Vietnam, the government historicallycontrolled the supply of rice from southern region to the north in order to ensure the food security oftheir people. Food and rice from the south was then distributed through public agencies only. Thegovernment restrictions on inter-provincial movements of rice seriously limit the flow of rice fromsouth to north, equivalent to implicit taxes on rice movement, causing the higher gap of the riceprice in north and south region.
Only 42% of the price gap is explained by cost of transportation and marketing. The remaining58% is the result of various constraints, notably the restrictions on the inter-regional movement ofrice. Regional price differences were in excess of transportation and marketing costs, therefore thegovernment’s liberalization of the domestic rice market would substantially reduce the regionalprice differences.
2.3 Rice Market Reforms and Distribution System in Vietnam
Before 1989: Ministry of Foods controlled all distribution activities of The FoodCorporations of the State from central to local level in order to balance foodsbetween provinces and transferred 0.5 million tons per year from South toNorth. If there is a shortage of foods, the Ministry requested the Governmentto import from overseas.
Quota for purchasing and distribution for each province were planned underthe Government’s Ordinances. The Food Corporations of the State were
3 Source : Vietnam’s Country Paper on Domestic Rice Policy, submitted to the First Technical Meeting on Rice Reserve(TMRR), held in Bangkok on 19 April 2002.

Country Report : Vietnam
J - 9
responsible for importing and distributing foods to provinces based on theapproved plan.
The monopoly of food distribution during this period caused delay, vastlywaste, production hold back, competition between localities and central, poorfoods securities, etc.
By mid-1990s : The domestic market was still partially liberalized and the export marketremained a public monopoly, causing the unsustainable growth in rice sector.Thus, the initial high growth rate for rice production and the low quota for riceexports had already acted as a disincentive for rice producers. In addition,only a few large state enterprises had access to capital and trade, while amultitude of small and medium-sized private enterprises had only limitedaccess to credit and world market.
1995: Vietnam imposed an Export Quota of 2 million tons of rice.The conventional wisdom was that higher exports would endanger the foodsecurity of the country in general and of the poor in particular. In effect, thequota system served as a tax of about 25% on domestic producers and a rentfor state-owned enterprises equivalent to about US$130 million per year.
1997 – 1998: Vietnam government increased the Rice Export Quota to 3.5 and 4 milliontons respectively. This decisions helped increase in the national income andcontributed to a mild reduction in rural poverty.
In addition, the government greatly increased the opportunities for privateenterprises to export rice. The number of rice exporters then increased fromabout 15 (licensed by the government) in 1995 to more than 30 in 1997.
Major source of rice comes from the provinces with rice surplus in theMekong River Delta. Despite the liberalization of rice trade, the marketinformation on rice trade in Vietnam was still scare for both private and publicsectors, resulting a high costs in missed opportunities and inappropriate ordelayed decisions.
Realizing this problem, the government decided to establish an AgriculturalMarket Monitoring Unit within the Ministry of Agriculture, aiming toestablish a system to trace the trade movement and prices of domestic, borderand international prices of about 10 agricultural commodities through the useof national and international databases and electronic sources.
Current Situation(2002):
The distribution system undergone dramatic changes. The monopoly indistribution was eliminated and to be replaced by the liberalization of fooddistribution. Together with state’s owned enterprises, private companies andindividuals are permitted to carry out rice trading and distribution business.
However, despite the private sector plays an important role in purchasing ricefrom farmers, the State authority is responsible for proportionate rice fordomestic areas and for export.

Country Report : Vietnam
J - 10
2.4 Rice Marketing in the Mekong Delta
Being the country’s biggest rice production area, the Mekong River Delta becomes a major sourceof rice supply for Vietnamese people and the world market. The paddy production from this regionis about 16.29 and 16.69 million tons in 1999 and 2000 respectively, accounting for 50% of totalpaddy production of the country. In addition to supply within the region, the rice surplus from theMekong River Delta will be allocated both across-region (i.e. the north of Vietnam) and export.The report from the Mekong River Conference 99 revealed that the rice surplus is about 5 milliontons per year, with 3 million tons allocated for export (equivalent to 15-18% total rice export in theworld).
Historically, the high production and demand of rice from this region however did not improve thelife of the Delta farmers at a satisfactory level for many decades, particularly since 1975. One ofthe major causes came from the abnormal and irrational system of rice marketing. The followingsare the chronological situations of rice marketing in the Mekong River Delta as reported in theMekong River Conference 99 4.
Chronological situations of rice marketing in the Mekong River Delta1960 – 1974(under Free Market Economyand Wartime)
Rice marketing, in South Vietnam, was functioned under the free-market economy. Government assisted the farmers through thedifferent programs, such as :- Subsidized agricultural inputs,- Guaranteed minimum paddy rice,- Low interest credits,- Etc.
1975 – 1986(under Communist/SocialistEconomy)
Government totally controlled and managed all steps of paddy/ricecollection and distribution Low rice production. Supply was notsufficient to meet domestic demand.
1987 – present(Market oriented economy)
Paddy production increase and farmers may sell paddy in the freemarket. Private dealers (mostly Chinese Vietnamese) participate inthe rice marketing system and contribute to the improvement of ricemarket in the Mekong Delta.
The government dominates the rice market and directly manages riceexport. In 1998, Vietnam exported 3.2 million tons of rice (approx.US$700M). However, the farmers’ share is only 16% in revenues ofrice export.
Remarks on Rice Marketing under Market-Oriented Economy- Paddy rice is very low and unstable- The lost of paddy and rice is extremely high, about 20%- There is a lack of storage and other facilities- State enterprises hold a lion share of profits/revenues of rice
(farmer labor value)- Investments to the Mekong Delta have been very limited.
4 Source : Mekong River Conference 99 : Abstract

Country Report : Vietnam
J - 11
2.5 Key Participants in Rice Marketing System
Central to the rice marketing system of Vietnam is the complex web of relationships among its keyparticipants, namely farmers, traders, millers and state-owned enterprises. The overall purpose ofthese channels is to transport and store the paddy produced by farmers, to transform paddy intomilled rice, and to distribute it to consumers, both for domestic consumption and exports.
(1) Farmers (north & south)
• Small production per household, therefore, not worth selling direct to Vinafood subsidiaries.Farmers then sell their paddy rice to small traders/agents in that provinces.
• If producing in a considerable high quantity, farmers may sell direct to Vinafood subsidiarieswho provide the transport to pick up rice from farmers, hence reducing transportation &selling costs occurred by the farmers.
(2) Rice traders/agents• Buy paddy rice (in small quantity) from various farmers and consolidate.• Sell paddy rice to Vinafood subsidiaries by grades.• If having their own rice mill, traders will sell rice to Vinafood subsidiaries in a milled basis.
(3) VINAFOOD1 Subsidiaries (northern)• Have their own facility e.g. warehouse, rice mill and transportation.• Buy both paddy rice and milled rice from traders/agents in the northern provinces and from
VINAFOOD2 subsidiaries in the southern region.• Mill the rice if bought in paddy form.• Sort milled rice by grade, and then distribute :
- High grade --> export- Medium / low grade --> domestic consumption (within northern region)
• Make profits through the difference in buying and selling prices (buy in paddy form at lowprice, esp during the peak harvest in the Mekong River Delta & sell in milled rice at a higherprice with economy of scale).
(4) VINAFOOD2 Subsidiaries (southern)• Buy both paddy rice and milled rice from traders/agents in the Mekong River Delta &
southern provinces.• Mill the rice if bough in paddy form.• Sort milled rice by grade, and then distribute :
- High grade --> export & supply to Vinafood1 subsidiaries for further export.- Medium / low grade --> domestic consumption within northern regions & supply to
Vinafood2 subsidiaries for domestic consumption in northern provinces.
Country Report : Vietnam
J - 12
(5) VINAFOOD1 and VINAFOOD2
• Both are state-owned enterprises (SOE) who possess the administrative power and managethe supplying & marketing of rice in Vietnam for both domestic and export markets.
• At present, VINAFOOD1 has 26 subsidiaries throughout the northern region• VINAFOOD2 has 36 subsidiaries under their umbrella in the southern region
Prices of rice sold between Vinafood1 subsidiary and Vinafood2 subsidiary are not controlled bythe government, rather depending on the economic and market condition/mechanism (i.e. supply &demand).
(6) Food Association
Food Association, despite under the government control, are managed by the Board of Associationselected by members. Member of Food Association are both state-owned companies and privatecompanies. Food Association helps the government in collecting information, providing expertise,suggesting the prices and following up both international and local rice situation.
2.6 Use of Rice Mill
There are 127 rice milling operations with a capacity of over 10 ton/shift scattered around Vietnam.The largest concentration is in the Mekong Delta, where 50 mills have been identified with acapacity of more than 5 tons per hour.
In 1995, some 27 million tons of rice were produced in Vietnam, to a large extent in the MekongDelta. Rice milling is mostly done in one of the numerous small rice mills, but some large ricemills do exist.
Companies supplying rice milling machines- Saigon Industrial Company : supplying rice milling machines with capacity of 1-10 tons.- Tan Phu Lam Private Enterprise For Production & Commerce : rice polishing machines.- Etc.
2.7 Marketing costs, Profitability and Investment
The private sector has lower marketing costs than state-owned enterprises (SOEs). Unit costs ofSOEs in the Mekong River Delta are approximately US$44/ton whereas they are US$6.55/ton forlarge millers. Even after taking into account the higher taxes paid by SOEs with respect to theprivate sector, SOE costs are about five times higher. The main components of these higher costsfor SOEs are higher labor and transportation costs.
Market reforms have promoted marketing activities and improved the profitability of variousmarketing agents as witnesses by the surge in investment of the private sector at the beginning of
Country Report : Vietnam
J - 13
the 1990s. Millers have responded earlier with investment in new machinery, particularly in theNFS and Mekong River Delta.
2.8 Market Intervention by Government 5
Refer to the Ministry of Trade’s expected rice export of 4 million tons in 2002, in order to reachsuch export target, which is 320,000 tons higher than exports last year, the Ministry has asked theGovernment to buy one million ton of rice from producers in March and keep it in storage for 4-6months. An estimated VND40 billion could be spent on the acquisition.
3. Rice Price Policy
The price of rice in Vietnam is affected by the relationship between the supply and demand of the ricemarket. Despite of no explicit intervention, the Vietnam Government has monitored and controlledthe rice prices through the economic tools such as national reserves, reserve funds, purchasing), theaim of which is to regulate the supply, demand and price of rice in order to ensure the food securityand benefits of the rice producers.
3.1 Rice Price Situation
The improving rice harvests over the last few years have helped to stabilise rice supplies and fewshortages now occur. However, there are still significant price fluctuations throughout the year.Food prices in the first quarter are often more than 15% higher than later in the year. The price ofrice is often 20-30% higher in January/February than during the main rice harvest in October. Pricefluctuations are less in Ho Chi Minh City (Mekong River Delta) than in Hanoi (Red River Delta)
In the last two years, world-wide surpluses of rice and many other food crops have seen food pricescome down. In 2000, the Consumer Price Index (CPI) for food declined by 9%, and the averageretail price of paddy declined by 18%.
Table 7 : Key Food Supply Stability Indicators in Vietnam
Indicator 1996 2000
Annual variability of retail food prices 16% 14%
Consumer Price Index – food (1996 = 100) 100.0 106.8
Average export rice price (US$/ton) $250 $192
Source : The Sate of Food Security in Vietnam, by Food Security Information Unit, MARD
5 Source : Vietnam News, as at Jan 28, 2002, http://vietnamnews.vnagency.com.vn

Country Report : Vietnam
J - 14
Table 8 : Statistic of Retail Rice Prices (1996-2000)
1996 1997 1998 1999 2000Domestic food prices Consumer Price Index, food (1996 = 100) Average retail price of paddy (Dong / kg)
100.0
2,031
96.5
1,866
114.5
2,190
117.9
2,250
106.8
1,853
Export prices Export price – Viet rice (US$ / ton)
250 244 275 221 192
Source : General Statistical Office (GSO)
3.2 Quotes of Rice Prices
In January 2002, the price quotes for high quality Vietnam rice have been on par with similarqualities from Thailand. Thai quotes have stabilized over the past four weeks (Dec 2001) due toconsistent demand, while quotes out of Vietnam have changed many times throughout the monthfor a variety of reasons – flooding in the Mekong Delta, tight supplies, and increase port loading.
Price of paddy and rice increased continuously in almost provinces over the country and reached1.9% in comparison with previous month 6. In Northern provinces, due to piercingly cold weather,selling volume decreased, paddy price was then increased. In Mekong River Delta area, despite ofharvest period, price was still high at VND1,900-1,950/kg. (increased VND50/kg).
Table 9 : Comparison of the average price levels of Vietnam rice (2001)
Rice Grade 1st – 3rd Quarter of 2001(US$/ton)
4th Quarter of 2001(US$/ton)
5% $199 $168
10% $194 $163
15% $190 $157
Source : Food Market Exchange’s Article “ Rice : A review of the news in 2001”, 21 January 2002
The above table refers, Vietnam’s rice exports fared well during the first three quarter of 2001, butwere then stalled by a supply shortage during the final quarter of the year. This led to an abrupthike in prices, resulting in Vietnamese rice losing price competitiveness to rival exporters, such asThailand and India. Vietnam’s rice prices are presently $14-16/ton higher than Thai prices. Inorder to deal with the supply situation, the Vietnamese government, in Nov 2001, ordered exportersto suspend the signing of any new contracts until the middle of February 2002.
6 Source : Vietnam’s Ministry of Trade Webster (updated Jan 2002)

Country Report : Vietnam
J - 15
3.3 Domestic Prices
In the North : To celebrate the TET (Lunar New Year) holiday, farmers need cash so they are in arush to sell their rice. Consequently, paddy prices in the northern provinces were slightly down toVND1,700-1,800/kg in the first week of Jan 2002, a drop of VND50-100/kg compared with pricesin December 2001. In early Feb 2002, paddy prices in all northern provinces slightly increased toVND2,400-2,500/kg compared to prices quoted in Jan.
In the South : As at Jan 08, 2002, rice prices are still at very high levels. Paddy prices in most ofthe Mekong River Delta’s provinces were recorded at VND1,900-1,950/kg and the raw white pricewas quoted at VND2,350-2,450/kg. In February, rice prices begin slightly softening due toincreased supplies from the harvest of Lua Mua and Winter-Spring crop. Paddy prices, on Feb 08,2002 paddy prices in most of the Mekong River Delta provinces are at VND1,850-1,900/kg and theraw white rice price are quoted at VND2,350-2,400/kg, a tiny drop compared with last month’sprices.
Table 10 : Domestic Price of Vietnam Rice (unit : VND/kg)
North South(Mekong River Delta)
Region &Data
Jan 2002 Feb 2002 Jan 2002 Feb 2002
Paddy rice 1,700 – 1,800 2,400 – 2,500 1,900 – 1,950 1,850 – 1,900
Raw white rice N/A N/A 2,350 – 2,450 2,350 – 2,400
Unhusked rice N/A N/A 1,800 – 1,950 1,850 – 2,000
Source : Oryza Market Report - Vietnam
3.4 Export Prices
Export prices of Vietnam rice have been stable and are remaining at a fairly high level during thefirst two weeks of Jan 2002. Comparing with Thai rice, Vietnam rice prices are higher than Thaiprices by $22/ton (for 5% broken rice) and $28/ton (for 25% broken rice).
In February, the levels of high quality Vietnam rice (5% & 10% broken) are moving closer to Thaiprice levels for the same categories. However, prices of Vietnam’s 25% broken rice are still higherthan Thai rice by US$8-10/MT.
In overall, traders predict a slight reduction in both domestic and export prices as rice supplies fromthe harvest of the Winter-Spring crop in the Mekong River Delta is increasing, especially in March2002 when the harvest will be in peak season.

Country Report : Vietnam
J - 16
Table 11 : Export Price of Vietnam Rice /1 (unit :US$/MT)
Nov 2001 Jan 2002 Feb 2002
5% broken 183 - 185 200 190
10% broken 175 - 177 190 186
25% broken 165 - 168 185 175
1/ Long Grain White Rice, FOB/Ho Chi Minh City
Table 12 : Cash Market Prices (unit : FOB US$/MT)
Type of Rice Vietnam Thailand Pakistan
5% DP 179 N/A N/A
5% broken 176 193 N/A
10% broken 171 189 N/A
15% broken 166 185 155
25% broken 159 175 148Notes : All prices are in US$ per metric ton; FOB origin port; packed 50kg PP bags; conventional shipping.Source : Oryza – World Cash Market Prices
Table 13 : Global Rice Prices (unit : FOB US$/MT)
Type of Rice Vietnam Thailand Pakistan
5% broken 185 192 N/A
10% broken 178 N/A 160
15% broken 173 N/A 155
25% broken 166 167 147Source : Food Market Exchange’s Rice Market Report “Global Situation”, 25 February 2002
3.5 Government Control over Rice Price
Vietnam Government has no control over the price of rice, both in domestic and export market.Price of rice is driven by market mechanism (supply and demand). Factors causing difference inprices are transportation cost, buying & selling cost, demand and buying interest.
Government support when rice price fallsWhen there is a situation of high surplus which causes the price of rice fall, the government willhelp by asking traders (including VINAFOOD) to hold the rice stock for a particular period of timein order to improve the price. Until the rice price increases, the government then advises the tradersto release their rice supply. During the rice holding period, the government will pay an “interest”to rice traders to compensate the opportunity cost occurred.
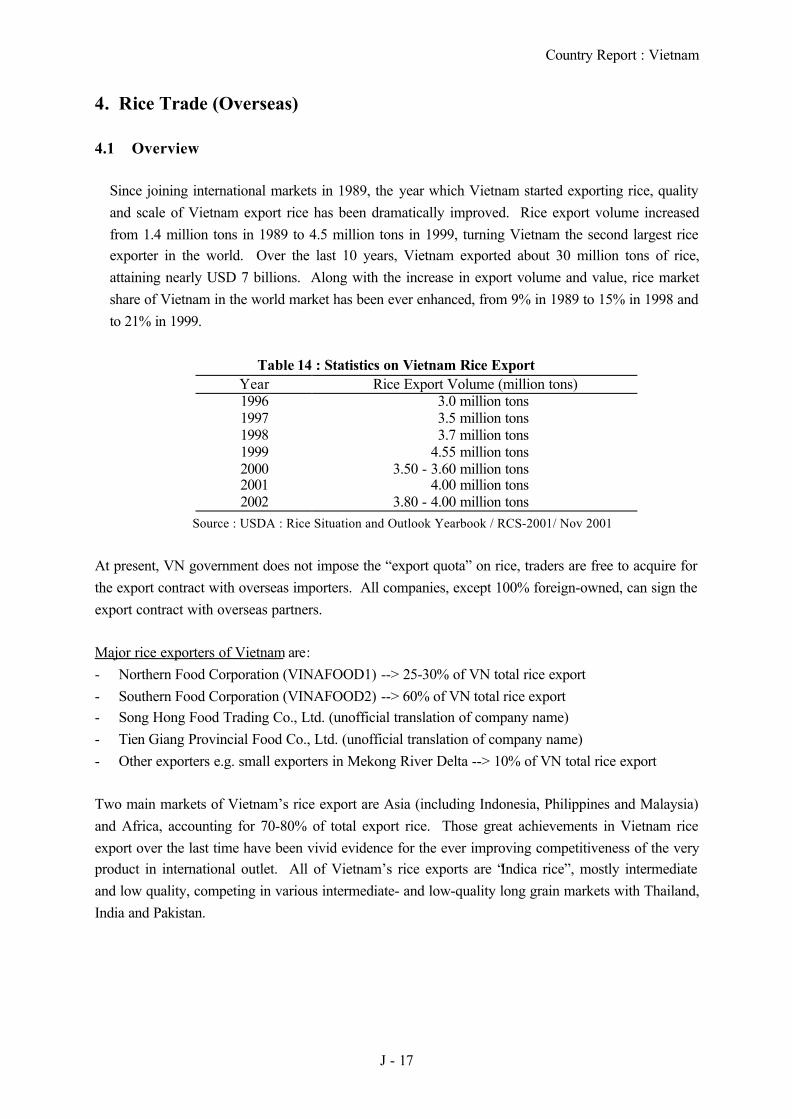
Country Report : Vietnam
J - 17
4. Rice Trade (Overseas)
4.1 Overview
Since joining international markets in 1989, the year which Vietnam started exporting rice, qualityand scale of Vietnam export rice has been dramatically improved. Rice export volume increasedfrom 1.4 million tons in 1989 to 4.5 million tons in 1999, turning Vietnam the second largest riceexporter in the world. Over the last 10 years, Vietnam exported about 30 million tons of rice,attaining nearly USD 7 billions. Along with the increase in export volume and value, rice marketshare of Vietnam in the world market has been ever enhanced, from 9% in 1989 to 15% in 1998 andto 21% in 1999.
Table 14 : Statistics on Vietnam Rice ExportYear Rice Export Volume (million tons)1996 3.0 million tons1997 3.5 million tons1998 3.7 million tons1999 4.55 million tons2000 3.50 - 3.60 million tons2001 4.00 million tons2002 3.80 - 4.00 million tons
Source : USDA : Rice Situation and Outlook Yearbook / RCS-2001/ Nov 2001
At present, VN government does not impose the “export quota” on rice, traders are free to acquire forthe export contract with overseas importers. All companies, except 100% foreign-owned, can sign theexport contract with overseas partners.
Major rice exporters of Vietnam are:- Northern Food Corporation (VINAFOOD1) --> 25-30% of VN total rice export- Southern Food Corporation (VINAFOOD2) --> 60% of VN total rice export- Song Hong Food Trading Co., Ltd. (unofficial translation of company name)- Tien Giang Provincial Food Co., Ltd. (unofficial translation of company name)- Other exporters e.g. small exporters in Mekong River Delta --> 10% of VN total rice export
Two main markets of Vietnam’s rice export are Asia (including Indonesia, Philippines and Malaysia)and Africa, accounting for 70-80% of total export rice. Those great achievements in Vietnam riceexport over the last time have been vivid evidence for the ever improving competitiveness of the veryproduct in international outlet. All of Vietnam’s rice exports are “Indica rice”, mostly intermediateand low quality, competing in various intermediate- and low-quality long grain markets with Thailand,India and Pakistan.

Country Report : Vietnam
J - 18
Export Performance1999 Growth in Vietnam’s rice area in the Mekong River Delta over the last decade has resulted
from improved irrigation systems, use of new rice varieties, and improved technologies inrice production, enabling Vietnam to consistently produce exportable surpluses and become amajor player in global rice trade (2nd largest rice exporter). In line with the regional recovery,Vietnam increased its rice export to non-Asian countries. Major destinations in 1999included Indonesia, Africa, Iraq and the Philippines.
2000 Vietnam’s rice export in 2000 significantly reduced from the previous year export and farbelow the target of 4.3 metric tons set by the Government. Main reason behind such exportshrink was the lower demand from key rice importing countries like Indonesia and Malaysia.Competitive prices from low cost suppliers, like China and Pakistan, have also put pressureon the market for Vietnam’s rice. Low exports will cause a big carry-over stock in 2001.The Government of Vietnam seriously looked for plans to maximize the effectiveness of riceproduction. Further reform in 2001 will provide the private sector with a greater role in riceexporting.
2001 Rice export performance showed a satisfactory improvement with the increase in the exportvolume from 3.6 million tons in 2000 to 4.00 million tons in 2001. More than 53% ofVietnam’s rice was shipped to Asian countries : the Philippines, Indonesia and Iraq were thethree biggest Asian rice markets for Vietnam since each country import more than 500thousand tons. Africa (as a whole) is the second largest market for Vietnam’s rice, since theAfrican countries took more than 23% of Vietnam’s rice. Among European countries, Russiawas the largest buyer, it bought 106 thousand tons in 2001. Cuba is the sole Caribbeanmarket and imported 286 thousand tons. Vietnam also exported some rice to Australia.
2002 Vietnam plans to increase the rice export volume through harvesting a bumper Winter-springrice crop. However, the export industry body, i.e. Vietnam Food Association, has forecastedthe export shipments only at 3.5 – 3.6 million tons, rather than 3.8 – 4.0 million tons astargeted by the Ministry of Trade. In order to reach the export target, the Ministry of Tradehas asked the Government to buy one million tons of rice from farmers in March and keep itin storage for 6 months. An estimated VND40 billion could be spent on this acquisition.7
Estimated volume of Vietnam’s rice exports to overseas markets are:Indonesia : 900,000 tonsPhilippines : 600,000 tonsMalaysia : 250,000 tonsAfrica : 1,000,000 tonsEurope : 300,000 tonsRussia : 190,000 tons
Table 15 : Proportion & Quality of Vietnam’s rice exportsRice quality 2000 Export Percentage 2001 Export PercentageHigh grade (2%, 5%, 10% broken ) 42% 55%Medium grade (15% broken ) 28% 14%Low grade (25%, 25%, 100% broken ) 28% 31%Other 2% -TOTAL 100% 100%
7 Source : Vietnam news, as at Jan 28, 2002, http://vietnamnews.vnagency.com.vn

Country Report : Vietnam
J - 19
Table 16 : 2001 Rice Exports by Grades and Destinations (Unit : MT)
5% 10% 15% 25% 35%
100%br
Par-boiled
Gluti Un -known
Total
ASIA 590,201 245,126 266,643 659,088 0 7,180 14,210 5,160 103,150 1,890,758
Iraq 402,929 132,500 0 0 0 0 0 0 0 535,519
Indonesia 40,625 71,672 195,996 127,455 0 6,200 12,640 460 77,000 532,048Philippines 18,700 5,200 28,047 484,212 0 0 0 0 20,000 556,159
Malaysia 92,833 16,100 13,900 29,321 0 0 450 0 0 153,004
Cambodia 0 0 0 0 0 0 0 0 5,000 5,000Singapore 10,464 7,950 22,570 14,950 0 983 1,120 0 0 53,034
Palau 3,410 1,100 3,500 2,750 0 0 0 0 0 10,760
Middle East 10,900 0 0 0 0 0 0 0 0 10,900Yemen 2,640 0 2,630 0 0 0 0 4,700 0 9,970
Japan 5,860 5,014 0 0 0 0 0 0 0 10,874
Laos 400 0 0 0 0 0 0 0 1,150 1,550Hong Kong 900 0 0 0 0 0 0 0 0 900
North Korea 0 5,500 0 0 0 0 0 0 0 5,500
AFRICA 230,201 69,916 183,309 172,040 0 183,188 0 0 13,000 851,654
West Africa 230,201 61,696 175,891 172,040 0 183,188 0 0 0 823,016
Tanzamia 0 8,220 7,418 0 0 0 0 0 0 15,638Ivory Coast 0 0 0 0 0 0 0 0 13,000 13,000
EUROPE 64,395 114,051 50,450 7,500 0 300 0 0 50 236,746Poland 10,300 35,894 17,450 6,000 0 0 0 0 0 69,644
Russia 35,995 46,887 22,500 1,500 0 0 0 0 50 106,932
Ukraine 1,500 0 0 0 0 0 0 0 0 1,500Other EUCountries
16,600 31,270 10,500 0 0 300 0 0 0 58,670
America 410 25,000 0 261,518 0 0 0 0 0 286,928Cuba 410 25,000 0 261,518 0 0 0 0 0 286,928
Australia 6,305 0 0 0 0 0 0 0 2,700 9,005
Unknown 6,700 2,500 5,710 28,000 0 0 0 0 242,010 284,920
TOTAL 898,212 456,593 506,112 1,128,146 0 190,668 14,210 5,160 360,910 3,560,011
Source : Oryza – Vietnam 2001 Rice Exports
4.2 Updated Situation on Vietnam Rice Trade (as at February 2002)
Vietnam’s rice prices have been much higher than Thai rice for several months (since end of 2001)due to short supplies when the Winter-spring rice crop have not yet been harvested. However, therice supplies will increase when the winter-spring harvest expands across the country, making theVietnam’s rice prices become slightly lower and closer to Thai rice prices, thus enabling Vietnam toimprove its competitiveness in the world market for high quality rice. Vietnamese low quality riceis still not competitive with Thai and Indian rice.

Country Report : Vietnam
J - 20
The rice market is still very quiet without new major sales. Rice exports in the first quarter of 2002are mainly based on outstanding sales of Government to Government (G to G) contracts with Iraq,Cuba, Indonesia (a total of 950 thousand metric tons) and commercial sales with Malaysia (50thousand metric tons). With a total outstanding sales of 1 million metric tons, traders do not see anysignificant drop in Vietnamese rice prices until the winter-spring crop comes to peak harvest.
Due to a shortage of reserves for its own population as well as to avoid the surges of domestic riceprices, Vietnam’s Ministry of Trade had ordered the rice exporters in major rice growing area, i.e.Mekong River Delta area to refrain from signing any new rice export contracts with overseascustomers until the middle of the first quarter of 2002 (Feb 2002). This government ban resulted inthe unfavorable market conditions with low rice stocks in Vietnam, causing its rice pricesuncompetitive when compared to its main rival, Thailand.
On Feb 8, 2002, Vietnam’s Trade Ministry has lifted a ban on new rice exports. The lifting of theban would help support the prices, which will be pressured by an expected bumper crop this year.However, rice traders viewed that rice prices are unlikely to fall significantly as domestic supply isstill tight, and if the government buys rice for stockpiling as expected.
4.3 Government Policy on Rice Trade 8
• MARD’s Oversea Trade Offices to boost exportsThe Government has urged the Ministry of Trade and MARD to work more closely to set upOverseas Trade Offices with the responsibility of obtaining updated market information and tappingnew markets abroad. The Government has allowed MARD to set up agricultural trade office(ATO’s) in Russia and Iraq, where there is a great potential for Vietnam’s rice.
• Support fund to produce high quality seedsMembers of a rice and food association (VIETFOOD) are working on a proposal to establish asupport fund for rice seed producers for better quality rice seeds. The financial contribution to thefund will be from rice exporters. The Government is also asked to contribute finance assistance tothis project.
• Vietnam Plans to Coordinate on Rice Donation Program in North KoreaVietnam’s Prime Minister plans a visit to North Korea in May 2002. Bilateral trade issues,including a rice donation program, will be the main topics to be discussed.
• Vietnam – Iraq rice processing joint venture waiting for the Government’s approvalAccording to MARD, the $12 million Vietnam-Iraq rice processing project has been grantedpermission by all the relevant ministries and it is waiting for final approval from the Prime Minister(projects over $10 million are reviewed by the Office of the Prime Minister).
8 Source : Oryza Market Report – Vietnam (as at Feb 2002); 2002 USDA Report from Hanoi, Vietnam

Country Report : Vietnam
J - 21
4.4 Rice Imports
Despite of no official record of rice importation, it is believed that Vietnam has imported thejasmine rice from Thailand, particularly before the TET holidays. Rice importation from Laos hasalso been reportedly revealed as two companies in Nghe An province have been granted permissionto import the glutinous rice from Laos with the expectation of lower import tariff as a result of theagreement between the two countries.
5. Rice Reservation
5.1 Rice Reservation by the Government
(1) National Reserve : purpose of reserve
Reserve for risk e.g. natural disasterThis is the main purpose of Vietnam Food (& rice) national reserve. Vietnam government wants noVietnamese citizen to be in hunger in any situation. National reserve is a major mechanism of riceserve that is directly controlled by the government. The reserve is in the form of both paddy andrice. The current government policy, as discussed with the MARD official in Hanoi, is to reducethe amount of rice reserve and replaced by an increasing amount of cash reserve.
Reserve to control the market price of riceThis is an implicit control by the government, by depending on the economic and market situation,in order to control and balance the market price of rice. In 2001, Vietnam Government made thereserve of 1 million tons of rice in order to protect the farmers’ benefits/earnings after beingaffected by the reduced market price.
(2) Reserve for Domestic Circulation
This kind of reserve does not exist in Vietnam nowadays since Vietnam has moved to the MarketEconomy system
1) Relevant Authorities in Reserve System
Reserve DepartmentsThere are 19 Reserve Departments in major provinces, mainly located in central & northernprovinces. There is very few reserve department in the southern provinces due to adequate or evensurplus rice supply, hence no need for government’s control in rice stocks.

Country Report : Vietnam
J - 22
National Reserve DepartmentNational Reserve Department responsible and co-working with the Ministry of Agriculture andRural Development (MARD) in preparing the Annual Planning for rice reserve. After that, theAnnual Planning for rice reserve will than be submitted for the government’s approval.
Government Rice Department and Ministry of FinanceAfter being reported on the rice situation and stocks, Government Rice Department and Ministry ofFinance are responsible for planning and fixing the price of rice.
The National Reserve Department/Agency is directly responsible for managing foods reserve fundsto issue policies, and guidance on purchasing and sale of reserved foods of each crop in each period.2) Government Control & Management of Rice Stock
The National Reserve Agency, in an annual basis, will develop a food reserve plan, including otherelements such as reserved component (including rice & paddy), buying & purchasing amount andnecessary funds required from the State Budget by basing on production situation, food balance,national food security target, quality and quantity of foods being reserved, stocking term and foodpreservation process. The plan is then submitted to obtain the agreement from Ministry of Planningand Investment and the Ministry of Finance and finally submit to the Government for approval.
In developing the plan, the Agency must actively prepare a schedule for purchasing, selling toensure the food security requirements and ensure the reserved level stipulated by the government.The level of foods in stock in a national wide range must not be lower than 60% of total regulatedlevel at any time.
The Head of the National Reserve Agency will assign the Provincial Reserve Agencies toimplement the approved plan for purchase and sale of rice stocks. Selling and purchasing foods arecarried out according to the Policy on Tender issued by the Head of the National Reserve Agency(except for certain cases). If the Agency wants to sell foods but there is no domestic demand, theAgency can export the foods.
5.2 Rice Stocks
Vietnam’s rice carry-over stocks are estimated at 883,000 tons 9. This estimate includes all stocks,such as stocks of seed rice, for national reserves, for household consumption, for animal feedproduction, for exports, and all other purposes. Official data on the amount of the carry-over ricestocks that could be exported are not available. However, most observers feel exportable stocks arevery low since rice exporters are waiting of the new winter-spring harvest before signing any exportcontracts.
9 Source : Oryza Market Report – Vietnam (as at Jan 17, 2002)

Country Report : Vietnam
J - 23
• Rice stock for export : approx. 3.5 – 4.5 million tons, depending on market situation• National reserve stock on rice is approx. 2 millions annually.• Major purpose of rice reserve is to ensure adequate supply of rice of Vietnamese people.
Therefore, the government will release the reserve stock in case of emergency situations e.g.flooding, earthquake, war, etc.
5.3 Rice Reservation for ASEAN Food Security Reserve (AFSR)
The amount of earmarked quantity as allocated by AFSR in contributing to the ASEAN EmergencyRice Reserve Stock is 14,000 metric tons (reserved stock).
6. Rice Demand/Consumption
Rice consumption in Vietnam varies only slightly by income groups, though beyond a certain level ofincome, additional income is not spent on rice but on higher-value foods such as meat, fat/oil, eggsand on non-food items. From the below table, it shows that in the 1993-1998 period, monthlyhousehold consumption of rice (paddy) & other staples (in rice equivalence) per capita has decreasedslightly while consumption of higher-value products has increased remarkably.
Table 17 : Monthly Average Consumption per CapitaAll Urban Rural
1993 1998 1993 1998 1993 1998Paddy & other staples inrice equivalence (kg) 13.73 13.34 11.40 10.81 14.30 14.06
Meat (kg) 0.58 1.17 0.95 1.58 0.48 1.04Fat/oil (kg) - 0.33 - 0.38 - 0.32
Eggs (unit) 1.11 2.35 2.40 4.00 0.80 1.87Vegetables (kg) 4.24 3.12 4.40 3.61 4.20 2.98
Source : General Statistical Office (2000) : Vietnam Living Standards Survey 1997-1998, Hanoi
Among various commodities produced by the households, rice is always the most importantcommodity reserved for home consumption, regardless whether they are net sellers or net buyers. Forpure buyers who produce no paddy at all, rice is the most important commodity purchased for homeconsumption. It seems that rice sufficiency serves as a safe base for the poor livelihoodsdiversification. Therefore, it can be said that rice self-sufficiency at household-level is one of the mostimportant determinants of well being and of vulnerability in the remote rural areas of Vietnam.
Percentage of food expenditure on rice (1998)Total population 13% of total food expenditure
Poorest 20% of population 32% of total food expenditureRichest 20% of population 6% of total food expenditure
Source : General Statistical Office : Vietnam Living Standards Survey (1998)

Country Report : Vietnam
J - 24
Domestic Rice Consumption in Vietnam- Rice supply for domestic consumption are in lower grade/quality than those for export.- Domestic consumption does not focus on high quality rice, but rather focus on quantity.- High income people consume high quality rice and imported rice (mainly from Thailand) e.g.
jasmine rice, 5% broken rice.- Middle income people consume lower quality rice from local supply- Low income people, mainly in non-farming section, consume low quality rice from local supply
e.g. 25% broken rice
7. Food Aid
7.1 Aid Program for Severe Flooding in 1999
Vietnam has received the support from two international organizations when it faced a severflooding in 1999, they are:
FAO Food Aid ProgramVietnam had been given the funding under the FAO Food Aid Program when a severe floodingoccurred in Vietnam in 1999. The aid was provided in the form of money, rather than rice orcommodities, so that the Government could allocate the funds to buy the rice and necessarycommodities for their people.
Flood Management Agency by International Red CrossThe International Red Cross through its Flood Management Agency has provided money toVietnam government during the flooding in 1999. The support was not in the form of rice, butrather in a monetary basis in order that Vietnam government can allocate to those in need.
7.2 Aid Program for Severe Flooding in 2000
Emergency supply of rice seeds to flood-affected farm households in An Giang Province 10
In summer and autumn 2000, the Mekong River basin experienced the unusually serious floodingwhich affected human life and agricultural production in large areas of Thailand, Lao, Cambodiaand Vietnam. An Giang Province of Vietnam was one of the most affected by the flood. 3,253hectares of summer-autumn and third season rice were destroyed while another 116 hectares werepartially damaged. Vietnam Government’s appeal through the United Nation system launched anappeal to assisting the country in its relief and rehabilitation efforts. The appeal resulted in fundsbeing allocated by OCHA to FAO with a total of USD378,800 for the procurement of rice seeds insupport of the most-affected farm households.
10 Source : Food and Agriculture Organization of the United Nations : FAO Press Release

Country Report : Vietnam
J - 25
8. Poverty
8.1 Food Access 11
The key factor limiting people’s ability to access food is poverty. Poverty is widespread in Vietnam,but has been significantly reduced during the 1990s, largely as a result of the rapid economicgrowth. Poverty in Vietnam in concentrated in rural areas. In 1998, 94% of the poor lived in ruralareas, an increase from 1993. In 1998, 45% of the rural population were below the poverty line,compared with only 9% of the urban population. As incomes rise, people are able to spend moremoney on non-food items. Food still represents the majority of the household budget in Vietnam –47% in 1998. For poor households, expenditure on food predominates – for the poorest 20% ofpeople, average per capita expenditure on food represented 64% of total per capita expenditure, andexpenditure on food staples comprised 35% of total expenditure.
Table 18 : Statistics on Poverty in VietnamPoverty line & Index 1993 1998Population below general poverty line Total population (% poor) Urban population (% poor) Rural population (% poor) Rural poor as a percent of total poor
582566
91.3
379
4594.3
Populaltion below food poverty line Total population (% food poor) Urban population (% food poor) Rural population (% food poor) Rural food poor as a percent of total food poor
258
2994
152
1896
Poverty gap index Total population Urban population Rural population
18.56.421.5
9.51.711.6
Source : The State of Food Security in Vietnam, by Food Security Information Unit, MARD
8.2 Current Situation and Government Development Plan 12
In 2000, the whole country has 1.7 million households, of which 8.5 million people belonging topoor and hungry households, lacking food and foodstuff, of which 90% in rural area, mostlyconcentrating on upland area and ethnic minority areas. By the year 2005, Vietnam governmentwill be taking effective measures to eradicate basically the status of food shortage and reduceconsiderably the proportion of poor households.
11 Source : The State of Food Security in Vietnam, by Food Security Information Unit, MARD, October 200112 Source : The Agriculture and Rural Development 5-Year Plan (2001-2005), prepared on 22 Aug 2000

Country Report : Vietnam
J - 26
9. National Food Security Policy
9.1 Current Status of Food Security 13
Vietnam has made good progress in reducing hunger since the 1996 World Food Summit.According to the government data, the percent of population below the minimum level of dietaryintake decreased from 25% to 15% between 1990-1992 and 2000. Child malnutrition is still high,but has fallen significantly over the last few years.
However, food insecurity still continues to be a problem for vulnerable groups in the population.People in rural areas have high rates of malnutrition. In 2000, 37% of children under five years ofage in rural areas and 44% in mountainous areas were underweight, compared with only 27% inurban areas. Infant mortality in rural areas is more than double that in urban areas.
The poorest in the community may face serious food problems. The average annual homeconsumption of rice for the poorest 20% of the population was 138 kg in 1998, compared with 150kg overall.
9.2 Past Policies on Food Security 14
In the past, Vietnam government has implemented two major policies in order to provide foodsecurity to the country, they are:- Price Policy : lowering the price of food- Trade Policy : restricting exports
However, to try to meet the needs of the poor by implementing both policies is generally a self-defeating policy. Lower rice prices and lower exports result in lower agriculture growth, lowernational income, and hurt the rural population where most of the poor are found.
13 Source : The State of Food Security in Vietnam, by Food Security Information Unit, Department of Planning andProjection, Ministry of Agriculture & Rural Development (MARD), October 2001
14 Source : IFPRI-MARD Workshop, Hanoi, October 15-17, 1996

Country Report : Vietnam
J - 27
List of Tables
Table 1 Area of food crop growing and rice production
Table 2 Area, yield and production of paddy rice (by year)
Table 3 Cropping seasons
Table 4 Production zones (by region)
Table 5 Vietnam rice supply and utilization
Table 6 State budget allocated to rice production
Table 7 Key food supply stability indicators in Vietnam
Table 8 Statistics on retail rice prices (1996-2000)
Table 9 Comparison of the average price levels of Vietnam rice (2001)
Table 10 Domestic price of Vietnam rice
Table 11 Export price of Vietnam rice
Table 12 Cash market prices
Table 13 Global rice prices
Table 14 Statistics on Vietnam rice export
Table 15 Proportion & quality of Vietnam’s rice exports
Table 16 2001 rice exports by grades and destinations
Table 17 Monthly average consumption per capita
Table 18 Statistics on poverty in Vietnam

Country Report : Vietnam
J - 28
Reference
1. Facts about cooperation Vietnam and IRRI : Vietnam and Rice2. Studies of Asia – Rice in Vietnam, Catholic Education, South Australia3. Economic Research Service/USDA : Rice Situation and Outlook Yearbook/RCS-2001/Nov
20014. Agricultural and Rural Development Achievements in 15 years of Renovation, Ministry of
Agriculture and Rural Development, Vietnam5. Situation on agriculture and rural areas during 1996-2000, Agriculture and Rural Development
5-year Plan6. The Agriculture and Rural Development 5-year Plan (2001-2005), prepared on 22 August 20007. Oryza market report - Vietnam, 17 January 20028. Vietnam Grain and Feed, January rice update 2001, USDA9. World grain situation and outlook and world agricultural production, Foreign Agricultural
Service, USDA10. Center for research and information on low external input and sustainable agriculture, ILEIA
Newsletter Vol.13 No.411. Food policy and market reform in Vietnam and Bangladesh, IFPRI, 25 April 199912. Mekong River Conference 99 : Abstract13. Statistical Yearbook 2000, General Statistical Office, Vietnam14. Rice : A review of the news in 2001, Food Market Exchange, 21 January 200215. Rice market report “global situation”, Food Market Exchange, 25 February 200216. News from Business Recorders, Reuters, 9 February 200217. Vietnam export performance in 1999 and beyond – Summary Findings18. Vietnam Economic Times, Circular 02/1999/TT-CDTQG, National Reserve Agency19. Circular 35/1999/TT-BTM, Ministry of Trade20. Circular 46/2001/QD-TTg, Vietnam Government21. Vietnam living standards survey 1997-1998, General Statistical Office (2000), Hanoi22. FAO Press Release, Food and Agriculture Organization (FAO), United Nations23. IFPRI-MARD Workshop, Hanoi, 15-17 October 199624. Food and Agriculture Organization website25. Ministry of Trade website, Vietnam26. Ministry of Planning and Investment website, Vietnam27. Ministry of Agriculture and Rural Development website, Vietnam

Vietnam at a glance 9/6/01
EastPOVERTY and SOCIAL Asia & Low-
Vietnam Pacific income2000Population, mid-year (millions) 78.5 1,853 2,459GNI per capita (Atlas method, US$) 390 1,060 420GNI (Atlas method, US$ billions) 30.4 1,964 1,030
Average annual growth, 1994-00
Population (%) 1.5 1.1 1.9Labor force (%) 1.7 1.4 2.4
Most recent estimate (latest year available, 1994-00)
Poverty (% of population below national poverty line) 37 .. ..Urban population (% of total population) 20 35 32Life expectancy at birth (years) 69 69 59Infant mortality (per 1,000 live births) 37 35 77Child malnutrition (% of children under 5) 37 13 ..Access to an improved water source (% of population) 56 75 76Illiteracy (% of population age 15+) 7 14 38Gross primary enrollment (% of school-age population) 114 119 96
Male 116 121 102Female 111 121 86
KEY ECONOMIC RATIOS and LONG-TERM TRENDS
1980 1990 1999 2000
GDP (US$ billions) .. 6.5 28.7 31.3
Gross domestic investment/GDP .. 13.0 25.4 27.4Exports of goods and services/GDP .. 26.4 .. ..Gross domestic savings/GDP .. 6.0 .. ..Gross national savings/GDP .. .. .. ..
Current account balance/GDP .. -5.4 4.0 1.6Interest payments/GDP .. 0.7 1.1 1.5Total debt/GDP .. 359.6 81.1 49.8Total debt service/exports .. 8.9 10.0 7.0Present value of debt/GDP .. .. 75.6 ..Present value of debt/exports .. .. 153.1 ..
1980-90 1990-00 1999 2000 2000-04(average annual growth)GDP 4.6 7.9 4.8 5.5 6.8GDP per capita 2.2 6.0 3.5 4.1 5.4Exports of goods and services .. 23.4 22.6 14.8 ..
STRUCTURE of the ECONOMY1980 1990 1999 2000
(% of GDP)Agriculture .. 37.5 25.4 24.3Industry .. 22.7 34.5 36.6
Manufacturing .. 18.8 17.6 ..Services .. 39.9 40.1 39.1
Private consumption .. 86.5 68.8 66.6General government consumption .. 7.5 7.1 6.4Imports of goods and services .. 33.4 .. ..
1980-90 1990-00 1999 2000(average annual growth)Agriculture 4.3 4.8 5.2 4.0Industry .. 12.1 7.7 10.1
Manufacturing .. .. .. ..Services .. 7.8 2.2 5.6
Private consumption .. 10.2 .. ..General government consumption .. 10.9 2.5 ..Gross domestic investment .. 20.2 -3.0 10.9Imports of goods and services .. 29.4 25.5 15.3
Note: 2000 data are preliminary estimates.
* The diamonds show four key indicators in the country (in bold) compared with its income-group average. If data are missing, the diamond willbe incomplete.
-20
0
20
40
60
95 96 97 98 99 00
GDI GDP
Growth of investment and GDP (%)
Vietnam
Low-income group
Development diamond*
Life expectancy
Access to improved water source
GNIpercapita
Grossprimary
enrollment
0
20
40
60
80
95 96 97 98 99 00
Exports Imports
Growth of exports and imports (%)
Vietnam
Low-income group
Economic ratios*
Trade
Domesticsavings
Investment
Indebtedness
Kondo
J-29

Vietnam
PRICES and GOVERNMENT FINANCE1980 1990 1999 2000
Domestic prices(% change)Consumer prices .. 36.4 4.3 -1.8Implicit GDP deflator .. 42.1 5.6 5.3
Government finance(% of GDP, includes current grants)Current revenue .. 14.7 19.6 19.6Current budget balance .. 0.0 5.9 4.8Overall surplus/deficit .. .. -0.8 -1.8
TRADE1980 1990 1999 2000
(US$ millions)Total exports (fob) .. 1,731 11,540 14,448
Rice .. 272 969 667Fuel .. 390 2,092 3,548Manufactures .. .. .. ..
Total imports (cif) .. 1,901 13,480 14,259Food .. 86 .. ..Fuel and energy .. 356 .. ..Capital goods .. 561 .. ..
Export price index (1995=100) .. .. .. ..Import price index (1995=100) .. .. .. ..Terms of trade (1995=100) .. .. .. ..
BALANCE of PAYMENTS1980 1990 1999 2000
(US$ millions)Exports of goods and services .. 1,913 14,010 17,107Imports of goods and services .. 1,901 13,480 17,344Resource balance .. 12 530 -237
Net income .. -412 -427 -597Net current transfers .. 49 1,050 1,341
Current account balance .. -351 1,154 507
Financing items (net) .. 510 130 -412Changes in net reserves .. -159 -1,284 -95
Memo:Reserves including gold (US$ millions) .. .. .. ..Conversion rate (DEC, local/US$) .. 6,482.8 13,944.0 14,170.0
EXTERNAL DEBT and RESOURCE FLOWS1980 1990 1999 2000
(US$ millions)Total debt outstanding and disbursed .. 23,270 23,260 15,600
IBRD 0 0 0 0IDA 2 59 989 1,113
Total debt service .. 174 1,410 1,218IBRD 0 0 0 0IDA 0 1 8 9
Composition of net resource flowsOfficial grants .. 96 257 ..Official creditors .. -86 839 973Private creditors .. 0 -781 -717Foreign direct investment .. 16 1,609 ..Portfolio equity .. 0 0 ..
World Bank programCommitments 0 0 318 260Disbursements 1 0 158 175Principal repayments 0 1 2 2Net flows 1 -1 156 173Interest payments 0 0 7 7Net transfers 1 -1 150 166
The World Bank Group: http://www.worldbank.org/data/ 9/6/01
-15
-10
-5
0
5
94 95 96 97 98 99 00
Current account balance to GDP (%)
0
5,000
10,000
15,000
20,000
94 95 96 97 98 99 00
Exports Imports
Export and import levels (US$ mill.)
-10
0
10
20
30
95 96 97 98 99 00
GDP deflator CPI
Inflation (%)
G: 1,700
D: 1,141
C: 316B: 1,113
F: 3,110
E: 8,220
Composition of 2000 debt (US$ mill.)
A - IBRDB - IDAC - IMF
D - Other multilateralE - BilateralF - PrivateG - Short-term
Kondo
J-30

Vietnam Social IndicatorsLatest single year Same region/income group
East
Asia & Low-1970-75 1980-85 1993-99 Pacific income
POPULATION Total population, mid-year (millions) 48.0 58.9 77.5 1,836.6 2,417.1 Growth rate (% annual average for period) 2.3 1.8 1.6 1.2 1.9Urban population (% of population) 18.8 19.6 19.6 34.5 31.4Total fertility rate (births per woman) 5.7 4.2 2.3 2.1 3.7
POVERTY(% of population)National headcount index .. .. 50.9 .. .. Urban headcount index .. .. 25.9 .. .. Rural headcount index .. .. 57.2 .. ..
INCOMEGNI per capita (US$) .. .. 370 1,010 420Consumer price index (1995=100) .. .. .. 136 138Food price index (1995=100) .. .. .. .. ..
INCOME/CONSUMPTION DISTRIBUTIONGini index .. .. 36.1 .. ..Lowest quintile (% of income or consumption) .. .. 8.0 .. ..Highest quintile (% of income or consumption) .. .. 44.5 .. ..
SOCIAL INDICATORSPublic expenditure Health (% of GDP) .. .. 0.8 1.7 1.2 Education (% of GNI) .. .. 3.0 2.9 3.3 Social security and welfare (% of GDP) .. .. .. .. ..Net primary school enrollment rate(% of age group) Total .. 91 .. 100 .. Male .. .. .. 100 .. Female .. .. .. 100 ..Access to an improved water source(% of population) Total .. .. 56 75 76 Urban .. .. 81 93 88 Rural .. .. 50 66 70Immunization rate(% under 12 months) Measles .. 19 93 83 64 DPT .. 42 93 82 70Child malnutrition (% under 5 years) .. 52 37 12 ..Life expectancy at birth(years) Total 60 65 69 69 59 Male 59 63 66 67 58 Female 62 67 71 71 60Mortality Infant (per 1,000 live births) 73 49 37 35 77 Under 5 (per 1,000 live births) 157 105 42 44 116 Adult (15-59) Male (per 1,000 population) 320 262 205 184 288 Female (per 1,000 population) 256 204 144 141 258 Maternal (per 100,000 live births) .. .. 160 .. ..Births attended by skilled health staff (%) .. 100 77 .. ..
Note: 0 or 0.0 means zero or less than half the unit shown. Net enrollment ratios exceeding 100 indicate discrepanciesbetween the estimates of school-age population and reported enrollment data. Latest year for access to improved watersource data is 2000.
2001 World Development Indicators CD-ROM, World Bank
Kondo
J-31

COUNTRY REPORT
China

Country Report : China
K - 1
1. Introduction
Rice is one of the main staple food grains for China aside from wheat and corn. The Governmentplaces great emphasis on domestic and marketing policies to ensure the continuous supply of thesestaple food grains. It is a challenge for all the government in China for more than 5,000 years of itshistory. Production and management of food for 1.3 billion people is no simple task.
There are at least three reasons that make China food policy differs from other countries:
a) China is very big and any action will have a significant impact on the international rice market,either positively or negatively. These repercussions will subsequently have an impact onChina. For example, 1% of total consumption would be about 15% of total world trade in rice.If China were to seek this from the world market, world's rice price will increase.
b) There are variation in the output due to uncertainties in weather and natural disasters.
2. Rice Production
One of the main objectives of government intervention into China’s agricultural economy is tomaintain full or near self-sufficiency in grains. As a result, China’s government and Communist partyleaders place great emphasis on domestic and marketing policies for wheat, corn and rice. This isbecause these crops typically account for 88 percent of total grain output.1
2.1 Production Policy
To achieve such objective, a variety of policies have been introduced. Main features of China’sinstitutional and production policies are Household Production Responsibility System (HPRS) andGovernors’ Grain Bag Responsibility System.
HPRS was introduced in the early 1980’s. Under the HPRS, local collectives allocate farmers long-term use rights to agricultural land for up to 30 years. In return for the allocation, farmers areobligated to deliver a grain quota that is bought by state grain bureaus at prices determined by thegovernment. This policy thus provided opportunities for farm households to make their owneconomic decisions, including allocating product inputs and retaining surplus after fillinggovernment quotas or targets.2
Whilst HPRS provided incentives to grow grain, Governor’s Grain Bag Responsibility System isintended to put more pressure on provincial leaders to pay greater attention to the development ofagriculture and food production including rice. It assigns ultimate responsibility for securing grain
1 State Trading & Management of Grain Marketing in China, Economic Research Service, U.S. Department of Agriculture.2 Economic Research Service, U.S. Department of Agriculture, published on 27 December 2000

Country Report : China
K - 2
needed in a province to the provincial leadership. According to this policy, it is mandated that theprovincial leaders:
• maintain an overall balance of grain supply and demand within their province;• stabilize grain production area, output, and stocks; and• use local reserves to regulate markets and stabilize prices.3
Due to the abolishment of official procurement prices for early rice as well as drought condition innorthern China, China witnesses a decline in the total sown area of rice especially the sown area ofearly Indica rice. This had led to a small decrease in the total rice production and stock in China.
2.2 Land Use & Output
Table 1 shows that there is an increase in sown area for rice and wheat for a short period of time buttotal sown area of rice and wheat have been decreasing gradually from 1997 onwards. This is due tothe abolishment in official procurement prices of the early rice, irrigation problem in northern Chinaand government compensation to return the land to pasture or forest.
Table 1: Total Sown Area of Rice and Wheat by Year (Unit: 1000 hectares)Total Sown Area Rice % Wheat % Others %
1995 149,879 30,744 20.51 28,860 19.26 90,275 60.231996 152,381 31,407 20.95 29,611 19.76 91,363 60.961997 153,969 31,765 21.19 30,057 20.05 92,147 61.481998 155,706 31,214 20.83 29,774 19.87 94,718 63.201999 156,372 31,283 20.01 28,854 18.45 96,235 61.54Source: National Statistics Bureau, China
According to Table 2, although rice cultivation is scattered throughout the country, it concentrateson two regions (Zone 3 and 4) in the south region of the country. These two regions accounts forabout 75% of the total cultivating area. The top 5 provinces - Hunan (12.74%), Jiangxi (9.29%),Guangdong (8.61%), Guangxi (7.8%) and Jiangsu (7.59%) - share about 46% of the production areaof rice.
It is interesting to note that major wheat growing areas are also in zone 3 and 4 which accounts forabout 51% to total wheat area. However, there are more wheat grown in the Northern region (zone1) and the higher area (zone 6).
3 Economic Research Service, U.S. Department of Agriculture, http://www.ers.usda.gov/briefing/china/institution.htm
published on 27 December 2000

Country Report : China
K - 3
Table 2: Sown Area of Crops by Region (Unit: 1000 hectares)
Total SownArea Rice % % in total
rice area Wheat % % in totalwheat areaRegion
a b b/a c c/aZone 1Beijing 535 19 3.62 0.06 171 31.98 0.57Tianjin 578 54 9.41 0.17 153 26.54 0.52Hebei 9,098 153 1.68 0.49 2,764 30.38 9.28Shanxi 4,038 6 0.15 0.02 963 23.86 3.24InnerMongolia 6,027 118 1.95 0.38 1,093 18.13 3.67
Zone 2Liaoning 3,630 496 13.66 1.59 150 4.14 0.50Jilin 4,062 459 11.30 1.47 75 1.83 0.25Heilongjiang 9,194 1,567 17.04 5.02 961 10.46 3.23Zone 3Shanghai 556 203 36.54 0.65 104 18.67 0.35Jiangsu 8,058 2,370 29.41 7.59 2,315 28.73 7.78Zhejiang 3,920 2,008 51.23 6.43 255 6.51 0.86Anhui 8,564 2,158 25.20 6.91 2,095 24.46 7.04Fujian 2,919 1,388 47.55 4.45 55 1.88 0.18Jiangxi 5,804 2,901 49.98 9.29 66 1.13 0.22Shandong 11,138 158 1.41 0.50 3,982 35.75 13.37Zone 4 Henan 12,567 498 3.97 1.60 4,964 39.50 16.67Hubei 7,696 2,239 29.10 7.17 1,211 15.74 4.07Hunan 7,936 3,976 50.10 12.74 145 1.82 0.49Guangdong 5,540 2,686 48.48 8.61 18 0.32 0.06Guangxi 6,293 2,434 38.67 7.80 26 0.41 0.09Hainan 938 389 41.44 1.24 - -Zone 5 Chongqing 3,615 795 21.99 2.55 548 15.17 1.84Sichuan 9,714 2,167 22.31 6.94 1,865 19.19 6.26Guizhou 4,514 747 16.54 2.39 605 13.39 2.03Yunnan 5,226 920 17.60 2.95 707 13.52 2.37Tibet 229 1 0.48 0.00 55 23.98 0.18Zone 6 Shaanxi 4,697 160 3.41 0.51 1,611 34.29 5.41Gansu 3,768 8 0.22 0.03 1,324 35.13 4.45Qinghai 567 - - 212 37.38 0.71Ningxia 1,005 67 6.61 0.21 317 31.51 1.06Xinjiang 3,279 69 2.11 0.22 967 29.49 3.25
Total in 1998 155,706 31,214 20.05 100.00 29,774 19.12 100.00
Source: National Statistics Bureau, China
Table 3 demonstrates trend of rice and wheat output. While the rice output has been decreasing ortends to be decrease from 1997 onwards, output of wheat still fluctuates. As previously mentioned,the decline in rice output primarily stems from the withdrawal of price support programmes.

Country Report : China
K - 4
Table 3: Output of Rice and Wheat by YearYear Rice Wheat1995 185,226 102,2071996 195,103 110,5691997 200,735 123,2891998 198,713 109,726
1999* 198,5002000* 187,6002001* 181,500
(Unit: 1,000 Tons)Note: * are estimates from USDA.Source: National Statistics Bureau, China.
Base on Table 4, most of the rice comes from Zone 3 and 4. However, there is big yield differenceacross regions. Hunan (11.8%) is still the largest production province followed by Jiangxi (10.51%).
It is interesting to observe the variation of yield per ha across the provinces. The largest productionprovince -Hunan- in fact has a relatively low yield (5.9 mt/ha). This is lower than the nationalaverage of 6.37 mt/ha. Small production provinces like Ningxia and Shandong carry very highyield per ha. This could reflect the influence of the Household Responsibility System started in1986 where each household was assigned with the target level of output. And each town is alsogiven a target level of output to attain.
The lower yield in Hunan put some pressure on the effort to expand the production of "hybrid" ricein Hunan and other rice growing area. If this effort is successful, the output of rice in China maybe pushed to an unprecedented level.
Table 4: Rice and Wheat Output and Yield (Unit: 1,000 Tons)Rice Wheat
Output % Yield (ton/ha) Output % Yeild (ton/ha)Zone 1Beijing 133 0.07 6.86 967 0.88 5.65Tianjin 452 0.23 8.31 761 0.69 4.96Hebei 992 0.50 6.48 12,536 11.42 4.54Shanxi 40 0.02 6.56 3,209 2.92 3.33Inner Mongolia 603 0.30 5.12 2,827 2.58 2.59Zone 2 Liaoning 3,789 1.91 7.64 614 0.56 4.09Jilin 3,855 1.94 8.40 106 0.10 1.42Heilongjiang 9,258 4.66 5.91 2,852 2.60 2.97Zone 3 Shanghai 1,630 0.82 8.02 311 0.28 2.99Jiangsu 20,892 10.51 8.82 7,597 6.92 3.28Zhejiang 12,078 6.08 6.02 612 0.56 2.40Anhui 13,902 7.00 6.44 5,991 5.46 2.86Fujian 7,288 3.67 5.25 154 0.14 2.80Jiangxi 14,256 7.17 4.91 92 0.08 1.40Shandong 1,389 0.70 8.81 20,245 18.45 5.08

Country Report : China
K - 5
Rice WheatOutput % Yield (ton/ha) Output % Yeild (ton/ha)
Zone 4 Henan 3,697 1.86 7.42 20,735 18.90 4.18Hubei 16,332 8.22 7.29 4,093 3.73 3.38Hunan 23,450 11.80 5.90 257 0.23 1.78Guangdong 16,141 8.12 6.01 51 0.05 2.87Guangxi 12,909 6.50 5.30 35 0.03 1.37Hainan 1,624 0.82 4.18 - 0.00 0.00Zone 5 Chongqing 5,158 2.60 6.49 1,306 1.19 2.38Sichuan 16,437 8.27 7.58 6,011 5.48 3.22Guizhou 4,764 2.40 6.38 1,089 0.99 1.80Yunnan 5,375 2.70 5.84 1,513 1.38 2.14Tibet 5 0.00 4.55 291 0.27 5.29Zone 6 Shaanxi 1,013 0.51 6.33 5,042 4.60 3.13Gansu 58 0.03 6.90 4,126 3.76 3.12Qinghai - 0.00 799 0.73 3.77Ningxia 629 0.32 9.46 938 0.85 2.96Xinjiang 563 0.28 8.15 4,566 4.16 4.72
Total Production 198,712 100.00 6.37 109,726 100.00 3.69
Source: National Statistics Bureau, China
As demonstrated in the table below, rice production in China can be divided into three majorseasons which are early, middle and late. Middle season rice accounts for about 55% which is thehighest production proportion. Early and Late double crop account for about 21% and 24%respectively.
Table 5: Output and Sown Areas of Rice, by Cropping SeasonsSown Area
(thousand hectares)Total Output
ten thousand tonsTotal Output
by percentageItem1998 1999 1998 1999 1998 1999
Early Rice 7,808.10 7,575.36 4,052.34 4,096.70 20.39 20.64Middle Rice 14,962.20 15,300.22 10,955.33 10,939.83 55.13 55.12
Late Rice 8,443.68 8,407.98 4,863.57 4,812.31 24.48 24.24Total 31,213.98 31,283.56 19,871.24 19,848.84 100.00 100.00
Source: China Agriculture Yearbook 1999 & 2000
Whereas early rice is a long grain type (Indica) which tends to be of poorer quality and is notfavoured by consumer, farmers used to produce it as they can use early Indica rice to fill thegovernment quotas at procurement price. This explains why State stocks of poor quality rice arereportedly high.

Country Report : China
K - 6
2. Rice Marketing
Currently, domestic grain and rice marketing in China is highly controlled by the government. Centraland provincial governments exert considerable control over all aspects of China’s food grain sectorthough government-owned and managed grain bureaus. Of their particular attention are wheat, riceand corn as they typically account for high grain output.
Grain Bureaus, administered under the State Trading Enterprises (STE’s), located at province,prefecture and country levels draw up grain supply-and-use tables to determine grain availability andneeds for each administrative unit. For instance, geographic units are classified as surplus if grainoutput exceeds local consumption requirements, self-sufficient if output equals local requirements, ordeficit if output is less than requirements.4 Such information allows the central and provincialgovernments to determine the quantities of grain they need to purchase as well as set purchase pricesfor wheat, rice and corn procurement quotas.
The flow of rice is shown in Annex 6. Farmers (producers) who have been assigned quotas mustdeliver the specified grains to local Grain Bureaus, which provincial and local governments use tomanage the purchase and sale of key grains. Through Grain Bureaus, grains will then be distributed tomilitary units, wholesale markets, feed mills, grain storage facilities, and grain and food processors,and part of the supply for urban residents in large cities.
Whereas governors from each provinces jointly work out the movement of grains across the provincialborders, the local and provincial government leaders work hand in hand in the movement of grainwithin provinces. The whole system provides the national government leaders with supply-and-usebalance sheets which is used to assess grain export opportunities as well as import requirements.
3. Price Policy
Domestic rice price system in China is a combination of planned economy and free market economy.It frequently takes the form of government control over most marketing accompanied by a free marketdiscipline to government institutions. As the development and application of several price policies aresignificant to the understanding of the current price policy, this section will provide concise overviewof each major policy.
The main features of China’s rice and other agricultural commodities price policy introduced since1980 are:
1. Procurement price policy: To secure food supply, farmers are required to deliver rice and othergrain to the government agencies only and at procurement price set by the government. Normally,each farmer was assigned to deliver grain at specific quota set by the government. The government
4 State Trading & Management of Grain Marketing in China, Economic Research Service, U.S. Department of Agriculture
( http://www.ers.usda.gov/publications/agoutlook/jun1999/ao262e.pdf )

Country Report : China
K - 7
would procure quota grains at the quota procurement price and above-quota grains at above-quotaprices.
2. Procurement contract system: This system was introduced in 1985. Under this new contractsystem, the government purchased some grain at prices below the market price for rice withincontract quota, but also purchased other grain at negotiated prices and at open market prices forrice that exceeds the contract quota.
3. Reduction in government procurement quotas : In order to increase farm income as well as boostproduction incentives, the government reduced the amount of grain purchased under the contractsystem in the years after 1985. As a result, farmers could sell more of their grain on the openmarket at higher prices. At the same time as the government reduced contract grain purchased, thegovernment also increased purchases of grain at the so-called “negotiated price” which wassharply higher than the contract price to supply to urban consumers.
4. Elimination of the urban grain-rationing system: Under this system, China’s government issuedurban consumers coupons giving them the right to buy a specified amount of grain per person at alow price. Grain above the ration amount could be purchased are market price which was usuallymore expensive. It is reported that the China’s government-set retail price for grain rationremained unchanged for 25 years. Each rise in the procurement prices thus caused the governmentbudget pressure under this urban grain-rationing system. Finally, the coupon-based grain rationingsystem was eliminated in 1994.
5. Price support program: To further bolster farm income and to meet food security goals, thecentral government launched price support policy and set support price for all grain throughout thecountry. In addition, the central government and provincial government pays subsidies to themarketing enterprises for grain purchased by state grain trading enterprises at the support pricelevel. By the end of 1997, the central government had incurred a loss of 120 billion RMB (roughly$15 billion) because of this grain purchasing program. 5
6. Grain distribution reform: In response to the perceived shortcomings in the grain reform programof the 1990’s, the central government introduced even deepen grain distribution reform in May1998. The grain distribution reform was summarized as “four separations and one improvement”.The four separations set for grain marketing are:• separating government policy from commercial business functions,• separating central grain reserves from local commercial reserves,• separating central and local responsibilities on grain marketing, and• separating new debts from old debts.6
5 Economic Research Service, U.S. Department of Agriculture, http://www.ers.usda.gov/briefing/china/price.htm published
on 27 December 20006 Ibid.

Country Report : China
K - 8
The significance of this policy was that quota procurement prices were to be governed by theprevailing market price.
However, only state grain enterprises are allowed to purchase grain from farmers, while privategrain dealers are only permitted to sell grain that is bought from government grain-marketingenterprises. The purpose of this change was to allow government grain enterprises to monopolizethe country’s grain-marketing system so that grain prices would rise above the governmentprotection price. Once that occurred, government debts would be erased and grain marketing wouldthen return to its previous more liberalized method of operation. 7
In transition from a control system to a free market system is an easy process and it will take moretime. For the country as a whole, the grain selling at market price was not yet wholly achieved.Some grain handling enterprises in really implementing the policy of open-end purchasing ofsurplus grain at the protective price, some low-priced grain flowed into the market, making itdifficult for STE’s to realize selling at market price.8
Further to the financial burden incurred from buying that grain, China’s government also runs out ofstorage space. Therefore, China’s government eliminated its price support programme for severalgrain commodities including early season rice (indica rice) grown in the south of the Yangtze Riverin 2000 and all rice in Shanxi, Hebei, Shandong and Henan in 2001. By 2002, only mid-and-lateindica rice of mid-Yangtze reach provinces and quality japonica rice of Northeastern provinces areunder the price support programme. Also, grain market in 8 coastal provinces namely Zhejiang,Shanghai, Fujian, Guangdong, Hainan, Jiangsu, Beijing and Tianjin, China’s major rice sales area,were completely liberalised. Unsurprisingly, it is reported that sown area and production of 2001crops declines.
4. Rice Trade
4.1 Export
Like other countries, China does release excess stock of rice by exporting to other countries. Mostof China’s rice exports were indica varieties from the Yangtze River region, including Jiangxi,Anhui, Hunan, and Jiangsu provinces. The majority of japonica rice which accounts for only about20 per cent of rice stock were mainly exported from the northeastern provinces namely, Liaoning,Heilongjiang and Jilin. This is because there are number of joint-venture farms with investors fromJapan and Korea have been producing rice for the export market.9
7 Ibid.8 “Huang Yanxin The Future of China’s Grain Market, Economic Research Service, U.S. Department of Agriculture,
“Policies and Reform of the Grain Distribution System” in Editorial Board of China Agriculture Yearbook, eds., ChinaAgricultural Yearbook 1999 (Beijing: China Agriculture Press, 2000), p. 68
9 Tradeoffs between quantity and quality of China Rice, Economic Research Service, U.S. Department of Agriculture( http://www.ers.usda.gov/publications/wrs012/wrs012g.pdf )

Country Report : China
K - 9
Recently, China has exported increasing quantities of rice to countries outside eastern Asia. Thesecountries include Cote d’Ivoire, Cuba, Russia, Iran and Guinea.
4.2 Import
Whereas exports tend to be low-quality indica rice, imports are likely to be premium grade qualityrice from Thailand, the US and Myanmar. Thailand has been the dominant supplier of rice toChina’s market. In 2000, for instance, Thailand accounted for over 99 percent of rice imported intoChina. Southern coastal provinces, particularly Guangdong and Hainan, are major rice importersbecause of their strategic locations and the convenience of transportation systems.10
Table 6: Rice exports and imports by country, Calendar year 1997-2000 (Unit : 1000 Tons)
Country 1997 1998 1999 2000 4-YearAverage
4-YearShares (%)
Export:Philippines 184.4 1,374.7 180.6 64.4 451.0 17.5Indonesia 9.8 1,326.6 734.2 541.9 662.1 25.6North Korea 91.8 77.9 86.3 52.7 77.2 3.0South Korea 13.9 74.6 115.8 131.0 83.9 3.2Japan 36.3 81.2 75.6 66.4 64.9 2.5Iraq 124.0 98.7 102.9 169.5 123.8 4.8Cote d’Ivoire 100.0 179.9 421.1 869.6 392.7 15.2Cuba 84.6 145. 4 226.9 225.5 170.6 6.6Others 294.3 350.4 759.9 827.0 557.9 21.6
Total 939.3 3,745.4 2,703.2 2,948.1 2,584.0 100.0
Imports:Thailand 323.2 242.5 167.6 238.0 242.8 99.4United States 1.2 0.5 0.6 0.4 0.7 0.3Myanmar 1.0 0.0 0.0 0.0 0.2 0.1Others 0.8 0.8 0.1 0.2 0.4 0.2
Total 326.2 243.8 168.3 238.6 244.2 100.0Source: China Customs statistics11
4.3 Trade Agreement
(1) Bilateral Agreement
US-China Bilateral WTO Agreement on Agriculture
The Agreement would eliminate barriers and increase access for US exports across a broad range ofcommodities. The commitments include:
• Significant cuts in tariff that will be completed by January 2004. Overall average foragricultural products will be 17.5% and for US priority products 14% (down from 31%).
10 Ibid., p. 26

Country Report : China
K - 10
• Establishment of tariff-rate quota (TRQ) system for import bulk commodities e.g. wheat, corn,cotton, barley and rice, that provides a share of TRQ for private traders. Specific rules on howthe TRQ will operate and increase transparency in the process will help ensure that importoccur. Significant and growing quota quantities subject to tariffs that average between 1-3%.
• The right to import and distribute products without going through a state-trading enterprises ormiddleman.
• Elimination of export subsidiaries on agricultural products. China has also agreed t theelimination of Sanitary and Phytosanitary Stadnards (SPS) barriers that are not based onscientific evidence. 12
(2) Multilateral Agreement:
China’s Commodity Agreement for WTO Accession:
China's commitment to the WTO on rice are:• Grant one percent tariff quota of 3.99 million ton of rice in the first year upon entry into that
organisation, rising progressively to 5.32 million ton in 2004 .• Grant one percent tariff for rice imported within quota, while the above quota tariff would be
reduced from 77 percent to 65 percent by 2004.• Allocate 50 percent of the import quota rights to private sector from the first implementation
year.
4.4 Government Control
China’s government conduct trade of many important agricultural commodities through a system ofstate-owned and state-controlled foreign trade enterprises. This system enables China’s governmentto manage the level and direction of the trade flow of these and other commodities covers rice aswell as other grain commodities. The government manages China's foreign trade in grains includingrice in three ways.
• It uses annual planned targets to control quantities and varieties of imported or exported grainsto insulate the domestic market from fluctuations or shocks in the international market.
• It employs fixed prices in the grain trade to eliminate price transmission effects betweeninternal and foreign markets.
• It uses the domestic price system and other administrative measures for grain trading topromote exports, increase foreign exchange earnings, and reduce foreign exchangeexpenditures.13
11 This table is cited in Tradeoffs between quantity and quality of China Rice, Economic Research Service, U.S.
Department of Agriculture (http://www.ers.usda.gov/publications/wrs012/wrs012g.pdf )12 Supachai Panitchpakdi & Mark L Clifford, China and the WTO: Changing China, Changing World Trade (Singapore:
John Wiley & Sons (Asia) Ple. Ltd., 2002), p. 221-222.

Country Report : China
K - 11
Tariff barrier on rice in China is minimal and is not considered a serious barrier to trade incomparison with the non-tariff barrier. China’s government applies quota and license system tocontrol the quantities as well as varieties of imported or exported rice.
China’s government requires import and export license for rice. All imports and exports are basedon quota system set by the government. China’s government did not publish the figure of quotaprior to its accession to WTO. Last but not least, China has recently implemented sanitary andphytosanitary (SPS) measures that may affect the imports of certain commodities.14
However, with the liberalisation of grain market in 8 coastal provinces (Zhejiang, Shanghai, Fujian,Guangdong, Hainan, Jiangsu, Beijing and Tianjin), rice trade will be less restricted. More provincesare expected to be included in this scheme. This is a positive development and complement China'scommitment in WTO.
4.5 Role of Concern Government Agencies
Despite of the commitment made to the WTO, rice exporting countries often claim that rice importsare still administered under a complex and non-transparent maze of quotas and licences. The keyinstitutional players involved in the administration of quota system are:
The State Council (SC), the highest administrative player, is the primary policy making body. Itsresponsibility includes determining the quantities of grains to be purchased by the states, the level ofprocurement prices, stock building and stock use, and the level and direction of grain foreign trade.
The State Development and Planning Commission (SDPC) provides economic policyrecommendations to the SC. It is also in charged of the overall planning of import and export ofgrain, deciding the annual rice import quota.
The State Administration of Grain (SAG), a government agency administered under the SDPC,draws up grain balance sheets for the entire country and manages grain reserve strategy.
The Ministry of Foreign Trade and Economic Cooperation (MOFTEC) controls and supervisesthe overall administration of the issuance of import quota and license nation wide. It allocatesindividual import quotas to Provincial and Municipal Planning Committees (PMPC) andProvincial and Municipal Foreign Trade Commissions (PMFTC). PMFTC then distributesquotas to foreign joint ventures and/or wholly owned foreign enterprises.15
13 Economic Research Service, U.S. Department of Agriculture http://www.ers.usda.gov/briefing/china/tradepolicy.htm
published on 27 December 200014 Chinese rice Market, published by the Australian Trade Commission
( http://www.austrade.gov.au/image/China_rice_market.pdf )15 Chinese rice Market, published by the Australian Trade Commission.
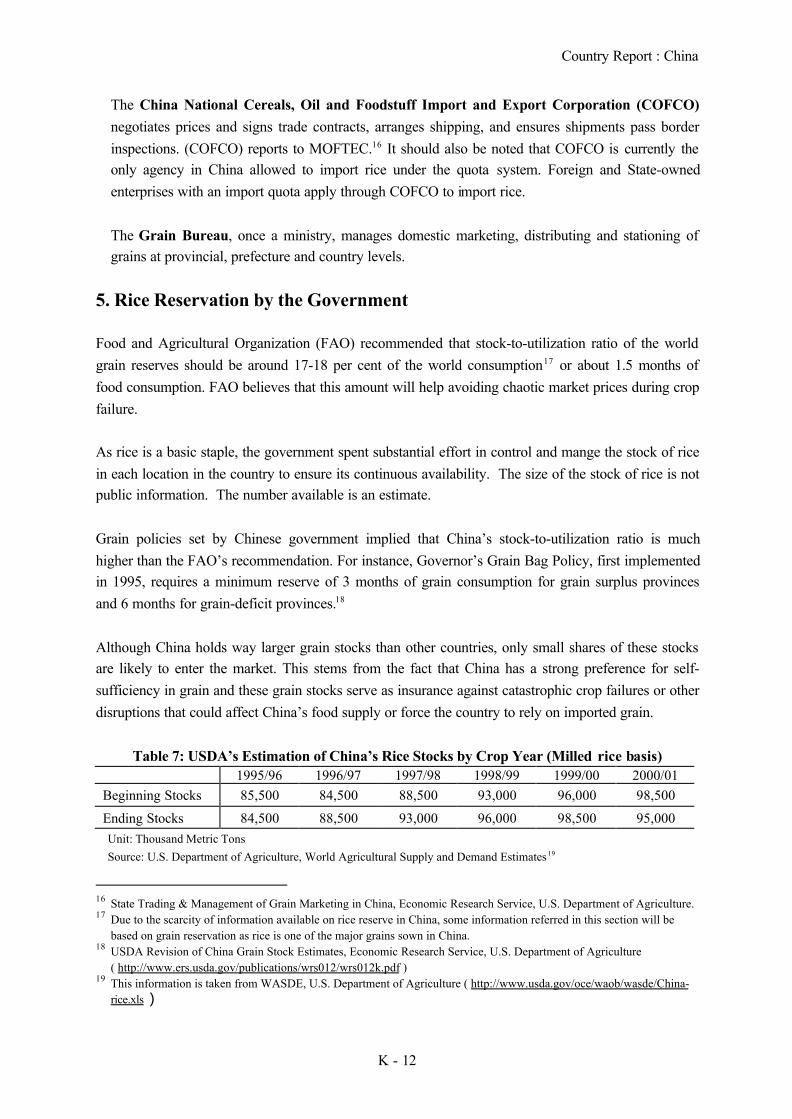
Country Report : China
K - 12
The China National Cereals, Oil and Foodstuff Import and Export Corporation (COFCO)negotiates prices and signs trade contracts, arranges shipping, and ensures shipments pass borderinspections. (COFCO) reports to MOFTEC.16 It should also be noted that COFCO is currently theonly agency in China allowed to import rice under the quota system. Foreign and State-ownedenterprises with an import quota apply through COFCO to import rice.
The Grain Bureau, once a ministry, manages domestic marketing, distributing and stationing ofgrains at provincial, prefecture and country levels.
5. Rice Reservation by the Government
Food and Agricultural Organization (FAO) recommended that stock-to-utilization ratio of the worldgrain reserves should be around 17-18 per cent of the world consumption17 or about 1.5 months offood consumption. FAO believes that this amount will help avoiding chaotic market prices during cropfailure.
As rice is a basic staple, the government spent substantial effort in control and mange the stock of ricein each location in the country to ensure its continuous availability. The size of the stock of rice is notpublic information. The number available is an estimate.
Grain policies set by Chinese government implied that China’s stock-to-utilization ratio is muchhigher than the FAO’s recommendation. For instance, Governor’s Grain Bag Policy, first implementedin 1995, requires a minimum reserve of 3 months of grain consumption for grain surplus provincesand 6 months for grain-deficit provinces.18
Although China holds way larger grain stocks than other countries, only small shares of these stocksare likely to enter the market. This stems from the fact that China has a strong preference for self-sufficiency in grain and these grain stocks serve as insurance against catastrophic crop failures or otherdisruptions that could affect China’s food supply or force the country to rely on imported grain.
Table 7: USDA’s Estimation of China’s Rice Stocks by Crop Year (Milled rice basis)1995/96 1996/97 1997/98 1998/99 1999/00 2000/01
Beginning Stocks 85,500 84,500 88,500 93,000 96,000 98,500
Ending Stocks 84,500 88,500 93,000 96,000 98,500 95,000Unit: Thousand Metric TonsSource: U.S. Department of Agriculture, World Agricultural Supply and Demand Estimates19
16 State Trading & Management of Grain Marketing in China, Economic Research Service, U.S. Department of Agriculture.17 Due to the scarcity of information available on rice reserve in China, some information referred in this section will be
based on grain reservation as rice is one of the major grains sown in China.18 USDA Revision of China Grain Stock Estimates, Economic Research Service, U.S. Department of Agriculture
( http://www.ers.usda.gov/publications/wrs012/wrs012k.pdf )19 This information is taken from WASDE, U.S. Department of Agriculture ( http://www.usda.gov/oce/waob/wasde/China-
rice.xls )

Country Report : China
K - 13
Rice and other grain stocks, as shown in Table 8, are held by at least five major units, each of whichhave distinct function in Chinese Society. They are as follows:
1. Central Government (State) Reserves: As a result of the reorganization of the StateAdministration of Grain Reserve (SAGR) in 2000, there was a separation between policy-formulating entities and grain trade business operations. This led to the establishment of 14 graincompanies in selected production and consumption areas by the government. These graincompanies control and operate approximately 2,800 grain warehouses with an estimated storagecapacity of 25 million tons.20
2. Government Grains in Circulation: These stocks include grain purchasing at protection(procurement) prices which can also be resold at market prices. Normally, two-thirds of thegovernment procurement amount is circulated each year, including food supplies to military andgovernment facilities. Stock of grain for circulation could be five times higher than the 2-millionton reserved by the government.
3. Local Government Reserves: These stocks protect against region-specific grain shortage thatmay not be immediately alleviated due to the poor transportation infrastructure within China. Thegovernment set the target at 20 million tons, equivalent to 1 – to 1.5- month consumption needs.
4. Retail and Wholesale Grain Stores: As small private enterprises and retailers can purchase graindirectly from farmers at free market price and wholesale grain stores exist in numerous places,grain tends to be fresher and consumers pay premium price for the quality. Hence, rice stock holdby these retailers and wholesalers are considered to be “true market” grain in the commercialpipeline. Unfortunately, there has been no study indicating the estimate stock hold by theseretailers and wholesalers.
5. On-farm storage : Normally, farmers store their grain at home or at local mills. Statisticalpublications from China indicate that grain stocks hold by rural households can be as high as 350to 400 kilograms (770 to 880 pounds) per capita. Survey of farm households also reveals that on-farm storage for cropping year 1995/96 was approximately 90 million tons. That is a 300-percentincrease from the early 1980s.
It can be concluded that farm households held most of China’s grain inventories. Some studiesindicate that on-farm grain stocks even surpassed 450 million tons in 1994 and 1995. This is due to thefact that farmers are greatly self-sufficient in food and rural food markets are still relativelyunderdeveloped in rural China. Therefore, there is the need to store adequate grain to satisfy familyconsumption. It also serves as a buffer against crop failures or natural disasters. Finally, grain serves
20 USDA Revision of China Grain Stock Estimates, Economic Research Service, U.S. Department of Agriculture
http://www.ers.usda.gov/publications/wrs012/wrs012k.pdf

Country Report : China
K - 14
as a store of wealth because the poorly developed financial system provides little or no means forfarmers to save for retirement or obtain credit when personal financial needs rise.
Table 8: China’s Reserve Target by Specific Grain
GrainsSown Area% of total
crops
Production % oftotal Grain output
Stock level (average 1996-1998) % of total grains
Targeted share oftotal grain
Rice 22-24 42-44 Indica 40Japonica 10
30
Wheat 20-23 20-23 40 50
Coarse grain 14-16 18-20 10 20
Total 56-63 80-87 100 100Source: Dai, Yuanchen et al., Reforms of China’s Grain Circulation system, Guangdong Economic Publications,
September 1999 21
6. Rice Demand & Consumption
It is reported that about 50 percent of the population in China has rice as their major staple. Domesticconsumption of rice has been increasing over the past few years due to population growth. However,several sources stipulate that per capita rice consumption is declining for both urban and ruralresidents. Primary cause is that consumer has access to more carbohydrate sources as income rises. Tosome researchers rice is an inferior good in China – a good whose demand falls as consumer incomesrise.
Another factor that affects the consumption of rice is the availability of substitutes (such as bread,meats and fruits) and the change in consumption behavior. These factors are closely associated withurbanization. In the urban areas where population are dense, there are more varieties of food available.At the same time, urban population are usually wealthier (average income is higher than the averageincome in the rural area). The increase in the urbanization, thus, associates closely with the decline inthe consumption of basic staple grains, such as rice.
Table 9 shows that about 30% of the population is in the urban area and its size is increasing slowly(about 1 million person a year). However, this official statistic does not reflect the in-migration ofrural workers who works in the household and factories in the urban area. As far as rice consumptionis concern, the consumption of rice for this group of population may still high at the beginning but itwill decline subsequently.
21 Ibid.

Country Report : China
K - 15
Table 9: Population in China* (Unit: 10,000 persons)Year Total Population Urban Population Rural Population
% %1996 122,389 35,950 29.37 86,439 70.631997 123,626 36,989 29.92 86,637 70.081998 124,810 37,942 30.40 86,868 69.601999 125,909 38,892 30.89 87,017 69.11
Source: The National Statistics Bureau, China
Table 10: Rice Consumption in China, Milled BasisRice Unit 1989-91 1994-96 2000 2005
Consumption 1,000 tons 126,070 128,479 129,479 129,306
Per capitaConsumption
Kilograms 110.4 105.7 102.0 98.4
Source: The Future of China’s Grain Market / AIB-730 Economic Research Service/USDA 22
Despite of the decrease in total per capita consumption as consumer’s incomes rise, the demand forquality rice grows as consumers become wealthier, particularly from urban residents in coastal cities.Apart from the income factor, consumer preference has traditionally been divided along the YangtzeRiver. Consumers north of the river prefer the shorter grain, Japonica rice, while the consumers southof the river prefer the long grain, Indica rice.
Humans consumption account for 85 percent of rice produced in China. In the verge of decline inhumans consumption, industrial and feed consumption, however, continue to rise. Feed industry andfarmers in Southern China are using more rice for feed since procurement price for low quality earlyrice was eliminated and low quality early rice is cheaper than corn.
7. Rice/Paddy Price
Over the last few years, prices of agricultural products including rice and other grains in China havebeen falling. In 1999, for instance, China witnessed big drop in the prices of agricultural produce onthe drop of the preceding year, as the general level of consumption price index was 1.4% lower andthe retail price index was 3% lower than in the preceding year.23
Since 1995, this trend predominated the wholesale price until mid-2000. Although price has gone upslightly, it was still at low level. In October 2001, for example, the wholesale market price for japonicarice was 1940 yuan/ton (lower than the 1998 price) whereas wholesale price for indica rice was 1470yuan/ton (lower than 1999 price).
* The information in this table includes military personnel but excludes population of Hong Kong, Taiwan and Macau.22 The Future of China’s Grain Market, Economic Research Service, U.S. Department of Agriculture
http://www.ers.usda.gov/publications/aib730/aib730ap.pdf23 Cao Hua, “Changes in Market Prices of Farm Produce” in Editorial Department of China Agriculture Yearbook, eds.,
China Agriculture Yearbook 2000 (Beijing: China Agriculture Press, 2000), p.85

Country Report : China
K - 16
Table 11: Rice Price Trends (Unit: RMB yuan/ton)Dec-00 Dec-99 (+/-) Dec-98 (+/-) Dec-95 (+/-)
Japonica (S1) 1800 -5.5% -19.5% -39.0%Indica (S1) 1455 -7.5% -25.1% -40.7%
Source: http://www.agri.gov.cn/ztzl/2002/0116/01161.htm24
Note: S1 = Standard 1USD 100 = CNY 828.84
Table 12: Rice Price between February 1999 to February 2000Products Average price
(CNY)Compared with same period
1999 (%)Wheat 1,144/ton -21.57Rice (Japonica) 1,860/ton -14.6Early Rice (Indica) 1,463/ton -23.5Late Rice (Indica) 1,568/ton -23.6Source: China Development Brief25
The drop in price of rice and grain was the result of excessive supply of low-quality rice and grain. Asrice and grain inventories grew, all locations introduced measures to undersell the ages rice and grain.This caused market prices to drop even more. This was worsened by the continued slump of prices ofagricultural product in the international market.
It is interesting to note that the price of rice and wheat is declining faster than the price of corn (inFigure 1). The increase in the consumption ofcorn for feed has increased (in particular,chicken feed) has prop-up its price. Thedecrease in the price of rice, especially, thelower quality of rice will find the floor price asthe substitute for corn as animal feed. Thedemand for feed will increase as theconsumption of meat increase in respond toincome increase and urbanization.
Source: China Development Brief26
24 He Yupeng, “People’s Republic of China’s Paper on Domestic Rice Policy”, the First Technical Meeting on Rice Reserve
under the Development Study on East Asia/ASEAN Rice Reserve System, 19 April 200225 This information is cited in “From equal poverty to dynamic inequality” published in China Development Brief at
http://www.chinadevelopmentbrief.com26 Ibid
Figure 1

Country Report : China
K - 17
However, there is the sign of better prices for better grain. Requirements set by the State Council andthe increasing demand for quality grain gradually widens the gap between high quality and low qualityrice. For instance, price of a quality variety that sells fast on the market can be 6%-20% higher thancommon varieties.
8. Food Aid
World Food Programme (WFP), a UN specialised Agency, is one of the major food aid donors toChina. China’s government has built an increasingly effective partnership by closely matching WFP’scontribution with its own contributions over the last two decades.
WFP classified China as a low-income food-deficit country. Despite China’s impressive economicprogress and near food self-sufficiency, an estimated 34 million rural people continue to live below theGovernment’s austere poverty line of Yuan 635 per person per year (approximately US$0.66 perday).27 Among this, rural women and children residing in China remote western regions are the mostvulnerable and disadvantaged in gaining access to resources particularly in the age when China isundergoing major economic change.
Because of the progressive economic development in China and the success of agricultural policy tobe self-sufficient in food, WFP needs to adjust its role in assisting China. With the phasing out WFPfood assistance, WFP works with the United Nations Development Assistance Framework (UNDAF)in adopting a Country Programme (CP) aiming to promote sustainable development in China.
The objective of China CP is to bring sustainable improvements in food security for more than 1.7million poor households over the period 2001–2005. Emphasis will be placed on the reduction ofregional and gender disparities by:
• Enable poor households to invest in human capital through education and training;• Make it possible for poor families to gain and preserve assets; and• Enable households that depend on degraded natural resources for their food security to make a
shift to more sustainable livelihoods.28
9. Poverty
9.1 Situation of Poverty & Poverty Alleviation
Estimate of the extent of poverty can be varied depending on type of indicators one chooses. Basedon the government poverty line, number of China’s rural ppor has been decreasing dramatically.That is from 250 million in 1978 (or about 30% of rural population) to 42 million in 1998 (4.6% of
27 Project 2002 Needs, World Food Programme ( http://www.wfp.org/country_brief/index.asp?continent=2 )28 Country Programme, World Food Programme http://www.wfp.org/index.asp?section=5

Country Report : China
K - 18
the rural population). By applying a standard international poverty line of 1$ per day would result ina substantially greater number of absolute poor.
When poverty is measured in terms of nutrition, it often seems similar to that measured by theofficial income poverty line. A report based on National Bureau of Statistics (NBS) household datafound that a quarter of the rural population had less than a minimum level of calorie intake in 1990,while a more recent survey in six poor counties found over one third had a per capita income belowthe national poverty line.29
Despite of the variation in standard applied to determine poverty in China, all study reveals thatpoverty in rural China has continuously reduced over the past few decades with the exception of thepoor in the western provinces. In fact, trend of poverty in this region has been contradictory to theoverall predominant trend as poverty reduction efforts have not been successful in this region.
9.2 Major projects for Poverty Alleviation by the Government and/or Supported byInternational Organisations/Foreign Donor
A variety of polic ies and measures introduced by the government accounts for the dramatic povertyreduction in China. These include sweeping rural economic reforms, the introduction ofmacroeconomic policies encouraging productive agricultural and industrial activities and theencouragement of rural market economy functioning. These policies fostered rapid expansion ofagricultural production and family incomes.
Apart from role of government, international aid organisation has also played significant role insupporting the poverty alleviation programme. Of particular importance is the United NationaDevelopment Programme (UNDP) who supports the government in several programmes. Theprogrammes include:
Poverty Reduction Programme : In 1994, Chinese government launched the “8-7 Plan” to guidethe poverty reduction activities. This proramme is also supported by the United NationDevelopment Programme (UNDP). This programme aims at eliminating absolute poverty amongthe remaining 80 million people within 7 years through tax favourite policy, financial support andsocial economic development measures.
Responsibility System: Government officials at the county, township and village levels are highlyinvolved in this programme. It is required that they have to personally guarantee poverty alleviationloans to one, two and three poor "uncreditworthy" households respectively, while technicalpersonnel provide technical advice and support to up to three poor households in drawing up andimplementing household plans for the use of poverty alleviation funds. Further to the financial
29 Poverty in China, UN China http://www.unchina.org/about_china/html/poverty.shtml

Country Report : China
K - 19
commitment from being the guarantor, these officials also have every incentive to help the poor astheir career relies on outcome of poverty reduced.
In addition to UNDP, WFP also provides support for poverty alleviation programme in China. Itsfocus is to integrate agricultural development, targeting assistance to people living in the poorestareas. Activies can be broken into two major categories which are:
• large labour-intensive food-for-work public service projects• food-for-training human capacity-building activities
As China is a disaster-prone country with substantial potential emergency requirements (forexample in the wake of massive flooding in 1998), WFP’s development activities are alsoimplemented in areas subject to recurrent natural catastrophes, and projects contain disaster-preparedness components.
10. Conclusions
Meeting the domestic consumption requirement is prime policy target of the Chinese government. Thegovernment had implemented many measures to push the production of rice, e.g., the HouseholdResponsibility system. At the same time, consumption per capita is declining because of incomeincrease and urbanization. The self-sufficiency target has essentially been attained in late 1990s.Given the growing quantity of rice, the growing surplus has been flowing into the stock.
China also has a reserve system which is governed by the State Administration of Grain (SAG). SAGwill determine the quantity of rice reserve to be held in each province. The provincial administrationwill in turn set the target for the township, etc. It is likely that the largest rice stockholder is the farmer.The rice stock in China is as high as 100 million Metric tons - about 5 times the size of the world ricemarket. Managing this stock in the country and participation in the international market will be achallenge for the government.
Although there is rice sufficiency, there are pockets of areas where the supply of food grain isinsufficient. World Food Program (WFP) has a few projects in China but the number has beendeclining since China has become an exporter of rice.

Country Report : China
K - 20
References
1. China Development Brief (http://www.chinadevelopmentbrief.com/article.asp?art=300)2. Chinese Rice Market, published by the Australian Trade Commission
(http://www.austrade.gov.au/image/China_rice_market.pdf)3. Country Programme, World Food Programme (http://www.wfp.org/index.asp?section=5)4. Economic Research Service, U.S. Department of Agriculture
(http://www.ers.usda.gov/Briefing/China)5. FAO: Committee of world Food Security (27th session)
(http://www.fao.org/docrep/meeting/003/Y0147E/Y0147E00.htm#4a)6. The Future of China’s Grain Market, Economic Research Service, U.S. Department of
Agriculture (http://www.ers.usda.gov/publications/aib730/aib730ap.pdf)7. From equal poverty to dynamic inequality published in China Development Brief
(http://www.chinadevelopmentbrief.com)8. Hua, Cao. “Changes in Market Prices of Farm Produce” In Editorial Department of China
Agriculture Yearbook, eds. China Agriculture Yearbook 2000, pp. 85-88. Beijing: ChinaAgriculture Press, 2000.
9. Ministry of Foreign Trade and Economic Cooperation, PRC(http://www.moftec.gov.cn/moftec_en/tjsj/jcktj_en.html)
10. National Bureau of Statistics of China (http://www.stats.gov.cn/english/index.htm)11. Panitchpakdi, Supachai and Clifford Mark L, China and the WTO: Changing China, Changing
World Trade Singapore: John Wiley & Sons (Asia) Ple. Ltd., 200212. Poverty in China, UN China (http://www.unchina.org/about_china/html/poverty.shtml)13. Project 2002 Needs, World Food Programme
(http://www.wfp.org/country_brief/index.asp?continent=2)14. State Trading & Management of Grain Marketing in China, Economic Research Service, U.S.
Department of Agriculture, (www.ers.usda.gov/epubs/pdf/agout/june99/ao262e.pdf)15. Tradeoffs between quantity and quality of China Rice, Economic Research Service, U.S.
Department of Agriculture (http://www.ers.usda.gov/publications/wrs012/wrs012g.pdf)16. USDA Revision of China Grain Stock Estimates, Economic Research Service, U.S. Department
of Agriculture (http://www.ers.usda.gov/publications/wrs012/wrs012k.pdf)17. WASDE, U.S. Department of Agriculture (http://www.usda.gov/oce/waob/wasde/China-
rice.xls)18. Worldbank (http://www.worldbank.org)19. Yanxin, Huang. “Policies and Reform of the Grain Distribution System” In Editorial Board of
China Agriculture Yearbook, eds. China Agricultural Yearbook 1999 pp. 67-69. Beijing: ChinaAgriculture Press, 2000
20. Yupeng, He. “People’s Republic of China’s Paper on Domestic Rice Policy”, the First TechnicalMeeting on Rice Reserve under the Development Study on East Asia/ASEAN Rice ReserveSystem, 19 April 2002

Country Report : China
K - 21
Annexes
1. Country at a glance & Social Indicators (World Bank Data)
2. Total Sown Area, Total Output and Yield of Rice by Region 1998-1999
3. Rice Mill Machines By Region 1998 & 1999
4. Total Sown Area, Total Output and Yield of Wheat by Region 1998-1999
5. Agricultural and Non-Agricultural Population in China by Region 1998 & 1999
6. Estimation of Rice Surplus/Deficit by Region
7. Flowchart: China’s Grain Marketing System in 1998
8. List of WFP Projects in China

China at a glance 9/6/01
East Lower-POVERTY and SOCIAL Asia & middle-
China Pacific income2000Population, mid-year (millions) 1,262.5 1,853 2,046GNI per capita (Atlas method, US$) 840 1,060 1,140GNI (Atlas method, US$ billions) 1,061.2 1,964 2,327
Average annual growth, 1994-00
Population (%) 1.0 1.1 1.0Labor force (%) 1.2 1.4 1.3
Most recent estimate (latest year available, 1994-00)
Poverty (% of population below national poverty line) 5 .. ..Urban population (% of total population) 36 35 42Life expectancy at birth (years) 70 69 69Infant mortality (per 1,000 live births) 30 35 32Child malnutrition (% of children under 5) 9 13 11Access to an improved water source (% of population) 75 75 80Illiteracy (% of population age 15+) 16 14 15Gross primary enrollment (% of school-age population) 123 119 114
Male 123 121 116Female 123 121 114
KEY ECONOMIC RATIOS and LONG-TERM TRENDS
1980 1990 1999 2000
GDP (US$ billions) 216.2 363.0 997.5 1,076.9
Gross domestic investment/GDP 35.2 34.7 37.2 37.3Exports of goods and services/GDP 7.6 17.5 22.0 25.9Gross domestic savings/GDP 34.9 37.9 40.1 39.9Gross national savings/GDP 34.9 38.3 38.7 39.2
Current account balance/GDP -0.4 3.8 1.6 1.9Interest payments/GDP 0.2 0.7 0.6 0.7Total debt/GDP .. 15.2 15.5 13.9Total debt service/exports 8.0 9.9 9.0 7.4Present value of debt/GDP .. .. 13.5 ..Present value of debt/exports .. .. 58.7 ..
1980-90 1990-00 1999 2000 2000-04(average annual growth)GDP 10.1 10.3 7.1 7.9 7.4GDP per capita 8.5 9.2 6.1 7.2 6.7Exports of goods and services 11.0 16.5 13.9 32.0 11.1
STRUCTURE of the ECONOMY1980 1990 1999 2000
(% of GDP)Agriculture 30.1 27.0 17.6 15.9Industry 48.5 41.6 49.4 50.9
Manufacturing 40.5 32.9 33.6 34.5Services 21.4 31.3 32.9 33.2
Private consumption 50.5 49.9 47.4 47.0General government consumption 14.6 12.1 12.5 13.1Imports of goods and services 7.9 14.3 19.1 23.2
1980-90 1990-00 1999 2000(average annual growth)Agriculture 5.9 4.1 2.8 2.4Industry 11.1 13.7 8.1 9.6
Manufacturing 11.1 13.4 8.3 9.7Services 13.5 9.0 7.5 7.8
Private consumption 9.4 8.8 2.6 6.0General government consumption 9.8 9.4 8.4 12.0Gross domestic investment 10.8 11.6 3.2 7.9Imports of goods and services 9.1 16.1 22.3 24.8
Note: 2000 data are preliminary estimates.
* The diamonds show four key indicators in the country (in bold) compared with its income-group average. If data are missing, the diamond willbe incomplete.
0
5
10
15
20
95 96 97 98 99 00
GDI GDP
Growth of investment and GDP (%)
China
Lower-middle-income group
Development diamond*
Life expectancy
Access to improved water source
GNIpercapita
Grossprimary
enrollment
-10
0
10
20
30
40
95 96 97 98 99 00
Exports Imports
Growth of exports and imports (%)
China
Lower-middle-income group
Economic ratios*
Trade
Domesticsavings
Investment
Indebtedness
Kondo
K-22

China
PRICES and GOVERNMENT FINANCE1980 1990 1999 2000
Domestic prices(% change)Consumer prices 6.0 3.1 -1.4 0.4Implicit GDP deflator 5.6 5.5 -2.2 0.9
Government finance(% of GDP, includes current grants)Current revenue 25.7 19.7 15.0 15.3Current budget balance .. 3.0 1.3 0.6Overall surplus/deficit -1.5 -0.8 -4.0 -3.6
TRADE1980 1990 1999 2000
(US$ millions)Total exports (fob) 18,270 62,091 194,931 249,210
Food 2,985 6,609 10,458 12,282Fuel 4,280 5,237 4,659 7,851Manufactures 9,005 46,205 174,990 223,752
Total imports (cif) 20,017 53,345 165,699 225,097Food 2,927 3,335 3,619 4,758Fuel and energy 203 1,272 8,912 26,037Capital goods 5,119 16,845 69,469 91,934
Export price index (1995=100) 25 78 69 67Import price index (1995=100) 22 80 71 75Terms of trade (1995=100) 116 97 98 90
BALANCE of PAYMENTS1980 1990 1999 2000
(US$ millions)Exports of goods and services 20,167 67,971 218,496 279,561Imports of goods and services 20,859 55,537 189,799 250,688Resource balance -692 12,433 28,697 28,873
Net income -100 1,055 -17,973 -14,666Net current transfers .. 274 4,943 6,311
Current account balance -792 13,762 15,668 20,519
Financing items (net) .. -7,673 -7,163 -9,971Changes in net reserves .. -6,089 -8,505 -10,548
Memo:Reserves including gold (US$ millions) .. 16,963 161,404 171,753Conversion rate (DEC, local/US$) 2.1 5.1 8.2 8.3
EXTERNAL DEBT and RESOURCE FLOWS1980 1990 1999 2000
(US$ millions)Total debt outstanding and disbursed .. 55,301 154,223 149,800
IBRD .. 2,865 10,400 11,118IDA .. 3,016 8,907 8,771
Total debt service 1,652 7,057 20,655 21,728IBRD .. 416 1,142 1,291IDA .. 19 117 131
Composition of net resource flowsOfficial grants 7 143 201 147Official creditors .. 1,727 1,706 1,928Private creditors .. .. -1,854 1,985Foreign direct investment 57 3,487 41,015 42,096Portfolio equity 0 0 1,808 7,814
World Bank programCommitments .. 953 2,097 1,536Disbursements .. 1,098 1,756 1,907Principal repayments .. 216 558 644Net flows .. 882 1,198 1,263Interest payments .. 219 701 778Net transfers .. 663 497 485
The World Bank Group: http://www.worldbank.org/data/ 9/6/01
0
1
2
3
4
5
94 95 96 97 98 99 00
Current account balance to GDP (%)
0
100,000
200,000
300,000
94 95 96 97 98 99 00
Exports Imports
Export and import levels (US$ mill.)
-10
0
10
20
30
95 96 97 98 99 00
GDP deflator CPI
Inflation (%)
G: 17,174 A: 11,118
D: 2,556
B: 8,771
F: 81,671
E: 28,510
Composition of 2000 debt (US$ mill.)
A - IBRDB - IDAC - IMF
D - Other multilateralE - BilateralF - PrivateG - Short-term
Kondo
K-23

China Social IndicatorsLatest single year Same region/income group
East Lower-
Asia & middle-1970-75 1980-85 1993-99 Pacific income
POPULATION Total population, mid-year (millions) 916.4 1,051.0 1,253.6 1,836.6 2,093.0 Growth rate (% annual average for period) 2.3 1.4 1.0 1.2 1.1Urban population (% of population) 17.4 23.0 31.6 34.5 42.9Total fertility rate (births per woman) 3.4 2.4 1.9 2.1 2.1
POVERTY(% of population)National headcount index .. .. 4.6 .. .. Urban headcount index .. .. <2 .. .. Rural headcount index .. .. 4.6 .. ..
INCOMEGNI per capita (US$) 200 280 780 1,010 1,200Consumer price index (1995=100) .. .. 109 136 137Food price index (1995=100) .. .. .. .. ..
INCOME/CONSUMPTION DISTRIBUTIONGini index .. .. 40.3 .. ..Lowest quintile (% of income or consumption) .. .. 5.9 .. ..Highest quintile (% of income or consumption) .. .. 46.6 .. ..
SOCIAL INDICATORSPublic expenditure Health (% of GDP) .. .. 2.0 1.7 2.3 Education (% of GNI) 1.7 2.5 2.3 2.9 4.8 Social security and welfare (% of GDP) .. .. .. .. ..Net primary school enrollment rate(% of age group) Total .. .. 102 100 99 Male .. .. 101 100 100 Female .. .. 102 100 99Access to an improved water source(% of population) Total .. .. 75 75 80 Urban .. .. 94 93 94 Rural .. .. 66 66 69Immunization rate(% under 12 months) Measles .. 88 85 83 87 DPT .. 78 85 82 87Child malnutrition (% under 5 years) .. .. 9 12 9Life expectancy at birth(years) Total 65 68 70 69 69 Male 64 67 68 67 67 Female 66 70 72 71 72Mortality Infant (per 1,000 live births) 48 37 30 35 32 Under 5 (per 1,000 live births) 120 65 37 44 40 Adult (15-59) Male (per 1,000 population) 249 185 164 184 191 Female (per 1,000 population) 180 148 129 141 133 Maternal (per 100,000 live births) .. .. 55 .. ..Births attended by skilled health staff (%) .. .. 85 .. ..
Note: 0 or 0.0 means zero or less than half the unit shown. Net enrollment ratios exceeding 100 indicate discrepanciesbetween the estimates of school-age population and reported enrollment data. Latest year for access to improved watersource data is 2000.
2001 World Development Indicators CD-ROM, World Bank
Kondo
K-24
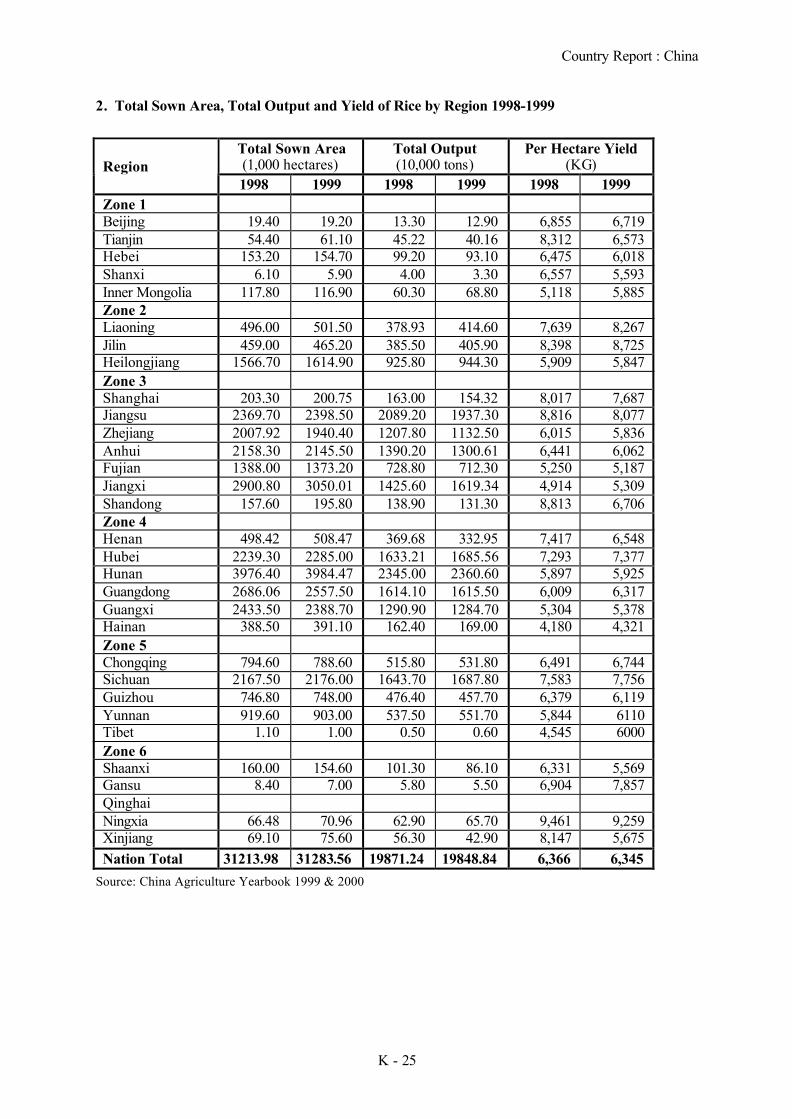
Country Report : China
K - 25
2. Total Sown Area, Total Output and Yield of Rice by Region 1998-1999
Total Sown Area(1,000 hectares)
Total Output(10,000 tons)
Per Hectare Yield(KG)Region
1998 1999 1998 1999 1998 1999Zone 1Beijing 19.40 19.20 13.30 12.90 6,855 6,719Tianjin 54.40 61.10 45.22 40.16 8,312 6,573Hebei 153.20 154.70 99.20 93.10 6,475 6,018Shanxi 6.10 5.90 4.00 3.30 6,557 5,593Inner Mongolia 117.80 116.90 60.30 68.80 5,118 5,885Zone 2Liaoning 496.00 501.50 378.93 414.60 7,639 8,267Jilin 459.00 465.20 385.50 405.90 8,398 8,725Heilongjiang 1566.70 1614.90 925.80 944.30 5,909 5,847Zone 3Shanghai 203.30 200.75 163.00 154.32 8,017 7,687Jiangsu 2369.70 2398.50 2089.20 1937.30 8,816 8,077Zhejiang 2007.92 1940.40 1207.80 1132.50 6,015 5,836Anhui 2158.30 2145.50 1390.20 1300.61 6,441 6,062Fujian 1388.00 1373.20 728.80 712.30 5,250 5,187Jiangxi 2900.80 3050.01 1425.60 1619.34 4,914 5,309Shandong 157.60 195.80 138.90 131.30 8,813 6,706Zone 4Henan 498.42 508.47 369.68 332.95 7,417 6,548Hubei 2239.30 2285.00 1633.21 1685.56 7,293 7,377Hunan 3976.40 3984.47 2345.00 2360.60 5,897 5,925Guangdong 2686.06 2557.50 1614.10 1615.50 6,009 6,317Guangxi 2433.50 2388.70 1290.90 1284.70 5,304 5,378Hainan 388.50 391.10 162.40 169.00 4,180 4,321Zone 5Chongqing 794.60 788.60 515.80 531.80 6,491 6,744Sichuan 2167.50 2176.00 1643.70 1687.80 7,583 7,756Guizhou 746.80 748.00 476.40 457.70 6,379 6,119Yunnan 919.60 903.00 537.50 551.70 5,844 6110Tibet 1.10 1.00 0.50 0.60 4,545 6000Zone 6Shaanxi 160.00 154.60 101.30 86.10 6,331 5,569Gansu 8.40 7.00 5.80 5.50 6,904 7,857QinghaiNingxia 66.48 70.96 62.90 65.70 9,461 9,259Xinjiang 69.10 75.60 56.30 42.90 8,147 5,675Nation Total 31213.98 31283.56 19871.24 19848.84 6,366 6,345
Source: China Agriculture Yearbook 1999 & 2000

Country Report : China
K - 26
3. Rice Mill Machines By Region 1998 & 1999
Region Rice Mills1998 1999
Zone 1 0.41 0.40Beijing 0.41 0.40Tianjin 0.34 0.33Hebei 7.76 7.91Shanxi 4.09 4.06Inner Mongolia 3.17 2.99Zone 2Liaoning 5.54 5.73Jilin 5.36 5.49Heilongjiang 3.31 3.24Zone 3Shanghai 0.45 0.45Jiangsu 7.46 7.60Zhejiang 7.43 7.63Anhui 15.40 8.65Fujian 6.24 6.28Jiangxi 12.05 12.10Shandong 5.12 5.49Zone 4Henan 6.87 7.07Hubei 12.76 13.18Hunan 35.49 40.21Guangdong 10.08 10.64Guangxi 22.64 24.55Hainan 1.32 1.36Zone 5Chongqing 11.89 14.10Sichuan 24.25 26.28Guizhou 15.05 16.64Yunnan 14.23 14.84TibetZone 6Shaanxi 5.09 4.82Gansu 1.06 1.09QinghaiNingxia 0.59 0.59Xinjiang 0.49 0.45
Nation Total 245.94 254.18Source: China Agriculture Yearbook 1999 & 2000

Country Report : China
K - 27
4. Total Sown Area, Total Output and Yield of Wheat by Region 1998-1999
Region Total Sown Area(1,000 hectares)
Total Output(10,000 tons)
Per Hectare Yield(KG)
1998 1999 1998 1999 1998 1999Zone 1Beijing 171.20 168.00 96.70 95.50 5,648 5,685Tianjin 153.42 143.21 76.06 71.56 4,957 4,997Hebei 2764.00 2729.90 1253.60 1280.50 4,535 4,691Shanxi 963.40 919.20 320.90 266.50 3,330 2,899Inner Mongolia 1092.50 937.90 282.70 273.10 2,587 2,912Zone 2Liaoning 150.18 152.90 61.38 59.20 4,087 3,872Jilin 74.50 67.50 10.60 16.10 1,422 2,385Heilongjiang 961.40 953.10 285.20 284.20 2,966 2,982Zone 3Shanghai 103.90 97.24 31.10 38.44 2,993 3,953Jiangsu 2315.00 2251.70 759.70 1070.80 3,281 4,756Zhejiang 255.14 257.90 61.17 72.30 2,397 2,803Anhui 2095.80 2057.08 599.10 852.50 2,858 4,144Fujian 55.00 50.30 15.40 14.40 2,800 2,863Jiangxi 65.80 61.50 9.20 9.62 1,398 1,564Shandong 3982.00 4006.80 2024.50 2117.60 5,084 5,285Zone 4Henan 4963.98 4884.59 2073.53 2291.46 4,177 4,691Hubei 1211.20 1074.43 409.33 304.67 3,379 2,836Hunan 144.60 129.73 25.70 22.10 1,777 1,704Guangdong 17.82 15.22 5.10 4.36 2,861 2,865Guangxi 25.50 19.80 3.50 2.60 1,372 1,313HainanZone 5Chongqing 548.30 531.60 130.6 105.80 2,381 1,990Sichuan 1864.70 1818.30 601.10 543.10 3,223 2,987Guizhou 604.50 596.30 108.90 107.60 1,801 1,804Yunnan 706.80 724.90 151.30 158.40 2,140 2,185Tibet 55.00 54.10 29.10 31.20 5,290 5,767Zone 6Shaanxi 1610.50 1589.50 504.20 405.50 3,130 2,551Gansu 1323.50 1222.70 412.60 320.30 3,117 2,620Qinghai 211.90 182.89 79.90 59.37 3,770 3,246Ningxia 316.80 267.47 93.80 78.21 2,960 2,924Xinjiang 966.80 888.50 456.60 430.90 4,722 4,850
Nation Total 29775.14 28854.26 10972.57 11387.89 3,685 3,947Source: China Agriculture Yearbook 1999 & 2000

Country Report : China
K - 28
5. Agricultural and Non-Agricultural Population in China by Region 1998 & 1999
Region Total Population Non-AgriculturalPopulation
Agricultural Population
1998 1999 1998 1999 1998 1999Zone 1Beijing 10,977,587 11,061,983 7,360,686 7,494,576 3,616,901 3,567,407Tianjin 9,107,406 9,161,665 5,239,719 5,312,900 3,867,687 3,848,765Hebei 65,553,063 66,021,579 12,221,950 12,532,121 53,331,113 53,489,458Shanxi 31,133,340 31,450,808 8,074,136 8,312,434 23,059,204 23,138,374InnerMongolia
23,101,949 23,295,364 7,810,069 7,972,614 15,291,880 15,322,750
Zone 2Liaoning 40,904,094 41,032,344 18,632,040 18,768,825 22,272,054 22,263,519Jilin 26,032,348 26,161,000 11,228,695 11,319,131 14,803,653 14,841,869Heilongjiang 36,420,085 * 36,608,415 16,480,036 * 16,662,615 19,940,049 19,945,810Zone 3Shanghai 13,065,845 13,131,204 9,536,519 9,696,282 3,529,326 3,434,922Jiangsu 69,830,933 70,090,860 18,768,409 20,294,541 51,062,524 49,796,319Zhejiang 44,468,558 44,674,607 9,070,789 9,476,674 35,397,769 35,197,933Anhui 61,521,697 62,055,155 11,522,680 12,043,346 49,999,017 50,011,809Fujian 32,608,193 32,835,978 6,471,431 6,670,027 26,136,762 26,165,951Jiangxi 40,706,468 41,170,252 8,877,268 9,065,485 31,829,200 32,104,767Shandong 88,715,112 89,216,648 22,960,366 23,218,387 65,754,746 65,998,261Zone 4Henan 93,736,583 94,463,428 16,436,909 16,803,803 77,299,674 77,659,625Hubei 58,905,837 59,424,899 16,209,951 16,457,895 42,695,886 42,967,004Hunan 64,821,778 65,206,272 12,444,060 12,793,107 52,337,718 52,413,165Guangdong 71,156,450 72,988,849 22,190,744 22,764,240 48,965,706 50,224,609Guangxi 46,221,938 46,576,479 8,063,503 8,168,453 38,158,435 38,408,026Hainan 7,333,090 7,432,124 1,861,171 1,891,184 5,471,919 5,540,940Zone 5Chongqing 30,596,862 30,723,399 6,140,281 6,351,598 24,456,581 24,371,801Sichuan 83,156,840 83,585,559 14,602,992 15,076,692 68,553,848 68,508,867Guizhou 35,365,371 35,820,459 5,040,381 5,188,168 30,324,990 30,632,291Yunnan 39,833,393 40,183,888 5,822,578 6,111,105 34,010,815 34,072,783Tibet 2,453,869 2,477,195 339,935 341,969 2,113,934 2,135,226Zone 6Shaanxi 35,010,749 35,191,539 7,635,304 7,804,107 27,375,445 27,387,422Gansu 24,836,369 25,074,457 4,634,741 4,720,493 20,201,628 20,353,964Qinghai 4,703,437 4,732,420 1,333,700 1,341,702 3,369,737 3,390,718Ningxia 5,365,666 5,432,891 1,522,159 1,553,961 3,843,507 3,878,930Xinjiang 17,335,965 17,633,656 6,116,834 6,213,222 11,219,131 11,420,434
Nation Total 1,214,980,875 1,224,915,376 304,650,036 312,421,657 910,290,839 912,493,719
Source: China Agriculture Yearbook 1999 & 2000
* Number in red has been corrected as there is some typing error in the actual figure provided in China
Agriculture Yearbook 2000.

Country Report : China
K - 29
6. Estimation of Rice Surplus/Deficit by Region
Region Total Output Total Population Estimate Surplus/Deficitin 1999 in 1999 Consumption ten thousand tons
ten thousand tons ten thousand tonsZone 1Beijing 12.90 11,061,983 112.832 -99.93Tianjin 40.16 9,161,665 93.449 -53.29Hebei 93.10 66,021,579 673.420 -580.32Shanxi 3.30 31,450,808 320.798 -317.50Inner Mongolia 68.80 23,295,364 237.613 -168.81Zone 2Liaoning 414.60 41,032,344 418.530 -3.93Jilin 405.90 26,161,000 266.842 139.06Heilongjiang 944.30 36,608,415 373.406 570.89Zone 3Shanghai 154.32 13,131,204 133.938 20.38Jiangsu 1937.30 70,090,860 714.927 1222.37Zhejiang 1132.50 44,674,607 455.681 676.82Anhui 1300.61 62,055,155 632.963 667.65Fujian 712.30 32,835,978 334.927 377.37Jiangxi 1619.34 41,170,252 419.937 1199.40Shandong 131.30 89,216,648 910.010 -778.71Zone 4Henan 332.95 94,463,428 963.527 -630.58Hubei 1685.56 59,424,899 606.134 1079.43Hunan 2360.60 65,206,272 665.104 1695.50Guangdong 1615.50 72,988,849 744.486 871.01Guangxi 1284.70 46,576,479 475.080 809.62Hainan 169.00 7,432,124 75.808 93.19Zone 5Chongqing 531.80 30,723,399 313.379 218.42Sichuan 1687.80 83,585,559 852.573 835.23Guizhou 457.70 35,820,459 365.369 92.33Yunnan 551.70 40,183,888 409.876 141.82Tibet 0.60 2,477,195 25.267 -24.67Zone 6Shaanxi 86.10 35,191,539 358.954 -272.85Gansu 5.50 25,074,457 255.759 -250.26Qinghai 4,732,420 48.271 -48.27Ningxia 65.70 5,432,891 55.415 10.28Xinjiang 42.90 17,633,656 179.863 -136.96
Nation Total 19,848.84 1,224,915,376.00 12,494.14 7,354.70Remark: Whereas the total output and population is based on the 1999 China Agriculture yearbook, the
consumption per capita (102 KGs) is based on USDA estimation of year 2000.

Country Report : China
K - 30
7. Flowchart: China’s Grain Marketing System in 1998*
* State Trading & Management of Grain Marketing in China, Economic Research Service, U.S. Department of Agriculture
http://www.ers.usda.gov/publications/agoutlook/jun1999/ao262e.pdf
Wholesalers /Retailers
Industrialusers
RuralConsumer
s Openmarket
Household/Producer
Use onFarm
Other users(Including
Transfers OutsideProvince)
Mill Users
County grain depot/ Grain Bureau
Township grain station/ Grain Bureau
Openmarket
Provincial GrainBureau
State Administration for GrainReserves (SAGR)
Domestic Production Imports
Imports Exports
Quantities purchased underquota at quota price

Country Report : China
K - 31
8. List of WFP Projects in China
10055.0 Activity No. 1 – "Integrated Rural Development (IRD)"Duration: Five years, through December 2005Total Commitment: 346,512 tonnesPlanned Beneficiaries: 4,724,400 persons
10055.0 Activity No. 2 – "Primary School Feeding"Duration: Three years, through December 2004Total Commitment: 200,000 tonnesPlanned Beneficiaries: 500,000 persons
5652.00 – "Northeast Sichuan integrated agricultural development project"Duration: Five years, due to end August 2002Total Commitment: 73,411 tonnesPlanned Beneficiaries: 784,000 persons (approx)
9997.00 – "West Guangxi Poverty Reduction Project"Duration: Five years, through December 2005Total Commitment: 15,500 tonnesPlanned Beneficiaries: 500,000 persons (approx)
6147.00 – "Qinling Mountain area poverty alleviation project in Shaanxi/ Hubei provinces"Duration: Five years, through 2005Total Commitment: 80,000 tonnesPlanned Beneficiaries: 375,000 direct
6023.00 – "Wuling Mountain minorities integrated agricultural and social development project"Duration: Three years through February 2002Total Commitment: 15,500 tonnesPlanned Beneficiaries: 400,000 persons
5796.00 – "Integrated agricultural development in the South-western Mountains, Anhuiprovince"Duration: Five years through February 2004Total Commitment: 13,927 tonnesPlanned Beneficiaries: 316,980 persons
5717.00 – "Integrated agricultural development in Haidong prefecture, Qinghai province"Duration: Five years through July 2002Total Commitment: 49,873 tonnesPlanned Beneficiaries: 180,000 persons
5181.00 – "Integrated agricultural development in Wuling Mountain area, Guizhou province"Duration: Five years, due to end April 2001Total Commitment: 84,639 tonnesPlanned Beneficiaries: 51,600 persons

COUNTRY REPORT
Japan

Country Report : Japan
L - 1
1. Production
1.1 Rice Production Trends
Rice planted area has been continuously decreasing since 1960s. In 2000, it became 1.77 millionha that is 54% of the planted area in 1960.
Rice Production TrendsYear Unit 1960 1970 1980 1990 1995 1998 1999 2000 2001Planted area Million ha 3.31 2.92 2.38 2.07 2.12 1.80 1.79 1.77 1.71
1/ (%, 1996 = 100) (100) (88) (72) (63) (64) (54) (54) (54) (52)
Production Million ton 12.86 12.69 9.75 10.50 10.75 8.96 9.18 9.49 9.06
1/ (%, 1996 = 100) (100) (99) (76) (82) (84) (70) (71) (74) (70)
Yield Ton/ha 4.01 4.42 4.12 5.09 5.09 4.99 5.15 5.37 5.32
2/ (%, 1996 = 100) (100) (110) (103) (127) (127) (124) (128) (134) (133)
Source : MAFF 1/ includes upland rice, 2/ not includes upland rice
1.2 Production Control (Reduction of the cultivation area)
Efforts have been made to adjust rice production to achieve a better balance between supply anddemand since 1970s. The areas of rice filed which were under the various government programs toadjust rice production during 1971 – 2001 are estimated about 20.2 million ha in total. Targetareas and achieved areas of the production control programs in recent years are as follows.
Rice Field under the Production Control Programs (Unit : 1000 ha)FY 1996 1997 1998 1999 2000 2001Target area 787 787 963 963 963 1,010
Achieved area 787 787 958 963 973 1,010
Source : Food Agency, MAFF
1.3 Characteristics of Rice Production in Japan
(1) Constant decline of rice farmers
Since 1960, the number of farm households in Japan has been declining and it became about half ofthe 1960 in 1999. Number of rice farm household also has declined to 44% of its number in 1960.Out of total number of rice farm household, 64% of them marketed their produce in 1999.

Country Report : Japan
L - 2
(Unit : 1000 households)
Year Total Number ofFarm Household
Rice Farm Household Rice Farm Household whichmarketed rice
1960 6,057 100% 5,320 100% 3,395 100%1970 5,402 89% 4,569 86% 3,206 94%1980 4,661 77% 3,722 70% 2,604 77%1990 3,835 63% 3,064 58% 2,252 66%1999 3,239 53% 2,352 44% 1,539 45%
Source : MAFF
(2) Small production scale
Scale of rice farming is small: about 60% are less than 0.5 ha. In case the “less than 1.0 ha”, itaccount for 83% of the whole.
(Unit : 1000 households)
Scale of Rice Farming Rice Farm Household Rice Farm Householdwhich marketed rice
Total 2,352 100% 1,518 100%5.0 ha over 24 1.0% 23 1.5%3.0 - 5.0 38 1.6% 36 2.4%2.0 - 3.0 68 2.9% 65 4.3%1.5 - 2.0 87 3.7% 80 5.3%1.0 - 1.5 193 8.2% 175 11.5%0.5 - 1.0 550 23.4% 466 30.7%less 0.5 ha 1,392 59.2% 674 44.4%
Source : MAFF (1999)
(3) Large number of part-time farmers
According the 1999’s statistic data, 55 % of rice farming households were part-time farminghousehold, which was defined as “there is no family member under 65 years old who is engaged infarming work for more than 65 days in a year”. The sum of semi part-time and part-time farminghousehold , which account for 82 % of the whole rice farm households, depended their main sourceof income on non-agriculture income.
Rice Farm Household which marketed rice
Scale of Rice Farming Full-timefarming household
Semi part-time farminghousehold
Part-timefarming household
Total 18.3% 26.1% 55.6%5.0 ha over 90.0% 5.6% 4.4%3.0 - 5.0 65.9% 23.4% 10.7%2.0 - 3.0 42.0% 36.1% 21.8%1.5 - 2.0 29.5% 37.3% 33.2%1.0 - 1.5 22.4% 34.5% 43.0%0.5 - 1.0 14.8% 28.4% 56.8%less 0.5 ha 13.6% 21.4% 65.0%Source : MAFF (1999)- Full-time farming household: Agriculture income is the main source of income, and have a family
member under 65 years old who is engaged in farming work for more than 65 days in a year.

Country Report : Japan
L - 3
- Semi part-time farming household: Main income source is non-agricultural income, and have a familymember under 65 years old who is engaged in farming work for more than 65 days in a year.
- Part-time farming household: Main income source is non-agricultural income, and have no familymember under 65 years old who is engaged in farming work for more than 65 days in a year.
Mechanization minimized the input of family labors in rice production and this made part-timefarming possible. According the statistics on rice production costs in 1999, input of family laborswere computed as 49 hours per 0.1ha in case the farming scale of 0.5 ha and 39 hours per 0.1ha incase 0.5-1.0 ha farming scale.
(4) High production costs
Production costs (contented in payment interest and land rent) per 1 ton of brown rice is Yen274,017 in 1998. It is equivalent to USD 2,108 in the exchange rate of 130 Yen/USD.
Production Costs for Rice (1998)per 10 a (Yen) per ton (Yen) per ton (USD) 1/
Material costs 24,704 48,417 372Land improvement and water utilization 7,913 15,500 119Rent and charge 12,321 24,150 186Tax, levy and public obligations 2,579 5,050 39Building cost 4,558 8,917 69Agri. machinery/tool 28,754 56,350 433Production management 235 467 4Labor cost 56,986 111,667 859
(Family members Labor cost) (55,135) (108,050) (831)Total Cost 138,050 270,517 2,081
(Purchased) (56,502) (110,717) (852)(Self-supplied) (55,914) (109,567) (843)
value of by-products 3,373 6,617 51Payment interest 839 1,650 13Land rent 4,316 8,467 65Production Cost 139,832 274,017 2,108
Source : MAFF 1/ 1 USD = 130 Yen
(5) Variety of rice
As indicated in the data of production share, production of some specific varieties has beenincreasing. Especially the increase of no.1 variety is significant. Since 1980 until now,Koshihikari has been in a position of most dominant variety, it occupied 35.5% of total productionin 2000. Next major varieties in 2000, in order, were Hitomebore (9.7%), Hinohikari (9.0%),Akitakomachi (8.5%), Kirara397 (4.8%).
Share of the major varieties in planted area (Unit : %)1970 1980 1990 1995 1998 2000
Share of No.1 variety 8.3 14.5 28.1 28.8 33.6 35.5Share of Top 5 varieties 31.2 38.2 53.8 52.3 64.0 67.5Share of Top 10 varieties 45.4 54.5 65.0 68.7 76.4 79.0
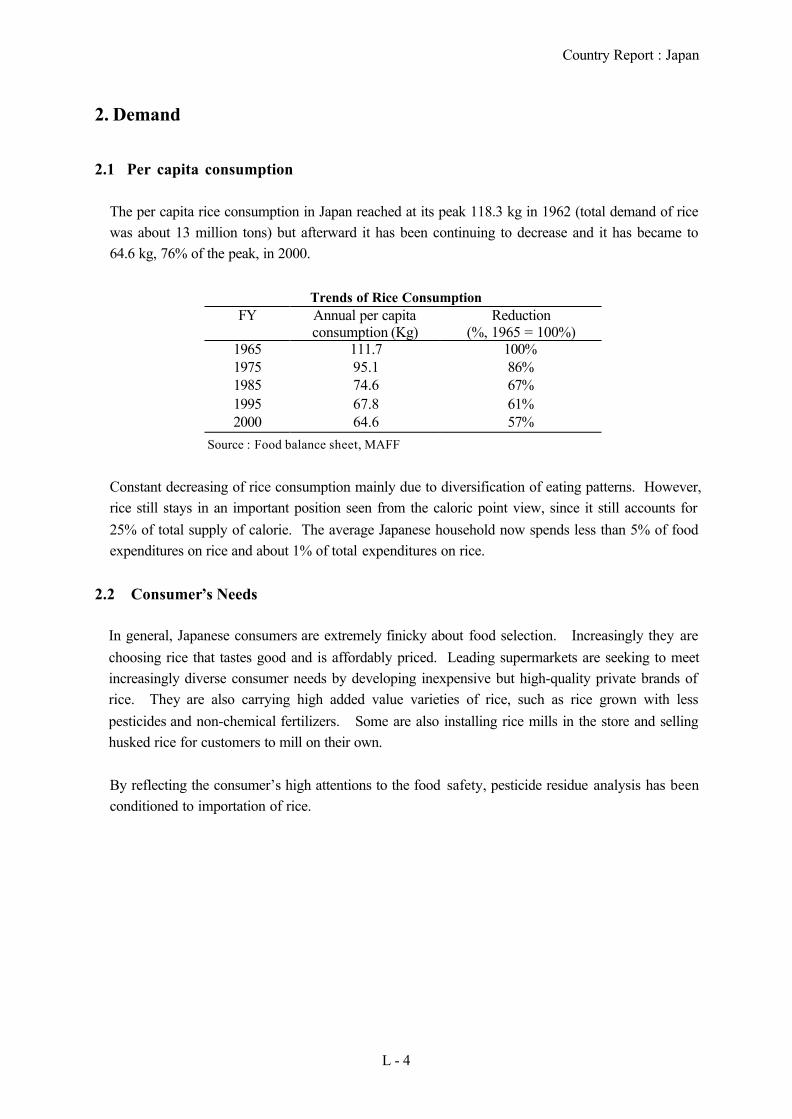
Country Report : Japan
L - 4
2. Demand
2.1 Per capita consumption
The per capita rice consumption in Japan reached at its peak 118.3 kg in 1962 (total demand of ricewas about 13 million tons) but afterward it has been continuing to decrease and it has became to64.6 kg, 76% of the peak, in 2000.
Trends of Rice ConsumptionFY Annual per capita
consumption (Kg)Reduction
(%, 1965 = 100%)1965 111.7 100%1975 95.1 86%1985 74.6 67%1995 67.8 61%2000 64.6 57%
Source : Food balance sheet, MAFF
Constant decreasing of rice consumption mainly due to diversification of eating patterns. However,rice still stays in an important position seen from the caloric point view, since it still accounts for25% of total supply of calorie. The average Japanese household now spends less than 5% of foodexpenditures on rice and about 1% of total expenditures on rice.
2.2 Consumer’s Needs
In general, Japanese consumers are extremely finicky about food selection. Increasingly they arechoosing rice that tastes good and is affordably priced. Leading supermarkets are seeking to meetincreasingly diverse consumer needs by developing inexpensive but high-quality private brands ofrice. They are also carrying high added value varieties of rice, such as rice grown with lesspesticides and non-chemical fertilizers. Some are also installing rice mills in the store and sellinghusked rice for customers to mill on their own.
By reflecting the consumer’s high attentions to the food safety, pesticide residue analysis has beenconditioned to importation of rice.

Country Report : Japan
L - 5
3. Supply and Demand Balance
The supply and demand situation of rice since 1960 until 2000 is illustrated in the chart next page.Carry-over stock shows periodically ups and downs with 8 – 9 years cycle.
Rice Balance (Brown rice, Unit: 1,000 tons)Supply Demand
TradeFiscalYear Production
Import Export
Stockchanges
1/Total
Feed, Seed,Processing
& LossFood Total
Per capita(kg)
1965 12,409 1,052 0 468 12,993 956 12,037 12,993 111.7
1975 13,165 27 0 1,228 11,964 1,086 10,878 11,964 88.0
1985 11,662 30 581 810 10,849 887 9,962 10,849 74.61996 10,344 634 6 783 10,189 844 9,345 10,189 67.3
1997 10,025 634 201 351 10,107 816 9,291 10,107 66.7
1998 8,960 749 876 -1,075 9,908 812 9,096 9,908 65.21999 9,175 806 141 -65 9,905 796 9,109 9,905 65.1
2000 9,490 879 462 -81 9,988 934 9,054 9,988 64.6
Source: Food Balance Sheet, MAFF
1/ Difference between beginning stock volume and ending stock volume.

Country Report : Japan
L - 6

Country Report : Japan
L - 7
4. Policies on Rice
4.1 The Staple Food Law (1995-)
“The Law for Stabilization of Demand-Supply and Price of Staple Food” was legislated inDecember 1994 and the law came into force and effect as from November 1995. It aims to ensurestable demand-supply of rice under stable pricing structure, reinforcing the basic constitution of riceproduction by inspiring the independence of rice producers and improving the efficiency of ricedistribution by promoting deregulation and introducing market principles. The Law comprises ofthe following basic framework:
[1] To draw up a basic plan for the forecast of supply-demand of rice, adjustment of riceproduction, management of rice stockpiles and imports so as to maintain a good balancebetween demand and supply under stable pricing program.
[2] To control and manage stockpile of rice and/or import rice under the minimum marketaccess commitment in the course of management of government marketed rice by layingemphasis on the distribution of voluntarily marketed rice through the private distributionsystem.
[3] To authorize the Voluntarily Marketed Rice Price Formation Center to frame and decide theprice of the voluntarily marketed rice so that the price would be established in such mannerthat it would well reflect the actual demand-supply situation.
[4] To ease restrictions on the distribution of the orderly-marketed rice (voluntarily marketedrice and government marketed rice) as much as possible so as to ensures stable distributionof the rice to the public.
Under the Staple Food Low, the government’s role is categorized as; preparation of accurateforecast of supply-demand, control of rice stockpiles, management of minimum market access riceimports, implementation of rice production adjustments, and making a basic plan every year forstabilization of supply-demand and price of rice. The basic plan shall include following points:
a. Basic linesb. Forecast of the supply-demandc. Rice production adjustments, including the target for rice production, etc.d. Management of stockpile , including the annual target volume, etc.e. Target volume of rice to be shipped by producers as the orderly-marketed rice and target
volume of government rice purchasing for the management of stockpilef. Target volume of rice to be distributed as the orderly-marketed rice, including region-wise
and term-wise breakdown, etc.g. Volume of rice to be imported, including volume by type, etc.h. Other matters.

Country Report : Japan
L - 8
4.2 New Rice Policy (1997-)
In consideration of the excessive accumulation of rice stocks and the drastic decline in the price ofvoluntarily marketed rice, the Government decided “New Rice Policies” in November 1997.
The New Rice Policies consist of three major elements: 1) New Production Adjustment PromotionPolicy, 2) Rice farming income stabilization program and 3) Operational reform for an orderlymarketing system. The following effects were expected:
- Restoration of the supply-demand balance of rice- Restoration of the voluntarily marketed rice price- Stabilization of rice producers’ income- Realization of desirable paddy-field farming, combined moderately with a diversion program
New Production Adjustment Promotion PolicyReduce the domestically produced rice stock to 2.0 million tons, the upper limit for the stock level,by the end of Oct. 2000. Target area of production adjustment in FY 1998 was set at 963,000 ha.
Rice farming income stabilization program80% of the fall in price of the voluntarily marketed rice is compensated for through used of the fund,which is raised by producers’ contributions and the government assistance. Payment is limitedonly to the voluntarily marketed rice produced by those who fulfill their target area for productionadjustment by 100% or more.
Operational reform for an orderly marketing systemIntroduce the “Operational rule for reserve stock” beginning with the 1998 crop. The operationalrule is: a) the government purchase volume is set at less than the government selling volume in theBasic Plan and b) when the volume of rice actually sold is less than the planned volume, the actualgovernment purchase volume will be set by subtracting the difference from the planned volume.
4.3 Future Targets on Rice
The Basic Law on Food, Agriculture and Rural Areas was promulgated in July 1999 and the cabinetmeeting in March 2000 approved its basic plan. In this basic plan, following targets for Year 2010are shown regarding the rice.
Targets in year 2010 (Unit : 1,000 tons)Cultivation area
(1000 ha)Production(1000 ton)
Self-sufficiency rate(%)
Demand(1000 ton)
Rice 1,860 9,690 96% 10,080
Rice (for food) -- 9,060 100% 9,060
Source : MAFF
Country Report : Japan
L - 9
5. Marketing System
5.1 Mechanism
When the Staple Food Law went into effect in 1995, the strict distribution channel regulations underthe Food Control Law that formerly obligated producers to sell their rice to the government weredramatically eased. Under the Staple Food Law, direct government control of rice distribution islimited to the management of the government’s rice stock and to the importation of minimumaccess rice. In the present system, any forwarders or sellers are permitted to enter the ricemarketing and registered if requirements are met. This has dramatically expanded the number ofrice retailers.
To ensure stable distribution of the rice, the government places voluntarily marketed rice andgovernment marketed rice as the orderly-marketed rice and aims voluntarily marketed rice plays thecentral role in the marketing system. With regard to the rice other than orderly-marketed rice,producers can market them freely on condition that marketed volumes are reported the local foodagency office, to make it possible to track the overall volume of rice distributed.
Voluntarily marketed riceTarget volume is framed every year in a basic plan. Based on it, the requests for shipment as theorderly-marketed rice are made to registered shippers such as agriculture cooperatives, then to riceproducers. And voluntarily marketed rice is marketed based on the orderly distribution planswhich drawn up by the registered shippers and approved by the minister.
The price of the voluntarily marketed rice is determined by auctions, so that it fairly reflects theactual demand-supply situation of rice. For this purpose, the government has authorized theVoluntarily Marketed Rice Price Formation Center to frame and decide the price of the voluntarilymarketed rice.
Government marketed riceUnder the Staple Food Law, the government purchases certain portion of rice from rice producerswho participate in the production adjustment programs. The government’s purchase is limited tothe minimum volume that is necessary for maintaining the rice stock for the food security. Inprinciple, the government procured rice is sold after one-year storage. The governmentprocurement prices and selling prices are determined every year by taking into account the supply-demand trend, market prices (especially the price of voluntarily marketed rice) and other economicfactors.
MMA Rice also forms a part of the government marketed rice. The government sales prices forMMA import rice are determined on the basis of import prices, management costs and rice prices inthe market, and they shall not to be above the sum of the respective government purchase prices and

Country Report : Japan
L - 10
mark-ups bound in the WTO Agreement. The government sales prices for MMA import rice arevaries depending on the type and grade of the rice.
2,606shippers
Voluntarily-marketed rice
Government-controlled rice
Free-marketed rice
ordely-marketed rice Government marketed rice Voluntarily marketed rice
Overseas markets Domestic producers
Rice other than Ordely-marketed rice
Government(Stockpiling)
Registered wholesalers & Retailers< wholesalers: 389, retalers:94,615>
Consumers
Sales(report tolocal food
agencyoffice)
MMA RiceImport
other thanMMA Rice
Voluntarily Marketed RicePrice Formation Center
MMA Riceimports
Generalimports Registered shippers
(Agricultural Cooperatives, Prefectural economicfederations, National federation of Agricultural
Cooperative Associations, etc.)< Agri. coopes: 1,182, Other: 1,424>
Note : number of entities : as of June 30, 2000 for shipper, as of Dec.31 2000 for wholesaler & retailers.
Rice distribution channels
Orderly-marketed rice is estimated to share the 50% of the total production in RY2000/01, 45% ofvoluntarily marketed rice and 5% of government marketed rice. Rice consumption by farmhouseholds is estimated at 17%, and distributed volume of rice by out of the orderly marketedsystem is estimated at 33% of production. Breakdown of rice distribution volume in recent yearsare as follows.
Breakdown of Rice Distribution Volume (Unit : Brown rice, 10,000 tons)Marketed Volume
Orderly marketed riceProductionYear (CY) Production Voluntarily
marketed rice1/
Governmentmarketed rice
1/
Other thanorderly
marketed rice
Consumptionby farmers
1995 1,052 394 55 258 1861996 1,032 343 68 277 1801997 1,002 417 42 280 1701998 896 388 50 268 1631999 918 359 20 286 1602000 949 383 45
Source : Various data from Food Agency, MAFF
1/ Distributed volume

Country Report : Japan
L - 11
5.2 Prices
(1) Voluntarily marketed rice prices
The voluntarily marketed rice prices, which formed by auctions, also have been declining since1995/1996.
Index prices of Voluntarily marketed rice (Unit : Brown rice, Yen/ton, %)Variety Koshihikari Akitakomachi
: Production place : Niigata : Akita1995 416,800 100% 348,650 100%1996 427,650 103% 336,917 97%1997 377,750 91% 306,433 88%1998 411,017 99% 318,067 91%1999 366,483 88% 292,233 84%2000 352,650 85% 279,600 80%
Source: Food Agency, MAFF Year: produced year
(2) Government prices
The government purchase prices and sales prices also have been gradually declining by reflectingthe market prices.
Government Purchase Price and Sales Price (Unit : Brown rice, Yen/ton)FY1996 FY1997 FY1998 FY1999 FY2000 FY2001
Purchasing price 273,200 270,283 263,417 258,800 251,733 245,133Selling price ofReserved rice 301,683 297,183 294,100 289,383 286,083
Selling price ofMMA import rice 1/
225,567 210,867 206,483 203,117 200,817 198,383
Source : Food Agency, MAFF 1/ USA California medium grain
(3) Retail prices
According the Food Agency’s retail price survey data of dominant rice varieties, prices of rice havebeen in stable but been gradually declining. The prices in June 2000 were about 85% of 1996’s.
3,000
3,500
4,000
4,500
5,000
5,500
6,000
6,500
1996
1998
Jan-
00
Mar
-00
May
-00
Jul-0
0
Sep-
00
Nov
-00
Jan-
01
Mar
-01
May
-01
Yen
/ 10
kg m
illed
rice Kirara 395
Hokkaido
HitomeboreMiyagi
AkitakomachiAkita
KoshihikariNiigata

Country Report : Japan
L - 12
6. Rice Stock / Reserve
6.1 Government Rice Stock / Reserve
Volume of Rice Stock / ReserveThe government designated the appropriate level of rice stock to be 1.5 million tons with a certainallowance (±500,000 tons), which was deemed to be enough to maintain the smooth provision offood to the market even if poor harvest continues for two years.
In November 2002, the rice stock level has been amended downward to 1.0 million tons from theviewpoint of enhancing the sound management of rice stockpiles. 1.0 million tons of rice iscalculated as nearly equivalent to the 1.5 months of whole nation’s demand.
Government ProcurementUnder the Staple Food Law, the Government shall purchase certain portion of rice from riceproducers, who participate in the production adjustment programs, to ensure the smoothmanagement of rice stockpiles.
In order to achieve a desirable stock level, the government introduced the “Operational Rule forReserve Stock” from 1998 and adjusts its purchase quantity. The operational rule is: a) thepurchase volume is set at less than the sales volume in the Basic Plan and b) when the volume ofrice actually sold is less than the planned volume, the actual purchase volume will be set bysubtracting the difference from the planned volume.
At the present time, the annual sales volume is set at about 500,000 tons (since November 2002).
(Unit : Brown rice, 10,000 tons)Rice Year 1996/97 1997/98 1998/99 1999/00 2000/01Carry over (beginning volume) 224 267 297 233 162
Purchased volume 116 119 30 45 37
Sales volume 73 89 94 116 23
Stock volume 267 297 233 162 176
Stock volumes were at the end of October (Rice Year: Nov. – Oct.)
MMA Rice stockUntil the October 2000, 2,938 thousand tons of MMA rice was imported and total of 560 thousandtons was remaining as stock / reserve.
(Unit : Brown rice, 10,000 tons)Rice Year 1995/96 1996/97 1997/98 1998/99 1999/00Stock volume 31 39 42 44 56
Stock volumes were at the end of October of each year. (Rice Year: Nov. – Oct.)

Country Report : Japan
L - 13
Management of Stock / ReserveAs of 2001, Japanese government has a 165 thousand tons of capacity of low-temperaturewarehouse. During the summer season when rice is liable to be deteriorated, the rice stock is keptunder the controlled temperature (15℃) and humidity condition to maintain the quality and taste ofrice. The rice stored in such low-temperature warehouse is credited with a high degree of safety inthat it gathers neither mold nor weevils and therefore requires no chemicals for post-harvestprotection.
6.2 Private Sector’s Stock
(1) Carryover Stocks of the Voluntarily marketed rice
Carryover stocks, which were held by the registered shippers at the end of October, are as follows.
(Unit : 10,000 tons)Calendar Year 1996 1997 1998 1999 2000 2001
Carryover Stock ofVoluntarily marketed rice 39 85 47 22 11 37
Source : Food Agency Stock volumes were at the end of October in each year.
(2) Stocks of the wholesalers
According the Food Agency’s periodical surveys, stock volume of rice wholesalers (average ofstock volume at end of each month) were estimated as 261 thousand tons (RY1994/95), 281thousand tons (RY1995/96), 255 thousand tons (RY1996/97), 263 thousand tons (RY1997/98) and376 thousand tons (RY1998/99).
7. Trade
7.1 Rice Import
(1) Minimum Market Access
Under the Special Treatment Provisions on market access of the Uruguay Round, Japan deferred thetariffication of rice trade and granted duty free minimum market access equivalent to 4 % of itsaverage annual consumption in the base period (1986-88) in 1995/96, rising gradually with annualincrements of 0.8 % until it reach to 8 % in 2001/2002. Rice imports within this minimum accessquota faced zero tariff, though it was granted to add a mark-up of up to 292 yen per kilogram(US$ 2.56). This regime continued until April 1999 when a new regime was enacted.
The main changes under a new regime are on the over-quota rice imports for which the governmenthas set tariff rates of 351.17 yen (US$ 3.1) per kilogram in 1999 and 341 yen (US$ 2.98) per

Country Report : Japan
L - 14
kilogram in 2000. Accordingly the rate of annual increments in the minimum access volume washalved from 0.8 % to 0.4%. As a result, minimum access commitment for 1999 and 2000 werealtered to 724,000 tons (brown rice basis) and 767,000 tons respectively.
Minimum access from FY2001 onward will be determined in WTO Agricultural Negotiations.While the negotiations are in progress, FY 2000 level will be maintained.
Minimum Access Commitments
FY MA amount(Brown rice)
Ratio of totaldomestic
consumption
annual rate ofincrease
1995 426 4.0%1996 511 4.8% 0.8%1997 596 5.6% 0.8%1998 681 6.4% 0.8%1999 724 6.8% 0.4%2000 767 7.2% 0.4%
Source: Food Agency
MMA Rice Import SystemThe government’s minimum market access rice imports are carried out under the two methods:1) General Bidding and 2) Simultaneous Buy-and-Sell (SBS) Bidding.
Under the general bidding method, the government itself acts as the importer, and chooses thesupplier, the volume, and the type of rice. Currently this rice consists mainly of medium-grain rice.Under the SBS bidding system, in which designated importers and registered wholesalers submitjoint bids, it is the importer that determines the type of rice, etc., and this rice consists mainly ofshort-grain rice. SBS bids are submitted four times annually.
MMA Rice Tender Results (Unit : tons)FY1999 FY2000 FY2001
Country GB SBS TOTAL GB SBS TOTAL GB SBS TOTALU.S.A. 276,000 37,126 313,126 284,000 46,273 330,273 298,877 25,173 324,050Australia 90,000 14,587 104,587 94,000 14,269 108,269 91,500 8,529 100,029
China 13,900 62,611 76,511 35,000 53,264 88,264 55,516 65,702 121,218Thailand 138,200 3,753 141,953 144,370 4,960 149,330 129,376 421 129,797Vietnam 15,000 1,050 16,050 10,669 745 11,414 4,700 0 4,700
India 0 72 72 0 54 54 0 18 18Egypt 0 816 816 0 0 0 0 0 0Pakistan 0 72 72 0 350 350 0 54 54
Uruguay 0 162 162 5,000 0 5,000 0 0 0Italy 0 51 51 0 85 85 0 85 85Spain 0 0 0 0 0 0 0 18 18
TOTAL 533,100 120,300 653,400 573,039 120,000 693,039 579,969 100,000 679,969
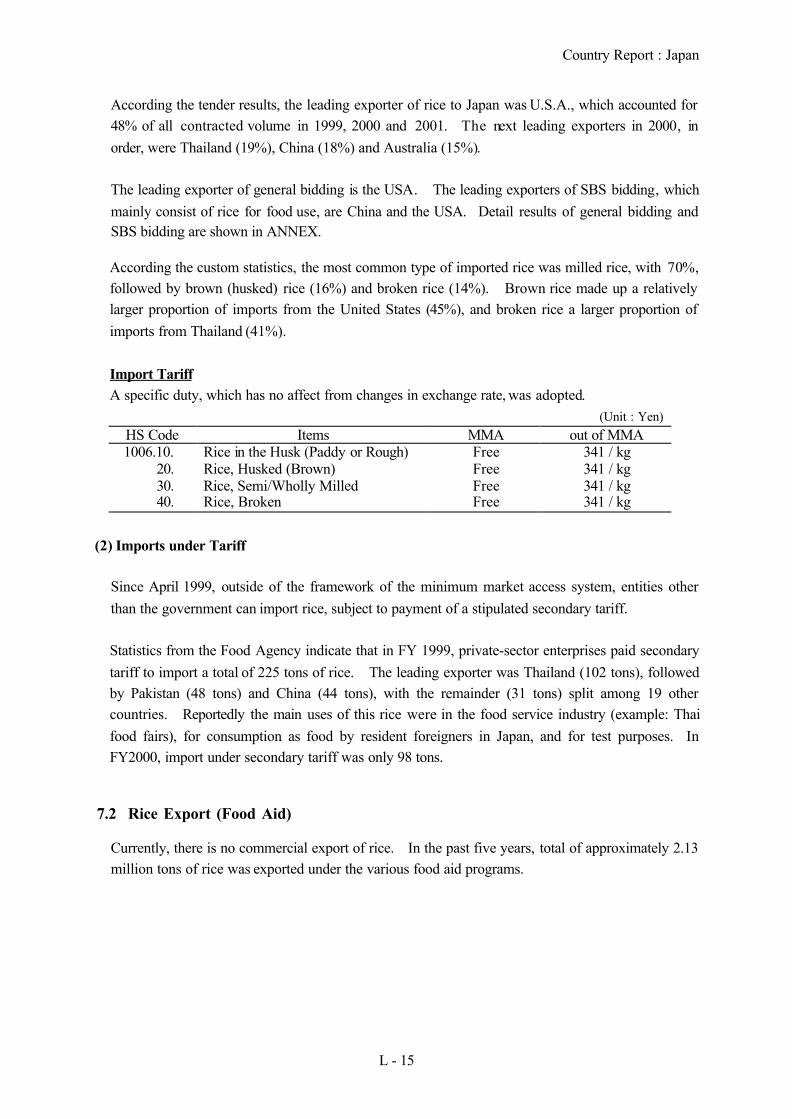
Country Report : Japan
L - 15
According the tender results, the leading exporter of rice to Japan was U.S.A., which accounted for48% of all contracted volume in 1999, 2000 and 2001. The next leading exporters in 2000, inorder, were Thailand (19%), China (18%) and Australia (15%).
The leading exporter of general bidding is the USA. The leading exporters of SBS bidding, whichmainly consist of rice for food use, are China and the USA. Detail results of general bidding andSBS bidding are shown in ANNEX.
According the custom statistics, the most common type of imported rice was milled rice, with 70%,followed by brown (husked) rice (16%) and broken rice (14%). Brown rice made up a relativelylarger proportion of imports from the United States (45%), and broken rice a larger proportion ofimports from Thailand (41%).
Import TariffA specific duty, which has no affect from changes in exchange rate, was adopted.
(Unit : Yen)HS Code Items MMA out of MMA1006.10. Rice in the Husk (Paddy or Rough) Free 341 / kg
20. Rice, Husked (Brown) Free 341 / kg30. Rice, Semi/Wholly Milled Free 341 / kg40. Rice, Broken Free 341 / kg
(2) Imports under Tariff
Since April 1999, outside of the framework of the minimum market access system, entities otherthan the government can import rice, subject to payment of a stipulated secondary tariff.
Statistics from the Food Agency indicate that in FY 1999, private-sector enterprises paid secondarytariff to import a total of 225 tons of rice. The leading exporter was Thailand (102 tons), followedby Pakistan (48 tons) and China (44 tons), with the remainder (31 tons) split among 19 othercountries. Reportedly the main uses of this rice were in the food service industry (example: Thaifood fairs), for consumption as food by resident foreigners in Japan, and for test purposes. InFY2000, import under secondary tariff was only 98 tons.
7.2 Rice Export (Food Aid)
Currently, there is no commercial export of rice. In the past five years, total of approximately 2.13million tons of rice was exported under the various food aid programs.

Country Report : Japan
L - 16
Recent Food Aid using Government RiceFinical Year Type of Food Aid Recipient country Volume 1/
KR food aid (Grant) Various countries Approx. 100,000 tons1997
Food aid (via WFP) North Korea Approx. 70,000 tonsKR food aid (Grant) Various countries Approx. 150,000 tons
1998Rice Loan Indonesia Approx. 700,000 tons
1999 KR food aid (Grant) Various countries Approx. 150,000 tonsKR food aid (Grant) Various countries Approx. 180,000 tonsFood aid (via WFP) North Korea Approx. 100,000 tons2000Food aid (via WFP) North Korea Approx. 500,000 tons
2001 KR food aid (Grant) Various countries Approx. 180,000 tonsTotal Approx. 2,130,000 tons
Source : Food Agency 1/ includes milled rice, brown rice and broken rice- KR food aid (Grant) : Mainly to African countries. Recipient counties have not largely been changed.- Food aid to North Korea (via WFP) : The government of Japan contributed the to the WFP, which procured
the government-stocked rice and supplied them to North Korea.- Rice Loan to Indonesia : Based on the result of joint research by the FAO and WFP, which indicated the
food shortage for 2.0 million tons of rice, and a request for support for more than 700,000 tons of rice fromthe Indonesia government, the government of Japan loaned 700,000 tons of the government-marketed riceunder the mechanism of “Emergency Food Aid” shown in below. Also provided a support to procure100,000 tons of rice in the international market by grant aid.
Emergency Food AidIn order to cope with large-scale needs of emergency food aid smoothly, the government of Japanhas set a new mechanism in 1998 for providing loans of rice in the government stocks. Under thismechanism, rice for emergency food aid will be reserved and the financial burden will be equalizedand fractionalized for each year and over a few decades.
JapaneseGovernment
FoodAgency
Generalaccount
RecipientGovernment
Operatingbody
(JIAC)
Repayment +Contribution by theoperating body
Necessary fundraised for the
* Fractionalizingfinancial
Loan of Rice
Agreement
Repayment
Loan
Bilateral/Multilateral Trade Agreements in RiceThere is no other trade agreements except the commitment on minimum market access in theUruguay Round (WTO) which is stated in the prior section “7.1 Rice Import”.

Country Report : Japan
L - 17
8. National Food Security Policy
The Basic Law on Food, Agriculture and Rural Areas was promulgated in July 1999. The objectiveof this Law is: to stabilize and improve people's lifestyle and to develop the national economy throughcomprehensively and systematically implementing policies on food, agriculture and rural areas bymeans of establishing basic principles and basic matters for realizing them and clarifying theresponsibilities of the state and local governments.
Regarding the food security policy, following 4 texts are stipulated in the “Chapter 1 GeneralProvisions”. Policies for securing stable food supply are stipulated in the “Section 2”.
Chapter 1 General Provisions: Article 2 Securing Stable Food Supply
1 In consideration of the fact that food is indispensable in maintaining human life and important as abasis for healthy and fulfilled living, a stable supply of good-quality food at reasonable prices shall besecured for the future.
2 In consideration of the fact that there are certain unstable factors in the world food trade andsupply/demand, this stable food supply to the people shall be secured with increase of domesticagricultural production as a basis, together with an appropriate combination with imports andstockpiles.
3 Food supply shall be managed in such a way as to improve agricultural productivity and tocomprehensively promote the sound development of agriculture and food industries, in response tothe more sophisticated and diversified public demand.
4 Even in the case that domestic supply is insufficient to meet demand or is likely to be for a certainperiod, due to unexpected situations such as a bad harvest or interrupted imports, the minimum foodsupply required for the people shall be secured in order not to be a hindrance to the stability ofpeoples' lives and smooth operation of the national economy.
Section 2 : Policies for Securing a Stable Food Supply
Article 16 Improvement of food consumption policies1 The State shall take necessary measures such as improving the management of food hygiene and
quality as well as proper food labeling, in order to secure food safety, improve food quality, and helpconsumers make proper selections.
2 The State shall take necessary measures such as developing guidelines for a healthy dietary pattern,broadening the people's knowledge of food consumption, and providing relevant information, in orderto promote better dietary patterns and the effective use of agricultural resources.
Article 17 Sound Development of the Food IndustryThe State shall take necessary measures such as reinforcing the management base, encouraging closercooperation with agriculture, and streamlining its distribution system, in order to promote the sounddevelopment of the food industry in view of the importance of its role as a stable food supply andwith proper consideration given to reducing the adverse effects of its business operations on theenvironment and ensuring effective use of resources.
(continue...)

Country Report : Japan
L - 18
Article 18 Policies on Imports/Exports of Farm Products1 The State shall take necessary measures for securing stable imports of farm products for which
domestic production cannot meet demand; and shall take necessary measures such as tariff rateadjustments and import restrictions, where urgently required, when certain imports have or are likelyto have a significant adverse effect on the production of domestic farm products competing againstsuch imports.
2 The State shall take necessary measures such as enhancing the competitiveness of domestic farmproducts, promoting market research, providing relevant information, and encouraging disseminationactivities, in order to increase exports.
Article 19 Food Security for EmergenciesThe State shall take necessary measures such as production increases and distribution restrictions,should these be deemed necessary in order to secure the minimum food required by the people in theevents prescribed in paragraph 4 of Article 2.
Article 20 Promotion of International CooperationThe State shall endeavor to promote international cooperation including technical and financialcooperation for the development of agriculture and rural areas as well as food aid to developingregions, in order to help the long-term stability of the world's food supply/demand.
(Source : MAFF, Provisional Translation)

Country Report : Japan
L - 19
References
1. Data/Information on rice prices, November 2001, Food Agency2. Data/Information on export-import of rice and wheat/other, August 2000, Food Agency3. An outline of the staple food law, January 1995, Food Agency4. An outline of Japan’s new rice policies, March 1998, Food Agency5. The basic law on food, agriculture and rural areas (provisional translation), Food Agency
(www. maff.go.jp/soshiki/kambou/kikaku/NewBLaw/BasicLaw.html)6. “Target on food self-sufficiency” The basic law on food, agriculture and rural areas
(abstract), Food Agency (www. kanbou.maff.go.jp/)7. The basic plan on stabilization of demand-supply and prices of rice, March 20008. The basic plan on stabilization of demand-supply and prices of rice, March 19989. The world supply and demand for rice and rice in Japan (Text for JICA training course),
2001, Tsukuba International Center / JICA10. Supply-demand policy for rice and wheat/barley and production adjustment of rice (draft),
June 2001, Food Agency11. Japan Grain and Feed - Annual 2001, GAIN Report #JA1026, USDA12. Japan Grain and Feed - Annual 2000, GAIN Report #JA0028, USDA13. Japan Grain and Feed - Japan’s Tariffication of Rice Slowed Import Growth Levels 2001,
GAIN Report #JA1006, USDA

Country Report : Japan
L - 20
Annexes
1. Japan at a glance & Social Indicators (World Bank Data)
2. Total area and cultivated land area, 1975 - 1997
3. Total population and agricultural population, 1975 - 1997
4. Number of total household and farm household, 1975 - 1997
5. Number of farm household classified by full-time and part-time, 1975 - 1997
6. Farm household population, 1985 - 1997
7. Number of persons engaged in agriculture and non-agricultural industries by age groups
8. Rice production by prefecture, Crop year 1997 – 1999
9. Possession of machinery for rice farming (Year 2000)
10. Production costs of rice, 1980 - 1997
11. Milled rice prices – Retail price by rice variety, monthly, 1998 - 2000
12. Paddy prices by rice variety, monthly, 1998 - 2000
13. Rice export/import in CY1997 (Custom data)
14. Rice export/import in CY1998 (Custom data)
15. Rice export/import in CY1999 (Custom data)
16. Rice export/import in CY2000 (Custom data)
17. Rice export/import in CY2001 (Custom data)
18. MMA rice imports – General tender results, FY1999 – 2001
19. MMA rice imports – SBS tender results, FY1999 – 2001
20. MMA rice imports – Detail results of SBS tender in FY2001

Japan at a glance 9/19/01
POVERTY and SOCIAL High-Japan income
2000Population, mid-year (millions) 126.8 903GNI per capita (Atlas method, US$) 34,210 27,510GNI (Atlas method, US$ billions) 4,336.8 24,829
Average annual growth, 1994-00
Population (%) 0.2 0.7Labor force (%) 0.5 0.9
Most recent estimate (latest year available, 1994-00)
Poverty (% of population below national poverty line) .. ..Urban population (% of total population) 79 77Life expectancy at birth (years) 81 78Infant mortality (per 1,000 live births) 4 6Child malnutrition (% of children under 5) .. ..Access to an improved water source (% of population) 96 99Illiteracy (% of population age 15+) .. < 5Gross primary enrollment (% of school-age population) 101 103
Male 101 104Female 101 103
KEY ECONOMIC RATIOS and LONG-TERM TRENDS
1980 1990 1999 2000
GDP (US$ billions) 1,059.3 2,970.0 4,346.9 4,677.1
Gross domestic investment/GDP 32.2 32.3 26.1 ..Exports of goods and services/GDP 13.7 10.7 10.4 ..Gross domestic savings/GDP 31.3 33.0 27.7 ..Gross national savings/GDP 31.2 .. 28.6 ..
Current account balance/GDP -1.0 1.5 2.5 ..Interest payments/GDP .. .. .. ..Total debt/GDP .. .. .. ..Total debt service/exports .. .. .. ..Present value of debt/GDP .. .. .. ..Present value of debt/exports .. .. .. ..
1980-90 1990-00 1999 2000 2000-04(average annual growth)GDP 4.0 1.3 0.2 1.9 ..GDP per capita 3.4 1.0 0.1 1.7 ..Exports of goods and services 4.5 4.6 1.9 .. ..
STRUCTURE of the ECONOMY1980 1990 1999 2000
(% of GDP)Agriculture 3.7 2.5 .. ..Industry 41.9 41.2 .. ..
Manufacturing 29.2 28.2 .. ..Services 54.4 56.3 .. ..
Private consumption 58.8 58.0 .. ..General government consumption 9.8 9.0 .. ..Imports of goods and services 14.6 10.0 8.7 ..
1980-90 1990-00 1999 2000(average annual growth)Agriculture 1.3 -1.6 .. ..Industry 4.2 0.8 .. ..
Manufacturing 4.8 1.2 .. ..Services 4.0 2.1 .. ..
Private consumption 3.7 1.7 .. ..General government consumption 2.4 2.2 .. ..Gross domestic investment 5.3 0.5 -1.1 ..Imports of goods and services 6.0 4.3 5.3 ..
Note: 2000 data are preliminary estimates.This table was produced from the Development Economics central database.
* The diamonds show four key indicators in the country (in bold) compared with its income-group average. If data are missing, the diamond willbe incomplete.
-10
0
10
20
95 96 97 98 99 00
GDI GDP
Growth of investment and GDP (%)
Japan High-income group
Development diamond*
Life expectancy
Access to improved water source
GNIpercapita
Grossprimary
enrollment
-10
0
10
20
95 96 97 98 99 00
Exports Imports
Growth of exports and imports (%)
Japan High-income group
Economic ratios*
Trade
Domesticsavings
Investment
Indebtedness
Kondo
L-21

Japan
PRICES and GOVERNMENT FINANCE1980 1990 1999 2000
Domestic prices(% change)Consumer prices 7.8 3.1 -0.3 -0.6Implicit GDP deflator 5.4 2.3 -0.9 -0.1
Government finance(% of GDP, includes current grants)Current revenue .. .. .. ..Current budget balance .. .. .. ..Overall surplus/deficit -7.0 -1.6 .. ..
TRADE1980 1990 1999 2000
(US$ millions)Total exports (fob) 130,441 287,581 419,367 479,328
Food and agricultural raw materials 2,928 3,298 .. ..Fuels, ores, and metals 2,591 4,043 .. ..Manufactures 122,677 274,981 .. ..
Total imports (cif) 141,296 235,368 311,262 379,514Food 16,843 33,897 .. ..Fuel and energy 69,988 56,765 .. ..Manufactures 26,090 102,062 .. ..
Export price index (1995=100) 52 69 .. ..Import price index (1995=100) 100 95 .. ..Terms of trade (1995=100) 52 73 .. ..
BALANCE of PAYMENTS1980 1990 1999 2000
(US$ millions)Exports of goods and services 146,980 323,692 464,692 ..Imports of goods and services 156,970 297,306 395,527 ..Resource balance -9,990 26,386 69,165 ..
Net income 770 22,492 49,839 ..Net current transfers -1,530 .. -12,139 ..
Current account balance -10,750 44,078 106,865 ..
Financing items (net) .. .. .. ..Changes in net reserves .. .. .. ..
Memo:Reserves including gold (US$ millions) 38,919 87,828 293,948 361,639Conversion rate (DEC, local/US$) 226.7 144.8 113.9 107.8
EXTERNAL DEBT and RESOURCE FLOWS1980 1990 1999 2000
(US$ millions)Total debt outstanding and disbursed .. .. .. ..
IBRD .. .. .. ..IDA .. .. .. ..
Total debt service .. .. .. ..IBRD .. .. .. ..IDA .. .. .. ..
Composition of net resource flowsOfficial grants .. .. .. ..Official creditors .. .. .. ..Private creditors .. .. .. ..Foreign direct investment 280 1,777 12,308 8,227Portfolio equity .. .. .. ..
World Bank programCommitments .. .. .. ..Disbursements .. .. .. ..Principal repayments .. .. .. ..Net flows .. .. .. ..Interest payments .. .. .. ..Net transfers .. .. .. ..
The World Bank Group: http://www.worldbank.org/data/ 9/19/01
0
1
2
3
4
94 95 96 97 98 99 00
Current account balance to GDP (%)
0
150,000
300,000
450,000
600,000
94 95 96 97 98 99 00
Exports Imports
Export and import levels (US$ mill.)
-5
0
5
95 96 97 98 99 00
GDP deflator CPI
Inflation (%)
Kondo
L-22
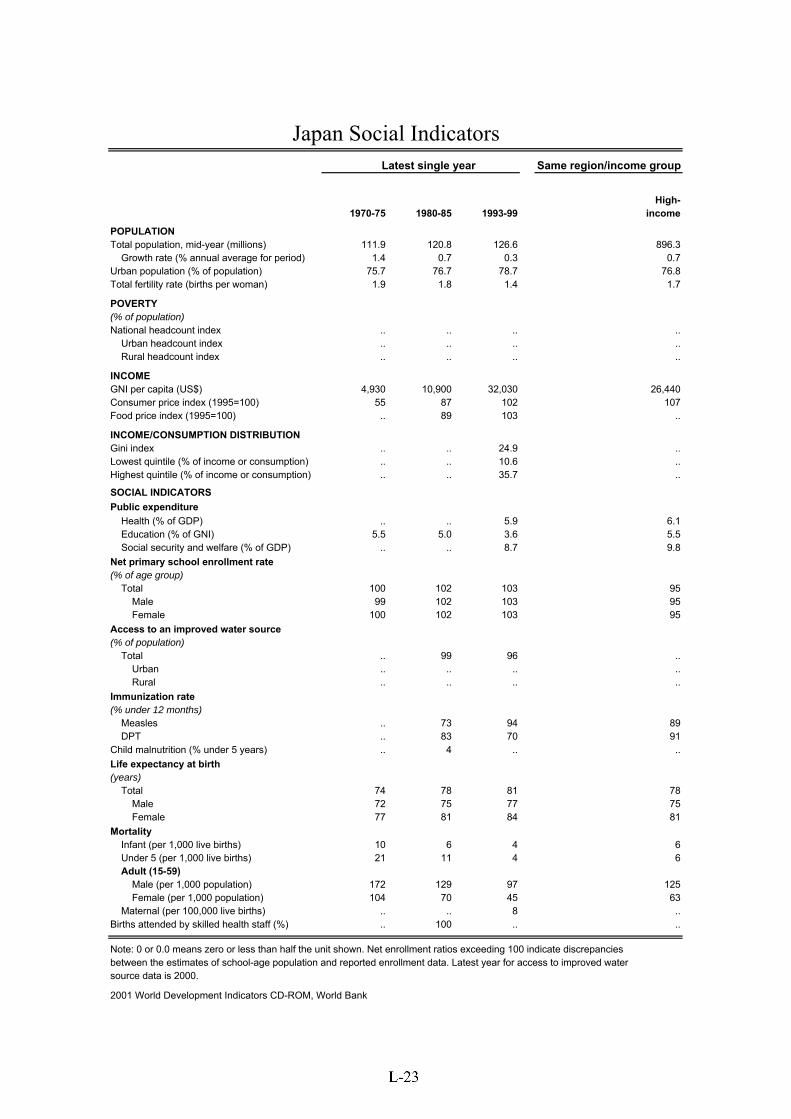
Japan Social IndicatorsLatest single year Same region/income group
High-1970-75 1980-85 1993-99 income
POPULATION Total population, mid-year (millions) 111.9 120.8 126.6 896.3 Growth rate (% annual average for period) 1.4 0.7 0.3 0.7Urban population (% of population) 75.7 76.7 78.7 76.8Total fertility rate (births per woman) 1.9 1.8 1.4 1.7
POVERTY(% of population)National headcount index .. .. .. .. Urban headcount index .. .. .. .. Rural headcount index .. .. .. ..
INCOMEGNI per capita (US$) 4,930 10,900 32,030 26,440Consumer price index (1995=100) 55 87 102 107Food price index (1995=100) .. 89 103 ..
INCOME/CONSUMPTION DISTRIBUTIONGini index .. .. 24.9 ..Lowest quintile (% of income or consumption) .. .. 10.6 ..Highest quintile (% of income or consumption) .. .. 35.7 ..
SOCIAL INDICATORSPublic expenditure Health (% of GDP) .. .. 5.9 6.1 Education (% of GNI) 5.5 5.0 3.6 5.5 Social security and welfare (% of GDP) .. .. 8.7 9.8Net primary school enrollment rate(% of age group) Total 100 102 103 95 Male 99 102 103 95 Female 100 102 103 95Access to an improved water source(% of population) Total .. 99 96 .. Urban .. .. .. .. Rural .. .. .. ..Immunization rate(% under 12 months) Measles .. 73 94 89 DPT .. 83 70 91Child malnutrition (% under 5 years) .. 4 .. ..Life expectancy at birth(years) Total 74 78 81 78 Male 72 75 77 75 Female 77 81 84 81Mortality Infant (per 1,000 live births) 10 6 4 6 Under 5 (per 1,000 live births) 21 11 4 6 Adult (15-59) Male (per 1,000 population) 172 129 97 125 Female (per 1,000 population) 104 70 45 63 Maternal (per 100,000 live births) .. .. 8 ..Births attended by skilled health staff (%) .. 100 .. ..
Note: 0 or 0.0 means zero or less than half the unit shown. Net enrollment ratios exceeding 100 indicate discrepanciesbetween the estimates of school-age population and reported enrollment data. Latest year for access to improved watersource data is 2000.
2001 World Development Indicators CD-ROM, World Bank
Kondo
L-23
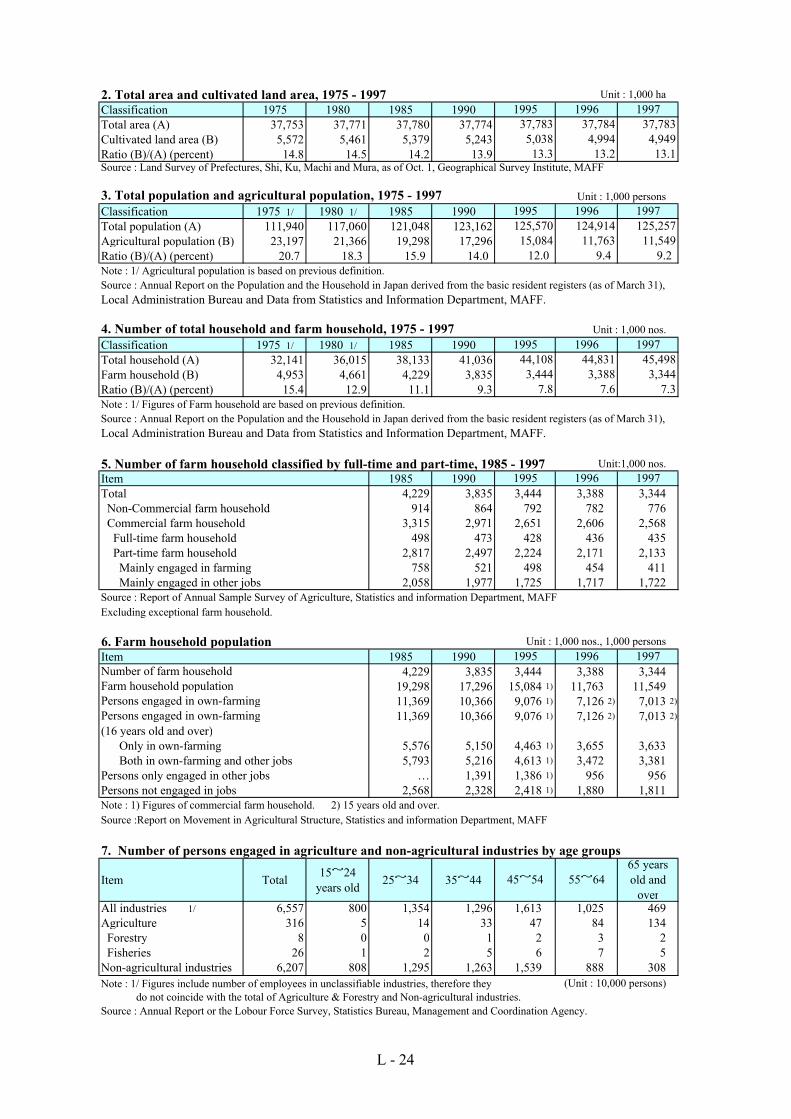
2. Total area and cultivated land area, 1975 - 1997 Unit : 1,000 haClassification 1975 1980 1985 1990Total area (A) 37,753 37,771 37,780 37,774Cultivated land area (B) 5,572 5,461 5,379 5,243Ratio (B)/(A) (percent) 14.8 14.5 14.2 13.9Source : Land Survey of Prefectures, Shi, Ku, Machi and Mura, as of Oct. 1, Geographical Survey Institute, MAFF
3. Total population and agricultural population, 1975 - 1997 Unit : 1,000 personsClassification 1975 1/ 1980 1/ 1985 1990Total population (A) 111,940 117,060 121,048 123,162Agricultural population (B) 23,197 21,366 19,298 17,296Ratio (B)/(A) (percent) 20.7 18.3 15.9 14.0Note : 1/ Agricultural population is based on previous definition.Source : Annual Report on the Population and the Household in Japan derived from the basic resident registers (as of March 31), Local Administration Bureau and Data from Statistics and Information Department, MAFF.
4. Number of total household and farm household, 1975 - 1997 Unit : 1,000 nos.Classification 1975 1/ 1980 1/ 1985 1990Total household (A) 32,141 36,015 38,133 41,036Farm household (B) 4,953 4,661 4,229 3,835Ratio (B)/(A) (percent) 15.4 12.9 11.1 9.3Note : 1/ Figures of Farm household are based on previous definition.Source : Annual Report on the Population and the Household in Japan derived from the basic resident registers (as of March 31), Local Administration Bureau and Data from Statistics and Information Department, MAFF.
5. Number of farm household classified by full-time and part-time, 1985 - 1997 Unit:1,000 nos.Item 1985 1990Total 4,229 3,835 3,444 3,388 3,344 Non-Commercial farm household 914 864 792 782 776 Commercial farm household 3,315 2,971 2,651 2,606 2,568 Full-time farm household 498 473 428 436 435 Part-time farm household 2,817 2,497 2,224 2,171 2,133 Mainly engaged in farming 758 521 498 454 411 Mainly engaged in other jobs 2,058 1,977 1,725 1,717 1,722Source : Report of Annual Sample Survey of Agriculture, Statistics and information Department, MAFFExcluding exceptional farm household.
6. Farm household population Unit : 1,000 nos., 1,000 personsItem 1985 1990
4,229 3,835 3,444 3,388 3,34419,298 17,296 15,084 1) 11,763 11,54911,369 10,366 9,076 1) 7,126 2) 7,013 2)
11,369 10,366 9,076 1) 7,126 2) 7,013 2)
(16 years old and over) Only in own-farming 5,576 5,150 4,463 1) 3,655 3,633 Both in own-farming and other jobs 5,793 5,216 4,613 1) 3,472 3,381Persons only engaged in other jobs … 1,391 1,386 1) 956 956Persons not engaged in jobs 2,568 2,328 2,418 1) 1,880 1,811Note : 1) Figures of commercial farm household. 2) 15 years old and over.Source :Report on Movement in Agricultural Structure, Statistics and information Department, MAFF
7. Number of persons engaged in agriculture and non-agricultural industries by age groups
Item Total15~24
years old25~34 35~44
All industries 1/ 6,557 800 1,354 1,296 1,613 1,025 469Agriculture 316 5 14 33 47 84 134 Forestry 8 0 0 1 2 3 2 Fisheries 26 1 2 5 6 7 5Non-agricultural industries 6,207 808 1,295 1,263 1,539 888 308Note : 1/ Figures include number of employees in unclassifiable industries, therefore they (Unit : 10,000 persons) do not coincide with the total of Agriculture & Forestry and Non-agricultural industries. Source : Annual Report or the Lobour Force Survey, Statistics Bureau, Management and Coordination Agency.
199537,7835,03813.3
44,1083,444
7.8
1995125,57015,084
12.0
1995
199637,7844,994
13.2
7.6
124,9141996
11,7639.4
45~54 55~6465 yearsold and
over
1995 1996 1997
1995 1996 1997
199745,4983,344
7.3
199644,8313,388
37,7834,949
1997
13.1
1997125,25711,549
9.2
Persons engaged in own-farmingPersons engaged in own-farming
Number of farm household Farm household population
L - 24

8. Rice production by Prefecture, Crop Year 1997 - 1999 Unit : 1000 tonsRice Year 1997 1998 1999 Rice Year 1997 1998 1999
Hokkaido 802 760 739 Shiga 198 190 193Aomori 380 324 341 Kyoto 92 82 87Iwate 377 315 346 Osaka 34 31 32Miyagi 497 418 445 Hyogo 223 197 208Akita 607 540 556 Nara 56 46 54Yamagata 474 425 438 Wakayama 42 38 41Fukushima 465 394 451 Tottori 82 77 77Ibaraki 449 378 421 Shimane 116 109 109Tochigi 411 325 362 Okayama 201 196 189Gunma 105 88 96 Hiroshima 159 145 144Saitama 196 169 181 Yamaguchi 144 131 123Chiba 360 316 335 Tokushima 71 69 70Tokyo 1 0 1 Kagawa 87 78 79Kanagawa 17 15 16 Ehime 92 86 80Niigata 672 611 654 Kochi 63 55 61Toyama 245 214 224 Fukuoka 229 219 186Ishikawa 153 136 144 Saga 171 170 139Fukui 162 146 152 Nagasaki 77 74 63Yamanashi 32 29 30 Kumamoto 242 233 183Nagano 247 217 233 Oita 146 141 108Gifu 140 111 130 Miyazaki 119 102 100Shizuoka 105 96 103 Kagoshima 143 137 112Aichi 170 158 162 Okinawa - - -Mie 171 165 174 Total 10,025 8,960 9,175Source : MAFF
9. Possession of machinery for Rice farming (Year 2000) Unit : nos./household
2 wheelTractor
4 wheelTractor
ReaperCombineharvester
1/
Dyer(powered)
Average 0.56 0.94 0.28 0.59 0.58less 0.5 ha 0.66 0.73 0.4 0.38 0.330.5 - 1.0 ha 0.55 0.94 0.27 0.59 0.531.0 - 1.5 ha 0.46 0.99 0.19 0.72 0.71.5 - 2.0 ha 0.39 1.14 0.15 0.87 0.92.0 - 3.0 ha 0.53 1.14 0.09 0.88 13.0 - 4.0 ha 0.39 1.4 0.04 0.95 1.24.0 - 5.0 ha 0.37 1.51 0.05 0.87 1.33over 5.0 ha 0.46 2.04 0.07 1.06 1.86
1/ Harvesting + threshingSource : MAFF
Transplantingmachine
(powered)0.820.70.84
1.031.09
0.880.920.940.96
L - 25

10. Production costs of rice, 1980 - 1997 (per 60 kg of brown rice)
Item Unit 1980 1985 1990 1995 1) 1996 1997 Seeds and seedlings cost yen 313 315 328 397 386 396 Fertilizers and manures cost 1,161 1,242 1,011 979 928 954 Agricultural chemicals cost 746 858 848 889 837 864 Light, heat and power cost 456 454 360 362 351 356 Miscellaneous materials cost 243 253 250 278 264 258 Water utilization and land improvement cost 613 666 744 995 931 917 Rent and charge 840 959 1,160 1,387 1,385 1,443 Buildings cost 463 489 521 464 456 485 Agricultural Implements cost 4,448 4,801 4,826 3,110 3,108 3,214 Labor cost 6,464 6,100 5,791 6,458 6,396 6,440Total cost ・・・・・・・・・・・・・・・・・・・・・・・・・・・・ (1) 15,747 16,137 15,839 15,811 15,337 15,633Value of by-products ・・・・・・・・・・・・・・・・・・ (2) 640 647 480 363 372 340Production cost(subtract from value of by product) ・・・・・・ (3)
15,107 15,490 15,359 15,448 14,965 15,293
Payment interest ・・・・・・・・・・・・・・・・・・・・・ (4) … … … 82 80 87Land rent ・・・・・・・・・・・・・・・・・・・・・・・・・・・・ (5) … … … 474 469 495Capital interest ・・・・・・・・・・・・・・・・・・・・・・・・ (6) 911 865 918 919 923 943Land ・・・・・・・・・・・・・・・・・・・・・・・・・・・・・・・・・ (7) 3,373 3,584 3,429 2,805 2,552 2,545Production cost counted in capital interest,land rent ・・・・・・・・・・・・・・・・・・・・・・・・・・・・・・・(8)
19,391 19,939 19,706 19,728 18,989 19,363
Reference
Rice and by-products (per 10 ares) Rice Yield kg 489 529 533 515 534 520 Value yen 150,733 170,802 159,858 149,630 156,105 136,395 Value of by-product 5,214 5,699 4,262 3,112 3,310 2,952Production cost counted in capital interest, land rent (per 10 ares)
158,035 175,706 174,891 168,929 169,204 167,893
Laboring hours (per 10 ares) hour 64.4 54.5 43.8 38.2 38.2 36.8Outline of farm household surveyed(per household) Number of family members person 4.9 5.0 5.1 4.5 4.5 4.3 Number of family members engaged inagriculture
1.9 1.3 1.3 0.9 0.9 0.9
Cultivated land area under management are 127 149 159 163 164 167 Planted area of crops surveyed 80.3 93.4 94.4 105.2 101.8 104.3Note : (1) - (2) = (3), (3) + (4) + (5) + (6) + (7) = (8) 1) In April 1991, survey definition was changed. Take good care in comparison.Source : MAFF
L - 26

11. Milled rice prices - Retail price by rice variety, monthly, 1998 - 2000
Year :1998 Unit : Yen per 10 kg
Variety Jan Feb Mar Apr May Jun Jul Aug Sep Oct Nov Dec Average
Hohhkaido Kirara397 4,220 4,200 4,178 4,138 4,178 4,144 4,139 4,115 4,155 4,255 4,245 4,224 4,183
Miyagi Hitomebore 4,947 4,941 4,922 4,903 4,934 4,940 4,895 4,874 4,908 5,174 5,190 5,164 4,983
Akita Akitakomachi 4,927 4,918 4,911 4,907 4,912 4,918 4,855 4,837 4,840 5,036 5,035 5,019 4,926
Niigata Koshihikari 5,761 5,753 5,753 5,735 5,746 5,778 5,738 5,734 5,780 6,179 6,190 6,141 5,857
Toyama Koshihikari 5,268 5,260 5,254 5,232 5,249 5,256 5,173 5,128 5,231 5,462 5,483 5,458 5,288
Year :1999 Unit : Yen per 10 kg
Variety Jan Feb Mar Apr May Jun Jul Aug Sep Oct Nov Dec Average
Hohhkaido Kirara397 4,205 4,205 4,223 4,241 4,233 4,217 4,237 4,226 4,240 4,137 4,140 4,152 4,205
Miyagi Hitomebore 5,158 5,160 5,172 5,154 5,136 5,137 5,115 5,101 5,087 4,915 4,737 4,917 5,066
Akita Akitakomachi 4,997 5,006 5,015 5,016 4,982 4,976 4,952 4,939 4,937 4,808 4,803 4,785 4,935
Niigata Koshihikari 6,109 6,104 6,110 6,068 6,002 5,967 5,935 5,918 5,921 5,729 5,702 5,692 5,938
Toyama Koshihikari 5,469 5,478 5,493 5,471 5,422 5,395 5,353 5,349 5,343 5,134 5,150 5,756 5,401
Year :2000 Unit : Yen per 10 kg
Variety Jan Feb Mar Apr May Jun Jul Aug Sep Oct Nov Dec Average
Hohhkaido Kirara397 4,132 4,127 4,139 4,126 4,120 4,122 4,121 4,113 4,106 3,948 3,941 3,970 4,080
Miyagi Hitomebore 4,906 4,894 4,886 4,852 4,835 4,832 4,816 4,793 4,836 4,634 4,629 4,600 4,793
Akita Akitakomachi 4,786 4,767 4,756 4,729 4,720 4,722 4,711 4,709 4,696 4,564 4,556 4,525 4,687
Niigata Koshihikari 5,691 5,678 5,668 5,646 5,636 5,629 5,612 5,617 5,610 5,407 5,384 5,363 5,578
Toyama Koshihikari 5,145 5,133 5,117 5,098 5,119 5,124 5,118 5,105 5,119 4,915 4,905 4,915 5,068
Source : Food Agency, MAFF
12. Paddy Prices by rice variety
Year :1998 Unit : Yen per 60 kg
Production area Jan Feb Mar Apr May Jun Jul Aug Sep Oct Nov Dec Average
Hokkaido 14,846 14,849 14,878 15,439 15,422 15,310 15,432 15,168
Miyagi 17,115 17,507 18,203 19,092 18,932 18,649 18,218 18,344 18,258
Akita 17,232 17,416 17,793 18,663 18,378 17,907 17,948 17,905
Yamagata 17,333 17,999 18,667 19,205 18,940 18,603 18,700 18,492
Shonai 17,356 18,024 18,928 19,245 18,867 18,462 18,627 18,501
Niigata 21,033 21,744 24,110 25,328 25,187 24,240 23,065 22,933 23,455
Year :1999 Unit : Yen per 60 kg
Production area Jan Feb Mar Apr May Jun Jul Aug Sep Oct Nov Dec Average
Hokkaido 15,766 16,026 15,857 15,692 15,547 15,488 15,594 15,203 15,034 15,037 15,034 15,058 15,445
Miyagi 18,662 18,958 18,222 18,258 18,211 17,150 16,726 16,474 16,502 17,685
Akita 18,289 18,542 18,047 17,424 17,382 17,372 16,793 16,592 16,337 16,169 17,295
Yamagata 19,008 19,241 18,858 18,498 18,429 18,347 17,607 17,927 17,590 17,362 17,318 18,199
Shonai 18,975 19,168 18,283 18,144 18,065 18,068 17,500 17,237 16,763 16,538 16,539 17,753
Niigata 23,654 23,906 22,957 22,306 21,900 21,798 21,712 21,187 20,816 20,829 20,856 21,993
Year :2000 Unit : Yen per 60 kg
Production area Jan Feb Mar Apr May Jun Jul Aug Sep Oct Nov Dec Average
Hokkaido 15,061 15,058 15,061 15,168 15,196 15,363 15,378 14,607 14,607 13,751 13,762 13,777 14,732
Miyagi 16,450 16,379 16,371 16,371 16,372 16,620 16,300 16,406 15,776 15,812 15,815 15,817 16,207
Akita 16,109 16,013 16,011 16,017 16,024 16,017 16,485 15,436 15,435 15,438 15,443 15,857
Yamagata 17,303 17,167 17,131 17,138 17,143 17,129 16,362 16,137 16,407 16,370 16,340 16,302 16,744
Shonai 16,526 16,410 16,409 16,365 16,370 16,375 16,014 15,804 15,828 15,792 15,814 16,155
Niigata 20,861 20,849 20,538 20,532 20,532 20,502 21,615 19,851 19,400 19,374 19,168 19,171 20,199
Source : Food Agency, MAFF
L - 27

13. Japan : Rice export/import in CY1997 (Custom data)
Export ImportCountry MT 1000Yen Country MT 1000Yen
1006.10 Rice in the husk 1006.10 Rice in the husk1006.10-000 GERMANY 1 4,563 1006.10-000 TAIWAN 3 4251006.10-000 S-TOTAL 1 4,563 S-TOTAL 3 425
1006.20 Husked (brown) rice 1006.20 Husked (brown) rice1006.20-000 N. KOREA 0 360 1006.20-000 CHINA 35847 24004091006.20-000 SINGAPORE 1 362 1006.20-000 VIETNAM 206 19,3941006.20-000 UNITED KINGDOM 0 295 1006.20-000 THAILAND 2,840 166,0231006.20-000 FRANCE 0 418 1006.20-000 INDONESIA 17 2,0671006.20-000 S-TOTAL 1 1,435 1006.20-000 ITALY 17 1,841
1006.20-000 USA 79,751 6,198,4091006.30 Semi-milled or wholly milled rice 1006.20-000 COLOMBIA 85 6,967
1006.30-000 N. KOREA 1 218 1006.20-000 URUGUAY 1,649 144,8831006.30-000 HONG KONG 59 27,069 1006.20-000 EGYPT 153 10,9631006.30-000 VIETNAM 0 211 1006.20-000 AUSTRALIA 37,400 2,787,5091006.30-000 THAILAND 9 4,408 1006.20-000 S-TOTAL 157,965 11,738,4651006.30-000 SINGAPORE 17 18,0521006.30-000 MALAYSIA 20 11,351 1006.30 Semi-milled or wholly milled rice 1006.30-000 INDONESIA 1 465 1006.30-000 CHINA 4,479 396,9741006.30-000 LAOS 9,135 257,101 1006.30-000 VIETNAM 119 5,3951006.30-000 BANGLADESH 0 288 1006.30-000 THAILAND 107,152 5,614,3541006.30-000 UNITED KINGDOM 3 2,276 1006.30-000 INDIA 17 2,4191006.30-000 SWITZERLAND 6 2,862 1006.30-000 PAKISTAN 57 8,7671006.30-000 SPAIN 1 590 1006.30-000 SPAIN 17 1,7541006.30-000 RUSSIAN 0 330 1006.30-000 ITALY 33 5,4261006.30-000 USA 23 12,131 1006.30-000 USA 159,422 12,984,6631006.30-000 HAITI 2,525 72,997 1006.30-000 AUSTRALIA 68,179 5,482,6461006.30-000 MAURITANIA 1,304 51,276 1006.30-000 S-TOTAL 339,475 24,502,3981006.30-000 SENEGAL 1,715 57,0601006.30-000 GUINEA 1,170 32,582 1006.40 Broken rice 1006.30-000 IVORY COAST 0 219 1006.40-000 VIETNAM 414 17,2101006.30-000 GHANA 4,386 127,731 1006.40-000 THAILAND 45,022 1,915,3351006.30-000 TOGO 4,305 124,423 1006.40-000 USA 19,479 1,419,2711006.30-000 BENIN 0 388 1006.40-000 URUGUAY 384 15,5121006.30-000 BURKINA 670 19,392 1006.40-000 AUSTRALIA 5,988 410,9251006.30-000 RWANDA 1,150 33,265 1006.40-000 S-TOTAL 71,287 3,778,2531006.30-000 C. AFRICA 0 390 G-TOTAL 568,730 40,019,5411006.30-000 ANGOLA 1,185 40,7701006.30-000 DJIBOUTI 1,131 32,1741006.30-000 MOZAMBIQUE 4,897 141,9671006.30-000 MADAGASCAR 1,776 60,000 Source : Ministry of Finance, Trade Statistics1006.30-000 ZAMBIA 0 215 http://www.mof.go.jp/trade-st/tr-indexe.html1006.30-000 ERITREA 0 4711006.30-000 AUSTRALIA 2 1,4641006.30-000 S-TOTAL 35,491 1,134,136
1006.40 Broken rice1006.40-000 UNITED KINGDOM 0 2471006.40-000 DJIBOUTI 358 7,4631006.40-000 AUSTRALIA 0 2101006.40-000 S-TOTAL 358 7,920
G-TOTAL 35,851 1,148,054
L - 28

14. Japan : Rice export/import in CY1998 (Custom data)
Export ImportCountry MT 1000Yen Country MT 1000Yen
1006.10 Rice in the husk 1006.20 Husked (brown) rice1006.10-000 THAILAND 0 360 1006.20-000 CHINA 31,180 2,289,8491006.10-000 GERMANY 0 202 1006.20-000 VIETNAM 291 29,3501006.10-000 SWITZERLAND 0 322 1006.20-000 THAILAND 69 6,2211006.10-000 S-TOTAL 0 884 1006.20-000 USA 124,652 8,911,507
1006.20-000 URUGUAY 528 471251006.20 Husked (brown) rice 1006.20-000 EGYPT 147 10,516
1006.20-000 N. KOREA 18,000 792,090 1006.20-000 AUSTRALIA 16,308 1,696,3581006.20-000 SINGAPORE 1 455 1006.20-000 S-TOTAL 173,175 12,990,9261006.20-000 INDONESIA 281,274 15,518,5841006.20-000 FRANCE 0 279 1006.30 Semi-milled or wholly milled rice 1006.20-000 S-TOTAL 299,275 16,311,408 1006.30-000 CHINA 41,608 3,094,348
1006.30-000 VIETNAM 4,996 211,4151006.30 Semi-milled or wholly milled rice 1006.30-000 THAILAND 61,397 2,884,778
1006.30-000 CHINA 2 1,250 1006.30-000 INDIA 9 1,4711006.30-000 HONG KONG 25 13,840 1006.30-000 PAKISTAN 35 6,8701006.30-000 VIETNAM 0 203 1006.30-000 ITALY 50 9,2201006.30-000 THAILAND 9 3,924 1006.30-000 USA 108,149 9,301,6261006.30-000 SINGAPORE 28 19,591 1006.30-000 URUGUAY 1 8281006.30-000 INDONESIA 18,726 1,041,903 1006.30-000 AUSTRALIA 52,825 4,066,1211006.30-000 LAOS 6,804 222,951 1006.30-000 S-TOTAL 269,070 19,576,6771006.30-000 BANGLADESH 0 2601006.30-000 YEMEN 1 724 1006.40 Broken rice 1006.30-000 UNITED KINGDOM 18 9,544 1006.40-000 VIETNAM 442 19,5311006.30-000 SWITZERLAND 2 1,388 1006.40-000 THAILAND 31,174 1,260,1281006.30-000 USA 55 29,446 1006.40-000 USA 17,640 1,299,4051006.30-000 NICARAGUA 0 428 1006.40-000 AUSTRALIA 7,882 534,0691006.30-000 HAITI 3,519 115,138 1006.40-000 S-TOTAL 57,138 3,113,1331006.30-000 MAURITANIA 716 26,101 G-TOTAL 499,383 35,680,7361006.30-000 SENEGAL 5,251 190,6221006.30-000 GUINEA 1,690 55,3171006.30-000 TOGO 2,055 55,6871006.30-000 BENIN 1,399 44,2811006.30-000 C. VERDE 2,005 68,6561006.30-000 RWANDA 602 19,698 Source : Ministry of Finance, Trade Statistics1006.30-000 ANGOLA 1,211 39,627 http://www.mof.go.jp/trade-st/tr-indexe.html1006.30-000 ST. PRINCIPE 328 14,2801006.30-000 DJIBOUTI 2,539 83,0721006.30-000 UGANDA 0 2421006.30-000 TANZANIA 2,029 66,3891006.30-000 SEYCHELLES 0 3301006.30-000 MOZAMBIQUE 1,881 61,5401006.30-000 MADAGASCAR 958 34,9721006.30-000 ZIMBABWE 0 3911006.30-000 ZAMBIA 0 6851006.30-000 COMOROS 1,283 38,5061006.30-000 AUSTRALIA 0 7941006.30-000 PAPUA NEW GUINEA 4,810 157,3941006.30-000 MARSHALL ISLANDS 3 7641006.30-000 S-TOTAL 57,949 2,419,938
1006.40 Broken rice1006.40-000 SENEGAL 954 27,6511006.40-000 S-TOTAL 954 27,651
G-TOTAL 358,178 18,759,881
L - 29

15. Japan : Rice export/import in CY1999 (Custom data)
Export ImportCountry MT 1000Yen Country MT 1000Yen
1006.10 Rice in the husk 1006.20 Husked (brown) rice1006.10-000 CHINA 0 310 1006.20-000 CHINA 13,478 755,1631006.10-000 VIETNAM 0 204 1006.20-000 VIETNAM 150 12,9221006.10-000 GERMANY 0 202 1006.20-000 THAILAND 99 2,8891006.10-000 SWITZERLAND 0 286 1006.20-000 USA 210,090 11,940,7041006.10-000 S-TOTAL 0 1,002 1006.20-000 URUGUAY 467 27742
1006.20-000 AUSTRALIA 39,342 2,483,2281006.20 Husked (brown) rice 1006.20-000 S-TOTAL 263,626 15,222,648
1006.20-000 SINGAPORE 2 8021006.20-000 INDONESIA 119,997 6,749,312 1006.30 Semi-milled or wholly milled rice 1006.20-000 USA 7 3,128 1006.30-000 CHINA 58,740 3,607,3211006.20-000 MOZAMBIQUE 93 3,351 1006.30-000 VIETNAM 15,166 597,4861006.20-000 S-TOTAL 120,099 6,756,593 1006.30-000 THAILAND 112,110 4,011,039
1006.30-000 INDIA 4,972 206,1151006.30 Semi-milled or wholly milled rice 1006.30-000 PAKISTAN 105 11,904
1006.30-000 HONG KONG 50 22,457 1006.30-000 BANGLADESH 0 2051006.30-000 THAILAND 5 2,227 1006.30-000 ITALY 34 6,7101006.30-000 SINGAPORE 1,424 21,368 1006.30-000 USA 86,792 5,803,9821006.30-000 CAMBODIA 5,863 201,177 1006.30-000 URUGUAY 1 6421006.30-000 LAOS 3,908 124,600 1006.30-000 AUSTRALIA 50,882 3,367,1991006.30-000 ISRAEL 1,800 62,568 1006.30-000 S-TOTAL 328,802 17,612,6031006.30-000 JORDAN 880 30,1921006.30-000 SYRIA 420 14,409 1006.40 Broken rice 1006.30-000 LEBANON 480 16,470 1006.40-000 CHINA 4,339 208,2191006.30-000 YEMEN 0 790 1006.40-000 VIETNAM 768 26,3801006.30-000 UNITED KINGDOM 16 10,275 1006.40-000 THAILAND 39,821 1,187,5651006.30-000 NETHERLANDS 1 500 1006.40-000 USA 15,196 919,5571006.30-000 FRANCE 0 373 1006.40-000 AUSTRALIA 11,675 638,6761006.30-000 SWITZERLAND 2 929 1006.40-000 S-TOTAL 71,799 2,980,3971006.30-000 USA 32 20,781 G-TOTAL 664,227 35,815,6481006.30-000 HONDURAS 244 8,3861006.30-000 SALVADOR 0 2151006.30-000 MAURITANIA 1,512 52,0961006.30-000 GUINEA 1,000 34,346 Source : Ministry of Finance, Trade Statistics1006.30-000 BURKINA FASO 759 24,861 http://www.mof.go.jp/trade-st/tr-indexe.html1006.30-000 NIGER 806 24,0401006.30-000 C. AFRICA 0 5621006.30-000 ST. PRINCIPE 602 20,6611006.30-000 UGANDA 0 2921006.30-000 TANZANIA 2,000 65,4371006.30-000 MOZAMBIQUE 2,046 70,2161006.30-000 ZAMBIA 0 1,5591006.30-000 AUSTRALIA 0 2561006.30-000 NEW ZEALAND 4 2,0961006.30-000 NEW CALEDONIA 0 2141006.30-000 S-TOTAL 23,854 834,353
1006.40 Broken rice1006.40-000 R. KOREA 0 3,3361006.40-000 S-TOTAL 0 3,336
G-TOTAL 143,953 7,595,284
L - 30

16. Japan : Rice export/import in CY2000 (Custom data)
Export ImportMT 1000Yen MT 1000Yen
1006.10 Rice in the husk 1006.20 Husked (brown) rice1006.10-000 CHINA 1 3,329 1006.20-010 AUSTRALIA 4,708 245,9021006.10-000 SWITZERLAND 0 280 1006.20-010 CHINA 1,864 81,9631006.10-000 SPAIN 0 252 1006.20-010 USA 99,200 4,085,9591006.10-000 S-TOTAL 1 3,861 1006.20-010 S-TOTAL 105,772 4,413,824
1006.20 Husked (brown) rice 1006.20-090 CHINA 26 4,1961006.20-000 MOZAMBIQUE 702 16,728 1006.20-090 S-TOTAL 26 4,1961006.20-000 N. KOREA 7,003 190,2931006.20-000 SINGAPORE 0 324 1006.30 Semi-milled or wholly milled rice 1006.20-000 USA 0 567 1006.30-010 AUSTRALIA 86,645 4,513,4521006.20-000 S-TOTAL 7,705 207,912 1006.30-010 CHINA 60,843 2,724,140
1006.30-010 INDIA 18 2,5261006.30 Semi-milled or wholly milled rice 1006.30-010 ITALY 50 8,088
1006.30-000 ANGOLA 801 19,091 1006.30-010 PAKISTAN 183 18,5321006.30-000 AUSTRALIA 0 227 1006.30-010 SINGAPORE 18 2,5301006.30-000 BENIN 722 24,789 1006.30-010 THAILAND 90,203 2,523,6531006.30-000 C. VERDE 921 32,698 1006.30-010 USA 204,792 10,531,3901006.30-000 CAMBODIA 827 19,939 1006.30-010 VIETNAM 14,897 384,1991006.30-000 CHAD 250 9,312 1006.30-010 S-TOTAL 457,649 20,708,5101006.30-000 DJIBOUTI 743 25,5081006.30-000 EQ. GUINEA 790 29,790 1006.30-090 AUSTRALIA 11006.30-000 FRANCE 3 1,980 1006.30-090 BANGLADESH 51006.30-000 GAMBIA 185 6,891 1006.30-090 CHINA 29 2,3891006.30-000 GHANA 2,116 69,335 1006.30-090 INDIA 0 3761006.30-000 GUINEA 319 9,899 1006.30-090 ITALY 2 1,2471006.30-000 HONG KONG 62 26,075 1006.30-090 PAKISTAN 6 5241006.30-000 INDONESIA 3 2,001 1006.30-090 THAILAND 155 7,6711006.30-000 ISRAEL 1,840 80,034 1006.30-090 URUGUAY 0 2781006.30-000 IVORY COAST 2,134 75,080 1006.30-090 USA 102 9,4811006.30-000 JORDAN 1,080 47,862 1006.30-090 S-TOTAL 300 23,3001006.30-000 KIRIBATI 0 3781006.30-000 LEBANON 420 18,016 1006.40 Broken rice1006.30-000 MADAGASCAR 1,532 47,404 1006.40-010 AUSTRALIA 10,436 498,8101006.30-000 MALAWI 977 33,557 1006.40-010 CHINA 7,925 341,0551006.30-000 MALDIVES 1,359 46,631 1006.40-010 EGYPT 815 27,2551006.30-000 MALI 0 218 1006.40-010 THAILAND 37,929 813,6461006.30-000 MALAYSIA 0 234 1006.40-010 USA 34,360 1,649,1951006.30-000 MARIANA 3 1,445 1006.40-010 VIETNAM 548 17,0771006.30-000 MAURITANIA 350 6,201 1006.40-010 S-TOTAL 92,013 3,347,0381006.30-000 MARSHALL ISLANDS 2 1,568 G-TOTAL 655,760 28,496,8681006.30-000 MONGOL 6,061 207,9821006.30-000 NEW ZEALAND 0 4051006.30-000 NIGER 2,082 67,2671006.30-000 NIGERIA 5 2,350 Source : Ministry of Finance, Trade Statistics1006.30-000 PHILIPPINES 0 210 http://www.mof.go.jp/trade-st/tr-indexe.html1006.30-000 REUNION 1 3991006.30-000 RUSSIAN 1 7371006.30-000 SENEGAL 4,570 151,9081006.30-000 SINGAPORE 37 20,5401006.30-000 ST. PRINCIPE 974 32,9671006.30-000 SWITZERLAND 0 2931006.30-000 SYRIA 580 25,3061006.30-000 TANZANIA 2,647 90,8601006.30-000 THAILAND 4 1,8211006.30-000 TONGA 0 3001006.30-000 UNITED KINGDOM 14 6,6811006.30-000 UGANDA 0 4181006.30-000 USA 27 15,6911006.30-000 S-TOTAL 34,442 1,262,298
G-TOTAL 42,148 1,474,071
L - 31

17. Japan : Rice export/import in CY2001 (Custom data)
Export ImportCountry MT 1000Yen Country MT 1000Yen
1006.10 Rice in the husk 1006.20 Husked (brown) rice1006.10-000 LAOS 0 307 1006.20-010 CHINA 712 37,3811006.10-000 GERMANY 0 253 1006.20-010 USA 109,738 3,726,8731006.10-000 S-TOTAL 0 560 1006.20-010 AUSTRALIA 20,689 903,330
1006.20-010 S-TOTAL 131,139 4,667,5841006.20 Husked (brown) rice
1006.20-000 N. KOREA 499,999 112,247,268 1006.20-090 CHINA 5 7431006.20-000 UNITED KINGDOM 2 830 1006.20-090 S-TOTAL 5 7431006.20-000 GERMANY 5 1,3621006.20-000 S-TOTAL 500,006 112,249,460 1006.30 Semi-milled or wholly milled rice
1006.30-010 CHINA 83,041 3,548,0131006.30 Semi-milled or wholly milled rice 1006.30-010 VIETNAM 10,769 275,604
1006.30-000 MONGOL 6 287 1006.30-010 THAILAND 106,122 2,811,5401006.30-000 HONG KONG 51 27,407 1006.30-010 INDIA 37 5,2261006.30-000 THAILAND 0 511 1006.30-010 PAKISTAN 217 20,4971006.30-000 SINGAPORE 34 22,604 1006.30-010 ITALY 67 12,8701006.30-000 MALAYSIA 0 247 1006.30-010 USA 151,963 6,255,1191006.30-000 PHILIPPINES 0 783 1006.30-010 URUGUAY 4,847 192,0571006.30-000 INDONESIA 4 1,698 1006.30-010 AUSTRALIA 65,673 3,016,4351006.30-000 LAOS 526 12,536 1006.30-010 S-TOTAL 422,736 16,137,3611006.30-000 BANGLADESH 1,500 35,7371006.30-000 NEPAL 463 11,036 1006.30-090 CHINA 1 4741006.30-000 ISRAEL 1,884 64,644 1006.30-090 VIETNAM 4 5621006.30-000 JORDAN 797 27,347 1006.30-090 THAILAND 160 8,5671006.30-000 SYRIA 422 14,479 1006.30-090 BANGLADESH 3 5441006.30-000 LEBANON 440 15,097 1006.30-090 SPAIN 3 1,0411006.30-000 UNITED KINGDOM 15 8,233 1006.30-090 ITALY 11 4,6361006.30-000 NETHERLANDS 0 981 1006.30-090 USA 112 9,7701006.30-000 BELGIUM 1 960 1006.30-090 URUGUAY 0 3121006.30-000 FRANCE 3 1,628 1006.30-090 S-TOTAL 294 25,9061006.30-000 SWITZERLAND 4 1,8211006.30-000 RUSSIAN 3 729 1006.40 Broken rice 1006.30-000 TURKEY 0 243 1006.40-010 CHINA 4,065 162,5731006.30-000 CANADA 54 6,927 1006.40-010 VIETNAM 215 6,7651006.30-000 USA 16 9,790 1006.40-010 THAILAND 36,990 842,0991006.30-000 CHILE 2 940 1006.40-010 USA 41,224 1,563,9011006.30-000 MAURITANIA 8,863 177,028 1006.40-010 AUSTRALIA 9,007 379,0031006.30-000 SENEGAL 6,724 134,289 1006.40-010 S-TOTAL 91,501 2,954,3411006.30-000 GHANA 14,799 328,022 G-TOTAL 645,675 23,785,9351006.30-000 BENIN 1,265 25,8071006.30-000 MALI 0 5001006.30-000 BURKINA 378 9,0081006.30-000 C. VERDE 180 4,304 Source : Ministry of Finance, Trade Statistics1006.30-000 CANARY 6 1,785 http://www.mof.go.jp/trade-st/tr-indexe.html1006.30-000 NIGERIA 4 3,2101006.30-000 CAMEROON 3,477 5791006.30-000 ANGOLA 7,939 156,5571006.30-000 ST. PRINCIPE 4,801 95,8931006.30-000 DJIBOUTI 204 5,0971006.30-000 KENYA 0 4051006.30-000 TANZANIA 844 20,1251006.30-000 MOZAMBIQUE 1,440 28,7701006.30-000 MADAGASCAR 3,431 68,5381006.30-000 S-TOTAL 60,580 1,326,582
G-TOTAL 560,586 113,576,602
L - 32

18. MMA rice imports - General tender results, FY 1999 - 2001
Results of 1st - 6th MMA Rice Genaral Tender Results in JFY1999 (April 1999 - March 2000)Country Type First Second Third Fourth Fifth Sixth TOTAL
(Data of Tender) (6/11/99) (9/24/99) (10/2299) (11/30/99) (12/22/99) (1/12/00)USA Calif. Medium (Brown) 0 12,000 24,000 12,000 24,000 20,000 92,000
Calif. Medium (Milled) 0 40,200 29,800 39,300 25,700 19,700 154,700Broken (Milled) 0 7,800 6,200 6,700 4,300 4,300 29,300TOTAL 0 60,000 60,000 58,000 54,000 44,000 276,000
Australia Medium (Brown) 0 10,000 0 0 0 0 10,000Medium (Milled) 0 8,900 17,400 8,900 17,400 17,400 70,000Broken (Milled) 0 1,100 2,600 1,100 2,600 2,600 10,000TOTAL 0 20,000 20,000 10,000 20,000 20,000 90,000
Thailand Long (Milled) 2,000 16,700 15,000 30,000 16,800 13,200 93,700Long (Glu., Milled) 0 400 0 0 0 0 400Broken (Milled) 3,000 12,900 5,000 0 3,200 5,000 29,100Broken (Glu., Milled) 10,000 5,000 15,000TOTAL 15,000 30,000 20,000 30,000 20,000 23,200 138,200
China Long (Milled) 0 0 0 0 5,000 8,900 13,900Vietnam Long (Milled) 0 5,000 10,000 0 0 0 15,000
GRAND TOTAL 15,000 115,000 110,000 98,000 99,000 96,100 533,100WEIGHTED AVERAGE PRICE JYEN 31,746 40,255 39,853 38,517 40,844 40,103
USD (US$259 ) (US$364 ) (US$372 ) (US$366 ) (US$395 ) (US$374 )
Results of 1st - 6th MMA Rice Genaral Tender Results in JFY2000 (April 2000 - March 2001)Country Type First Second Third Fourth Fifth Sixth TOTAL
(Data of Tender) (6/13/00) (10/6/00) (11/2/00) (12/1/00) (12/27/00) (1/30/01)USA Calif. Medium (Brown) 0 36,000 24,000 24,000 12,000 24,000 120,000
Calif. Medium (Milled) 0 20,800 30,400 31,200 30,400 26,600 139,400Broken (Milled) 0 3,200 5,600 4,800 5,600 5,400 24,600TOTAL 0 60,000 60,000 60,000 48,000 56,000 284,000
Australia Medium (Brown) 0 2,000 0 5,000 0 7,000 14,000Medium (Milled) 0 15,660 8,700 13,050 17,400 14,620 69,430Broken (Milled) 0 2,340 1,300 1,950 2,600 2,380 10,570TOTAL 0 20,000 10,000 20,000 20,000 24,000 94,000
Thailand Long (Milled) 1,900 24,800 20,000 15,000 21,600 21,370 104,670Long (Glu., Milled) 0 0 0 0 500 0 500Broken (Milled) 2,700 8,200 0 5,000 2,900 5,000 23,800Broken (Glu., Milled) 400 2,000 0 5,000 5,000 3,000 15,400TOTAL 5,000 35,000 20,000 25,000 30,000 29,370 144,370
China Long (Milled) 0 0 10,000 10,000 10,000 5,000 35,000Vietnam Long (Milled) 0 0 0 0 5,000 5,669 10,669Uruguay Long (Milled) 0 0 0 0 0 5,000 5,000
GRAND TOTAL 5,000 115,000 100,000 115,000 113,000 125,039 573,039WEIGHTED AVERAGE PRICE JYEN n.a. 34,793 33,283 31,400 30,783 32,075
USD ($325) ($308) ($283) ($271) ($277)
Results of 1st - 6th MMA Rice Genaral Tender Results in JFY2001(April 2001 - March 2002)Country Type First Second Third Fourth Fifth Sixth TOTAL
(Data of Tender) (5/9/01) (7/19/01) (10/19/01) (11/14/01) (12/19/01) (2/19/02)USA Medium Grain (Brown) 0 0 0 0 0 0 0
Medium Grain (Milled) 0 0 42,360 63,120 72,600 82,000 260,080Broken (Milled) 0 277 5,640 8,880 11,400 12,600 38,797TOTAL 0 277 48,000 72,000 84,000 94,600 298,877
Australia Medium Grain (Brown) 0 0 7,000 0 0 10,000 17,000Medium Grain (Milled) 0 0 19,100 17,440 17,800 9,000 63,340Broken (Milled) 0 0 3,900 3,560 3,700 0 11,160TOTAL 0 0 30,000 21,000 21,500 19,000 91,500
Thailand Long (Milled) 1,300 1,700 9,860 29,450 26,000 28,276 96,586Long (Glu., Milled) 3,700 3,300 140 3,150 1,000 0 11,290Broken (Milled) 0 0 0 400 0 6,000 6,400Broken (Glu., Milled) 0 0 0 2,000 8,000 5,100 15,100TOTAL 5,000 5,000 10,000 35,000 35,000 39,376 129,376
China Long (Milled) 0 0 10,000 20,700 15,300 9,300 55,300Broken (Milled) 0 0 0 0 216 0 216TOTAL 0 0 10,000 20,700 15,516 9,300 55,516
Vietnam Long (Milled) 0 0 0 0 0 4,700 4,700GRAND TOTAL 5,000 5,277 98,000 148,700 156,016 166,976 579,969
WEIGHTED AVERAGE PRICE JYEN n.a. 23,981 41,056 36,595 39,054 40,319USD ($195) ($339) ($302) ($305) ($304)
Source : USDA, www.japan-rice.com
L - 33

19. MMA rice imports - SBS tender results, FY 1999 - 2001
Japan : SBS Tender Results in JFY1999 (April 1999 - March 2000) (unit : MT)Country 1st 2nd 3rd 4th Total
(Data of Tender) (5/28/99) (8/27/99) (11/5/99) (12/10/99) %China 9,029 23,260 15,395 14,927 62,611 52.0%U.S.A. 4,408 12,739 12,555 7,424 37,126 30.9%Thailand 868 898 508 1,479 3,753 3.1%Australia 9,969 2,475 1,501 642 14,587 12.1%Vietnam 438 594 18 0 1,050 0.9%India 54 0 0 18 72 0.1%Egypt 0 0 306 510 816 0.7%Pakistan 72 0 0 0 72 0.1%Uruguay 162 0 0 0 162 0.1%Italy 0 34 17 0 51 0.04%TOTAL 25,000 40,000 30,300 25,000 120,300 100.0%
Japan : SBS Tender Results in JFY2000 (April 2000 - March 2001) (unit : MT)Country 1st 2nd 3rd 4th Total
(Data of Tender) (5/23/00) (8/29/00) (11/10/00) (12/15/00) %China 11,460 18,046 9,260 14,498 53,264 44.4%U.S.A. 11,328 10,829 11,573 12,543 46,273 38.6%Thailand 266 2,946 136 1,612 4,960 4.1%Australia 6,800 2,559 3,881 1,029 14,269 11.9%Vietnam 36 494 0 215 745 0.6%Pakistan 76 108 94 72 350 0.3%India 0 18 5 31 54 0.05%Italy 34 0 51 0 85 0.1%Total 30,000 35,000 25,000 30,000 120,000 100%
Japan : SBS Tender Results in JFY2001 (April 2001 - March 2002) (unit : MT)Country 1st 2nd 3rd 4th Total
(Data of Tender) (5/30/01) (8/31/01) (11/9/01) (1/9/02) %China 11,262 16,000 19,306 19,134 65,702 65.7%U.S.A. 8,985 7,201 3,713 5,274 25,173 25.2%Thailand 78 57 58 228 421 0.4%Australia 4,640 1,671 1,854 364 8,529 8.5%Vietnam 0 0 0 0 0 0%Pakistan 18 36 0 0 54 0.1%India 0 0 18 0 18 0.02%Italy 17 17 51 0 85 0.1%Spain 0 18 0 0 18 0.02%Total 25,000 25,000 25,000 25,000 100,000 100.0%
Source : USDA, www.japan-rice.com
L - 34

20. MMA rrice imports - Detail results of SBS tender in FY2001 (Apr.2001 - Mar.2002)
Category Country TypeQuantityApplied
QuantityAwarded
Food Agency'sPurchase Price
Food Agency'sSelling Price Mark-up Category Country Type
QuantityApplied
QuantityAwarded
Food Agency'sPurchase Price
Food Agency'sSelling Price Mark-up
(MT) (MT) (YEN/MT) (YEN/MT) (Kg) (MT) (MT) (YEN/MT) (YEN/MT) (Kg)First SBS Tender (May 30, 2001) Third SBS Tender (November 09, 2001)Whole rice U.S.A. Short/Brown 450 342 72,653 267,489 195 Whole rice U.S.A. Short/Brown 324 162 70,467 257,367 187 Short/Milled 7,740 6,483 71,195 267,559 196 Short/Milled 3,027 1,353 75,184 260,886 186 Glut./Short/Milled 1,576 648 70,353 265,981 195 Medium/Milled 38 38 61,807 251,996 190 sub total 9,766 7,473 71,188 267,419 196 Glut/Short/Brown 18 0 ― ― ― Italy Short/Milled 17 17 291,000 491,000 200 Glut./Short/Milled 1,892 900 69,318 255,508 186 India Long/Milled 18 0 ― ― ― sub total 5,299 2,453 72,513 258,543 186 Australia Short/Brown 1,841 1,673 69,638 267,918 198 Italy Medium/Milled 51 51 167,000 355,500 189 Short/Milled 3,658 2,967 71,924 266,621 195 India Long/Milled 18 18 185,000 379,000 194 sub total 5,499 4,640 71,100 267,089 196 Australia Short/Milled 2,018 1,694 68,797 256,577 188 Thailand Long/Milled 36 18 44,000 240,000 196 Thailand Long/Milled 36 18 63,000 249,500 187 Glut./Long/Milled 40 20 76,500 271,500 195 China Short/Milled 35,953 18,226 70,388 256,902 187 sub total 76 38 61,105 256,579 195 Glut./Short/Milled 426 40 80,000 265,500 186 China Short/Milled 27,327 9,918 66,149 260,455 194 sub total 36,379 18,266 70,409 256,921 187 Glut./Short/Milled 648 396 79,091 273,096 194 Pakistan Long/Milled 36 0 ― ― ― sub total 27,975 10,314 66,646 260,940 194 Vietnam Short/Milled 18 0 ― ― ― Pakistan Long/Milled 18 18 123,000 323,000 200 TOTAL 43,855 22,500 70,822 257,387 187 Vietnam Short/Milled 108 0 ― ― ― Broken rice U.S.A. Broken/Milled 5,135 1,260 51,717 118,732 67 TOTAL 43,477 22,500 ― ― ― Australia Broken/Milled 838 160 50,609 114,709 64Broken rice U.S.A. Broken/Milled 7,516 1,512 52,802 116,623 64 Thailand Broken/Milled 456 40 31,400 93,700 62 Australia Broken/Milled 334 0 ― ― ― China Broken/Milled 4,244 1,040 51,246 116,326 65 Thailand Broken/Milled 1,256 40 30,000 93,200 63 TOTAL 10,673 2,500 51,629 117,073 ― China Broken/Milled 4,204 948 49,411 113,609 64 Vietnam Broken/Milled 108 0 ― ― ― TOTAL 13,418 2,500 ― ― ―
Second SBS Tender (August 31, 2001) Fourth SBS Tender (January 09, 2002)Whole rice U.S.A. Short/Brown 901 684 78,245 260,592 182 Whole rice U.S.A. Short/Brown 270 270 80,000 258,000 178 Short/Milled 6,914 3,407 77,118 255,528 178 Short/Milled 2,474 2,258 81,893 257,033 175 Medium/Milled 54 54 63,982 244,981 181 Medium/Milled 60 60 67,850 247,500 180 Glut./Short/Milled 2,994 1,341 72,182 252,121 180 Glut/Short/Brown 18 18 70,000 247,000 177 sub total 10,863 5,486 75,923 255,223 179 Glut./Short/Milled 1,986 1,692 76,737 252,789 176 Italy Medium/Milled 17 17 153,000 335,000 182 sub total 4,808 4,298 79,499 255,248 176 India Long/Milled 18 0 ― ― ― Australia Short/Milled 197 197 74,670 251,257 177 Australia Short/Milled 3,384 1,338 71,218 247,360 176 Thailand Long/Milled 188 188 66,144 243,246 177 Spain Short/Brown 18 18 305,000 480,500 176 Glut./Long/Milled 40 40 72,000 248,750 177 Thailand Long/Milled 53 17 61,500 243,500 182 sub total 228 228 67,171 244,211 177 Glut./Long/Milled 40 40 61,500 243,000 182 China Short/Brown 260 218 73,200 244,200 171 sub total 93 57 61,500 243,149 182 Short/Milled 30,709 17,111 75,833 250,654 175 China Short/Brown 198 198 66,300 244,400 178 Long/Brown 20 20 105,000 295,000 190 Short/Milled 40,885 15,180 70,981 248,922 178 Glut./Short/Milled 686 428 81,916 255,633 174 Long/Brown 20 20 105,000 300,000 195 sub total 31,675 17,777 75,980 250,745 175 Glut./Short/Milled 690 150 80,200 257,250 177 Vietnam Short/Milled 18 0 ― ― ― sub total 41,793 15,548 71,054 249,011 178 TOTAL 36,926 22,500 76,552 251,543 175 Pakistan Long/Milled 36 36 123,000 298,500 176 Broken rice U.S.A. Broken/Milled 4,120 976 52,504 116,749 64 Vietnam Short/Milled 362 0 ― ― ― Australia Broken/Milled 1,236 167 49,803 112,976 63 TOTAL 56,584 22,500 72,559 250,742 178 Thailand Broken/Milled 324 0 ― ― ―Broken rice U.S.A. Broken/Milled 7,669 1,715 52,212 115,057 63 China Broken/Milled 3,022 1,357 51,983 114,440 62 Australia Broken/Milled 743 333 48,992 112,344 63 TOTAL 8,702 2,500 52,041 115,244 63 Thailand Broken/Milled 654 0 ― ― ― China Broken/Milled 2,652 452 53,451 115,239 62 Source : USDA, www.japan-rice.com TOTAL 11,718 2,500 52,007 114,729 ―
L-35

COUNTRY REPORT
Korea

Country Report : Korea
M - 1
1. Production
1.1 General
Until the 1960s, Korea was a typical agrarian country, with agriculture generating almost half of itsGNP, and employing half of the total labor force. In 1970, agricultural production contributed23.3 % to GDP and the labor force employed in the agricultural sector accounted for 52.9 %.Agriculture in Korea still has an important role in the national economy, accounting for a relativelylarge share of GDP (5.8 % in 1997, 4.6% in 2000) and employment (11.0 %, 10,5 %), although theshare of agriculture has been declining continuously.
As in many other countries, Korea’s agricultural sector has contributed greatly to the developmentof the economy through the provision of food stuffs and labor supply for the non-agricultural sectors,and capital formation, as well as through the conservation of the environment and preservation ofthe Korean traditional culture. Korean people think that they have their roots in farming, and haverelatives on farms or in rural areas. Farmers and agriculture in Korea have retained their reputationand privileged position in Korean society. Therefore, there has been extensive governmentintervention in production to consumption of agricultural commodities in Korea for the past decades.Strong government intervention responds to the high value Koreans place on agriculture. Thisreflects the considerable power of agricultural interests, which is in part derived from widespreadsupport from the general population.
Most people think that the agricultural sector is the backbone of Korean culture and tradition.Agriculture in Korea is perceived to be important for security, stability and prosperity of the nation.An example is the continued growth in government support for the agricultural sector, particularlywith respect to rice industry, despite increased pressures from foreign trading partners.
1.2 Basic Condition of Rice Farming
(1) Land Use for Rice Production
Cultivated area is approximately 18.9% of the whole land area (9,981,759ha). The next tableshows percentage between water land and dry land. Paddy field is more than 60% of the whole-cultivated area.

Country Report : Korea
M - 2
Table 1: Cultivation Area and Paddy Field
Year
Totalcultivated
area(‘000ha)
Water landarea
(‘000ha)
Percentage ofwater land
(%)
Dry land area(‘000ha)
Percentage ofdry land
(%)
Yield(ton/ha)
1985 2,144 1,325 62 819 38 1.111990 2,109 1,345 64 764 36 1.211992 2,070 1,315 64 755 36 1.261993 2,055 1,298 63 757 37 1.291994 2,033 1,267 62 766 38 1.301995 1,985 1,206 61 779 39 1.321996 1,945 1,176 60 769 40 1.291997 1,924 1,163 60 761 40 1.341998 1,910 1,157 61 753 39 1.351999 1,899 1,153 61 746 39 1.372000 1,889 1,149 61 740 39 1.36
Source: Agricultural and Forestry Statistical Yearbook (2001)
(2) Number of farm householders and agriculture population
Table 2: Number of farm households, population of farmer and population of agriculturalemployment
YearFarmer
households(‘000)
Percentage offarmer
households(%)
Population offarmer
householder(‘000)
Percentage offarmer
population(%)
Population ofagricultureemployment
(‘000)
Percentage ofagricultureemployment
(%)1985 1,926 20 8,521 21 3,554 23.7
1990 1,767 16 6,661 15 3,100 17.11993 1,592 14 5,407 12 2,734 14.11994 1,558 14 5,167 12 2,619 13.21995 1,499 11.6 4,851 10.8 2,419 11.81996 1,480 - 4,692 10.3 2,322 11.21997 1,440 - 4,468 9.7 2,276 10.81998 1,413 - 4,400 9.5 2,399 12.21999 1,382 - 4,210 9.0 2,264 11.22000 1,384 9.7 4,032 8.7 2,203 10.5Source: MAF, Statistical Yearbook of Agriculture and Forestry 2001
Korea’s farm population stood at 4.5 million persons in 1997, or about 9.7 % of total population(Table 2). While the total population has expanded rapidly, almost doubling in the last three decades,farm population has declined sharply since the 1960s due to continued industrialization andurbanization. Specifically, total population has increased from 32.2 million in 1970 to 46.2 millionin 1997, while farm population dropped from 14.4 million to 4.5 million over the same period.Agricultural employment in 1997 accounted for 11.0 %(2.3 million) of total employment(21.0million), down slightly from 11.6 % in 1996.
Farmers have migrated to urban cities, seeking job opportunities with higher payments. The rural-urban migration is expected to continue and its pace may be accelerated. As a result of the decreasein total farm population, many changes have occurred in agricultural sector, including labor

Country Report : Korea
M - 3
structure, cropping intensity, farm wage rate, agricultural mechanization and other agriculturalinputs.
The 1997 Farm Household Economy Survey showed that the average farm income rose by 0.8 % to23.5 million won (Table 3). Grains represent one of the most important sources of income forfarmers in Korea. Farmer’s revenue rose considerably in both crop and livestock sectors. The levelof farm household income was up for two reasons. First, yields in vegetables, specialty crops andfruits were higher compared to the previous year. Second, livestock receipts were a little increaseddespite the drops in cattle and chicken prices.
Table 3: Agriculture in the national economy1970 1980 1990 1995 1996 1997 1998 1999 2000
Population Thousand 32,241 38,124 42,869 44,609 45,093 45,991 46,430 46,858 47,275Population ofAgriculture
Thousand% of total
14,42244.7
10,82728.4
6,66115.5
4,85110.8
4,69210.3
4,4689.7
4,4009.5
4,2109.0
4,0328.5
Employment 1,000 persons 9,167 13,683 18,085 20,377 20,764 21,048 21,456 21,634 21,950Employmentof Agriculture
1,000 persons% of total
4,84652.9
4,65434.0
3,23717.9
2,54112.5
2,40511.6
2,32411.0
2,39912.2
2,26411.2
2,28810.5
GDP Billion won 2,771 36,854 178,262 348,979 386,438 416,018 394,710 482,744 517,100GDP ofAgriculture
Billion won% of total
64523.3
5,61215.2
15,5928.7
23,0126.6
24,5456.4
24,0565.8
24,6205.1
23,7874.6
Source: MAF, Statistical Yearbook of Agriculture and Forestry 2001, The Bank of Korea
During the economic development period of the past 40 years, the agricultural sector was givenlittle attention and development in other sectors was considered more important. Accordingly, inthe process of rapid industrialization in Korea, which began in the early 1960s, the agriculturesector has declined continuously. The agricultural share of GDP, which was 23.3 % in 1970,decreased to 15.2 % in 1980 and to 5.8 % in 1997. The agricultural sector’s share in employmentalso declined to around 17.9 % in 1990 and 11.0 % in 1997, from 52.9 % in 1970. In addition, theshare of farm population in total population has been decreasing at a similar pace.
This decline is a continuing trend that began with Korea’s switch to an outward-orienteddevelopment strategy initiated in the early 1960s. With limited resources available, thegovernment made decisions that stress the industrial sector, which appeared more imperative andimportant to achieve development goals. This decline is common to most developing and export-oriented countries, and to some extent, it is inevitable in the move toward an industrial economy. Ina sense, it may be a shift in the national economy from the agricultural sector to the manufacturing,and may indicate that the Korean economy is entering a matured phase of development.
However, it should be noted that agriculture in Korea has a particular significance in the Koreanculture and economy, which is not reflected in the simple economic indicators. Moreover, such animbalance between rural and urban sectors is not desirable for the sound and balanced economicdevelopment of a nation. To become more competitive in the changing world market, theagricultural sector must be developed in a balanced way in the national economy because theinteraction between agriculture and the rest of the economy are becoming more complex. The

Country Report : Korea
M - 4
policies and events in the agricultural sector have an important effect on other sectors, and they areaffected by other sectors.
In addition, many changes and fluctuations in the agricultural sector are directly related to theeconomic health of the other sectors. Continuous rural-urban migration, for example, has led tochanges in wage structure in the manufacturing sector. Rapidly increasing consumption of livestock,horticultural and processed products has also led to changes in wage and production structure bothin rural and urban areas. These changes are of great concern to the agricultural sector as well asthe other sectors.
At times, problems and changes in the agricultural sector have led to emotional debate within thegeneral public. Therefore, growth in other sectors is also important for the successful developmentof the agricultural sector. Hence, it seems likely to say that it is a generally accepted view thatagriculture in Korea is still the backbone of Korean culture and tradition and is perceived to beimportant for security and prosperity of the nation, although the relative importance of agriculture interms of GDP and employment has been declining.
One of major objectives of agricultural policy is to increase farm income from both agricultural andnon-agricultural activities, and to close the income gap between farm and non-farm workers. Thestriking feature of Korean farm households is a high dependence on agricultural income. Althoughthe dependence has gradually been decreased, farm households still obtain a considerable amount oftheir total income from agricultural activities (Table 3).
Agricultural income continues to be of major importance to total farm income, and the highdependence on agricultural income is also expected to continue in the future if current type offarming prevails. Average non-agricultural income increased to 8.2 million won, or 35.2 % of thetotal farm income in 1997. Farm households frequently supplement their income through non-agricultural employment during off-season. The relatively high share(35.2 %) of non-agriculturalincome in total farm household income in 1997 was due to the significant increase in wage andsalary earnings from secondary jobs, reflecting the establishment and more effective operation ofrural manufacturing plants in recent years.
Although the development of the Korean economy over the last decades increased employment andincentives for off-farm works in rural areas, non-agricultural activities have been small, and haverisen slowly. The ratio of non-agricultural income to total farm income was 21.5 % in 1980, whileit stood at 25.8 % in 1990 and 35.2 % in 1997. Overall, non-agricultural income represented about30 % of total farm income over the past decade. Meanwhile, the share of non-agricultural incomesin neighboring countries was considerably higher. For instance, the share reached 61.0 % in Japan in1996.

Country Report : Korea
M - 5
(3) Farming scale
Table 4 : Farmer households by size of cultivated land for all crops
Year
Non-croplandhouseholds
Less than0.5ha
0.5 ~less than1.0ha
1.0 ~lessthan 2.0
2.0 ~lessthan 3.0ha
3.0ha andover Total
% % % % % %1991 35,061 2.1 465,947 27.4 526,933 30.9 511,489 30.1 121,342 7.1 41,535 2.4 1,702,307
1992 22,854 1.4 468,802 28.6 495,809 30.2 476,997 29.1 123,819 7.5 52,574 3.2 1,640,853
1993 23,202 1.5 451,276 28.3 472,001 29.6 459,774 28.9 126,942 8.0 59,283 3.7 1,592,478
1994 24,852 1.6 452,844 29.0 448,176 28.8 442,280 28.4 124,397 8.0 65,440 4.2 1,557,989
1995 23,918 1.6 432,982 28.9 432,107 28.8 417,960 27.9 123,333 8.2 70,445 4.7 1,500,745
1996 25,274 1.7 440,158 29.7 421,356 28.5 404,897 27.4 117,564 7.9 70,353 4.8 1,479,602
1997 22,896 1.6 438,277 30.4 410,701 28.5 382,790 26.6 114,818 8.0 70,194 4.9 1,439,676
1998 21,519 1.5 482,842 34.2 395,314 28.0 347,351 24.6 99,760 7.1 66,232 4.7 1,413,017
1999 21,158 1.5 482,842 34.2 388,315 28.0 332,481 24.1 90,343 6.5 62,633 4.5 1,381,637
2000 15,478 1.1 423.458 30.6 380,653 27.5 359,164 25.9 118,628 8.6 86,712 6.3 1,384,093
(4) Use of farm machinery
Table 5: Agricultural machinery holding
Resource: MAFF
(5) Farm household debt
In 1997, the average farm debt was 13 million won, up by 10.9 % from the previous year. 94.6 % ofthe amount was borrowed from credit institutions(mostly NACF) and the remaining 5.4 % fromprivate sources (Table 6).
Substantial changes in farmers credit sources were noted between the 1980 and 1997 Farm CreditSurveys. The 1980 Farm Credit Survey indicated that the average borrowing was at 339,000 wonwith 51 % of the borrowing supplied by institutional credit sources and the remaining 49 % byprivate credit sources. However, the institutional borrowings accounted for 94.6 % of the borrowingin 1997.
Power Dusting Equipment DryerSpeed Sprayer
YearPowerTiller
FarmTractor
RiceTrans-planter
Bind-er
Com-bine Total
Foror-
chards
Forpaddyfield
Spray-er
Mister&
DusterWaterPump
Thresh-ing
Machinefixedtype
circula-tiontype
Sow-ing
Mach.
1995 868,870 100,412 248,009 66,960 72,268 712,882 13,472 16,735 557,349 125,326 384,900 121,970 28,408 117,875 12,995
1996 910,404 113,287 271,051 67,914 73,831 716,781 15,873 21,132 561,346 118,430 407,634 109,945 38,089 122,789 14,841
1997 945,844 131,358 302,934 68,903 74,258 703,383 19,921 23,374 540,001 120,087 397,417 95,790 44,132 136,154 13,202
1998 959,976 157,888 325,126 73,025 78,099 642,478 24,179 20,706 462,000 135,593 344,950 78,160 49,832 145,650 9,693
1999 953,749 176,146 335,818 73,256 84,002 624,936 27,006 19,704 428,186 150,040 309,087 65,558 53,216 156,718 8,413
2000 939,219 191,631 341,978 72,315 86,982 628,946 28,885 22,447 410,725 166,889 292,871 58,766 55,573 164,532 7,711

Country Report : Korea
M - 6
Table 6 : Average farm debt (Unit : 1,000 won, %) Total Institutional sources Private sourcesYear
% % %1980 339 (100.0) 173 (51.0) 166 (49.0)
1990 4,734 (100.0) 4,078 (86.1) 656 (13.9)1995 9,163 (100.0) 8,364 (91.3) 799 (8.7)1996 11,734 (100.0) 10,992 (93.7) 742 (6.3)1997 13,012 (100.0) 12,304 (94.6) 708 (5.4)
Source : MAF, Report on the Farm Household Economic Survey(1998)
It appears that farmers have been turning toward institutional credit. Most of the farm debt hasbeen used for production purposes. In 1997, some 75 % of the debt had been used for production-oriented activities. The remainder was used for household consumption and repayment of maturedloans.
Chronicity of farm debt has long been a serious problem in Korea. A number of policy measuresand programs, including the farm income support policy, have been implemented for the purpose ofalleviating farm debt. To this end, a farm debt relief program was carried out in 1988. Forfarmers with chronic debt, their debt was partly written off in line with the legal provisions made bythe National Assembly. Assessment of this farm debt write-off policy continues to becontroversial.
(6) Farm household assets
The value of the average farm assets was about 184 million won in 1997. The asset portfolio offarmers is another means to measure financial health. With the slow and steady increase in farmincome, average farm assets have also increased. In 1997, they rose to 184 million won, up by9.2 % from the previous year. Of the amount, 83.0 % were fixed assets, 2.8 % liquid assets, and theremaining 14.2 % financial assets (Table 7). The rise in the asset value reflects partly a increase invalues of farmland and buildings
Table 7 : Farm assetsTotal Fixed Assets Liquid Assets Financial Assets
Year% % % %
1980 13,384 (100.0)
11,796 (88.1) 963 (7.2) 625 (4.7)1990 79,352 (100.0
)69,666 (87.8) 3,160 (4.0) 6,526 (8.2)
1995 158,171 (100.0)
134,334 (84.9) 4,098 (2.6) 19,739 (12.5)1996 168,901 (100.0
)142,665 (84.5) 5,052 (3.0) 21,184 (12.5)
1997 184,503 (100.0)
153,149 (83.0) 5,113 (2.8) 26,241 (14.2) Source : MAFF

Country Report : Korea
M - 7
Farm assets are both a source of income and a stock of capital. Agricultural machinery has alwaysbeen an important element of farm assets, but it is often difficult to estimate their value because ofdepreciation.
(7) Farm household expenditures
Farm household’s expenditures in 1997 were virtually unchanged from 17.0 million won in 1996.Spending on food still occupied an important proportion of farm household expenditure, accountingfor 20 % in 1997. Unlike in the previous years, other miscellaneous spending declined in 1997 as aresult of the decreases in expenditure on house improvement and donations for marriages andfuneral services, etc, reflecting the adverse effects of the financial crisis starting late 1997.Expenditure on education rose sharply from 200 thousand won in 1980 to 862 thousand won in1990. And it stood at 1.7 million won in 1997. This high level of expenditure on education hasbecome an important economic burden for farm households but it reflects their high concern foreducation of their children.
1.3 Production
Rice has been a part and parcel of the Korean culture, tradition and mentality. Rice-centric farminghas been the core of Korean agriculture. It dates back more than 5,000 years and continues to be animportant part of the Korean agricultural policy. Since ancient times, ensuring sufficient supply ofrice for the population has been very important for social and political stability. Sufficientproduction of major food-crops has long been regarded as major policy objectives, because Koreanremembers the deleterious effects of inadequate supply of major staples before 1950’s.
Of total crop land area of 1,924,000 ha in 1997, 55 % (1,052 thousand ha) was planted with rice,most of which was grown on small family farms. In 1997, rice accounted for about 30 % of totalagricultural production in value terms, and about 42 % of farm receipts. There has been littlechange in this feature of rice-centric farming in Korean agriculture during thousands of years. Theseaspects of Korean agriculture explain why policies for rice industry play such a crucial role inKorea’s overall agricultural policy. Meanwhile, rice price has long been regarded as one of theleading indicators on which the prices of almost all the other commodities are based.
Rice production in 1997 amounted to 5.5 million MT. Rice production, which normally representsabout 88 % of total grain production. The average annual rice production in early 1990s hasremained at around 5.2 million MT. This figure is marginally below the average between 1985 and1990.
Rice production has been decreased in 1990s, but this trend was changed from 1996. Rice harvest in1997 registered 5,450 MT following 5,323 MT in 1996 although the area planted with rice wasincreased, to only a moderate degree, compared to the previous year. This record harvest resulted

Country Report : Korea
M - 8
largely from unprecedented favorable weather conditions and the consequent increase in rice yieldper ha.
The government purchases paddy directly from farmer with high price by adverse spread, whichwould sell milled rice with lower price. Paddy support prices were increased for the 1998/99season but prices in real terms remained below the pre-URA level. In fact, the ability of theGovernment to provide price incentives to rice producers has been constrained since 1995 by itsURA obligation to reduce the Aggregate Measure of Support to Agriculture, of which some 93 % isaccounted for by rice. Consequently, as the country continues to be committed to rice self-sufficiency, the Government has shifted to “green box” policies to support the development of highyielding hybrid varieties.
1.4 Production Control
Korea could reach 100% of rice self-sufficient in 1997 (crop year 1997/98). Under thecircumstance, in January 2000, the Korea passed a new Agriculture Law, which emphasizes thedevelopment of a sustainable agriculture and the maintenance of a high degree of rice self-sufficiency. Rice producers continued to benefit from attractive support prices, which were furtherraised by 5 % in 2000. However, the quantities procured by the Government were lower in 1999and 2000 than in the preceding years, to keep aggregate support to agriculture within the URAAlimits, since rice accounts for over 90 % of the total. The Government efforts to boost productivityconcentrated on research and the promotion of high yielding hybrid, short maturity rice varieties.
Korea could reach 100% of rice self sufficient because of consumption reduction for rice withchange of dietary pattern. Accordingly, there is over production situation for the rice, and thegovernment is holding 1.09 million ton of rice leftover in 2001. Conceptive necessary actions aresated as below:
a) Enlargement for rice consumptionb) Use rice for food aidc) Control rice production
Material activities for rice production control have not been initiated as yet. Under the conditionof liberalization for the agriculture sector, it is most important point for the government to keep theposition of 100% of rice self-sufficient by activities through the government policy.
2. Rice Marketing
2.1 Actual Situation
Implementation of the government rice purchase program in compliance with the annual AMSreduction commitments and permission of a reasonable level of intra-year fluctuation of its marketprices on a market-principle basis. As part of policy efforts to maintain a reasonable level of rice

Country Report : Korea
M - 9
stock for food security purpose, the MAF purchased rice of 928 thousand MT in 1998, which isdown from 1,224 thousand MT in 1997, in compliance with the annual AMS reductioncommitments under the UR Agreement on Agriculture.
The seasonal variation of market prices for rice has been on the increase since the Grain PolicyReform of 1993. Due to the bumper crops for the past two consecutive years, it was somewhatdifficult to permit the seasonal increases of its market prices in terms of price stabilization for theyear 1998. But the MAF adjusted the time when government-reserved rice stock was released to themarket and the volume of the rice stock released, thereby enabling market prices for rice to rise by13.4 % in the 1998 lean period compared to the 1997 harvest period and helping rice-growingfarmer's income to increase.
In an endeavor to raise the competitiveness of its producers, the Korea launched several initiativesin 2000 to improve the marketing of rice. As part of this program, the Government set up anInternet site, to improve information exchange. It also announced a plan for the construction by2004 of 360 rice processing centers, with drying, milling and storage facilities.
Table 8: Official rice purchases from local farmerYear 1996 1997 1998 1999 2000 2001*
Thousand MT 792 720 720 558 504 455Source: MAFF* Provisional
Considering that it is of overriding importance and urgency to improve agricultural marketingstructure in order to increase farmer’s income in a stable fashion, the MAF is implementingagricultural marketing reform schemes including the expansion of agricultural direct marketing andreform of existing transaction methods in wholesale markets.
However, meeting large quantity of rice leftover, the government is passing it in review to constitutepolicy for production control, transferring to another commodities and/ or reducing cultivating areathrough exemplification and system of Japanese farming concerning rice.
2.2 Expansion of direct marketing of agricultural products
The MAF encouraged producer’s organizations to create private markets where producers andconsumers can deal agricultural products directly, taking account of the continued criticisms thatboth of them have been suffering from their economic losses resulting from the existingcomplicated and costly agricultural marketing channel and structure. The MAF installed large-scale periodic farmer’s markets in 42 major urban cities of the country, set up 760 direct marketingstores within commercial banks, and established distribution complexes in Chang-Dong(Seoul) andCheong-Ju City.

Country Report : Korea
M - 10
And the MAF increased agricultural sales using vehicles in local provinces by setting a legal basisfor mobile sales of livestock products through amending the Enforcement Regulations of LivestockProducts Sanitation Act, encouraged urban consumers to establish sisterhood relationships with1,814 producing areas, and opened Agricultural Products Cyber-Market on the MAF Website.
The revenue from direct marketing of agricultural products starting from March 1998 amounted to3,100 billion won, which contributed substantially to agricultural marketing reforms. As aconsequence, consumer prices declined by 20 to 30 % and producer-received prices rose by 10 to20 % in large-scale farmer’s markets. These favorable market performances gave satisfaction toboth consumers and producers, encouraged retailers neighboring the farmer’s markets to reducetheir sale prices, and provided large-scale marketing companies with an incentive to increase theirpurchases of agricultural commodities directly from producing areas.
2.3 Open-up of distribution complexes of agricultural products in Chang-Dong(Seoul)and Cheong-Ju City
A distribution complex in Chang-Dong, Seoul was created in May 1998 to play a central role inwholesale and retail marketing of agricultural products in the northern parts of the Han River inSeoul, as well as to provide a marketplace where agricultural products can be sold directly toconsumers.
A distribution complex in Cheong-Ju City was also established in September 1998 to play a key rolein wholesale and retail marketing of agricultural products in Choong-Buk Province as well as tohave agricultural products sold directly to 600,000 consumers in Cheong-Ju City. In thosedistribution complexes, with transaction fees paid to wholesalers abolished, farmers selling theircommodities to the distribution complexes received higher prices, while consumers bought freshagricultural products at prices lower by 10 to 20 % than otherwise. These developments enhancedagricultural market performances.
2.4 Building of an electronic data interchange(EDI) network between producers andretailers
The NACF (National Agricultural Cooperative Federation), the largest producer’s organization inKorea, enhanced operational efficiency and reduced transaction costs by computerizing sales andmanagement of agricultural products through building an Electronic Data Interchange (EDI)Network between its two distribution complexes and a total of 140 Hanaro Clubs (membershipwarehouse discount stores) and Hanaro Marts(non-membership supermarkets). From August 1998,the MAF, in cooperation with NACF, built the EDI network between the distribution complexes andpacking centers in producing areas on a pilot basis and is pursuing the activation of agriculturalmarketing and a reduction in transaction costs in those areas.

Country Report : Korea
M - 11
2.5 Reduction of consignment fees by 1 % in wholesale markets
As a result of policy efforts made to alleviate the burden borne by producers in selling agriculturalproducts in public wholesale markets, the MAF achieved marketing cost savings by cutting downconsignment fees by 1 % in wholesale markets in Busan, Taegu, Incheon, and Kwangju cities aswell as in Garak-Dong Wholesale Market in Seoul.
In addition, the economic burden of producers decreased by 1.3 billion won in July 1998 andconsignment fees amounting to 16.6 billion won is expected to be saved on a yearly basis in Garak-Dong Wholesale Market alone.
2.6 Finalization of Agricultural Marketing Reform Program
(1) Introduction of marketing conventions and orders
With a view to ensuring an optimum level of production of perishable commodities includingvegetables and milk and to stabilizing their prices, the MAF introduced marketing conventions(under which farmers, consumers, private merchants and the government authorities are supposed toautonomously adjust production, marketing and consumption of those commodities in collaborationwith one another) and marketing orders (under which farmers are forced to discard the concernedcommodities in question in producing areas in times when their demand and supply are highlyunstable).
In addition, the MAF will make efforts to have 30 to 40 % of production of individual commoditiesmarketed after being packed and given their own brands in producing areas through the enlargementof vegetables/fruits packing centers, Rice Processing Complexes (RPCs) and Livestock PackingCenters (LPCs).
(2) Enabling autonomous commodity transaction methods in wholesale markets
The MAF will offer increased marketing opportunities to producers by permitting both an auctionsystem and a wholesale merchant system to be used in wholesale markets. And, the MAF willeliminate the existing costly marketing structure and corruption prevalent in wholesale marketsthrough the completion of scheduled construction of 34 public wholesale markets, introduction ofan electronic auction system and improvement of current unloading and transporting systems by2001.
Regarding the issue of ownership and administration of wholesale markets, the MAF will adopt apublic-owned and private-administered system. Under this system, local governments securebuilding sites for wholesale markets, central government provides financial assistance for them inconstructing wholesale markets, and the NACF (National Agricultural Cooperative Federation),NLCF (National Livestock Cooperative Federation), NFCF (National Forestry Cooperative

Country Report : Korea
M - 12
Federation) or specialized marketing companies take charge of the administration of wholesalemarkets.
(3) Establishment of various types of farmer’s markets and improvement of retailmarketingstructure
The MAF will establish various kinds of farmers markets suitable for location-specific conditionsincluding large-scale periodic market places in metropolitan areas. And the MAF will stronglyencourage meat sales in supermarkets, convenience stores and public restaurants and have milksupplied directly to marketing companies without intermediate broker’s involvement, therebystreamlining marketing structure and improving market performances at a retailing stage.
2.7 Substantial Expansion in Budget Allocation for Agricultural Marketing Programs
In accordance with President Kim’s strong will and directive to advance agricultural marketingstructure, the MAF increased markedly budget allocation for agricultural marketing programs forfiscal year 1999, under the guideline that allocation for agricultural marketing programs is to beraised to 30 % of total appropriation for agricultural and forestry programs by 2002, compared to6.5 % in fiscal year 1998.
2.8 Appointment of 798 government officials in charge of inspecting labels of origin ofimported agricultural products as judicial police officers
In order to further strengthen effectiveness of rules of origin already in place, which aims to preventdeceptive marketing including the instances that imported agricultural products are often disguisedas domestic products, the government appointed 798 government officials inspecting labels oforigin of imported agricultural products as judicial police officers.
3. Rice Trade
3.1 Situation of MA rice
According to Uruguay Round commitments, the government is removing confinement situation forimporting rice little by little into liberalization for agriculture sector. Import schedule of MMArice is shown below:

Country Report : Korea
M - 13
MA amountTariff rate, in-
quota
Ratio of totaldomestic
consumptionYear
(MT) (%) (%)
Annual rate ofincrease of the tariff
quota(%)
1995 51,307 5% 1.00% 0.25%1996 64,134 5% 1.25% 0.25%1997 76,961 5% 1.50% 0.25%1998 89,788 5% 1.75% 0.25%1999 102,614 5% 2.00% 0.25%2000 102,614 5% 2.00% 0.50%2001 128,267 5% 2.50% 0.50%2002 153,921 5% 3.00% 0.50%2003 179,575 5% 3.50% 0.50%2004 205,228 5% 4.00% 0.50%
Note : Base amount of the total domestic consumption is 5,130,700 MT (1995).
The special arrangement on MA rice will be re-negotiated in 2004.
3.2 Management of Import/Export
MMA Rice is imported under the government control. The typical condition of importing rice isstated as below:- Import rice in brown rice, using technical specification of USA- Tender in every August, and ship them between October and December- Import mainly from China, COFCO, liking of short grain in Korea
Custom dutyTariff for import: 5 %
3.3 Trade Policies
Korea's trade-related laws and regulations are based on the principles laid down in the EconomicClause of the Korean Constitution. Based on this, the Foreign Trade Act prescribes the generalprovisions and procedures for the external trading. Export-Import Notice and Consolidated PublicNotice system had also been implemented to administer special commodities according to theindividual laws for the purpose of protecting national security, human health, animal and plantsanitation, and the environment. However, since the inauguration of the Word Trade Organization in1995, Korea has virtually no restrictions and limitations on external trade, except for the productsauthorized by the WTO Agreements and provisions. Almost all products are free to be imported andexported in Korea.
Korea's trade policy has been aiming toward promoting export and contributing to world economicdevelopment. Korea’s trade policy can be characterized by the following objectives; (i) a balancedexpansion of external trade, based on free trade principles, (ii) internationalization of trade-related

Country Report : Korea
M - 14
regulations and institutions, and (iii) continued contribution to maintaining and strengthening themultilateral trading system. In conformity with these orientations, all commodities are traded freely,except for some products authorized by the UR Agreement on Agriculture. Therefore the importliberalization ratio in Korea, the number of items which can be freely imported, stood at 99 % bythe end of 1997.
Since Korea's entry into the GATT in 1967, Korea has implemented its trade policy on the basis ofinternational principle. Several trade-related laws and institutions have been revised in accordancewith international standard. The trade dependency ratio [(exports + imports)/GDP] of the Koreaneconomy grew from 21.9 % in 1962 to 80.3 % in 1990, and it is expected to continue in the future.Korea’s trade dependency is well represented by the fact that Korea’s successful economicdevelopment strategy is strongly supported by the trade volumes which put Korea on the fast tracktowards becoming a major trading country in the world. Total trading volume has increased rapidlyover the past years. In 1962, it was only US$ 477 million, but by 1994 it had reached US$ 198.6billion, making Korea the 11th largest trading country in the world. In 1997, total exports stood atUS$ 136.2 billion, up by 5 % from 1996, and total imports remained at US$ 144.6 billion, down by6.7 % from the previous year.
The volume of agricultural exports increased markedly from US$ 135 million in 1970 to 1,753million in 1997, an increase of about 13 times for the period 1970-1997. Korea has become theworld’s sixth largest agricultural importer, with agricultural imports amounting to almost US$ 10.1billion in 1997(Table 24). The expansion of agricultural import is expected to continue in the nearfuture and has important implications for the agricultural sector in Korea. There is no Bilateral/Multilateral agreement only for the rice.
3.4 Import Liberalization Market opening of the agricultural sector is very sensitive, both politically and economically,particularly in relation to agricultural products in Korea. Korea had been regarded as one of thecountries who had strongly protected its agricultural sector through strong government intervention,and restrictive trade measures including high tariff rate, quotas, and non-tariff barriers. Therefore,Korea had come under increased pressure from trading partners to open its agricultural markets.
Before the WTO system was launched, Korea had maintained import restrictions on majoragricultural products including rice, under its special individual laws. Korea therefore has facedstrong pressure to open its agricultural market. Since the early 1980s, Korea has pursued activetrade liberalization policies by reducing tariffs and relaxing other import regulations in theagricultural sector. In 1984 about 29 items were lifted, and 37 items in 1985, and 21 items in 1986,and 8 items in 1987, and 43 items in 1988, respectively. Nevertheless, pressure from the majortrading partners to open agricultural market has increased steadily.

Country Report : Korea
M - 15
Imports of commodities such as beef, pork, and chicken, had been restricted in Korea, for thepurpose of balance of payment reasons since its accession to the GATT in 1967. In compliance withthe GATT Article XVIII: B (GATT Article XVIII: B allows developing countries with poor balanceof payments position to restrict commodity imports), Korea had maintained its restriction onagricultural products such as beef, pork, chicken and oranges. However, due to the strong marketopening pressure especially from the U.S., Australia, Canada, and New Zealand, the beef marketwas opened in 1988 as a result of the bilateral trade negotiations. Its liberalization had beenaccelerated by the decision of the GATT panel in 1989, which stipulated disinvoke of GATT ArticleXVIII: B. Korea since then has progressively opened its agricultural markets in response to pressurefrom its major trading partners since the mid-1980s.
In April 1989, the Korean government announced a three-year (1989-1991) import liberalizationschedule for agricultural products. Under the plan, some 159 products were liberalized (according tothe 1992 HSK basis and excluding fishery products), 56 items in 1989, 59 items in 1990, and 44items in 1991. Following this plan, additional 69 items (23 items in 1992, 1993 and 1994) wereliberalized by the Import Liberalization Plan announced in 1992. In 1995, the governmentannounced additional 216 item liberalization plan between 1995 and 1997(based on the 1997 HSKdigit).
With the launch of the WTO in 1995, almost all-agricultural products had been liberalized, with theexception of some special crops including rice, as was authorized by the WTO Agreements. Theimport liberalization ratio for the agricultural products(the ratio of the number of commodities thatcould be freely imported compared with the number of all agricultural commodities) in 1997reached 98.3 %. The overall framework of Korea’s agricultural trade has been determined by theUR Agreement on Agriculture.
Before the WTO system was launched in 1995, a total of 1,178 agricultural products wereliberalized, on the basis of HS 10 digit, from the total number of 1,420 products, representing83.0 % of liberalization ration. The number of import-restricted items was 242 until the year 1994.Of them, 134 items were subject to the Consolidation Notice, which had strictly limited import ofcertain products by each law. The remaining 108 items had been subject to Import & Export Noticemainly restricting the import in order to prevent the current account deficit
4. Rice Reservation
4.1 Rice Reserve
The Ministry of Agriculture and Forestry is organization to control the reserved rice and riceleftover. There is no conclusive regulation for stock as the national rice reserve. The governmentshould stock rice in paddy except MMA rice, which is attained to stock 1,150,000 MT (8,000,000sok: 1 sok = 144kg) +288,000 MT based on milled rice.

Country Report : Korea
M - 16
Table 9: Balance sheet of Supply-Demand (Use/ Loss) (Unit : 1,000 MT)
Source: Ministry of Agriculture and Forestry
In 2001/ 2002, over 2 million MT of rice leftover is under control of MAF, Korean government.
4.2 Self-sufficiency
Given that global food production is increasingly unstable due to major weather anomalies, theMAF allowed a reasonable level of intra-year variation of market prices for rice on the basis ofmarket principles while implementing the rice purchase program in compliance with Korea's annualAMS reduction commitments under the UR Agreement on Agriculture as part of policy efforts tohave agriculture's foremost roles realized, that is, providing a sufficient amount of staple food forthe people in a stable manner and at affordable prices. Since 1997, Korea could keep self-sufficiency for rice.
In addition, the MAF further strengthened farmland preservation measures to this end.
(1) Maintenance and expansion of farmland area under rice cultivation
In recent years, the MAFF has been making positive efforts in conformity with the policy principlethat fertile farmland should be preserved to the maximum extent possible for agricultural use,regardless of whether or not farmland in question belongs to Agricultural Promotion Zone. As aresult of the policy efforts, it was estimated that farmland area converted into non-agricultural usedecreased by 39 % from 4,902 ha in the first half of 1997 to 2,983 ha in the same period of 1998,except public utility area including road.
Although part of existing farmland area under rice cultivation was withdrawn from AgriculturalPromotion Zone, farmland area under the Zone expanded by 400 ha in 1998 from the end of 1997,
Supply Use
Produc-tion Import Food
Waste/feed/seed/
processing/others
b c d e = c+d f g h = f + g i j = b+e-h-i k = e-l-m1990 1,572 5,898 5,898 5,127 317 5,444 1 2,025 4531991 2,141 5,606 5,606 5,032 446 5,478 12 2,257 1161992 2,141 5,384 5,384 4,930 594 5,524 2 1,999 -1421993 1,999 5,331 5,331 4,855 654 5,509 1 1,820 -1791994 1,820 4,750 4,750 4,814 599 5,413 1 1,156 -6641995 1,156 5,060 5,060 4,777 630 5,407 150 659 -4971996 659 4,695 115 4,810 4,778 447 5,225 244 -4151997 244 5,323 5,323 4,710 360 5,070 497 2531998 497 5,450 75 5,525 4,606 610 5,216 806 3091999 806 5,097 97 5,194 4,541 737 5,278 722 -842000 722 5,263 107 5,370 4,425 689 5,114 978 2562001 978
Export End StockAnnualbalanceTotal use
Year Beginningstock
Totalsupply
Country Report : Korea
M - 17
owing to the MAFF's active operation of an alternative system of putting other eligible farmlandunder the Zone.
Meanwhile, strict control over illegal conversion of farmland to other use was enforced at theprovince and city levels in mid 1998. Furthermore, the MAFF took active measures to enhancefarmland use, including placing the land-owners under an farmland disposal obligation, who havenot cultivated their farmland after buying it for cultivation purpose.
(2) Improvement of production base for rice
Under the medium-term objective that the projects of rearranging paddy land area of 800,000 ha areto be completed by 2004, the MAFF, in cooperation with related government agencies, finished therearrangement of paddy land covering 20,000 ha by Spring 1998. In addition, the MAFF and relatedagencies are also focusing on water resources development projects, which is essential for paddyfarming.
(3) Increased provision of high-yielding quality rice varieties
The 46 new high-yielding quality rice varieties were developed and being experimented in variousparts of the country in 1998. With 34,990 MT of seeds of those varieties provided, a share of paddyland planted to those varieties in total paddy land area was increased from 57 % in 1997 to 66 % in1998.
(4) Innovation of rice production, processing and marketing with focus on Rice ProcessingComplexes(RPCs)
In order to increase a proportion of rice harvests processed and marketed by RPC's in total riceharvests from 21 % in 1997 to 24 % in 1998, additional 48 RPCs and 81 rice drying-and-storagefacilities are under construction.
The MAF is encouraging rice farmers and existing RPCs to expand paddy land area under farmingcontracts between the two parties from 91,000 ha in 1997 to 120,000 ha in 1998, thereby ensuringthat rice production costs are reduced through corporate selection of rice varieties and cooperativefarming among farmers. Moreover, the MAF is also making policy efforts to improve rice qualityand to have eligible farmers paid for their quality rice at the corresponding price by encouragingsales of rice with its own brand.
(5) Provision of nation-wide agricultural machinery repair services
In order to help resolve the difficulties that farmers often face in repairing agricultural machinery,the MAF established a basic plan for post management of agricultural machinery. According to

Country Report : Korea
M - 18
the basic plan, the MAF organized 52 service teams and had them provide repair services in 149cities and counties of the country.
(6) Establishment of rice marketing structure
Establishment of rice marketing structure to meet changing consumer taste and preference andpromotion of private sector's roles in rice marketing. The MAFF is promoting cost savings andquality improvement in rice production by encouraging corporate selection of rice varieties andcooperative farming among farmers and increased marketing of rice with its own brand, based onincreased vertical integration between rice farmers and RPCs. The MAFF is also moving towardsenabling RPC¨s role to increase in purchasing rice in the harvest period through the increasedprovision of financial assistance for its operation.
5. Rice Demand/ Consumption
5.1 Demand
Over the past decades, agricultural policy orientation has been aimed at maintaining a high degreeof self-sufficiency. Korea has become almost self-sufficient in major staple food crops such as rice.However, due to increased demand for other food such as beef and processed food, Korea hasimported large quantities of agricultural products.
There is growing demand from both domestic consumers and policymakers, and the major tradingpartners for changes in Korea’s agricultural policy. The Korean government is moving toward newdirections for agricultural policy, faced with the difficulties of adjusting to market opening, a rapiddecrease in and aging of the agricultural labor force, frequent natural disaster and price fluctuation.A series of agricultural policy reform is aimed at preparing the sector to compete in world marketsand to proceed to a more advanced sector. This and other changes mean that the Korean agriculturesector is in transition and it is becoming more market-oriented, although the pace is gradual.
5.2 Consumption Pattern
The Korean diet has centered predominantly on rice, a main dish. Thus, Korean typical diet tends tohave a much higher level of carbohydrate and a lower level of fats than a western diet. Other foodgrains have been added as a complementary to rice.
An average meal provided dietary energy of 2,957 Kcal/day in 1996. Although rice is mostpreferred, most households during the 1960s to mid-1970s had to rely much more on other foodgrains in order to meet an adequate level of dietary energy, because their prices were much lowerthan rice price. This dietary pattern has changed substantially from late 1970s onwards. As percapita income increased, Koreans began to prefer meat, vegetables and fruits.

Country Report : Korea
M - 19
However, rice still remains a staple food item. Between 1980 and 1990, daily calorie intake inKorea increased by about 15 % and meat consumption increased by 76 %. Underlying thesechanges in Korean dietary pattern were sizable declines in consumption of rice, barley, potatoes andother carbohydrate grains. Per capita calorie intake from rice fell from 1,234 Kcal/day in 1980 downto 1,028 Kcal/day in 1996, while per capita calorie intake from other food, such as meat, milk andfruits, increased on a daily basis for the corresponding period.
5.3 Status of Rice
Notwithstanding this dietary diversification, Korean people still have carbohydrates more than fat.Most of the calorie intake has traditionally come from cereals, with rice accounting for about 35 %,though non-carbohydrate source of calorie supply has gradually increased. In 1996, out of per capitacalorie intake of 2,957 Kcal/day, some 65 % or 1,929 Kcal/day was provided by cereals(almostexclusively rice, 1,028 Kcal/day), 6.6 %(197 Kcal/day) by meat, and 3.9 %(117 Kcal/day) byvegetables. The increase in intake of animal protein and fats has been noticeable since the 1980s.Per capita calorie intake from livestock products has continued to increase from 49 Kcal/day in1970 to 91 Kcal/day in 1980 and to 197 Kcal/day in 1996.
In recent years, Korean consumers spent about 28 % of their income on food. Since the 1980s,Korean dietary pattern has changed significantly in terms of both volume and quality. As incomehas grown, food consumption has shifted from a carbohydrate-centered pattern based on rice to adiversified one relying more on livestock products, fats, vegetables and fruits.
Per capita foodgrain consumption has been decreasing over the last decades. In 1970, per capitagrain consumption was 219.4 kg, and decreased to 167.0 kg in 1990, and 157.8 kg in 1997(Table11). Per capita rice consumption also seems to have been on the decline, peaking at 136.4 kg in1970 and declining thereafter. In 1997, per capita rice consumption stood at 102.4kg. This reflectslargely higher income and changes in dietary pattern. Per capita consumption of barley was alsoreduced from 13.9 kg in 1980 to 1.6 kg in 1990, while it increased to 1.5 kg in 1997. In contrast, percapita wheat consumption has increased continuously from 26.1 kg in 1970 to 33.7 kg in 1997, andis expected to continue to grow with the westernization of the Korean diet.
Meat consumption in Korea has risen sharply as a result of higher income and the increase indemand for meat. Per capita meat consumption was 29.3 kg in 1997, which was far over twice asmuch as that in 1980. Beef consumption in Korea increased almost six-fold over the past decades.Per capita beef consumption increased rapidly, from 1.2 kg in 1970 to 7.9 kg in 1997. Demand forbeef is expected to increase in the future with increased per capita income. Consumption of porkand chicken is also expected to increase to some extent.
An increase in meat consumption requires a considerable amount of meat imports, especially beef.In addition, the consumption of high-value products such as processed fruits and vegetables,

Country Report : Korea
M - 20
prepared food and confectionery goods, has increased rapidly as Korean consumers became moreaffluent, and it is also expected to continue steadily in the future.
6. Aid
The government proceeded with food aid of rice to North Korea only as stated below:
Year Quantity and locality of rice Program1995 150,000 MT of rice of Korean origin Grant2001 300,000 MT to be shipped with Thai origin rice directly to North Korea Loan
Establishment of a policy framework for expanding agricultural cooperation with North Korea withemphasis on fundamental rehabilitation of North Korea’s agricultural productivity.
The MAF installed a Research Center of North Korea’s Agriculture within Korea Rural EconomicInstitute in May 1998, and the Center began to carry out studies on future agricultural policies inpreparation for reunification. The Center’s specific research subjects include agricultural productionsystem, land system, marketing policy, the state of deforestation and wildlife resources in North Korea.And since July in 1998, the MAF has been operating a Consultation Committee on AgriculturalCooperation with North Korea, which are composed of the governmental authorities and non-governmental agricultural agencies and research institutes. The Committee has functions of providingthe government authorities with policy advice and assistance regarding agricultural cooperationprograms with North Korea at both non-governmental and governmental levels.
The Korean government is positively considering its assistance with agricultural inputs, contractfarming, cooperative development and investment projects in agricultural sector, depending ondevelopments of political and economic relationships with North Korea.
The Korean government is considering increased assistance with agricultural technologies and farminputs including seeds, fertilizers and pesticides, in order to help improve agricultural productivity ofNorth Korea. At the same time, the Korean government is closely examining possibilities of cropseeds exchange and contract farming with North Korea, and various measures to rehabilitateagricultural infrastructures and degraded forests in North Korea are being under consideration.Furthermore, the Korean government is assisting private and civil organizations in their agriculturalcooperation with North Korea, including the establishment of Dure Village within special districts ofNajin and Sunbong and the International Maize Foundation¨s research on maize cultivation in NorthKorea.

Country Report : Korea
M - 21
7. Food Security
Since its founding in 1945, FAO has made a significant contribution to tackling worldwide hunger andmalnutrition. FAO’s dedication to ensuring Food Security for All was particularly highlighted at the1996 World Food Summit.
Food security is a global issue to which all of us should give due attention. Since each country is facedwith different socio-economic conditions, however, a basic approach to food security concerns andpolicies adopted to attain food security are varied among countries. In this context, it is spelt out in theWorld Food Summit Plan of Action that each nation must adopt a strategy consistent with its resourcesand capacities to achieve its individual goals. In addition, possible differences between nationalstrategies for ensuring food security are embraced in the notion of "multi-faceted character of foodsecurity" as recognized at the 1996 World Food Summit organized by FAO.
The meaning of multi-faceted character of food security needs to be grasped at the national and globallevels. First, at the national level, the notion implies that each country's own strategy for food security,if it is adopted as the most effective way to secure national food security based on its socio-economicsituations and natural endowments, should be respected. Second, at the global level, it means thatconcerted international actions and cooperation in mutual recognition are necessary. The concertedinternational actions can be only taken when they are balanced with and combined with each country'sindividual actions. Individual actions are based on respecting each country's choices, taking intoaccount various factors such as domestic production, stable imports and stockpiles.
In a longer-term food security context, prospects of world grain markets need to be given specialconsideration. The world grain market in the mid-1990s is characterized by the lowest level of globalstock to utilization ratio, high grain prices, and the consumption level exceeding world production forseveral years. It sharply contrasts with the 1980s, when the international community saw excesssupply, increasing stocks and falling grain prices. According to medium and long-term outlook by theinternational organizations including FAO and OECD, these characteristics are indicating that we areentering a new era of structural tight food supplies, not going though a temporary change in worldgrain markets.
FAO forecasts that a growth in world food production will decelerate to the year 2010 while worldfood consumption, especially in developing countries, will grow faster compared to the past twodecades. Furthermore, OECD recently predicts that world grain prices will continue to trend upwardsand global grain stocks will remain low with an average stock-to-utilization ratio being 16 %, wellbelow the FAO's minimum safe level to safeguard world food security. In addition, with a reduction ingrain stocks as a buffer against supply shocks, price instability in world grain market reportedly mayincrease over the next five years.
Under the relatively pessimistic prospects, it is of importance to note that there still persists short-termsupply disturbing factors beyond human's control. As a matter of fact, it is of great concern that the

Country Report : Korea
M - 22
resurgence of El Nino and La Nina phenomena in recent years adds major elements of uncertaintiesand risks to the future of world food situation. Concerns are also growing that these weather anomaliesmay become more frequent and severe in the future as the trend of global warming is becomingincreasingly apparent, which is evidenced by the earth temperature topping its list in 1997.
Moreover, world grain markets display a supply-oligopolistic character that global grain supplies relyheavily on a few major exporting countries. Under the projected low global grain stocks and volatilegrain prices, the Korean government is of the view that weather-induced sizable production shortfallsin major exporting countries could lead to a serious deterioration in food supply situation of most netfood importing countries.
That is why the Korean government places particular emphasis on a preventive strategy for foodsecurity. In pursuing the preventive strategy for food security, relying on food imports or foodstockpiling alone as well as a combination of the two is not sufficient. As mentioned above, foodimport can be a short-term measure to relieve food insecurity, but is not among the longer-termreliable and stable sources of ensuring national food security because of the variable nature of foodsupplies, mainly from major exporting countries. This is especially the case with the time when tradevolume of certain grains in question is very small, their supply is unstable and foodstuff could be usedas an instrument for political and economic pressure.
Furthermore, as stressed by Jonasson (1989), food storage might considerably contribute to addressinga short-term crisis, but a longer-term crisis implies that resources for production, persons with farmingskill and expertise, and machine and equipment should be at hand. However, it is of importance to notethat it takes considerable time and cost for damaged or reserved production base to be reactivated.
Therefore, the Korean government believes that a foremost element in the preventive strategy for foodsecurity is to increase domestic food production through the effective utilization of existing resourcesin a sustainable manner and maintain an optimum level of self-sufficiency in staple food. We believethat the aforementioned two elements are all complementary to this element.
Closely related to ensuring national food security through effective and sustainable utilization ofexisting production resources for staple food is the promotion of multi-functionality of agriculture, theimportance of which was duly recognized at the 1996 World Food Summit and OECD AgriculturalMinister's meeting in March 1998.
With its positive externalities, Korean agriculture based predominantly on paddy fields planted to riceplays various beneficial roles including the maintenance of socio-economic viability in ruralcommunities, preservation of biological diversity and flood control. Regarding these roles, it is worthnoting again that it is hardly possible to rehabilitate production resources, especially agricultural land,if they are damaged or disrupted by natural disasters or other economic factors.
Country Report : Korea
M - 23
In this connection, it should be reminded that in those countries where industrialization andurbanization are increasingly proceeding, there have been observable diversions of agricultural land toother uses over the last decades and an increasing number of farmer's land abandonment in favor ofother profit opportunities. In this view, for those positive functions to be fully utilized, it is essential tomaintain an optimum level of production base for staple food. Hence, the Korean government isfirmly convinced that the promotion of multi-functionality of agriculture is closely interrelated withensuring national food security and they are mutually supportive.
8. Issues
(1) An Open Agricultural Policy-making System based on equitable participation of farmers,consumers and the government
On March 4th 1998, right after the formation of the People's Government, the MAF held an open-ended forum for agricultural policy development, which was attended by farmers, consumers andrepresentatives of professors and scholars. The forum was promoted to be a consultative meetingto provide policy advice on major policy issues.
The MAF formulated the overall framework and direction of agricultural policies of the People'sGovernment and established the reform schemes of agricultural marketing and agriculturalcooperatives, by setting up a Agricultural Policy Reform Committee, a Cooperative ReformCommittee, and a Agricultural Marketing Reform Committee. The Agricultural Policy ReformCommittee was formed on March 26th 1998 and prepared the proposed Agriculture and RuralDevelopment Plan by holding 5 sessions of its general meetings and 7 sessions of working groupmeetings. The Cooperative Reform Committee was organized on April 13th 1998 and prepared theReform Scheme of Agricultural Cooperatives by holding 7 sessions of its general meetings. TheAgricultural Marketing Reform Committee was set up on March 19th 1998 and established theAgricultural Marketing Reform Scheme by holding 4 sessions of its general meetings and 3 sessionsof public hearings on the marketing reform.
The Advisory Committee on Evaluation of Agricultural Policy has been operational in order to drawa consensus of all stakeholders related to agriculture on the need for agricultural policy reform andto evaluate the progress in implementing agricultural policy reform. The Committee held its firstsession of general meeting on October 9th 1998. The Committee evaluate the progress made incarrying out the reform on a weekly basis, with its main evaluation areas divided into two thematicissues, a institutional reform and increased efficiencies of policy programs in agricultural andforestry sectors.

Country Report : Korea
M - 24
(2) Towards agricultural policy implementation of practical service to farmers
A "Minister's Mobile Office" has been operational since his inauguration, through which theMinister finds out and resolves various problems facing farmers by visiting himself rural areas. Asof February 28 1999, the Minister's Mobile Office has been put into practice 73 times in total andthere have been 540 problems identified for resolution.
The Minister has been making his humble efforts to inviting farmers to be a "Daily HonoraryMinister" on a twice-a-month basis, with a view to sharing the difficulties facing agricultural policy-makers with them.
(3) Employment of a private expert as Rural Women Policy Officer by an open recruitment systemand establishment of the post of Advisor to the Minister
The MAF newly installed Rural Women's Policy Division and employed a private expert in thatfield as Officer to be in charge thereof by an open recruitment system in June 1998, in order toencourage female farmers in engaging in farming activities and strengthen policy supports for them.The Medium to Long-term Basic Plan for Female Farmers was established in August 1998, whichincludes a strengthened institutional framework for fostering female farmers, policy measures insupport of toward fostering professional female farmers, and schemes of enhancing the quality oftheir lives.
(4) Korean Female Farmer's Conference was held in October 1998 to provide a momentum forreestablishing the roles of female farmers in the future.
Representatives of farmer's organizations and scholars were appointed as Advisers to the Minister,so that various opinions and proposals of stakeholders related to agricultural sector can be reflectedin agricultural policy-makings in a prompt and effective manner.
(5) Modification of existing agricultural and forestry technology development system into a user-friendly one and establishment of "Korean Agricultural Science and Technology Award"
The Medium to Long-term Basic Plan for Agricultural Science and Technology was drawn up inorder to systemically develop agricultural technologies and to speed up the process of putting themto practical use, and 169 sectoral tasks were identified through the procedure of collecting publicopinions, including holding of regional public hearings. The MAF increased its support forparticipatory-based technology development research projects and is attempting to have thescientific research projects focus on addressing the actual problems facing farmers. Consideringan increasing financial need by agro-related small-sized technology development enterprises, theMAF introduced a scheme of "Support for Technology Development of Small Venture CapitalEnterprises" in order to encourage them to develop cutting-edge and energy-saving agriculturaltechnologies. The first ceremony of presenting "Korean Agricultural Science and Technology

Country Report : Korea
M - 25
Award" took place in July 1998, the aim of which is to promote the development of outstandingagricultural technologies
(6) Enhancement of public understanding and credibility of agricultural policies
The adoption of a participatory-based "Open Agricultural Policy-Making System" served as animportant opportunity to draw a consensus on major agricultural policy measures at issues amongfarmers, consumers, and other stakeholders and to go ahead with the policy measures on the basis ofthe consensus. The MAF is planning to strengthen the existing procedure of collecting publicopinions, including public hearings and prior notices of proposed legislation, so as to furtherpromote the "Open Agricultural Policy-Making System".
(7) Carrying-out of a campaign for restarting agriculture and rural communities
In line with the Second Nation-Building Campaign, the MAF is conducting a "Campaign forRestarting Agriculture and Rural Communities" in agricultural sector in close cooperation andcollaboration with farmers and consumers. The Campaign includes, among others, theconservation of green fields in support of environment-friendly farming, promotion of solidaritybetween urban and rural areas and quality improvement of agricultural commodities

Country Report : Korea
M - 26
Annexes
1. Korea at a glance & Social Indicators (World Bank Data)
2. Promotion of policy measures to stabilize farm operations
3. Propulsion of Technology Development Program for Agriculture and Forestry
4. Presidential Decree on Preferential Tariff for Least-Developed Countries
5. Results of MMA rice imports (brown rice), 1995 – 2001
6. Detail results of MMA rice tenders in 2000 and 2001

Korea, Rep. at a glance 10/9/01
East Upper-POVERTY and SOCIAL Asia & middle-
Korea Pacific income2000Population, mid-year (millions) 47.3 1,853 647GNI per capita (Atlas method, US$) 8,910 1,060 4,620GNI (Atlas method, US$ billions) 421.1 1,964 2,986
Average annual growth, 1994-00
Population (%) 1.0 1.1 1.3Labor force (%) 1.9 1.4 2.0
Most recent estimate (latest year available, 1994-00)
Poverty (% of population below national poverty line) .. .. ..Urban population (% of total population) 82 35 76Life expectancy at birth (years) 73 69 69Infant mortality (per 1,000 live births) 8 35 28Child malnutrition (% of children under 5) .. 13 ..Access to an improved water source (% of population) 92 75 87Illiteracy (% of population age 15+) 2 14 10Gross primary enrollment (% of school-age population) 94 119 107
Male 94 121 106Female 95 121 105
KEY ECONOMIC RATIOS and LONG-TERM TRENDS
1980 1990 1999 2000
GDP (US$ billions) 62.3 252.5 406.0 457.2
Gross domestic investment/GDP 31.9 37.7 26.7 28.7Exports of goods and services/GDP 32.7 29.1 42.3 45.0Gross domestic savings/GDP 24.1 36.5 33.5 31.4Gross national savings/GDP 24.1 37.0 32.7 31.1
Current account balance/GDP -8.5 -0.8 6.0 2.4Interest payments/GDP 2.6 0.7 1.1 0.9Total debt/GDP 47.4 13.8 32.1 29.4Total debt service/exports 19.9 10.6 26.5 23.0Present value of debt/GDP .. .. 30.6 ..Present value of debt/exports .. .. 76.6 ..
1980-90 1990-00 1999 2000 2000-04(average annual growth)GDP 8.9 5.7 10.9 8.8 4.6GDP per capita 7.7 4.7 9.9 7.8 3.4Exports of goods and services 12.0 16.0 15.8 21.6 7.0
STRUCTURE of the ECONOMY1980 1990 1999 2000
(% of GDP)Agriculture 14.8 8.5 5.1 4.6Industry 39.9 43.1 42.5 42.7
Manufacturing 28.2 28.8 30.7 31.5Services 45.3 48.4 52.4 52.7
Private consumption 64.2 53.0 56.1 58.3General government consumption 11.7 10.5 10.4 10.2Imports of goods and services 40.6 30.3 35.5 42.2
1980-90 1990-00 1999 2000(average annual growth)Agriculture 3.0 2.0 5.4 0.1Industry 11.4 6.3 12.8 11.3
Manufacturing 12.1 7.5 21.0 15.4Services 8.4 5.7 9.9 7.6
Private consumption 7.9 4.8 10.2 6.1General government consumption 5.2 3.0 1.3 1.3Gross domestic investment 12.0 1.4 29.5 8.0Imports of goods and services 11.2 10.0 28.8 20.0
Note: 2000 data are preliminary estimates.
* The diamonds show four key indicators in the country (in bold) compared with its income-group average. If data are missing, the diamond willbe incomplete.
-60
-40
-20
0
20
40
95 96 97 98 99 00
GDI GDP
Growth of investment and GDP (%)
Korea, Rep.
Upper-middle-income group
Development diamond*
Life expectancy
Access to improved water source
GNIpercapita
Grossprimary
enrollment
-40
-20
0
20
40
95 96 97 98 99 00
Exports Imports
Growth of exports and imports (%)
Korea, Rep.
Upper-middle-income group
Economic ratios*
Trade
Domesticsavings
Investment
Indebtedness
Kondo
M-27
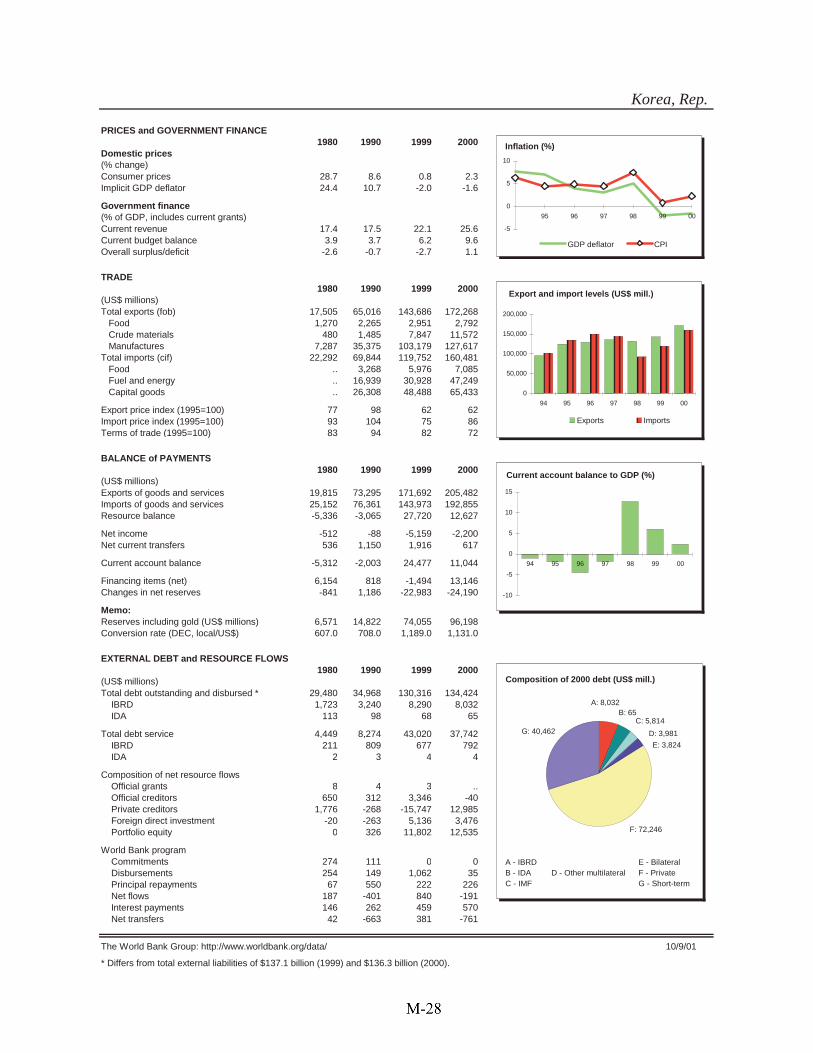
Korea, Rep.
PRICES and GOVERNMENT FINANCE1980 1990 1999 2000
Domestic prices(% change)Consumer prices 28.7 8.6 0.8 2.3Implicit GDP deflator 24.4 10.7 -2.0 -1.6
Government finance(% of GDP, includes current grants)Current revenue 17.4 17.5 22.1 25.6Current budget balance 3.9 3.7 6.2 9.6Overall surplus/deficit -2.6 -0.7 -2.7 1.1
TRADE1980 1990 1999 2000
(US$ millions)Total exports (fob) 17,505 65,016 143,686 172,268
Food 1,270 2,265 2,951 2,792Crude materials 480 1,485 7,847 11,572Manufactures 7,287 35,375 103,179 127,617
Total imports (cif) 22,292 69,844 119,752 160,481Food .. 3,268 5,976 7,085Fuel and energy .. 16,939 30,928 47,249Capital goods .. 26,308 48,488 65,433
Export price index (1995=100) 77 98 62 62Import price index (1995=100) 93 104 75 86Terms of trade (1995=100) 83 94 82 72
BALANCE of PAYMENTS1980 1990 1999 2000
(US$ millions)Exports of goods and services 19,815 73,295 171,692 205,482Imports of goods and services 25,152 76,361 143,973 192,855Resource balance -5,336 -3,065 27,720 12,627
Net income -512 -88 -5,159 -2,200Net current transfers 536 1,150 1,916 617
Current account balance -5,312 -2,003 24,477 11,044
Financing items (net) 6,154 818 -1,494 13,146Changes in net reserves -841 1,186 -22,983 -24,190
Memo:Reserves including gold (US$ millions) 6,571 14,822 74,055 96,198Conversion rate (DEC, local/US$) 607.0 708.0 1,189.0 1,131.0
EXTERNAL DEBT and RESOURCE FLOWS1980 1990 1999 2000
(US$ millions)Total debt outstanding and disbursed * 29,480 34,968 130,316 134,424
IBRD 1,723 3,240 8,290 8,032IDA 113 98 68 65
Total debt service 4,449 8,274 43,020 37,742IBRD 211 809 677 792IDA 2 3 4 4
Composition of net resource flowsOfficial grants 8 4 3 ..Official creditors 650 312 3,346 -40Private creditors 1,776 -268 -15,747 12,985Foreign direct investment -20 -263 5,136 3,476Portfolio equity 0 326 11,802 12,535
World Bank programCommitments 274 111 0 0Disbursements 254 149 1,062 35Principal repayments 67 550 222 226Net flows 187 -401 840 -191Interest payments 146 262 459 570Net transfers 42 -663 381 -761
The World Bank Group: http://www.worldbank.org/data/ 10/9/01
* Differs from total external liabilities of $137.1 billion (1999) and $136.3 billion (2000).
-10
-5
0
5
10
15
94 95 96 97 98 99 00
Current account balance to GDP (%)
0
50,000
100,000
150,000
200,000
94 95 96 97 98 99 00
Exports Imports
Export and import levels (US$ mill.)
-5
0
5
10
95 96 97 98 99 00
GDP deflator CPI
Inflation (%)
G: 40,462
A: 8,032
D: 3,981
C: 5,814B: 65
F: 72,246
E: 3,824
Composition of 2000 debt (US$ mill.)
A - IBRDB - IDAC - IMF
D - Other multilateralE - BilateralF - PrivateG - Short-term
Kondo
M-28
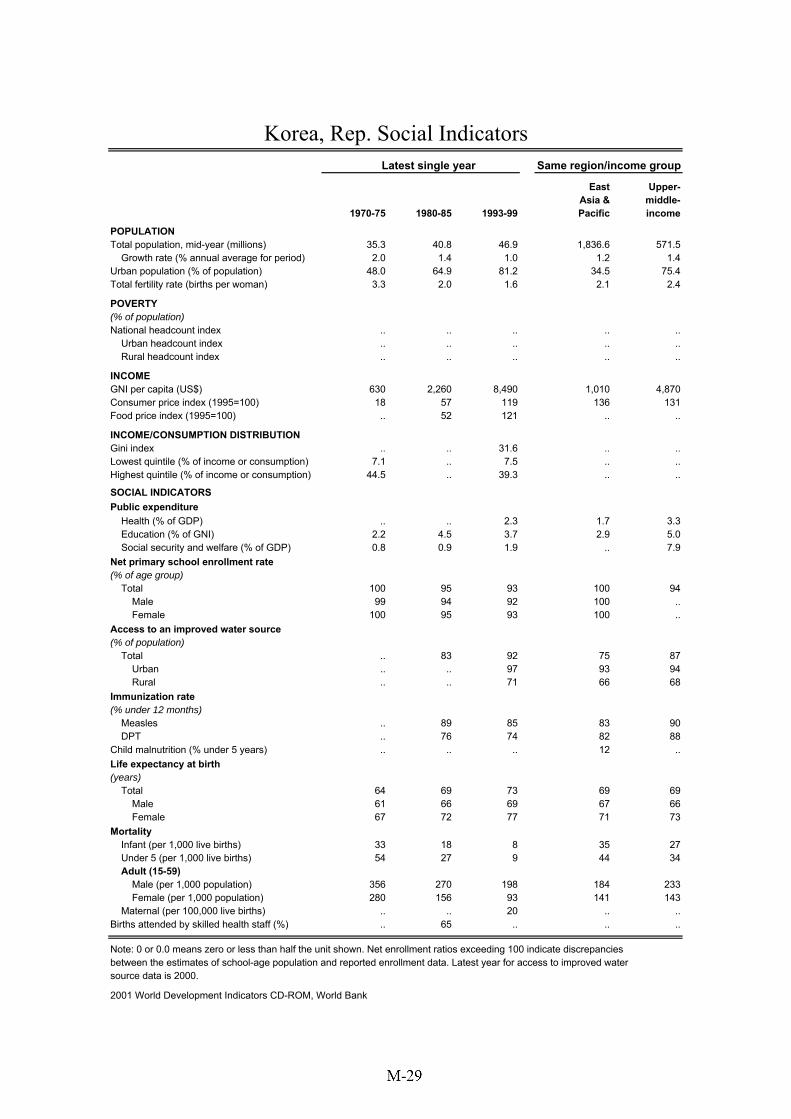
Korea, Rep. Social IndicatorsLatest single year Same region/income group
East Upper-
Asia & middle-1970-75 1980-85 1993-99 Pacific income
POPULATION Total population, mid-year (millions) 35.3 40.8 46.9 1,836.6 571.5 Growth rate (% annual average for period) 2.0 1.4 1.0 1.2 1.4Urban population (% of population) 48.0 64.9 81.2 34.5 75.4Total fertility rate (births per woman) 3.3 2.0 1.6 2.1 2.4
POVERTY(% of population)National headcount index .. .. .. .. .. Urban headcount index .. .. .. .. .. Rural headcount index .. .. .. .. ..
INCOMEGNI per capita (US$) 630 2,260 8,490 1,010 4,870Consumer price index (1995=100) 18 57 119 136 131Food price index (1995=100) .. 52 121 .. ..
INCOME/CONSUMPTION DISTRIBUTIONGini index .. .. 31.6 .. ..Lowest quintile (% of income or consumption) 7.1 .. 7.5 .. ..Highest quintile (% of income or consumption) 44.5 .. 39.3 .. ..
SOCIAL INDICATORSPublic expenditure Health (% of GDP) .. .. 2.3 1.7 3.3 Education (% of GNI) 2.2 4.5 3.7 2.9 5.0 Social security and welfare (% of GDP) 0.8 0.9 1.9 .. 7.9Net primary school enrollment rate(% of age group) Total 100 95 93 100 94 Male 99 94 92 100 .. Female 100 95 93 100 ..Access to an improved water source(% of population) Total .. 83 92 75 87 Urban .. .. 97 93 94 Rural .. .. 71 66 68Immunization rate(% under 12 months) Measles .. 89 85 83 90 DPT .. 76 74 82 88Child malnutrition (% under 5 years) .. .. .. 12 ..Life expectancy at birth(years) Total 64 69 73 69 69 Male 61 66 69 67 66 Female 67 72 77 71 73Mortality Infant (per 1,000 live births) 33 18 8 35 27 Under 5 (per 1,000 live births) 54 27 9 44 34 Adult (15-59) Male (per 1,000 population) 356 270 198 184 233 Female (per 1,000 population) 280 156 93 141 143 Maternal (per 100,000 live births) .. .. 20 .. ..Births attended by skilled health staff (%) .. 65 .. .. ..
Note: 0 or 0.0 means zero or less than half the unit shown. Net enrollment ratios exceeding 100 indicate discrepanciesbetween the estimates of school-age population and reported enrollment data. Latest year for access to improved watersource data is 2000.
2001 World Development Indicators CD-ROM, World Bank
Kondo
M-29

Country Report : Korea
M - 30
Annex 2 Promotion of policy measures to stabilize farm operations
The MAF took diverse policy measures to help farmers to cope with serious operational difficultiescaused by the soaring operation costs arising not only from an surging exchange rate but also from amarked decrease in consumption of agricultural products, which were all affected by the economiccrisis.
A. Alleviation of farmer's financial burden and provision of further assistance with farmoperation costs
(1) Control of an increase in interest rates of loans under longer-term policy program funds within1.5 % and freezing of interest rates of loans provided to farmers under various short-term programfunds
In early 1998, the MAF was in a difficult situation that it had to raise by 3.5 % interest rates of loansprovided under longer-term policy program funds due to an increase in interest rates of financingthe Special Account for Rural Restructuring and the Fund for Agriculture and Livestock Farming.Fortunately, however, the MAF could minimize an increase in the interest rates of the loans underthe longer-term policy program funds by offsetting the expected increase in their interest rates by2 % owing to 179 billion won appropriated from the Revised Supplementary Budget for fiscal year1998.For fiscal year 1998, the MAF froze the interest rates of a number of loans at those rates applied forfiscal year 1997, which were granted under the Livestock Industry Development Fund, Agro-Fisheries Products Price Stabilization Fund, Farmland Management Fund and Ginseng Fund.
(2) Deferment of repayments of the loans under the MAF's longer-term policy program funds and theNACF and NLCF's Mutual Credit Funds
The MAF contributed to relieving the financial burden of horticultural farmers and livestockbreeders facing severe economic hardship by extending the repayment period for 3-9 more monthsof the longer-term policy program loans granted to them.
Regarding the loans which were provided to them under the NACF and NLCF's Mutual CreditFunds and were due at the end of 1998, the MAF recommended the NACF and NLCF to defer therepayment period for 6-12 more months if farmers in question paid the loan interests incurred.
B. Fostering competitive farm operating units to take a leading role in farm innovation
(1) Establishment of a system of fostering professional farm operating units
The MAF has a plan to enhance competitiveness of full-time farmers with growth potentials andenthusiasm by promoting their agricultural specialization and farm-scale enlargement. Under the

Country Report : Korea
M - 31
plan, the MAF will foster 150,000 full-time farmers by 2004 - 100,000 full-time farmers in riceindustry, 20,000 in livestock industry and 30,000 in horticulture.
Meanwhile, the MAF is encouraging small and medium-sized farms to cooperate in agriculturalproduction and marketing. Basically, the MAF is assisting small and medium-sized farms to focuson organic farming suitable for small family farms. As for rice farmers, the MAF is recommendingthem to increase contract farming with the neighboring Rice Processing Complexes(RPCs) and tostrengthen cooperation among the farmers in paddy rice production. As far as livestock farmers areconcerned, the MAF is also encouraging the farmers to make marketing contracts with LivestockPacking Complexes(LPCs) in order to enhance marketing efficiency of livestock products.
(2) Systematic support for farm innovation
The MAF is drawing up a framework for diagnosis of farm operation, including development anddistribution of standard diagnosis format for individual commodity, so that farmers themselves canidentify and improve their own production skills and practices. For instance, the MAF is planning todevelop and provide standard diagnosis formats for 30 commodities including Hanwoo, pig, riceand apple by the end of 1998.
The MAF will take measures to further encourage and support consultations on farm operation byagricultural technology centers, agricultural colleges, producers organizations and privatecompanies. In 1999, the MAF is planning to subsidize part of the consultation costs to be paid byfull-time farmers and professional corporate farms.
(3) Promotion of value-adding agriculture based on innovated farming technology and advancedfarming information
1) Changing the Existing Technology Development System into a User-friendly One
Under this objective, the MAF will provide increased financial support for participatory-basedtechnology development research projects. The MAF is planning to give its financial support of2.7 billion won for that type of 138 research projects in 1998. The MAF adopted a TechnologyDevelopment Assistance Scheme for Small Venture Capital Farm Businesses in January 1998 inorder to develop, in particular, state-of-the-art and energy-saving farming technologies. Inaddition, the MAF is increasingly putting the outcomes of the research projects to practical use,which were completed during the period of 1995 to 1997.
2) Expansion of information infrastructure to improve efficiencies in farm operation andagricultural marketing
Reinforcement of agricultural negotiating powers would be required.
Country Report : Korea
M - 32
In 1998, discussions among the WTO member countries are made actively on the next WTOagricultural negotiation, which is scheduled to commence at the end of 1999. Since June 1997,the member’s implementation of the UR commitments and possible issues to be raised in the nextround of the WTO multilateral trade negotiation have been reviewed in the Analysis andInformation Exchange (AIE). In the discussions, exporting countries such as USA and Australiaraised, especially, issues concerning a substantial reduction in higher tariffs, elimination of exportsubsidies and improvement of state trading. On the other hand, some countries including Korea,EU and Japan have emphasized the importance of ensuring food security and promotingmultifunctionality of agriculture. As part of its positive efforts to place Non-Trade Concerns onthe table of the next WTO round, Korea submitted a non-paper on Non-Trade Concerns (entitledas Non-Trade Concerns in Net Food Importing Countries) to the WTO Secretariat at the 16thSession of the Committee on Agriculture. The full text of Non-Trade Concerns in Net FoodImporting Countries is provided.
With a view of setting up national negotiation strategies in cooperation and collaboration withvarious non-governmental organizations, the MAF has held meetings of the Task Force for theNext Agricultural Negotiation consisting of representatives of farmer’s organizations andagricultural research institutes on a periodic basis since April 1998. At the meetings, the MAF hasbeen establishing Korea’s positions and responses to major agricultural issues raised at theformal/informal meetings of the WTO Committee on Agriculture and other bilateral/multilateraltrade negotiation meetings, in close consultation with the members of the Task Force.
At the same time, Korea is strengthening its preparedness for the next WTO agriculturalnegotiation through building close cooperative relationships with the interested countries with asimilar position, such as Japan, EU, Switzerland and Norway. At other international for a such asOECD and FAO, the MAF is also exerting itself to reflect, to the maximum extent possible,importing countries’ positions on agricultural trade and food security. For instance, the MAF hasstressed the paramount importance of self-sufficiency in rice in ensuring national food security atthe meeting of OECD Committee for Agriculture held in June 1998. In addition, at the meetingsof APEC(Asia-Pacific Economic Cooperation), the MAF has been trying to confine themember’s discussions on the opening of agricultural markets to the UR commitments.

Country Report : Korea
M - 33
Annex 3 Propulsion of Technology Development Program for Agriculture andForestry
Technology Development Program for Agriculture and Forestry (TDPAF) was started in 1994.
The objectives of Technology Development Program are to secure Korea's unique technologies, toefficiently develop and utilize agricultural and forest resources, to increase income of farmers, and toimprove rural environments.
Total of 415 billion won has been invested in this program, financed by Agricultural Special Tax, from1994 to 2004 for 10 years.
Annex 4 Presidential Decree on Preferential Tariff for Least-Developed Countries
Customs Cooperation Div. T : 503-9238 (Presidential Decree No.16553)
Presidential Decree on Preferential Tariff for Least-Developed Countries
Article 1 (Purpose)The purpose of the Decree is to govern the granting of preferential tariff to least-developedcountries in accordance with Paragraph 3 of Article 43-17 of the Customs Law.
Article 2 (Definition)"Least-developed countries" in this Decree refer to countries specified in Annex.
Article 3 (Products and Tariff Rates)Products eligible for preferential tariff and the rates are specified in Annex. In case of productseligible for minimum market access (MMA) under the Presidential Decree on Tariff Concessionsgranted pursuant to the World Trade Organization Agreement and Other Agreements, preferentialtariffs apply only to in-quota amount.
Article 4 (Remedy for Injury to Domestic Industries)1. In cases where a sharp increase in the import of products eligible for preferential tariff causes or
threaten to cause serious injury to domestic industries which produce like products, or directlycompetitive or substitutable products, for the purpose of protecting the domestic industries, therelevant Ministry or interested person may request the Minister of Finance and Economy tosuspend the application of preferential tariffs to the product in question.

Country Report : Korea
M - 34
2. When the relevant Ministry or an interested person wishes to request the Minister of Finance andEconomy to suspend the application of preferential tariff pursuant to paragraph 1, the followinginformation or documents shall be submitted to the Ministry of Finance and Economy.(1) HS code number, description, size, use and substitutable products.(2) Materials used in producing the product in question and documents explaining the use and the
manufacturing process of the products produced using the product in question as input.(3) Records of demand and supply of the product for the previous 1 year and forecast of the
demand and supply for the following 1 year.(4) Monthly records of import price and amount by countries for the latest 1 year.(5) Monthly factory prices of the product and sales performance by domestic producers for the
latest 1 year.(6) Description of injuries to domestic industries and the period for the suspension of preferential
tariffs.(7) Other information to prove that serious injuries are caused to domestic industries or there
exists a threat to cause serious injuries to domestic industries.
3. The Minister of Finance and Economy shall examine whether there are reasons to suspend theapplication of preferential tariffs within 15 days from the date on which the request is madepursuant to paragraph 1 unless there is a special reason for delay.
4. When it is determined as the result of the examination in paragraph 3 that there are reasons tosuspend the application of preferential tariffs, the Minister of Finance and Economy shall decidethe suspension of application of preferential tariff immediately and announce its decision in aMinisterial Ordinance.
5. The suspension of application of preferential tariff shall go into effect from the date on which theMinisterial Ordinance is released in accordance with paragraph 4.
Article 5 (Rules of Origin)1. Products eligible for preferential tariff shall be wholly produced or obtained in the exporting
country. The following products shall be considered as wholly produced or obtained in theexporting country:(1) Raw or mineral products extracted from soil, waters or seabeds of the exporting country;(2) Agricultural and forestry products harvested in the exporting country;(3) Animals born and raised in the exporting country and products obtained from such animals.(4) Products obtained by hunting or fishing conducted in the exporting country;(5) Marine products caught in high seas by vessels of the exporting country and products
manufactured or processed, using such products as a material. In this case, "vessels of theexporting country" refer to vessels registered in the exporting country, at least 60% of equityof which is owned by a citizen(s) or the government of the exporting country, or corporationor association legitimately registered in the exporting country.
(6) Used articles collected in the exporting country, fit only for the recovery of raw materials.

Country Report : Korea
M - 35
(7) Waste and scrap resulting from manufacturing operations conducted in the exportingcountry.
(8) Goods produced in the exporting country exclusively from the products referred to insubparagraphs 1 to 7 above.
2. Products which are finally manufactured or processed in the exporting country by using products,as input, which originate from countries other than the exporting country, or the origin of whichis not determined, shall be eligible for preferential tariffs, if the value of the inputs does notexceed 50 % of the F.O.B. price of the final products. In this case, if the final products include theproducts originating from the Republic of Korea as input, the value of these products shall beexcluded from the calculation of the total value of inputs.
3. The value of inputs referred to in 2 paragraph shall be calculated in the following order:(1) The value including freight and insurance cost at the time of importation to the exporting
country (C.I.F. price).(2) The ascertainable price paid first for the inputs in the exporting country.
4. Those who wish to receive preferential tariffs shall submit a Certificate of Origin issued by thegovernment of the exporting country or an authority designated by that government.
5. Article 53-4 of the Enforcement Decree of the Customs Law shall be invoked in cases notcovered by the rules of origin set out in paragraphs 1 to 4.
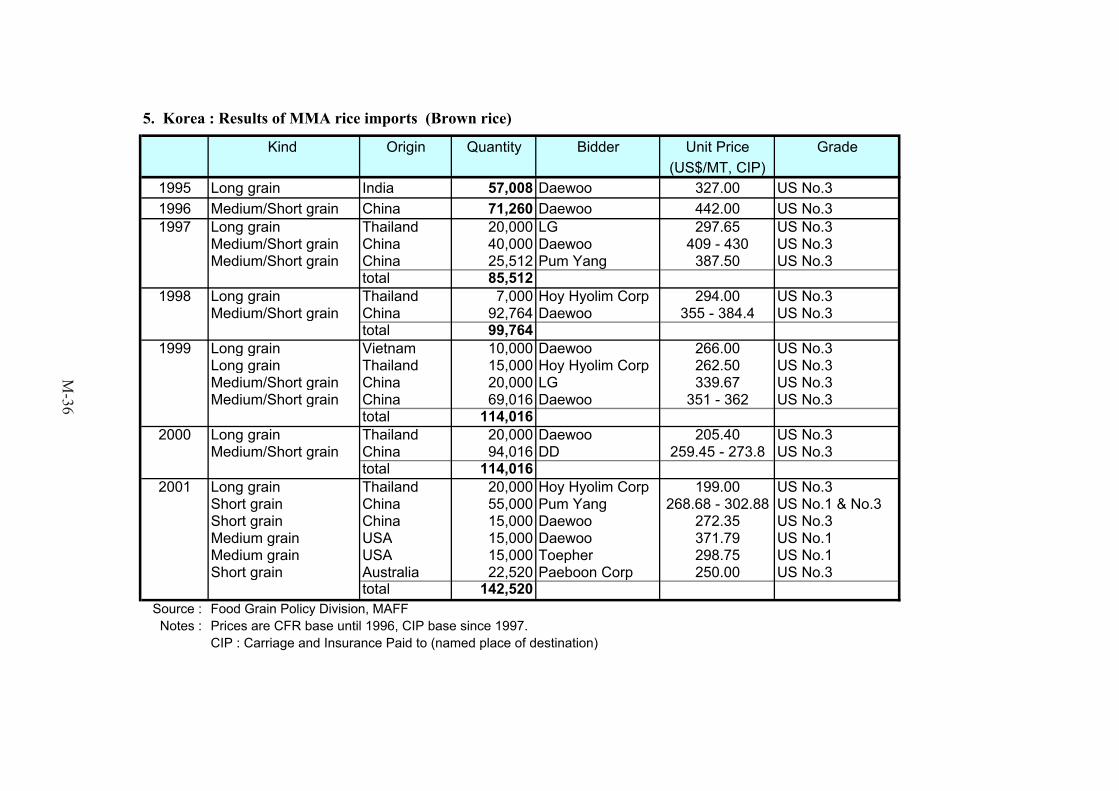
5. Korea : Results of MMA rice imports (Brown rice)
Kind Origin Quantity Bidder Unit Price Grade(US$/MT, CIP)
1995 Long grain India 57,008 Daewoo 327.00 US No.31996 Medium/Short grain China 71,260 Daewoo 442.00 US No.31997 Long grain Thailand 20,000 LG 297.65 US No.3
Medium/Short grain China 40,000 Daewoo 409 - 430 US No.3Medium/Short grain China 25,512 Pum Yang 387.50 US No.3
total 85,5121998 Long grain Thailand 7,000 Hoy Hyolim Corp 294.00 US No.3
Medium/Short grain China 92,764 Daewoo 355 - 384.4 US No.3total 99,764
1999 Long grain Vietnam 10,000 Daewoo 266.00 US No.3Long grain Thailand 15,000 Hoy Hyolim Corp 262.50 US No.3Medium/Short grain China 20,000 LG 339.67 US No.3Medium/Short grain China 69,016 Daewoo 351 - 362 US No.3
total 114,0162000 Long grain Thailand 20,000 Daewoo 205.40 US No.3
Medium/Short grain China 94,016 DD 259.45 - 273.8 US No.3total 114,016
2001 Long grain Thailand 20,000 Hoy Hyolim Corp 199.00 US No.3Short grain China 55,000 Pum Yang 268.68 - 302.88 US No.1 & No.3Short grain China 15,000 Daewoo 272.35 US No.3Medium grain USA 15,000 Daewoo 371.79 US No.1Medium grain USA 15,000 Toepher 298.75 US No.1Short grain Australia 22,520 Paeboon Corp 250.00 US No.3
total 142,520Source : Food Grain Policy Division, MAFFNotes : Prices are CFR base until 1996, CIP base since 1997.
CIP : Carriage and Insurance Paid to (named place of destination)
M-36

6. Detail results of MMA rice tender in 2000 and 2001
KOREA: 2000 BROWN RICE TENDER RESULTS
QuantityAwarded
Price(Metric Ton) (out of port) US$/MT, CIP
1 Long Grain ( #3 grade) AFMC Aug. 04, 2000 20,000 by 30-Nov-00 205.40 Thailand Siam Rice
2 Medium or Short Grain ( #3 grade) SAROK Aug. 17, 2000 23,000 by 30-Oct-00 273.80 China COFCO
3 Medium or Short Grain ( #3 grade) SAROK Aug. 24, 2000 24,000 by 30-Nov-00 263.60 China COFCO
4 Medium or Short Grain ( #3 grade) AFMC Aug. 25, 2000 23,000 by 30-Nov-00 265.10 China COFCO
5 Medium or Short Grain ( #3 grade) SAROK Aug. 31, 2000 24,016 by 10-Dec-00 259.45 China COFCO
Total 114,016
KOREA: 2001 BROWN RICE TENDER RESULTS
QuantityAwarded
Price(Metric Ton) (out of port) US$/MT, CIP
1 Medium Grain ( #1 grade) AFMC Sept. 06, 2001 15,000 by 24-Nov-01 298.75 USA Alfred C. Topfer International
2 Short Grain ( #3 grade) PPS Sept. 11, 2001 20,000 by 30-Oct-00 266.99 China Jilin Grain Group
3 Long Grain ( #3 grade) AFMC Sept. 12, 2001 20,000 by 20-Dec-01 199.00 Thailand Soon Hwa Seng
4 Short Grain ( #3 grade) PPS Sept. 18, 2001 20,000 by 7-Dec-01 268.58 China Jilin Grain Group
5 Short Grain ( #3 grade) AFMC Sept. 20, 2001 22,520 by 15-Dec-01 250.00 Australia Rice Growers Coop.
6 Short Grain ( #1 grade) PPS Sept. 25, 2001 15,000 by 22-Dec-01 302.88 China Jilin Grain Group
7 Medium Grain ( #1 grade) AFMC Oct. 09, 2001 15,000 by 24-Dec-01 371.79 USA Farmers Rice Coop.
8 Short Grain ( #3 grade) PPS Oct. 09, 2001 15,000 by 27-Dec-01 272.35 China COFCO
Total 142,520
Origin SupplierNo.TenderOrganization
Specification Bidding Date(Grade)ShippingPeriod
OriginShippingPeriod SupplierNo. Specification
TenderOrganization
Bidding Date(Grade)
M-37