
http:d.doi.org10.2157701035053.20190070 J. Braz. Chem. Soc ...
Article J. Braz. Chem. Soc., Vol. 31, No. 5, 916-926, 2020Printed in Brazil - ©2020 Sociedade Brasileira de Química
http://dx.doi.org/10.21577/0103-5053.20190256
*e-mail: [email protected]
Methodology Development and Validation of Amphotericin B Stability by HPLC‑DAD
Marciela B. Montenegro,a Stefânia P. de Souza,a Raquel A. C. Leão,a,b Helvécio V. A. Rocha,c Claudia M. de Rezended and Rodrigo O. M. A. de Souza *,a
aGrupo de Biocatálise e Síntese Orgânica, Instituto de Química, Universidade Federal do Rio de Janeiro, 21941-909 Rio de Janeiro-RJ, Brazil
bEscola de Farmácia, Universidade Federal do Rio de Janeiro, 21941-909 Rio de Janeiro-RJ, Brazil
cLaboratório de Sistemas Farmacêuticos Avançados, Farmanguinhos/Fiocruz, 22775-903 Rio de Janeiro-RJ, Brazil
dLaboratório de Análise de Aromas, Instituto de Química, Universidade Federal do Rio de Janeiro, 21941-895 Rio de Janeiro-RJ, Brazil
The high worldwide consumption of antibiotics and their complex impurity profiles has drawn the attention of the scientific community to the development and validation of stability methods for these drugs. Amphotericin B is an antibiotic that is a natural fermentation product of bacterium Streptomyces nodosus, used as a broad-spectrum antifungal agent, and is highly unstable. For this reason, the objective of this work is the development and validation of an indicative method of stability by high performance liquid chromatography (HPLC) associated to diode array detector (DAD) for amphotericin B (AMB). To achieve this, the chromatographic profiles of acid, basic, oxidative and thermal degradation caused by AMB exposure to water and light were verified by HPLC-DAD, using an isocratic method under the following conditions: C18 chromatographic column (200 × 4.6 mm-5 μm), mobile phase composed of 65:35 of organic phase (methanol/acetonitrile in 41:18)/aqueous phase (2.5 mmol L-1 of disodium edetate, pH 5.0), flow rate of 1.0 mL min-1, injection volume of 20 μL, column temperature 30 ± 2 °C and wavelength of 383 nm. After identification of these profiles, the method was validated according to recommendations of the International Conference on Harmonization guidelines, and then, the active pharmaceutical ingredient (API) peak purity grade, percentage of drug degradation, occurrence of impurities peak and its identification by mass spectrometry (MS) with electrospray ionization (ESI), under positive ionization mode, were evaluated. It is suggested that the main degradation products were amphotericin B (2), degradation product 1 (DP1) and degradation product 2 (DP2) in acid and oxidative medium. Amphotericin B was stable in the presence of water and at 70 ± 2 °C for seven days.
Keywords: amphotericin B, forced degradation, degradation products, indicative stability method, HPLC-DAD
Introduction
Drug stability is related to external factors such as temperature, humidity and light, and to internal factors, like the physical and chemical properties of active substances and pharmaceutical excipients in a formulation.1 In face of this large variety of factors, increasingly stringent regulations have been imposed on pharmaceutical companies by regulatory agencies in various countries.2,3 One of these requirements is the elaboration of forced
degradation studies, from the active pharmaceutical ingredient (API) to the final pharmaceutical product, in order to help the identification of possible degradation products and to establish the degradation routes and intrinsic stability of molecules.4
According to relevant legislation, the design for the forced degradation study should be based on the chemical and physical properties of the drug and the excipients used in the formulation, as well as on the storage conditions. The recommended stress conditions are: variation of temperature, humidity, susceptibility to acid and basic hydrolysis, oxidation, photolysis and presence of metal ions.1 The
Methodology Development and Validation of Amphotericin B Stability by HPLC‑DAD
Marciela B. Montenegro,a Stefânia P. de Souza,a Raquel A. C. Leão,a,b Helvécio V. A. Rocha,c Claudia M. de Rezended and Rodrigo O. M. A. de Souza *,a

Montenegro et al. 917Vol. 31, No. 5, 2020
stress study aims to promote a small extent degradation, in order to avoid secondary degradations, and not to promote the total degradation of the compound.5 Forced degradation is the starting point for the development of an indicative stability method that is capable of accurately quantifying active ingredients without the interference of degradation products, process impurities, excipients or other potential impurities.5 The development of this method is also one of the requirements encompassed by the International Conferences on Harmonization (ICH) guideline, concerning impurities in new substances.6 Normally, the analytical technique used is high performance liquid chromatography (HPLC) associated to diode array detector (DAD).
Antibiotics are among the most studied drugs in these cases, since they are consumed worldwide and have complex impurity profiles, as they can be produced by fermentation, by fermentation followed by one or more synthetic steps (semisynthetic substances) or by chemical synthesis.7 Amphotericin B (AMB) (Figure 1) is an antibiotic that is a natural fermentation product of bacterium Streptomyces nodosus,8 used as a broad-spectrum antifungal agent9 and active against leishmaniasis.10,11 Aside from the more complex impurities profile,7 this drug is also unstable to pH changes,9,12 the presence of oxygen9,12 and hot and humid environments,13 being among the 110 substances contemplated in the list of drugs subject to degradation under tropical conditions (50 ºC and 100% air humidity) of the World Health Organization (WHO).13
In view of the above, the objective of this work is the development and validation of a methodology indicative of stability for AMB by HPLC-DAD from its exposure to stress conditions.
Experimental
Reagents
The reagents used were: amphotericin B-USP reference standard, batch No. K1M387, amphotericin B
sample-batch: 20150624, ethylenediaminetetraacetic acid, disodium salt (EDTA-2Na) and HPLC grade methanol from Merck® (Rio de Janeiro, Brazil), HPLC grade acetonitrile and dimethylsulfoxide (DMSO) from Tedia® (Rio de Janeiro, Brazil); 37% hydrochloric acid and 20-60% hydrogen peroxide from Vetec® (Rio de Janeiro, Brazil); granulated sodium hydroxide ≥ 98% from Sigma-Aldrich® (Rio de Janeiro, Brazil), and ultra-purified water obtained using a Milli-Q Plus system (Merck-Millipore®, Rio de Janeiro, Brazil).
Instrumentation and chromatographic conditions
The method was developed using a Waters HPLC system model 2695D and a DAD detector model 2996. A Thermo BDS Hypersil C18 (200 mm × 4.6 mm-5 μm), column was used and mobile phase consisting of a 65:35 organic phase (OP) (methanol:acetonitrile (41:18 v/v)) and an aqueous phase (AP) (disodium edetate 2.5 mmol L-1 pH 5.0), with the following parameters: mobile phase flow rate 1.0 mL min-1, wavelength 383 nm, run time 30 min, injection volume 20 μL and column temperature 30 °C. The analyzes were processed using Empower® 3 software.
In order to identify the degradation products, electrospray ionization mass spectrometry (ESI-MS) and electrospray ionization tandem mass spectrometry (ESI-MS/MS) were extracted on positive ionization mode using the Thermo Fisher Scientific quadrupole mass spectrometer LCQ FLEET. The operating conditions were: capillary voltage of 3.5 kV; source temperature at 320 ºC and cone voltage of 20-40V. Samples were injected using an automatic injection pump, WPS3000RS model. Full scan spectra were acquired in the range of m/z 200 to 1000. The ESI-MS/MS spectra were acquired with energy of 28 eV from the more expressive peaks of the full spectrum. In these cases, the additive used to promote the ionization of molecules was 0.01% formic acid. The spectra were treated with Xcalibur 2.0 SR2 software. All experiments were conducted in triplicate (n = 3). The solutions pH values were measured using Mettler Toledo MP220 pH meter.
Amphotericin B stock solution and standard calibration analytical curve
The 1.0 mg mL-1 AMB stock solution was prepared in DMSO and methanol (80:20, v/v). Different volumes of this solution were pipetted, diluted and filtered on 0.45 μm polytetrafluoroethylene (PTFE) filter (Millex®) prior to injection. Eight AMB standard solutions (0.05, 0.06, 0.07, 0.08, 0.09, 0.1, 0.11 and 0.12 mg mL-1) were obtained for determining the standard calibration curve.
Figure 1. Amphotericin B.
Methodology Development and Validation of Amphotericin B Stability by HPLC-DAD J. Braz. Chem. Soc.918
Amphotericin B 0.1 mg mL-1 solution1.0 mL of the AMB stock solution was pipetted and
transferred to a 10 mL volumetric flask and the volume was filled with methanol HPLC grade, homogenized and filtered on 0.45 μm filter. The tests were performed in triplicate. The final concentration of this solution was of 0.1 mg mL-1.
Method validation
The method was validated following the ICH guideline.14 Considering that it is an API assay test, the parameters evaluated were linearity, specificity, accuracy, precision (repeatability), intermediate precision, limits of detection (LOD) and quantification (LOQ).
Linearity was calculated by linear regression of the areas of the API peak versus its concentration in eight standard solutions of AMB (0.05, 0.06, 0.07, 0.08, 0.09, 0.1, 0.11 and 0.12 mg mL-1) using the least squares method. The one-way variance analysis (ANOVA) evaluated the quality of the linear model fit performed by the software Origin® 2017.15 The specificity was evaluated by comparing the chromatogram of the degraded samples with the chromatogram of the 0.1 mg mL-1AMB solution (t0). Accuracy was assessed by the percentage recovery value. The standard drug solution was added to AMB solution (0.1 mg mL-1), in the range of 50, 80, 100 and 120% of the sample concentration. Analyses were performed in triplicate. The mean recovery percentage should be within the range of 100 ± 2% of the added amount. The relative standard deviation (RSD) between the replicates at each level should be at most 2.0%. Precision (repeatability) was determined from the analysis of six samples at 100% of the AMB working concentration (0.1 mg mL-1). The RSD acceptance criteria was 2.0% or less. The intermediate accuracy was verified under the same conditions as repeatability. However, it was conducted by different analysts (two different analysts) on different days (two different days). Limit of detection (LOD) and limit for quantitation (LOQ) for AMB were determined based on signal-to-noise concept, using signal-to-noise ratio at 3:1 and 10:1, respectively.
Suitability test of the chromatographic system
The AMB concentrations and its degradation products obtained in the experiments were determined by using the calibration analytical curve for this API, in which data were reprocessed using Empower® 3 software and the statistical analyses processed by Origin® 2017 software.15 In order to check the adequacy system, five HPLC-DAD injections were performed of the 0.1 mg mL-1 of the AMB
standard solution. The readings of the standard solutions (0.1 mg mL-1AMB) were defined by the parameters presented in Table 1.
AMB forced degradation study
Preparation of degraded samplesIn the AMB forced degradation study, the AMB
sample solution (0.1 mg mL-1) was subjected to the stress conditions listed in Table 2.
The forced degradation study was performed with an initial concentration of 0.1 mg mL-1 of AMB. For this, 1.0 mL of the AMB stock solution was transferred to 10 mL volumetric flasks (amber) containing 1.0 mL of the stress solutions (Table 2) and then filled with methanol HPLC grade to obtain the final solution (working concentration of 0.1 mg mL-1). Immediately after exposure to the stressing agents (0.01 mol L-1 HCl, 0.001 mol L-1 NaOH, 3.0% (v/v) H2O2 and water), the AMB solutions were filtered directly into amber glass vials (1.5 mL) using a 0.45 μm PTFE type hydrophilic membrane, the vials were capped and, when applicable, the solutions were exposed to 60 ± 2 °C, as shown in Table 2. After degradation, the solutions were injected for chromatographic analysis. All
Table 2. Parameters for the study of amphotericin B forced degradation
Stress condition Level Exposure time
Acid hydrolysis HCl 0.01 mol L-1 0
Alkaline hydrolysis NaOH 0.001 mol L-1 0
Oxidation3% H2O2
(t2 and t3 60 ± 2 ºC)t1 = 0/t2 = 30/t3 = 60 min
Hydrolysiswater
(t1 and t2 60 ± 2 ºC)t1 = 60/t2 = 240 min
Temperature 70 ± 2 °Ct1 = 24/t2 = 168 h
(7 days)
Photolysis 1.2 million lux hour-1 24 h
Where t corresponds to the time of exposure of the AMB to the degrading agent.
Table 1. System suitability parameters16
Parameter Specification
Relative standard deviation (RSD) ≤ 2.0
Separation efficiency (number of theoretical plates)
≥ 2000
Tail factor (peak symmetry) ≤ 2.0
Peak purity17 limit angle (LA) > peak purity angle (PA)
Capacity factor K’ ≥ 2.0

Montenegro et al. 919Vol. 31, No. 5, 2020
readings were performed at a fixed wavelength of 383 nm and scanning wavelengths from 200 to 400 nm. The assays were performed in triplicate.
For the temperature stressing conditions and the photodegradation study, 100 mg of the raw material (powder) were submitted to a temperature of 70 ± 2 °C in a Binder VD115 oven for 24 h and 168 h (7 days) and 100 mg were exposed to 1,200 million lux hour-1 of UV radiation in a Tecnal TE-383 photoreactor, at 25 ºC for 24 h. Subsequently, 0.1 mg mL-1 AMB solutions were prepared by weighing approximately 25 mg of the degraded AMB and transferred to 25 mL volumetric flasks, then 5 mL of DMSO were added, homogenized and the volume was filled with methanol HPLC grade. One milliliter of this solution was pipetted and transferred to a 10 mL volumetric flask, and the volume was filled with methanol HPLC grade. It was filtered through a 0.45 μm PTFE membrane and injected into HPLC-DAD at λmax of 383 nm and scanning wavelengths from 200 to 400 nm. The assays were performed in triplicate.
Amphotericin B control solutionsAmphotericin B 0.1 mg mL-1 solution were placed in
a Binder VD 115 oven at 60 ± 5 °C for a period of 30 min (Control 30 min), 60 min (Control 60 min) and 240 min (Control 240 min). Each solution was applied in the chromatographic system, in triplicate.
Blank solutionsFor each stress solution, a blank solution was prepared
under the same conditions without AMB. Blank, acid blank, alkaline blank, oxidative blank and blank in the presence of water were produced.
Identification of the main AMB degradation products after stress reactions
In order to identify the degradation products in each stress condition, the solutions of degraded samples of AMB and AMB solution t0 (0.1 mg mL-1 AMB solution) were injected by direct-infusion in the mass spectrometer. The electrospray ionization in positive mode mass spectrometry (ESI(+)-MS) and electrospray ionization in positive mode tandem mass spectrometry (ESI(+)-MS/MS) spectra were obtained by using samples prepared with methanol HPLC grade and the degrading agent at ratios according to Table 2, which were injected using an automatic injection pump.
Results and Discussion
To optimize the chromatographic parameters of the HPLC-DAD method (mobile phase composition, mobile
phase flow rate, column type, column temperature, injection volume, wavelength (detection), environmental parameters of the analyses) and obtain a good resolution and a suitable AMB peak shape, several chromatographic conditions were tested. After optimizing these parameters, the suitability of the system was verified, according to Table 1. Then, the HPLC-DAD method was validated and the chromatographic profiles in each stress condition, proposed in the AMB forced degradation study, were verified. Finally, the main degradation products of AMB after stress using the ESI(+)-MS with direct-infusion, were suggested.
Selection of the chromatographic parameters for the indicative stability method of AMB by HPLC-DAD
The chromatographic parameters used in the study were based on those presented by Wang et al.,18 with some changes in the mobile phase ratio, the length of the chromatographic column and the detection wavelength. The wavelength used for AMB detection and its related substances was 383 nm. This is due to the fact that AMB and its impurities have maximum absorption peaks at 383 and 407 nm, and therefore, the use of these wavelengths for detecting such substances would not affect the detection sensitivity.19
The composition of the mobile phase considered to be the most suitable for the chromatographic performance of the AMB forced degradation study was a mixture at 65:35 ratio of organic phase (41:18-methanol:acetonitrile): 2.5 mmol L-1 disodium edetate, pH 5.0. The use of disodium edetate is justified by the probable presence of metals on the silica surface of the chromatographic column (C18 column).19 The presence of metals on the silica surface increases the acidity of the silanol groups and the broadening of the chromatographic peaks of basic compounds, and even irreversible retention of these compounds may occur, which negatively affects column performance.20 The optimization of the chromatographic analyzes for AMB detection with the use of disodium edetate in the mobile phase was also verified in other studies.21-23
After optimizing the chromatographic parameters, the system was adjusted. The parameters found were within the limits established in Table 1 as: number of theoretical plates = 5034; tail factor = 1.8, capacity factor (K’) = 6.71 and purity of the appropriate API peak, since the limit angle (LA) 0.148 remained greater than peak purity angle (PA) 0.265, relative standard deviation (RSD) 1.3.
Validation of the indicative stability methodology for AMB
Validation must demonstrate that the analytical method produces reliable results and is appropriate to its intended
Methodology Development and Validation of Amphotericin B Stability by HPLC-DAD J. Braz. Chem. Soc.920
purpose in a well-documented manner and based on objective criteria. Considering that the proposed method is an assay for API dosing in order to verify whether it has degraded or not, the tests necessary for validation, in this case, are: selectivity, linearity, accuracy, precision (repeatability), intermediate precision, limits of detection (LOD) and quantification (LOQ).14
Selectivity In order to evaluate the method selectivity, blank
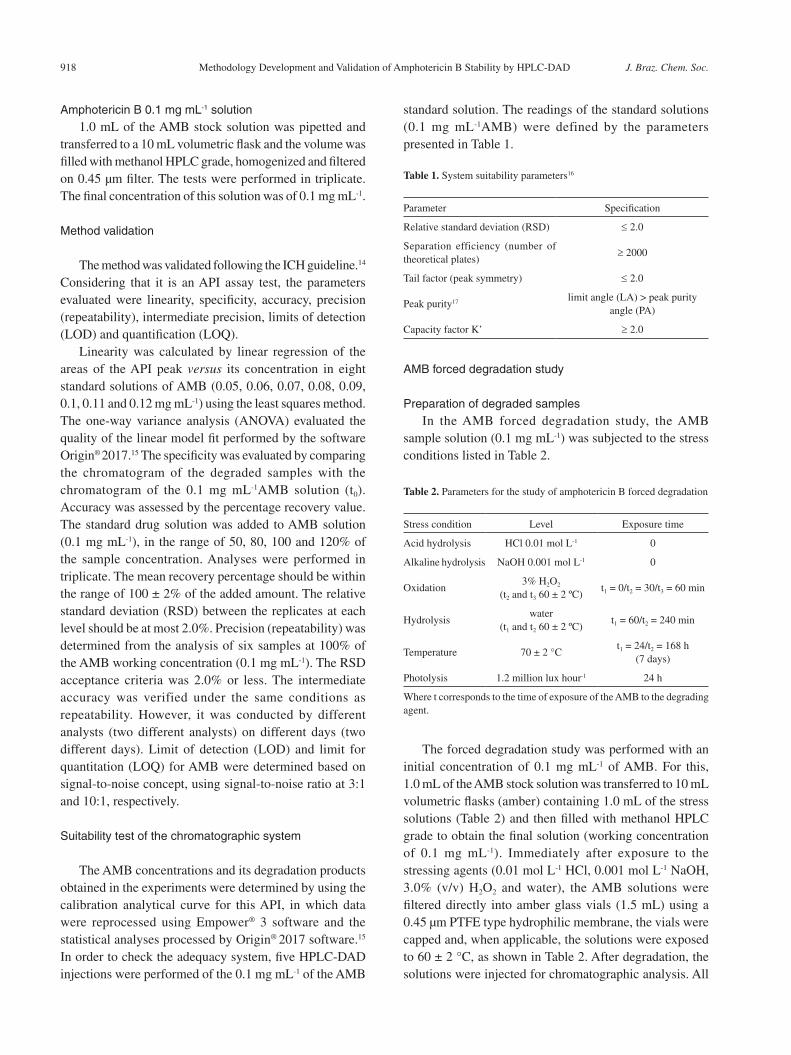
solution was injected into a HPLC-DAD system. The obtained chromatogram was compared with the AMB standard (Figure 2a) and the 0.1 mg mL-1 AMB sample (AMB t0) (Figure 2b). The AMB t0 sample showed an AMB peak in approximately 18 min, as it can be also verified in the standard solution. Blank analysis discloses that there are no peaks at this retention time, indicating that the diluents does not interfere with the AMB quantification. Selectivity can be also demonstrated with the results of the forced degradation study, analyzing the purity of the AMB peak and its resolution with the nearest peak, data that will be verified later.
Linearity and standard AMB calibration curveLinearity was evaluated using a calibration curve
to check the ability of the analytical method to obtain a proportional response to the analyte concentration in the sample. Based on eight concentrations from 0.05 to 0.12 mg mL-1 of AMB, in triplicate, the linearity of the analytical method was evaluated and a calibration curve was constructed. The regression equation of the line was
obtained (Y = 1.3 × 10⁸X − 882893), resulting in the correlation coefficient (r) higher than 0.990, indicating the quality of curve. The significance of regression and the lack of adjustment with 95% confidence (p ≤ 0.05) were also verified through analysis of variance (ANOVA), since the calculated F value was higher than the list F value and the lack of adjustment was not significant at the same level of confidence.
Accuracy and precisionThe calculated percentage recovery range was 98.08
to 99.96%, which is within the designated specification of 100 ± 2% and evidences the accuracy of the method.
The RSD values in the precision (repeatability) and intermediate precision experiments were lower than 2.0%. In the analysis of intermediate precision, the variance study was performed by a F-test, which gave a Fcalculated (0.86) lower than the Ftable (5.05) with 95% confidence, indicating the preciseness of the method.
Limit of detection and limit of quantificationLOD and LOQ were determined based on signal-
to-noise concept, using signal-to-noise ratio at 3:1 and 10:1, respectively. The results were found to be LOD 0.1 μg mL-1and LOQ 1.0 μg mL-1.
Evaluation of the AMB forced degradation study conditions
The degradation conditions of the AMB were selected (Table 2), and the method proved to be selective for the analyte with good resolution between AMB and its
Figure 2. Representative HPLC chromatograms of (a) 0.1 mg mL-1 AMB standard and (b) 0.1 mg mL-1 AMB sample (AMB t0) at 383 nm.

Montenegro et al. 921Vol. 31, No. 5, 2020
impurities. Even under stress conditions, the drug peak remained spectrally pure. The impurities and AMB showed λmax at 364 and 384 nm, indicating that the structure of the long chain conjugated double bonds of impurities and AMB are practically identical.18
AMB acid degradation
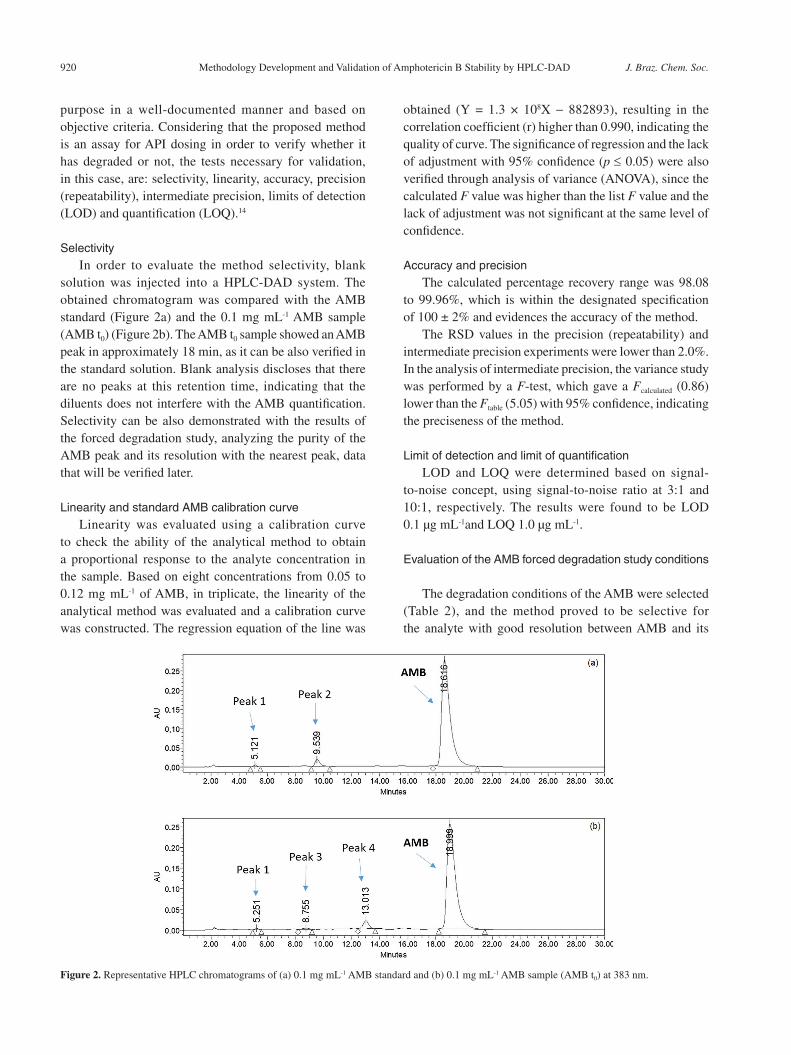
The AMB degradation percentage in acid medium was 19 ± 0.7% and its main degradation products are represented in Figure 3b by peak 6 (10 min) and peak 7 (12 min). In order to identify the main components of the sample after acid degradation, mass spectra were obtained by direct-infusion ESI(+)-MS of the AMB t0 samples (Figure 4a) and the AMB sample after acid hydrolysis (Figure 4b). In Figure 4, M corresponds to amphotericin B and M1 to amphotericin B (2).
The presence of the molecular ions m/z 946.50 and m/z 906.25 in AMB t0 (Figure 4a) is noted, which correspond to the sodium adduct of the AMB ([M + Na]+),23,24 and the loss of methoxy group in amphotericin B (2) (AMB (2)), [M1 + H − CH3OH]+.25 The presence of m/z 906.25 ion indicates that the AMB (2) was already present in the AMB t0 sample.
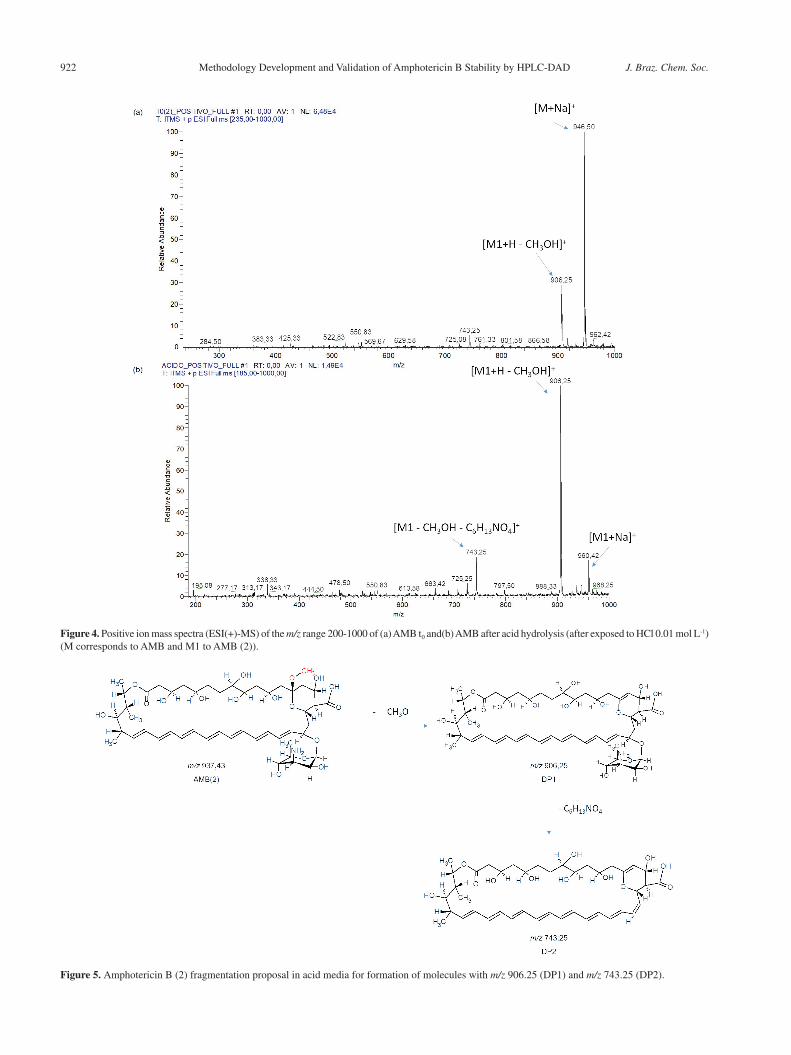
In the mass spectrum of the AMB solution after acid hydrolysis, Figure 4b, the main peaks are: m/z 906.25 [M1 + H − CH3OH]+ ions (degradation product 1-DP1), m/z 960.42 [M1 + Na]+, related to the amphotericin B (2) sodium adduct (AMB(2)) and m/z 743.25 [M1 − CH3O − C6H13NO4]+ ion, where the methoxy group and the glucosamine moiety of the AMB molecule are released, forming the degradation product 2-DP2 (Figure 5).
AMB basic degradation
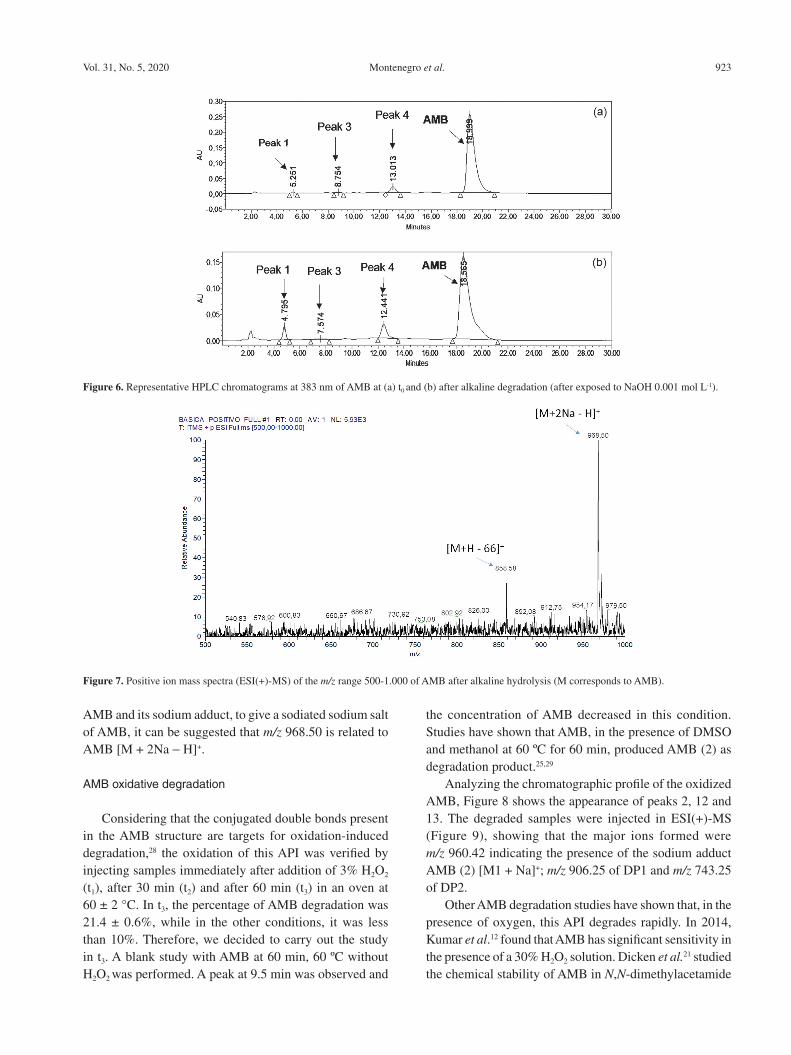
In alkaline medium, the pH was 12 and the AMB degradation percentage was 14.4 ± 0.4%. The number of peaks remained the same as in the AMB t0, according to Figure 6; however, the area of the peaks around 5 min (peak 1) and 12 min (peak 4) increased. Compound related to peak 1 went from 0.007 to 0.01 mg mL-1, and compound related to peak 2 went from 0.009 to 0.012 mg mL-1, indicating that they are possibly degradation products of this API. The fast degradation of AMB in basic medium was also observed by Hamilton-Miller26 (utilizing biological activity data) when the degradation profile of AMB with pH variation was demonstrated. In this experiment, the half-life of AMB at pH 6, 7 and 8 was higher in 160 h; at pH 4 and 10, it was 140 h and at extreme pH, like 2 and 12, the half-life was less than 5 h, which shows that this API rapidly degrades at very acidic and very alkaline pH. Rajagopalan et al.27 used HPLC-UV and found that 92% of AMB degraded at pH 12 over a period of 3 h. When complexed with cyclodextrin 1:1, the same degradation percentage was 3%, over the same period. This fact occurs since the hydrophobic cavity of the cyclodextrin involves the hydrophobic part of the AMB molecule, blocking the main sites that can be linked with hydroxylic ions at pH 12 and reducing its degradation under these conditions. No degradation product was identified in this study.
Like in acid degradation, mass spectra were obtained by direct-infusion ESI(+)-MS to check the main ions in the AMB samples after alkaline hydrolysis (Figure 7).
The most expressive ion is m/z 968.50. Considering that the formation of sodium salt of the carboxylic acid in
Figure 3. Representative HPLC chromatograms at 383 nm of AMB at (a) t0 and (b) after acid degradation (after exposed to HCl 0.01 mol L-1).
Methodology Development and Validation of Amphotericin B Stability by HPLC-DAD J. Braz. Chem. Soc.922
Figure 4. Positive ion mass spectra (ESI(+)-MS) of the m/z range 200-1000 of (a) AMB t0 and(b) AMB after acid hydrolysis (after exposed to HCl 0.01 mol L-1) (M corresponds to AMB and M1 to AMB (2)).
Figure 5. Amphotericin B (2) fragmentation proposal in acid media for formation of molecules with m/z 906.25 (DP1) and m/z 743.25 (DP2).
Montenegro et al. 923Vol. 31, No. 5, 2020
AMB and its sodium adduct, to give a sodiated sodium salt of AMB, it can be suggested that m/z 968.50 is related to AMB [M + 2Na − H]+.
AMB oxidative degradation
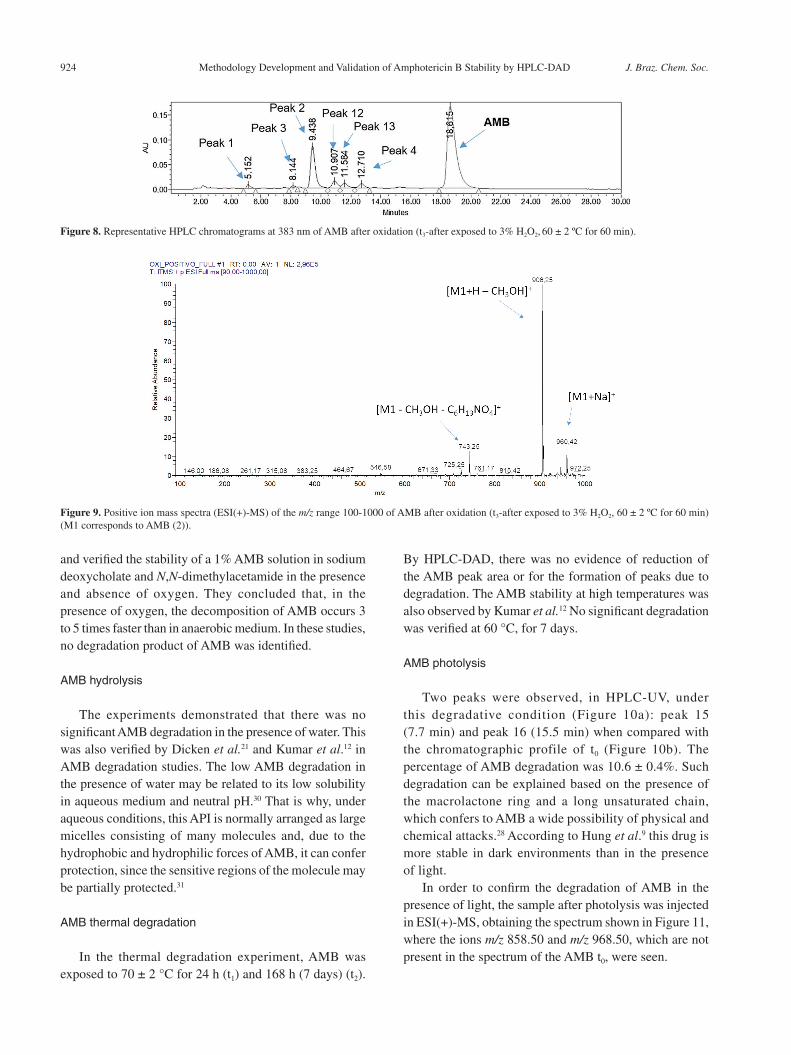
Considering that the conjugated double bonds present in the AMB structure are targets for oxidation-induced degradation,28 the oxidation of this API was verified by injecting samples immediately after addition of 3% H2O2 (t1), after 30 min (t2) and after 60 min (t3) in an oven at 60 ± 2 °C. In t3, the percentage of AMB degradation was 21.4 ± 0.6%, while in the other conditions, it was less than 10%. Therefore, we decided to carry out the study in t3. A blank study with AMB at 60 min, 60 ºC without H2O2 was performed. A peak at 9.5 min was observed and
the concentration of AMB decreased in this condition. Studies have shown that AMB, in the presence of DMSO and methanol at 60 ºC for 60 min, produced AMB (2) as degradation product.25,29
Analyzing the chromatographic profile of the oxidized AMB, Figure 8 shows the appearance of peaks 2, 12 and 13. The degraded samples were injected in ESI(+)-MS (Figure 9), showing that the major ions formed were m/z 960.42 indicating the presence of the sodium adduct AMB (2) [M1 + Na]+; m/z 906.25 of DP1 and m/z 743.25 of DP2.
Other AMB degradation studies have shown that, in the presence of oxygen, this API degrades rapidly. In 2014, Kumar et al.12 found that AMB has significant sensitivity in the presence of a 30% H2O2 solution. Dicken et al.21 studied the chemical stability of AMB in N,N-dimethylacetamide
Figure 6. Representative HPLC chromatograms at 383 nm of AMB at (a) t0 and (b) after alkaline degradation (after exposed to NaOH 0.001 mol L-1).
Figure 7. Positive ion mass spectra (ESI(+)-MS) of the m/z range 500-1.000 of AMB after alkaline hydrolysis (M corresponds to AMB).
Methodology Development and Validation of Amphotericin B Stability by HPLC-DAD J. Braz. Chem. Soc.924
Figure 8. Representative HPLC chromatograms at 383 nm of AMB after oxidation (t3-after exposed to 3% H2O2, 60 ± 2 ºC for 60 min).
Figure 9. Positive ion mass spectra (ESI(+)-MS) of the m/z range 100-1000 of AMB after oxidation (t3-after exposed to 3% H2O2, 60 ± 2 ºC for 60 min) (M1 corresponds to AMB (2)).
and verified the stability of a 1% AMB solution in sodium deoxycholate and N,N-dimethylacetamide in the presence and absence of oxygen. They concluded that, in the presence of oxygen, the decomposition of AMB occurs 3 to 5 times faster than in anaerobic medium. In these studies, no degradation product of AMB was identified.
AMB hydrolysis
The experiments demonstrated that there was no significant AMB degradation in the presence of water. This was also verified by Dicken et al.21 and Kumar et al.12 in AMB degradation studies. The low AMB degradation in the presence of water may be related to its low solubility in aqueous medium and neutral pH.30 That is why, under aqueous conditions, this API is normally arranged as large micelles consisting of many molecules and, due to the hydrophobic and hydrophilic forces of AMB, it can confer protection, since the sensitive regions of the molecule may be partially protected.31
AMB thermal degradation
In the thermal degradation experiment, AMB was exposed to 70 ± 2 °C for 24 h (t1) and 168 h (7 days) (t2).
By HPLC-DAD, there was no evidence of reduction of the AMB peak area or for the formation of peaks due to degradation. The AMB stability at high temperatures was also observed by Kumar et al.12 No significant degradation was verified at 60 °C, for 7 days.
AMB photolysis
Two peaks were observed, in HPLC-UV, under this degradative condition (Figure 10a): peak 15 (7.7 min) and peak 16 (15.5 min) when compared with the chromatographic profile of t0 (Figure 10b). The percentage of AMB degradation was 10.6 ± 0.4%. Such degradation can be explained based on the presence of the macrolactone ring and a long unsaturated chain, which confers to AMB a wide possibility of physical and chemical attacks.28 According to Hung et al.9 this drug is more stable in dark environments than in the presence of light.
In order to confirm the degradation of AMB in the presence of light, the sample after photolysis was injected in ESI(+)-MS, obtaining the spectrum shown in Figure 11, where the ions m/z 858.50 and m/z 968.50, which are not present in the spectrum of the AMB t0, were seen.

Montenegro et al. 925Vol. 31, No. 5, 2020
Conclusions
The AMB degradation study was adjusted not to cause a large deterioration of the drug involved, but in a safe stress, between 10 and 30%, thus avoiding secondary degradations. Considering the chromatographic profiles of the AMB degradations presented, it is suggested that the method used is stable, selective and with good resolution between AMB and the other impurities generated under stress. The methodology was validated and proved to be efficient for its intended purpose, maintaining a strict control of the chromatographic parameters. It was found that the AMB is stable in the presence of water and at 70 ± 2 °C for 7 days and susceptible to degradation at extreme pH in the presence of oxygen and light.
By means of direct-infusion ESI(+)-MS of the degraded
solutions, it can be suggested that AMB (2), DP1 and DP2 were produced in acid and oxidative medium. The mechanisms proposed to explain the formation of these degradation products (Figure 5) have not yet been fully clarified and require additional experimental and theoretical studies to formulate a consistent proposal.
Acknowledgments
Authors thank CNPq, CAPES and FAPERJ for financial support.
References
1. International Conferences on Harmonization (ICH); Guideline
(ICH-Q1A (R2)): Stability Testing of New Drug Substances and
Figure 10. Representative HPLC chromatograms at 383 nm of AMB (a) after photolysis (after 24 h exposed to 1,2 million lux hour-1) and in (b) t0.
Figure 11. AMB mass spectrum after photolysis (after 24 h exposed to 1,2 million lux hour-1) in ESI(+)-MS 200-1000 m/z.

Methodology Development and Validation of Amphotericin B Stability by HPLC-DAD J. Braz. Chem. Soc.926
Products, 2003, available at https://www.fda.gov/media/71707/
download accessed in October 2019.
2. Hasija, M.; Rahman, N.; Ausar, S. F.; Vaccine 2013, 3, 11.
3. Brummer, H.; Life Sci. 2011, 31, available at https://www.
sgsgroup.at/~/media/Global/Documents/Technical%20
Documents/SGS-LSS-Forced%20Degradation-EN-11.pdf
accessed in October 2019.
4. Swarbrick, J.; Baertschi, S. W.; Jansen, P. J.; Alsante, K. M.;
Reed, R. A.; Pharmaceutical Stress Testing, vol. 13, 1st ed.;
Taylor & Francis Group, Eli Lilly and Company Indianapolis:
Indianapolis, USA, 2005.
5. Alsante, K. M.; Ando, A.; Brown, R.; Ensing, J.; Hatajik, T. D.;
Kong, W.; Tsuda, Y.; Adv. Drug Delivery Rev. 2007, 59, 29.
6. International Conferences on Harmonization (ICH); Guideline
(ICH Q3A (R2)): Impurities in New Drug Substances (Review
2), 2006, available at https://www.fda.gov/media/71733/
download accessed in October 2019.
7. European Medicines Agency (EMA); Guideline on Setting
Specifications for Related Impurities in Antibiotics, 2012,
available at https://www.ema.europa.eu/documents/scientific-
guideline/adopted-guideline-setting-specifications-related-
impurities-antibiotics_en.pdf accessed in October 2019.
8. Trejo, W. H.; Bennett, R. E.; J. Bacteriol. 1963, 85, 436.
9. Hung, C. T.; Lam, F. C.; Perrier, D. G.; Souter, A.; Int. J. Pharm.
1988, 44, 117.
10. Sundar, S.; Chakravarty, J.; Agarwal, D.; Rai, M.; Murray, H.
W.; N. Engl. J. Med. 2010, 362, 504.
11. Rodrigo, C.; Weeratunga, P.; Fernando, S. D.; Rajapakse, S.;
Clin. Microbiol. Infect. 2018, 24, 591.
12. Kumar, D.; Trivedi, N.; Shivastava, S.; Dixit, R. K.; Int. J. Pharm
Sci. 2014, 6, 289.
13. World Health Organization (WHO); Accelerated Stability
Studies of Widely Used Pharmaceutical Substances under
Simulated Tropical Conditions, 1986, available at http://apps.
who.int/medicinedocs/pdf/h1808e/h1808e.pdf accessed in
October 2019.
14. International Conferences on Harmonization (ICH), Guideline
(ICH Q2(R1)); Validation of Analytical Procedures: Text and
Methodology (R 4), 2005, available at https://www.ema.europa.
eu/en/documents/scientific-guideline/ich-q-2-r1-validation-
analytical-procedures-text-methodology-step-5_en.pdf
accessed in October 2019.
15. Origin Pro 7; OriginLab, Northampton, USA, 2007.
16. The United States Pharmacopeia, USP 39-NF 29, United States
Pharmacopeial Convention: Rockville, 2016.
17. Empower 3 Data Acquisition and Processing Theory Guide,
version 2010/1, Review A; Waters Corporation, Milford, USA,
2010.
18. Wang, Y. H.; Zhang, I. P.; Chang, Y.; Hu, C. Q.; J. Antibiot.
2010, 63, 553.
19. Chang, Y.; Yong-Hong, W.; Chang-Qin, H.; J. Antibiot. 2011,
64, 735.
20. da Silva, C. G. A.; Collins, C. H.; J. Chromatogr. A 2012, 1260,
81.
21. Dicken, C. M.; Rossi, T. M.; Rajagopalan, N.; Int. J. Pharm.
1988, 46, 223.
22. Manosroi, A.; Kongkaneramit, L.; Manosroi, J.; Int J. Pharm.
2004, 270, 279.
23. Aszalos, A.; Bax, A.; Burlinson, N.; Roller, P.; Mcneal, C.; J.
Antibiot. 1985, 38, 1699.
24. Kruve, A.; Kaupmees, K.; Liigand, J.; Oss, M.; Leito, I.; J. Mass
Spectrom. 2013, 48, 695.
25. Li, J.; Zhu, H. Q.; Li, J.; Jin, S. H.; Hu, C. Q.; J. Antibiot. 2007,
60, 272.
26. Hamilton-Miller, J. M. T.; J. Pharm. Pharmacol. 1973, 25, 401.
27. Rajagopalan, N.; Chen, S. C.; Chow, W. S.; Int. J. Pharm. 1986,
29, 161.
28. Tufteland, M. L.; Selitrennikoffb, C. P.; Ryana, R. O.; Pest
Manage. Sci. 2009, 65, 624.
29. Zhu, H.; Hu, C.; Zhao, X.; Chin. J. Pharm. Anal. 2006, 26, 949.
30. Connors, K. A.; Amidon, G. L.; Stella, V. J.; Chemical Stability
of Pharmaceuticals: A Handbook for Pharmacists, 2nd ed.;
Wiley: New Jersey, USA, 1986.
31. Bonner, D. P.; Mechlinski, W.; Schaffne, C. P.; J. Antibiot. 1975,
28, 132.
Submitted: March 28, 2019
Published online: November 7, 2019
This is an open-access article distributed under the terms of the Creative Commons Attribution License.


![J. Braz. Chem. Soc. Article 0103 - 5053 $6.00+0static.sites.sbq.org.br/jbcs.sbq.org.br/pdf/v26n12a22.pdf · X-ray powder diffraction (XPD) and scanning electron microscope (SEM)].](https://static.fdocuments.net/doc/165x107/60a2442c878776424e333bad/j-braz-chem-soc-article-0103-5053-600-x-ray-powder-diffraction-xpd-and.jpg)

