01023: CHARACTERIZATION OF INHIBITOR AND CORROSION PRODUCT FILM
22
CHARACTERIZATION OF INHIBITOR AND CORROSION PRODUCT FILM USING ELECTROCHEMICAL IMPEDANCE SPECTROSCOPY (EIS) H. B. Wang, H. Shi, T. Hong, C. Kang and W. P. Jepson Corrosion center, Ohio University 340 ½ West State Street, Athens, OH 45701 ABSTRACT In the work, EIS and Tefal techniques were used to study the corrosion inhibitor performance in multiphase flow conditions. The experimental results show that the corrosion product layer without inhibitor is non-protective at a low temperature and low pressure environment. In slug flow at a Froude number of 6, the effectiveness of the inhibitor increases with the addition of an oil phase and reaches almost 100 % for 100 ppm of inhibitor. Tafel analysis suggest that the most possible way to decrease the corrosion rates could result from the effect of blocking the active sites on the metal surface by adsorbed imidazoline molecules. From EIS, it is shown that with an increase in the inhibitor concentration, the double layer capacitance and inhibitor film capacitance decrease sharply, whilst the solution resistance in the pores increases. The analysis shows that the formation of a very dense inhibitor film on the metal surface rather than an increase in the corrosion product film thickness. This may explain both the decrease of charge transfer resistance and the decrease of film capacitance. Keywords: imidazoline, anodic and cathodic reaction, slug flow, film capacitance
Transcript of 01023: CHARACTERIZATION OF INHIBITOR AND CORROSION PRODUCT FILM

C H A R A C T E R I Z A T I O N O F I N H I B I T O R A N D C O R R O S I O N P R O D U C T F I L M
U S I N G E L E C T R O C H E M I C A L I M P E D A N C E S P E C T R O S C O P Y (EIS)
H. B. Wang, H. Shi, T. Hong, C. Kang and W. P. Jepson
Corrosion center, Ohio University
340 ½ West State Street, Athens, OH 45701
ABSTRACT
In the work, EIS and Tefal techniques were used to study the corrosion inhibitor performance in
multiphase flow conditions. The experimental results show that the corrosion product layer without
inhibitor is non-protective at a low temperature and low pressure environment. In slug flow at a Froude
number of 6, the effectiveness of the inhibitor increases with the addition of an oil phase and reaches
almost 100 % for 100 ppm of inhibitor. Tafel analysis suggest that the most possible way to decrease the
corrosion rates could result from the effect of blocking the active sites on the metal surface by adsorbed
imidazoline molecules. From EIS, it is shown that with an increase in the inhibitor concentration, the
double layer capacitance and inhibitor film capacitance decrease sharply, whilst the solution resistance
in the pores increases. The analysis shows that the formation of a very dense inhibitor
film on the metal surface rather than an increase in the corrosion product film thickness. This may
explain both the decrease of charge transfer resistance and the decrease of film capacitance.
Keywords: imidazoline, anodic and cathodic reaction, slug flow, film capacitance

INTRODUCTION
In oil and gas production industry, internal corrosion of carbon steel pipeline is a well-known
phenomenon and a serious problem, and inhibition is the most cost effective and flexible method of
corrosion control. Therefore, knowledge of the mechanism of a corrosion inhibition process is highly
desirable in the design and proper selection of inhibitors.
Inhibitors can interfere with the anodic or cathodic reaction, and can form a protective barrier on
the metal surface against corrosive agents or can work by a combination of these actions. For application
in the petroleum industry, organic inhibitors containing nitrogen (amines) are often used because of their
effectiveness and availability. When a corrosion inhibitor is added to a system, adsorption of inhibitor
molecules at the metal-solution interface occurs and this is accompanied by a change in potential
difference between the metal electrode and the solution due to the non-uniform distribution of electric
charges at the interface f~l. The inhibitors efficiency depends on many factors. From a macroscopic view,
it depends on flow patterns, solution chemistry, temperature, pressure, etc. At a molecular level, it
depends on the number of adsorption sites, inhibitors' charge density, molecular size, mode of
interaction with the metal surface, electronic structure of the molecules etc.
Many researchers have been working on the performance and mechanisms of the inhibitors based on
the test results in small-scale laboratory systems. The studies of Mansfield (1985) point out that interface
inhibition presumes a strong interaction between the corroding substrate and the inhibitor I21. The two-
dimensional adsorbate layer can affect the basic corrosion reactions in various ways : that caused by the
geometric blocking effect of adsorbed inhibitive species on the metal surface, and that due to the effect
of blocking the active sites on the metal surface by adsorbed inhibitive species; that due to the electro-
catalytic effect of the inhibitor or its reaction products. For the first case, the inhibition comes from the
reduction of reaction area on the surface of the corroding metal, whereas for the other two modes, the
inhibition effects are due to the changes in the average activation energy barriers of the anodic and
cathodic reactions of the corrosion process.
Using potential dynamic methods, Cao (1996) studied the inhibition mechanism and efficiency.
The study shows that if the shift of corrosion potential due to addition of an interface inhibitor is
negligible, the inhibition is most probably caused by a geometric blocking effect of the adsorbed
inhibitive species on the surface of the corroding metal TM.
The two main types of the adsorption of an organic inhibitor on a metal surface are physical or
electrostatic and chemisorption. Chemisorption is the transfer, or sharing of the inhibitor molecules'

charge to the metal surface, forming a coordinate-type bond. Chemisorption is probably the most
important type of interaction between the metal surface and an inhibitor molecule |~1. The studies of
Wang [41 provide further information on the electron configuration of several imidazoline inhibitors by
the quantum chemical calculation and the correlation between molecular structure and behavior of
corrosion inhibition. It is concluded that electron donor group introduced, particularly, the substituent
group with conjugated system, to imidazoline ring will improve corrosion inhibition efficiency of
imidazoline derivatives. The N-C-N bond in imidazoline molecule is of p-Tt conjugation property.
Introduction of electron releasing substituent or conjugation system on the C atom will remarkably
strengthen the chemical adsorption of the N atom on the metal surface. The XPS results [51 also show
that nitrogen is clearly evident from the imidazoline-inhibited surface but was absent with the
uninhibited ones. Thus, the nitrogen provides a marker for the presence of the chemical inhibitors on the
iron oxide.
Many previous studies [6,7,8[ pointed out that the main components of the scale are iron carbonate
(FeCO3) and iron carbide (Fe3C). Like the metal, Fe3C is an electronic conductor. The cathodic
corrosion reaction, therefore, can occur as readily on Fe3C as on the surface of the steel itself. This led to
the possibility of galvanic coupling between the steel substrate and the layer or undissolved Fe3C. In
general, the presence of conductive compounds in a corrosion layer plays an essential role in their
protectiveness and in the risk of uniform corrosion degenerating into localized attack. The typical
corrosion product layer in an uninhibited system is on the order of microns thick and is porous 19,10]. In
the presence of corrosion inhibitor, such as oleic imidazolines and phosphate esters, the inhibitor film is
on a molecular level while the corrosion layer is on a microscopic order. Due to the differences in length
scale, the inhibitor sees the corrosion product layer as a surface [51. Kowata (1 996) also indicates that the
corrosion product layer is very porous and has enough pore size for the inhibitor to migrate I~1[.
Therefore, the study of inhibitor performance is always associated with the study of corrosion product
film,
The understanding of CO2 corrosion inhibitors is limited in multiphase flow conditions,
especially since very little is known about the inhibitor film formation mechanisms, as well as the
porosity and thickness of the inhibitor film. Electrochemical impedance spectroscopy (EIS) has been
used to study the corrosion product film and inhibitor performance extensively during last twenty years.
Most of the works have been carried out to for the coating film system l~2[and the methods used are
extrapolated to study the inhibitor film [131.

However, most works in understanding the corrosion phenomenon in oil and gas pipelines are
carried out using rotating cylinder electrodes and small diameter flow loops, which do not take into
account the effect of multiphase flow and the presence of various flow regimes encountered in oil-water-
gas pipelines. For multiphase flow in horizontal pipelines, various flow regimes are seen, such as
stratified, plug, slug and annular flOW. I14'151 Slug flow regime can be found in many multiphase pipeline
with associated high turbulence and bubble impact mechanism. Since the slug flow is a severe corrosion
enviromnentt~6, ~71, in this work, the performance and mechanism of the inhibitor were studied using EIS
and Tafel techniques at these conditions.
E X P E R I M E N T A L SETUP & PROCEDURE
All the flow loop experiments were carried out in a I.D. 0.1016 m, 15 m long acrylic multiphase
pipeline system. The schematic layout of the low pressure and low temperature system is shown in
Figure 1. The CO2 partial pressure was maintained at 0.136 MPa and the solution temperature was keep
at 40 °C. Table 1 shows the detail information about the tests matrix.
Before each experiment, the system is de-oxygenated with carbon dioxide for 5 hours until the
concentration of the dissolved oxygen in the solution is less than 10 ppb. Once the de-oxygenation
process is completed, the EIS and electrical resistance (ER) probes, which are polished by 600-grit
sandpaper and washed by acetone, are quickly inserted into the test section and the experiments are
started. A constant pH value of 5.3 was measured during experiments since temperature and CO2 partial
pressure is kept constant.
The AC impedance spectra are generated by Gamry ® PC4 corrosion monitoring system. The EIS
measurements are carried out at open circuit potential with 4 mV AC voltage amplitude. The
experimental results of the impedance were analyzed in terms of an equivalent circuit using Nonlinear
Least Squares Fit Technique provided by the Gamry software. The reference and auxiliary electrodes of
the EIS probe are made of 316L stainless steel, while the working electrode is made of C-1018 carbon
steel with an area 0.785 cm 2. The equivalent circuit typically used to describe the behavior of inhibitor
or paint film was also used in this work, which is shown in Figure 2. All the capacitors were
mathematically simulated using a constant phase element (CPE) in order to model the phenomena,
which do not exactly behave as pure capacitors.

R E S U L T S & D I S C U S S I O N
1 O0 % WATER CUT
Figure 3 shows the Nyquist plots for slug flow of Froude Number (Fr) 6 at different exposure
times. It is shown in Nyquist diagram that the origin of the semi-circle locates below the real axis of
impedance. This depression of the semicircle may be due to the changing of surface roughness and the
effect of geometry on the current distribution, which is also observed by other researchers |~31.
The change of charge transfer resistance R~t calculated from EIS plots and the corrosion rates
calculated from the ER experiments at different exposure time are shown in Figures 4a and Figure 4b.
The corrosion rates for slug flow at a Froude numbers of 6, 9, and 12 are 1.4, 1.5, 1.7 and 1.7 mm/y at 1,
2, 3, and 4 hours, 1.7, 1.7, 1.9, and 1.8 mrn/y at 1, 2, 3, 4, 5 hours, and 2.3, 2.3 and 2.4 mm/y at 1, 2, 3
hours, respectively. From the corrosion rates values, it can be seen that the corrosion process, which
includes both diffusion steps and kinetic steps, gradually becomes stable during first 3-4 hours. It is seen
that corrosion rates in slug flow increase with an increase in higher Froude number, This is because, at a
Froude number of 12, the corrosion environment is severe due to the high turbulent intensity and strong
bubble impact t16~
The slight decrease of ILt values shown in Figure 4a is consistent with the ER results, which may
indicate that micro localized corrosion is accompanying with the general corrosion process t61. This may
also suggest that little or no protective corrosion product film has been formed on the metal surface.
When carbon steel is exposed, the corrosion product FeCO3 and the iron carbide (Fe3C) from the steel
itself, may form a mixture on the metal surface [7]. The main effect of cementite is then to form
additional cathodic reaction sites. The solubility of ferrous carbonate is fairly high in a CO2 containing
solution with a HCO3 content t6j. Therefore, it is possible that most of the product of anodic reaction,
ferrous ions, will dissolve in the water without forming FeCO3 scales especially at high turbulent
multiphase conditions. This will then leave, at the steel surface, some uncorroded Fe3C released from the
corroded steel. This forms a conductive, porous layer on which the cathodic reaction can take place.
Another possible reason is that the size of the pores in the mixture layer is large enough for
electrochemical active species to transport freely at these multiphase flow conditions. This is reasonable
because of the strong impact of gas bubbles and collapse can remove the scale on the metal surface and
then leave large-size pores.
Initially, imidazoline based inhibitors are used at a concentration of 50 ppm in a 100 % water cut
environment. Figure 5 shows the charge transfer resistance for Froude numbers of 6, 9, and 12 at
different exposure times. It can be seen that the tL:t at Froude number 6 is much higher than those 9 and
12. This indicates that the inhibitor is more effective at lower turbulent flow conditions. The corrosion
rates obtained from the ER results are given in Figure 6. These results are consistent with the decrease
in the charge transfer resistance from EIS experiments, which is inversely proportional to the corrosion
rates. This also suggests that the charge transfer resistance from EIS tests could be used to study and
compare the corrosion rates under different flow conditions. Both sets of results indicate that corrosion
process is impeded due to the addition of the inhibitors.
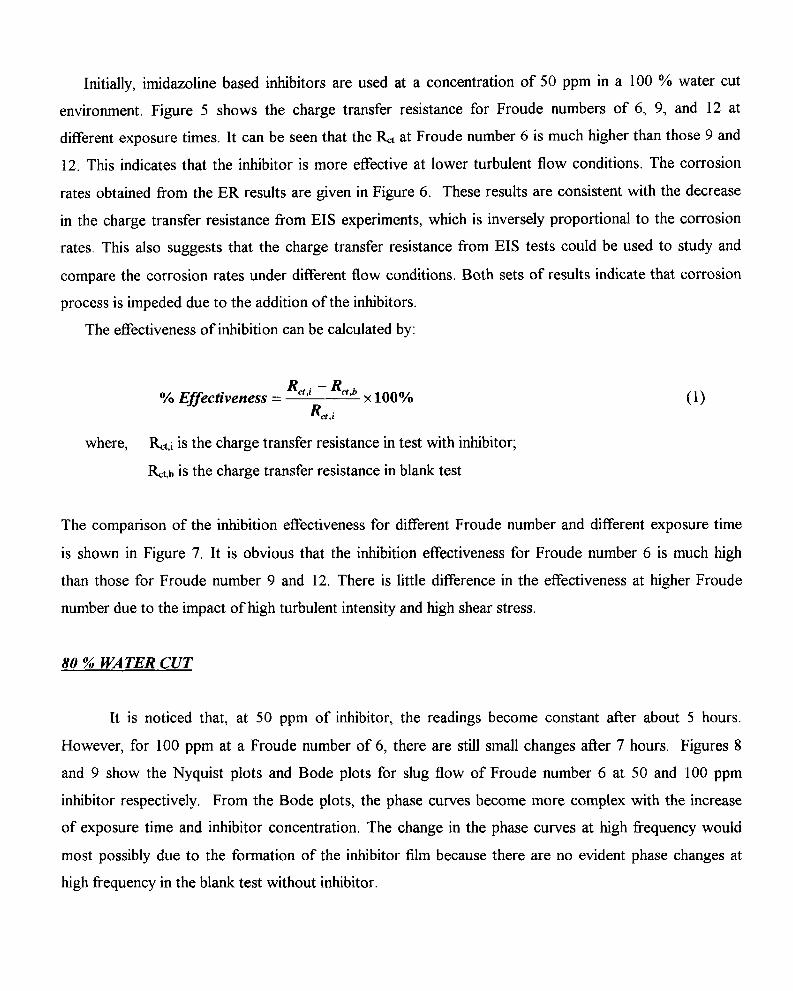
The effectiveness of inhibition can be calculated by:
where,
% Effecaveness - Ret, i - Ret ,b
×1oo% O) ea,i
R~i is the charge transfer resistance in test with inhibitor;
R~b is the charge transfer resistance in blank test
The comparison of the inhibition effectiveness for different Froude number and different exposure time
is shown in Figure 7. It is obvious that the inhibition effectiveness for Froude number 6 is much high
than those for Froude number 9 and 12. There is little difference in the effectiveness at higher Froude
number due to the impact of high turbulent intensity and high shear stress.
80 % WATER CUT
It is noticed that, at 50 ppm of inhibitor, the readings become constant afer about 5 hours.
However, for 100 ppm at a Froude number of 6, there are still small changes after 7 hours. Figures 8
and 9 show the Nyquist plots and Bode plots for slug flow of Froude number 6 at 50 and 100 ppm
inhibitor respectively. From the Bode plots, the phase curves become more complex with the increase
of exposure time and inhibitor concentration. The change in the phase curves at high frequency would
most possibly due to the formation of the inhibitor film because there are no evident phase changes at
high frequency in the blank test without inhibitor.

Figure 10 shows the comparison of R~ 0, 25, 50 and 100 ppm of inhibitor. The most remarkable
phenomenon shown in the diagrams is that the ILt values of Froude 12 at 50 ppm are very low, which is
only slightly higher than those at 25 ppm of Froude number 6 and 9. Further, the R~ values at Froude
number 6 at 100 ppm of inhibitor continuously increase during the period of exposure time, which
suggest a continuous formation of inhibitor film on the metal surface due to the high bulk inhibitor
concentration. The continuous formation of inhibitor film may result in both an increase of the film
thickness and a decrease of the porosity. The increase of inhibitor film thickness could prevent the
transportation of electrochemical active species from bulk solution to metal surface, while the increase
of film coverage could decrease the number of kinetic active sites on metal surface and change the
anodic or cathodic reaction energy barriers TM. As shown in Figure 11, all the effectiveness for 50 and 100 ppm inhibitor concentration are very
high, almost reach 100 %. For the 100 % water cut, the effectiveness is not greater than 92%. Since
imidazoline is oil soluble, the presence of oil phase may increase its dispersion in the solution, and then
make it feasible for the adsorption of imidazoline molecules on metal surface. The corresponding ER
results show that the corrosion rates are 0.3, 0.1 mm/y at 25 ppm and 50 ppm for slug flow of Froude
number 6 and the corrosion rate at 100 ppm is almost zero. The comparison of charge transfer resistance
between 0 and 50 or 100 ppm inhibitor concentration reveals that the inhibitor plays a very important
role in hindering the corrosion process. Therefore, it is necessary to investigate the mechanism of the
performance of the imidazoline based inhibitor.
STUD Y OF INHIBITION MECHANISM
In order to study the mechanisms of the anodic and cathodic reactions in the presence of an
inhibitor, Tafel tests were carried out for slug flow at a Froude number of 6 at 80 % water cut. The
potential scan range is + 10 mV around the open circuit potential and scan rate is 0,1 mV/s. Though the
scan range is small, which is within LPR techniques range in a consideration of not changing the steel
surface condition, the obtained results show a Tafel curve characteristics. Figure 12 shows the Tafel
curves at 0, 25, 50 and 100 ppm of inhibitor respectively, and the parameters of the analysis results are
displayed at Table 2. It is clearly that the open circuit potential continuously increases from -515 mV at
blank test to -196 mV at 100 ppm of inhibitor.
Previous studies 12'31 show that, if the shift of corrosion potential due to addition of an interface
inhibitor is negligible, the inhibition is most probably caused by a geometric blocking effect of the
adsorbed inhibitive species on the surface of the corroding metal. Therefore, a possible way to decrease
the corrosion is the blocking of the active sites on the metal surface by adsorbed imidazoline molecules.
This may change the average activation energy barriers of the anodic and cathodic reactions and thus
change the corrosion potential. This happens because the adsorption of imidazoline molecules is a
chemical adsorption process, which involves the donation of a pair of electrons present on the nitrogen
atom to iron metal. The N-C-N bond in imidazoline molecule is of p-rt conjugation property, which
remarkably strengthen the chemical adsorption of the nitrogen atom on the metal surface [4'181. With the
decrease of open circuit potential, the corrosion current decreases sharply with the increase of inhibitor
concentration. The decrease of corrosion current is directly related to the decrease of corrosion rate.
When no inhibitor is present, there is a layer of the mixture of corrosion product FeCO3 and Fe3C
on the metal surface. As discussed for 100 % water cut, this non-protective layer will form additional
cathodic reaction sites and then will not decrease the overall corrosion rate. Therefore, the main function
of the adsorption of imidazoline molecules is to block these active sites and change the reaction
activation energy. Furthermore, the adsorbed imidazoline molecules could also form an interface
geometry network above the metal surface, keeping the corrosion product Fe 2+ and electrochemical
active species H ÷, HCO3" and H2CO3 from transporting to and from the metal surface and bulk solution.
The accumulation of Fe 2+ near the metal surface due to diffusion problem will increase its in situ
concentration and decrease the solubility of FeCO3. This will then cause a formation of FeCO3 in the
pores and decrease the number of active sites again.
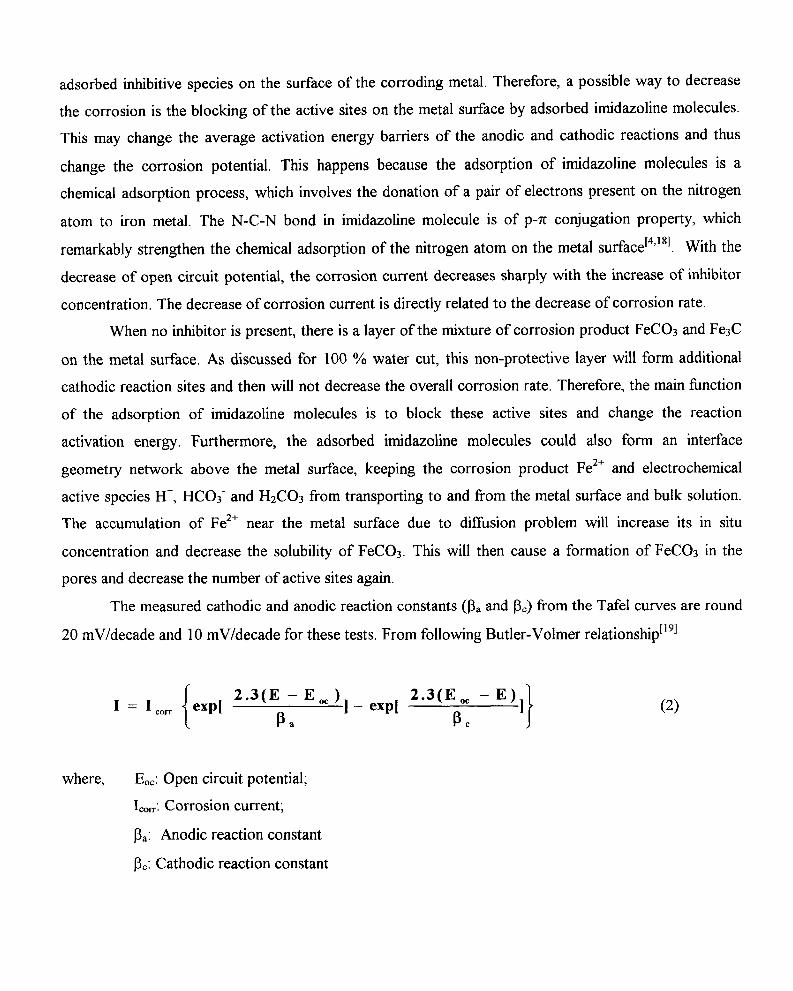
The measured cathodic and anodic reaction constants (13a and 130 from the Tafel curves are round
20 mV/decade and 10 mV/decade for these tests. From following Butler-Volmer relationship r19j
I = I {exp[ 2 " 3 ( E - E ° c ) ] - e x p [ 2"3(E°c - E ) . ] } ~°'~ [3~ 13~ (2)
where, Eoo: Open circuit potential;
I~o~r: Corrosion current;
13a: Anodic reaction constant
13o: Cathodic reaction constant

it is known that 13a and 13~ are a measure of the symmetry of the activation barrier for anodic and cathodic
reaction. It is observed that shape of the cathodic and anodic curves do not change much with the
addition of inhibitor, i.e., the ratio of cathodic and anodic reaction constants does not change very much.
This means that the inhibitor film has the same effect on the anodic and cathodic reaction. It will not
only block the cathodic reaction sites but also the anodic reaction.
In present study, equivalent circuit model shown in Figures 2 is proposed to simulate the simple
corrosion processes shown in Figure 13. According to previous work [12,13,20,21] , the Rpf in figure 2 has
been interpreted as the pore solution resistance due to electrolyte penetration through the pores of
inhibitor film. The capacitance Cpf has been interpreted as the capacitance of the dielectric inhibitor film.
However, in a real system, film on the metal surface is a complex layer of both inhibitor film and
corrosion product film. In this work, the film on the metal surface when inhibitor is present in solution is
simply treated as inhibitor film since inhibitor molecules also treat corrosion product layer as its
surfacel111. The resistance and capacitance of the porous film can be written as following I12'2°1.
where
d Rpf : 1 3 - - (3) Aps
Aps Apf Aps A - Ap~ Cpf : C s -[-Cf : I~0~rs "~-~0~rf :~0~rs -~-~0~rf (4)
d d d d
Cs is the capacitance of solution in the pore
Cf is the capacitance of inhibitor molecules
p is the solution resistivity in the pores of the inhibitor films
d is the thickness of the inhibitor films
Apfis the area occupied by the inhibitor film
A m is the area of pores in inhibitor film
A is the surface area of the EIS working electrode.
~0 is the electrical permittivity of vacuum (8.854 * 10 12 F/m)
e,f is the relative electrical permittivity of inhibitor film
~rs is the relative electrical permittivity of electrolyte in porous inhibitor film

Table 3 shows the simulation results for slug flow of Froude number 6 at 4 th exposure time in 80
% water cut environment. As shown in the Table 3, the pore solution resistance Rpf which represent the
diffusivity of electroactive species increase from 7 ohm to 292 ohm, which is almost 42 times higher. It
is also obvious that both the double layer and inhibitor film capacitance decrease a lot with the increase
of inhibitor concentration to 100 ppm.
The introduction of an inhibitor into the electric double layer changes its composition and
structure Ill. The inhibitor molecules on the metal surface affect the electric double layer by causing a
change in the dielectric properties of water molecules in the electric double layer. In this case, it may
change the orientation of the dipoles of the water molecules which causes lowering of the dielectric
constant and then decreases the double layer capacitance. The decrease of double layer capacitance may
also be due to the decrease of the area where electrolyte is present due to the formation of the inhibitor
film.
Equation 4 shows that the overall film capacitance is the combination of capacitance of inhibitor
molecules and the solution capacitance in the pores. When more and more inhibitor molecules adsorb on
the surface, it can be seen that the inhibitor film capacitance becomes much lower. The decrease of
overall film capacitance may suggest that the electrical permittivity of inhibitor molecules is relatively
much lower compared to the relative electrical permittivity of sea water which is about 80 (20 °C).
Therefore, the decrease of the capacitance could result from both the increase of area (Apf) where
inhibitor molecules adsorb on and the increase of thickness (d) of the inhibitor film.
On the other hand, the Rpr, which represents the resistance of electrochemical species
transporting to and from the surface and bulk solution, increase greatly from 7 ohm at 25 ppm to 292
ohm at 100 ppm. Since the Rpf is proportional to the thickness of the path in which electrochemical
species diffuse and Cpf is inverse proportional to the thickness of the film, the sharp increase of the
thickness of the inhibitor film is then unexpected. Thus, the decrease of the pore size due to the
formation of a dense inhibitor film may explain the phenomenon. The reduction of the pore size
decreases not only the overall diffusion area (As) but also the conductivity of the electrochemical species
in porous medium. A very dense inhibitor film will also decrease the number of the kinetic active sites
where the anodic and cathodic reaction can take place, accordingly, decease the corrosion rates.
From the above analysis, it can be concluded that the formation of a very dense inhibitor film on
the metal surface can be used to explain the both the decrease of charge transfer resistance and the
decrease of the electrical properties, such like the film and double layer capacitance (Cdl and Cpf).

CONCLUSIONS
1. For 100% water cut condition, the experimental results show that the corrosion product layer
without inhibitor is non-protective at lower temperature and low pressure environment.
2. The effectiveness of the inhibitor increases with the addition of oil phase into the solution, which
reaches nearly 100 % for 50 and 100 ppm concentration at slug flow of Froude number 6.
3. The open circuit potential increases with increase of inhibitor concentration in 80 % water cut
flow. Tafel analysis suggest that the most possible way to decrease the corrosion rates could
result from the effect of blocking the active sites on the metal surface by adsorbed imidazoline
molecules.
4. With the increase of the inhibitor concentration, the double layer capacitance and inhibitor film
capacitance decrease sharply, while the pore solution resistance increase evidently.
5. The analysis shows that the formation of a very dense inhibitor film on the metal surface other
than the increase of film thickness could be used to explain both the decrease of charge transfer
resistance and the decrease of film capacitance.
6. The information of charge transfer resistance from EIS tests which could be compared with ER
results provides a very useful way to study performance of inhibitors. Other information such as
film and double layer capacitance, can be used to characterize the mechanism of the inhibitor
film.
REFERENCES
1. Sastri, V. S., "Corrosion inhibitors", John Wily & Sons. Inc., 1998
2. Mansfeldm, F., Kendig, M. W. and Lorenz, W. J., 1985, " Corrosion Inhibition in Neutral, Aerated
Media", J. Electronchem Soc., Vol. 132, NO.2, P290-296.
3. Cao, C., 1996, "On Electrochemical Techniques for Interface Inhibitor Research", Corrosion Science,
Voi.38, No. 12, pp. 2073-2082.
4. Wang D., Li Shuyuan, Y., Wang, M., Xiao, H., Chen, Z., " Theoretical and Experimental Studies of
Structure and Inhibition Efficiency of Imidazoline Derivatives", Corrosion Science, Vol. 41, 1999,
P1911-1919
5. Campbell, S., Jovancicevic, V., "Corrosion Inhibitor Film Formation Studied by ATR-FTIR",
Corrosion/99, Paper No.484, 1999

6. Videm, K. and Kvarekvaal, J., Corrosion/96, Paper NO. 1, 1996
7. Crolet, J., Thevenot, N. and Nesic, S., Corrosion/96, Paper NO.4, 1996
8. Nesic, S., Thevenot, N., Crolet, J. and Drazic, D., Corrosion/96, Paper NO.3, 1996
9. Heuer, J.K. and Stubbins, J.F., 1998, Corrosion, 54, P566
10. Schmitt, G., Gudde, T., and Strobel-Effertz, E., "Fracture Mechanical Properties of CO2 Corrosion
Product Scales and Their Relation to Localized Corrosion", Corrosion/96, Paper No. 9, 1996
11. Kowata, K. and Takahashi, K., " Interaction of Corrosion Inhibitor with Corroded Steel Surface",
CORROSION/96, Paper NO.219, 1996
12. Walter, G.W., 1991, Corrosion Science, Vol. 32. No.10 p1041.
13. Tan, Y.J., Bailey, S. and Kinsella, B., 1996, Corrosion Science, Vol. 38, No.9, pp 1545.
14. Dukler A. E. and Hubbard, M. G. " A model for gas-liquid slug flow in horizontal and near
horizontal tubes", Ind. Engg. Chem. Found, 14, 1975, pp337-3347
15. Jepson, W. P., 1987 : "Flow characteristics in horizontal slug flow". 3 rd International conference
on Multiphase Flow, The Hague, Netherlands, 18-20 May, Paper F2
16. Fan, Z., Jepson, W. P., Hantratty, T. J., International Journal Multiphase Flow, Vol. 18, No. 4,
February, 1992, pp 477-484
17. Gopal, M., Jiang, L., Xie, Q.Q., Journal of Energy Resource and Technology, Voi. 120, NO.l, pp67-
71, 1998
18. Hackerman N. and Hurd R. M., 1962, Proc. Int. Congress of Metallic Corrosion, London,
Butterworths, P 166.
19. Brett. C. and Brett, A, Electrochemistry, Oxford University Press, 1993
20. Walter, G. W., 1986, "A Review of Impedance Plot Methods Used For Corrosion Performance
Ananlysis of Painted Metals", Corrosion Science, Vol. 26, No.9,pp 681-703
21. Mertens, S.F., Cooman, B.C., Temmerman, E., Corrosion, Vol. 55, NO.2, pp151-156

TABLE 1 TEST MATRIX
Parameter Condition
Temperature, °C 40
CO2 partial pressure, Mpa 0.136
Water cut, % 100 & 80
Inhibitor Imidazoline based
Water ASTM sea water
Inhibitor concentration, ppm 0, 25, 50, 100
Oil Light hydrocarbon oil with viscosity of 2 cp at 20 °C
Flow pattern Slug flow: Froude number 6, 9 & 12
TABLE 2 TAFEL ANALYSIS RESULTS
(Slug flow of Froude number 6 at 80 % water cut environment)
Inhibitor
concentration
0 ppm
25 ppm
50 ppm
100 ppm
Eoc: Open circuit
EOC
(mV)
-515
-317
-256
-196
Icon-
(A/cm 2)
5.85.10 -~
2.37.10 -S
2.86.10 -6
6.98.10 -8
~otential; Ico,: Corrosion current; 13.: Anodic reaction constant
13c: Cathodic reaction constant
TABLE 3 P A R A M E T E R S OF INHIBITOR FILM AT 4 TM H O U R
FOR SLUG FLOW OF FROUDE N U M B E R 6
Concentration Rpf Cdl Cpf met
(ppm) (ohm) (I~F) (I-tF) (ohm)
25 7 181 383 285
50 44 34 21 4180
100 292 28 8 6869

K
V
A
()
V
G
V ®
C
F E
A. Liquid tank G. Test section B. Bypass H. Gas outlet C. Liquid feed I. Pressure gauge D. Orifice plate with mercury meter K. Heater E. Flow height control gate V. Valves F. Gas input
FIGURE 1. LAYOUT OF THE LOW PRESSURE SYSTEM

Ks I
I Rpf ICe1
Cpf: Capacitor inhibitor films Cdt: Capacitor for double layer Rs: Bulk solution resistance Rpr: Solution resistance in porous inhibitor film Ra: Charge transfer resistance
FIGURE 2 EQUIVALENT CIRCUIT MODEL
-60 t a 2 h
e 4 h - ~ 0 . . . . . . . . . . . . . . . . . . . . . . . . . . . . . . . . .
i~ " - f i t t i n g curve i • 3. Hz /
-40 . . . . . . . . . . . . . . . . . . . . . . . . . . . . . . . . . . . . . . . . . . . . . . . . . . . . . .
-30
~ -20
-10
0
0 20 40 60 80 100 120
Real Impedance (ohm)
FIGURE 3 NYQUIST PLOTS AT DIFFERENT EXPOSURE TIME (Slug flow Fr = 6, 40 C, 0.136 MPa, 100 % water cut)

100
8O
60
40
20
4 2 3 Time Oh)
FIGURE 4a CHARGE TRANSFER RESISTANCE AT DIFFERENT EXPOSURE TIME ( 40 C, 0.136MPa, 100 % Water cut)
2.5
S
120
= O
O
1.5
0.5
1 2 3 4
Time (h)
F I G U R E 4b C O R R O S T I O N R A T E S AT D I F F E R E N T E X P S U R E
T I M E ( 40 C, 0 .136MPa, 0 ppm inhibi tor , 100 % w a t e r cut)

600
1000
800
400
200
2 3 4 Time (h)
0.7
M F r = 6
. . . . . ~ F r = 9
• Fr = 12
1200
F I G U R E 5 C H A R G E T R A N S F E R R E S I S T A N C E A T D I F F E R E N T E X P O S U R E T I M E
(40 C, 0 .136MPa, 100 % w a t e r cut, 50 ppm inhibi tor)
iiiiiiiiiiiiiiiiiiiiiii 0.6
~ 0.5
0.4
.~ 0.3
~ o.2
0.1
0
1 2 3 4
Time (h)
F I G U R E 6 C O R R O S T I O N R A T E S A T D I F F E R E N T E X P O S U R E T I M E (40 C, 0 .136MPa, 50 p p m inhibi tor , 100 % w a t e r cut)
[] Fr=6
[] Fr=9
m Fr=12

100"0°/° J a F r = 6 I
9 0 . 0 % _ @ F r = 9 . . . . . . . . . . . . . . . . . . . . . . . . . .
8 0 . 0 % . . . . . . .
7 0 . 0 %
60.0%
"~ 5 0 - 0 %
4 0 . 0 %
3 0 . 0 %
2 0 . 0 %
1 0 . 0 %
0 . 0 %
1 2 3 4 Time (h)
F I G U R E 7 E F F E C T I V E N E S S O F I N H I B I T O R F I L M A T D I F F E R E N T E X P O S U R E T I M E
(40 C, 0.136 M P a , 100 % w a t e r , 50 ppm)
-1600
• 2 h • 4 h A N - - - j l . . . . . . ~ . . . . . . . . . . . . . . . . . . . -1400 • 5 h . . . . . A . . . .
"~' • 1.3 H z • -1200 . . . . . . . . . . . . . . . . . . . . . . . . . . . . . . . . . . . . . . . . . . . . . . . . . . .
-1000 . . . . . . . . . . ~ - . . . . . . / - . . . . . . _O . . . . . . . . . . . . . . . . . . . . . . . . . . . . 0.8 H z
-800
-600
"~ -400
-200
~ i L , i
0 500 1000 1500 2000 2500 3000 3500 4000
Real Impedance (Ohm)
F I G U R E 8a EIS R E S U L T S A T D I F F E R E N T E X P S O U R E T I M E (Slug f low F r = 6 , 40 C, 0.136 M P a , 80 % w a t e r cu t , 50 p p m inh ib i to r )
• •
. . . . . . I I 9 . . . . . . . . . . . . . . . . . . . . . . . . . ~ . . . . . . . m _ _ K . . . . . . . . .
. . . . . . . . . . . . . . . . . . . . . . . . . . . . . . . . . . . _ - . . . . . . A . . . . . . .
d k • • •
r . . . . . . . . . . . . . . . . . . . . . . . . . . . . . . . . . . . • . . . . . . . . " . . . . . . . . . . r
i i i i i i I ~ i i t J i i i t i i i i ~ ~ J i i i J i i i i r i i i i i i i i
4500

0
-10
- 2 0
-30
' ~ - 4 0
@ • @@ •
O . . . . . . . . . . . . . . . . . . . . . . . . . . . . . . . . . .
o o Q 0
t
o 2 h • 4 h I S h
................... * . . . . . . . . . . . . . . . . . . . . . . . . . , ]l I "
'........:::l -50 . . . . . . . . . . . . . . . . . . . . . . . . . . . . . . . . . . . . . . . . . . . . . . . . . .
-60 . . . . . . . . . . . . . . . . . . . . . . . . . . . . ~ - • - A ~ l~ ~ . . . . . . . . . . . . . . . . . . .
-70 , i i i i i i i i i i i I i i i i i i i i i i l l l l i i i t i i i i i i i i i i i t ~ l i i i i [ i i
0 .01 0.1 1 10 100 1000 10000
Frequency (Hz)
F I G U R E 8b EIS R E S U L T S A T D I F F E R E N T E X P O S U R E T I M E S
(Slug f low Fr=6 , 40 C, 0.136 M P a , 80 % w a t e r cut, 50 p p m inhibi tor)
-5000
-4500
-4000
~ - 3 5 0 0
-3000
-2500 E
-2000
"~ -1500
" -1000
-500
0
iiii i i Iii iiiiii i i i ii iiii .3, ,71 0.63 Hz
. . . . . . . . . . . . . . . . . . . . . . . • . . . . . . . . . . . . . . . . . . . . . . . . . . .
& • • . . . . . . . . . . . . . . . . . . . . . . . . . . . . . . . . . . . . . . . . . . . . . . . . . . .
I . ~ _ o ~ m • g
s4. " , . I z , . . . . . . . . . . . . . . . . . . . . . . . . . . . . . . . . . . . . . . . . . .
i m ' ' ~ i i i i i I i i i i I i i i i I i i i i I i ~ i L i i i i i I i i i i I i i i i I i i i i
0 1000 2000 3000 4000 5000 6000 7000 8000 9000 10000 Real Impedance (ohm)
FIGURE 9a NYQUIST PLOTS AT DIFFERENT EXPOSURE TIME (Slug flow Fr = 6, 40 C, 0.136 MPa, 80 % water cut, 100 ppm)

atnt , ,*. . . . . f A m t , * l h u 3 h A7
-10 . . . . . . . . . . . m- - . . . . . . . . . . . . . . . . . .
-2O
"~ -30
-40
-50
-60
e
Ao . . . . . . . . . . . . . . . . . . . . 4 ~ - . . . . . . . . . . . . . . . . . . . . . . . . . . . . . . . . .
• oot°o . . . . . . . . . . . . . . . . . . . . . . . . . . . . . . . . . . . . . . . . . _ * * . . . . . . . . .
mSma l i 0 g i m
~ O O 0 0
1.0E-03 i , r , , , I ' ' ' ' ' ' ' ~ 1 ' ' ' ' ' ' ' ~ ' ' ' ' ' ' ' ' 1 ' ' ' ' ' ' ' 1 ' ' ' ~ ' ' ' ' 1 ' ' ' ' ' ' "
1.0E-02 1.0E-01 1.0E+00 1.0E+01 1.0E+02 1.0E+03 1.0E+04
Frequency (Hz)
F IGURE 9b BODE PLOTS AT DIFFERENT EXPOSURE TIME (Slug flow Fr = 6, 40 C, 0.136 MPa, 80 % water cut, 100 ppm)
7000 [] Fr=6, blank . . . . . . . . . . . . . . . . . . . . . . . . . . . . . . - ~ . . . . . ]
m F r =6 , 25 ppm ~ / 6000 [ ] F r = 6' 50 ppm . . . . . . . . . . . . . . . . . . . . . . . . . . . . W - --]
WFr = 6, 100 ppm ~ ~ [
5000 1 F r = 12, 50 ppm . . . . . . . . . . . . . . . M . . . . . . . . . . W . . . . . ] [] F r = 12, 100 ppm
4ooo - i i 3000
2000
1000
0
1 2 3 4
Thne Oh)
FIGURE 10 CHARGE TRANSFER RESISTANCE AT DIFFERENT
EXPOSURE TIME (40 C, 0.136 MPa, 80 % water cut)

100.0%
90.0%
[] Fr=6, 50 ppm
80.0%
70.0%
[] Fr=12, 100ppm
[] Fr=6, 100ppm
60.0%
[] Fr=12,100ppm
50.0%
2 3 4 5
Time (h) FIGURE 11 EFFECTIVENESS OF INHIBITOR FILM AT DIFFERENT
EXPOSURE TIME (Slug flow, 40 C, 0.136 MPa, 80 % water cut)
L = 1.0E-07
1.0E-08
1.oE-o5 . . . . . . . . . . . . . . . . . . . . . . . . . . . . . . . . . . . . . . . . . . . . . . . . . . . . . . . . . . . . . . . . . . . . . . . . . . . . . . . . . . . . . . . . . . . . . . . . . . . . . . . . . . . . . . . . . . . . . . . .
1.0E-06 ......... * ................................................................................................. ~ "
1.0E-09
• Fr 6, blank
• Fr 6, 25 ppm
- Fr 6, 50 ppm
• Fr 6, 100 ppm
-0.55 -0.5 -0.45 -0.4 -0.35 -0.3 -0.25 -0.2 -0.15
Voltage (V)
FIGURE 12 TAFEL CURVE FOR DIFFERENT INHIBITOR CONCENTRATION (80 % w a t e r cut , F r 6)

Pores
/ / / r / " /
Bulk Solution Flow
< ,
FIGURE 13 SCHEMATIC OF A SIMPLE INHIBITOR FILM MODE