0'1-0145 - Texas Department of Insurance · BodilyProperty InjuryDamage SubtotalOptional Coverages...
11
0'1-0145 Exhibit 1-1 TEXAS AUTOMOBILE INSURANCE PLAN ASSOCIATION -19.6% ed Coverages Rate Level Changes Injury Protection -12.9% at Present Rates 30,033,651 32,683,756 13,595,089 1,266,854 -5.5% -6.6% -3.2% 0.9% Private TOI $ Passenger 1,383,251 16,438,562 2,650,105 -4.0% Personal Latest Year Premium
Transcript of 0'1-0145 - Texas Department of Insurance · BodilyProperty InjuryDamage SubtotalOptional Coverages...
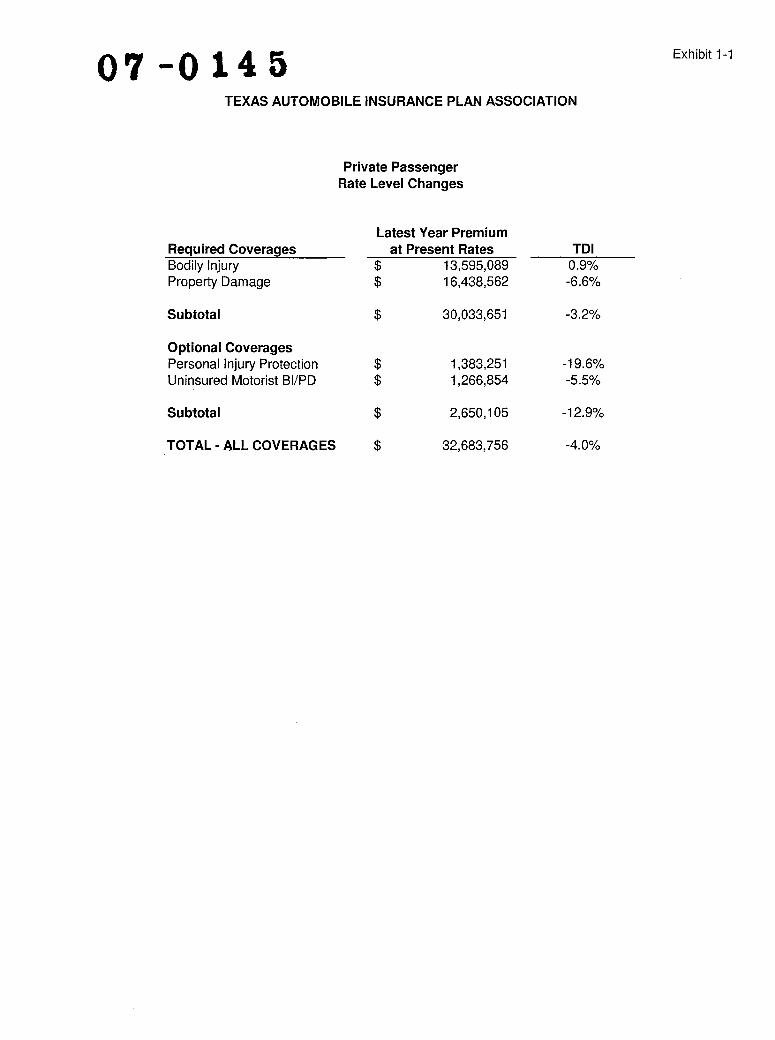
Bodily InjuryProperty DamageSubtotalOptional Coverages
Uninsured Motorist BI/PDSubtotalTOTAL-ALL COVERAGES
0'1-0145 Exhibit 1-1
TEXAS AUTOMOBILE INSURANCE PLAN ASSOCIATION
-19.6%
Required Coverages Rate Level ChangesInjury Protection
-12.9% at Present Rates30,033,65132,683,75613,595,0891,266,854-5.5%-6.6%-3.2%0.9% PrivateTOI $$$$$$$ Passenger1,383,25116,438,5622,650,105-4.0%
Personal
Latest Year Premium

Exhibit 2-1 07 -014-5 TEXAS AUTOMOBILE INSURANCE PLAN ASSOCIATION
Private Passenger AutoExpense Summary
Variable Expenses
(1) (2) (3) (4)
Commission and Brokerage Taxes, Licenses and Fees
Underwriting Profit ContingenTotal Variable Expenses
Fees
cies
10.0% 2.0%
-1.0% 11.0%
(5) Fixed Expenses* 9.9%
(6) Permissible Loss, LAE and Ratio 89.0%
* See Exhibit 2-2

Year (1a)200220032004
Physical Damaqe
Year (1b)200220032004
Selected Expense Provisions:
OtherAcquisition(6)LiabilityPhys. Dam.Conversion from percentage in total market to
WrittenYear (11a)200220032004
Physical Damaqe
Year (11 b)200220032004
TotalFixed ExpenseYear (15)200220032004
o 7 - 0 1 4 5 TEXAS AUTOMOBILE INSURANCE PLAN ASSOCIATION Exhibit 2-2
Page 1 of 2 $3,570,595FixedFixedFixedFixed$77.71(3a)$37.24ExpenseExpenseExpenseExpenseExpenseExpense$306,757$235,138$217,754 Private Passenger Auto4.4%1.142WrittenWrittenDisallowedGeneralGeneralGeneral0.2%0.2% toto Trended4.3%PremiumPremiumPremiumPremiumPremiumPremiumPremium0.5%0.5%0.5%0.5% (13b)Premium(7) ServicesFewerTrend7.8%7.8%7.8%1.176$83.591.108$80.594.5%4.2% OtherOther4.4%4.4%$73.20$81.212,401,833,947$126,614$118,798(2a)(16)$450.53$481.67$481.576,708,202 $362.023,177,637,2723,221,151,646 $364.003,231,139,6542,428,489,171$3,779,743$3,716,631$2,835,713$2,777,208$2,921,025$157,886$170,379$73.29$80.71(4b)(9)(14a)(19)-$3.00-$3.00-$3.00(5b)$50.01$53.47$53.45$39.68$39.46(2b)RatioRatioRatioRatio4.3%4.3%8.0%7.9%7.9%7.9%7,149,6616,598,498toto $341.64$162,586$119,3882,442,642,532$68.63$78.21
ResultsAverage Development of Fixed Expense RatioWriting in Texas, AdjustedAdjusted for Texas Volume of Business Expense
(4a)for Policy$294,028$280,987$220,668AdjustmentAdjustmentAverageper Carper CarperperperCarCarCarPremium('OOO}Premium('OOO}Advertising(10)(13a)(14b)(18)(5a)Lenqth(17)(8)(3b)Expenses('OOQ)Expenses('OOQ)Expenses('OOQ)Expenses('OOQ)8.1%Exposures AverageAverageExpensesExpenses forAdjusted,TrendedAcquisitionAcquisition(12)WrittenWritten
Liabilityof All Companies
Liabilitypercentage in TAlPA From Insurance Expense Exhibits

Fixed Expenseper Car(19)$77.71$80.59$78.21
Fixed
CalendarYear (23)200220032004
ISelected Expense ProvisionsNotes:
07 --0.14 5 TEXAS AUTOMOBILE INSURANCE PLAN ASSOCIATION Exhibit 2-2
Page 2 of 2
Private Passenger Auto Development of Fixed Expense Ratio
From Insurance Expense Exhibits
Results of All Companies Writing in Texas, Adjusted for Texas Volume of Business
TAlPA TAlPA13.6%13.6%Present12.5%12.5%RatioRatio-3.6%-3.6%10.0%-3.6%10.0%1.0881.0881.088RatesLevelInstallmentFeeRatio11.8%12.8%9.2%at CurrentPremiumPremium at$656.19$645.82$627.35$24,692,253$30,909,397$26,474,196Average(26)(22)(20)(24)47,861RateExposuresExpenseExpenseExpenseFixedFixed PaymentAdiustment(27)(21 )(25)EarnedEarned37,63042,200AdjustedAdjustedAdjusted,Trended 9.9%
(1)-(5) Liability & Physical Damage written premium, other acquisition and general expense information from lEE
(6), (8) Selected Expense Provisions are 15/30/55 weighted averages
(11)-(12) Liability & Physical Damage written premium, and earned exposure information from QDERPT21
(13) =(11)/(12)
(14) =(13) * [ (6) - (7) + (8) - (9) - (10)]
(15) =(14a) + 0.5 * (14b)
(16) Expense Trend is 3.4% (17) =(15) * (16)
(18) Estimated reduction in cost of Yearly policy over 2 six month policies.
(19) =(17) + (18) (repeated on page 2 for convenience)
(20) OPIC, Schedule AIS-3, Sheet 2, Column 18
(21 ) OPIC, Schedule AIS-3, Sheet 2, Column 19
(22) =(20) / (21)
(23) =(19) / (22)
(24) =Ratio of voluntary to involuntary cancellations
(25) =(23) * (24)
(27) =(25) + (26)
.. Accident YearEnded 12/31/02(1)(2)(3) (4)(5)(6)
Trend RateLoss Trend
(7)(8)(9)(10)(11 )
Exhibit 3-10'1 -0 14 5 TEXAS AUTOMOBILE INSURANCE PLAN ASSOCIATION
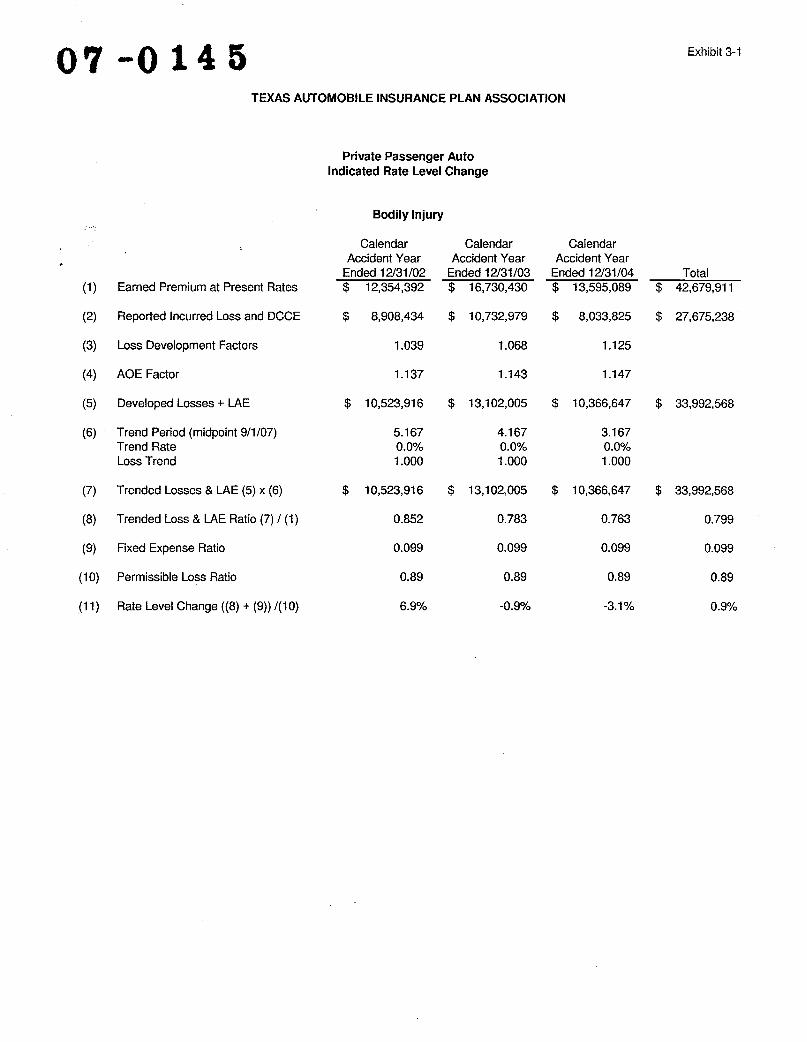
1.0680.0990.0990.099EarnedPermissible Loss Ratio 4.1670.0%0.0%0.783-3.1%1.125CalendarCalendarEndedEndedTotal12/31/03YearYear 1.0390.8521.1370.0%6.9%AOE Factor -0.9%1.1431.0001.000AccidentAccidentat Present12/31/04 Rates 1.0000.898,033,825 Premium1.1470.890.890.893.1670.9% 5.1670.763 0.09910,732,9798,908,434$$ 0.799 $$$$13,102,00513,102,00513,595,089TrendedTrendedReported Loss & LAE Ratio (7) Loss and DCCE1 (1)Fixed Expense Ratio42,679,91127,675,23810,523,91610,523,91616,730,43010,366,64710,366,64712,354,392TrendLoss Development Period (midpoint$$$$$$$$$$Incurred& LAE (5) x (6)Factors9/1/07)33,992,56833,992,568Developed LossesLosses + LAERate Level Change «8) + (9» 1(10) Private Passenger Auto Calendar
Indicated Rate Level Change
Bodily Injury
Accident YearEnded 12/31/02(1)(2)(3) (4)(5)(6)
Trend RateLoss Trend
(7)
.(9)(10)(11)
Exhibit 3-20'1-0145 TEXAS AUTOMOBILE INSURANCE PLAN ASSOCIATION
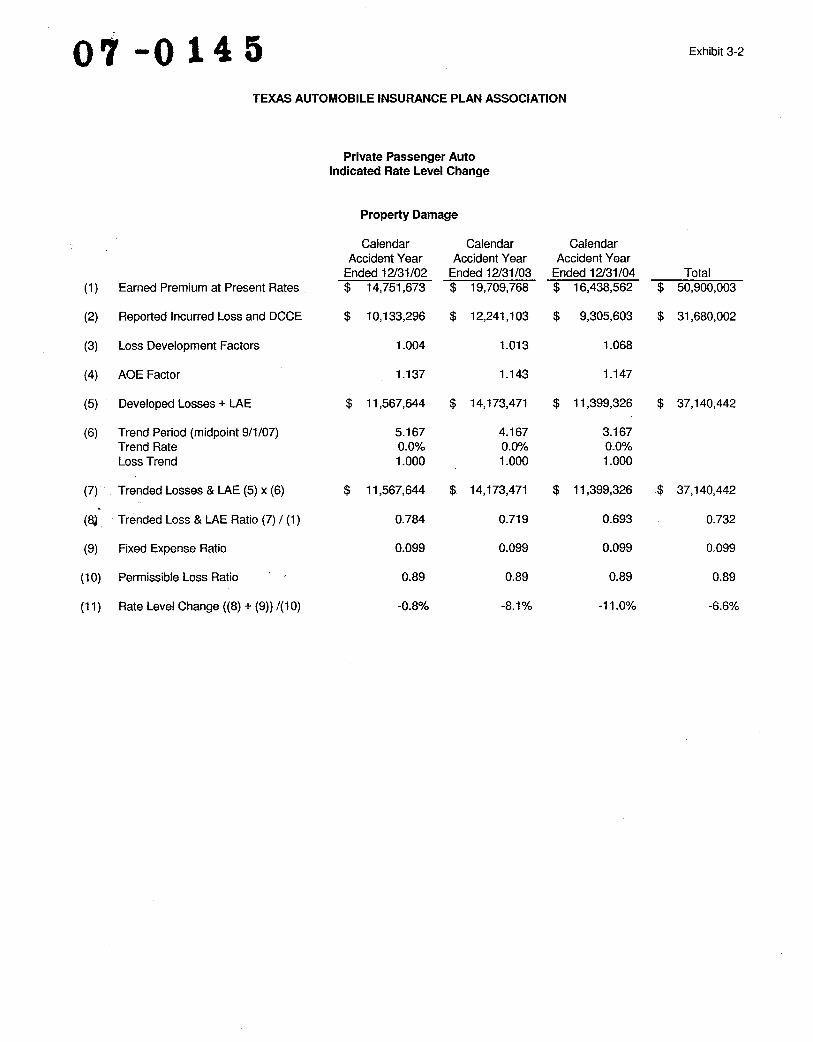
EarnedPermissible Loss Ratio 1.0131.1434.1670.0%0.0%0.7190.732-8.1%CalendarCalendar-6.6%at Present TotalYearYear Rates 1.0040.7841.137-0.8%0.0%AGE Factor 0.890.890.893.167EndedEnded 12/31/03 0.8950,900,00319,709,76811,567,64411,567,644 $$$$11,399,32611,399,32637,140,44237,140,44231,680,00216,438,56214,173,47114,173,47114,751,67310,133,2969,305,603 Premium$$$$$$$$$$$$ -11.0%0.0990.0990.0990.6931.1471.0001.0001.068AccidentAccident12/31/04 Private Passenger0.0995.1671.000 Auto12,241,103 Loss & LAE Ratio (7) / (1)TrendedTrendedFixed Expense ReportedDevelopedIncurred& LAE (5) x (6) +FactorsLAE9/1/07)Loss Development LossesLossesRatioLoss and DCCETrend Period (midpointRate Level Change «(8) + (9» /(10)(SJIndicated Rate Level Change
Calendar
Property Damage
Accident YearEnded 12/31/02(1)(2)(3) (4)(5)(6)
Trend RateLoss Trend
(7)(8)(9)(10)(11 )
Exhibit 3-307-0145 TEXAS AUTOMOBILE INSURANCE PLAN ASSOCIATION
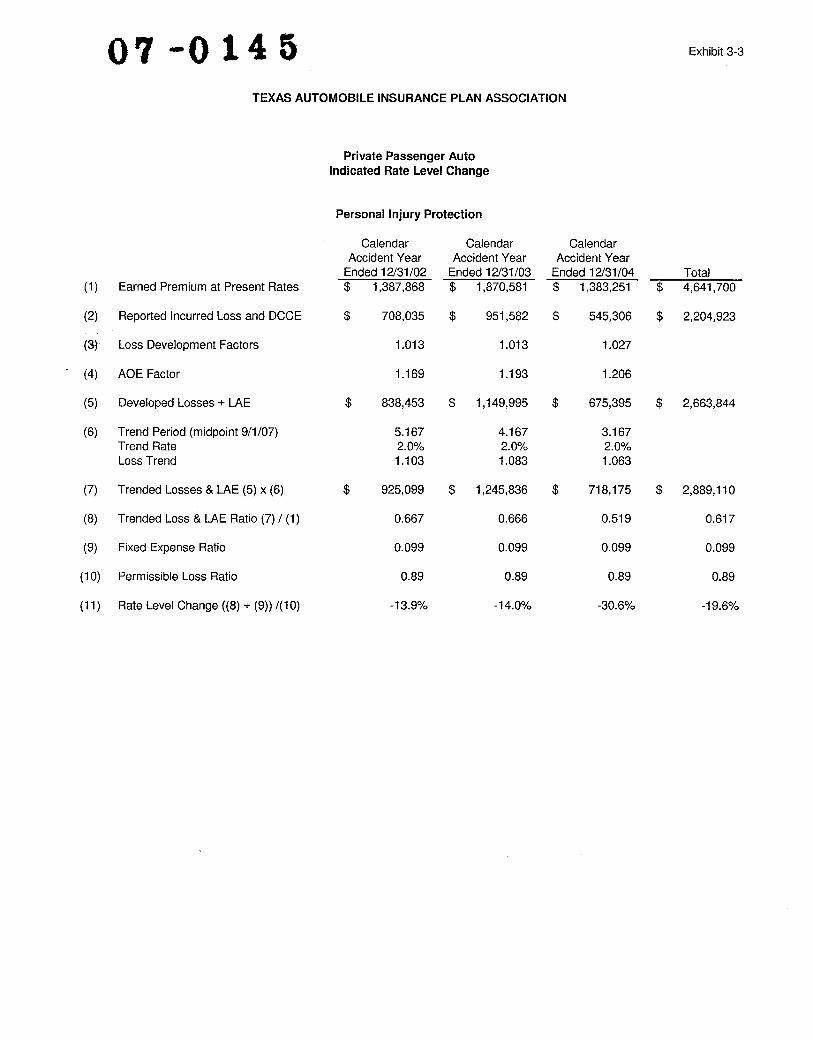
Permissible 1.063-30.6%4.1671.0130.0990.0990.099EndedEnded 12/31/0312/31/04 1.0132.0%1,383,2511,870,5811,387,868TrendedTrendedAGE Factor DevelopedEarned Premium 545,306718,175675,395951,582$$$$$$$ $$$$$ Loss Ratio 1.0271.2063.1670.5191.1931.0830.6662.0%2.0%0.617-14.0%-19.6%AccidentAccidentCalendarCalendarat Present TotalLoss and DCCE YearYear Rates $$$$ -13.9%0.0995.1671.1030.6671.1690.894,641,7002,204,9232,663,8442,889,1101,245,8361,149,995708,035Period (midpoint 9/1/07) Loss & LAE Ratio (7) / (1) IncurredLossesLossesRatio& LAE (5) x (6) +FactorsLAE Private Passenger AutoTrendFixed Expense Reported 0.890.890.89Loss Development925,099838,453Rate Level Change ((8) + (9)) /(10) Indicated Rate Level Change
Calendar
Personal Injury Protection

Accident YearEnded 12/31/02(1)(2)(3) (4)(5)(6)
Trend RateLoss Trend
(7)(8)(9)(10)
.-
07 "'0 14 5 Exhibit 3-4
TEXAS AUTOMOBILE INSURANCE PLAN ASSOCIATION
' 2,423,1103,867,3471,087,182TrendedTrendedTrendAGE Factor Reported763,600763,600$$$$$$ Loss & LAE Ratio (7) / (1) LossesLosses1.1474.1670.6801.0001.0000.890.890.891.0180.0%0.0%0.8070.0990.0990.0991.143AccidentAccidentCalendarCalendar1.8%-5.5%RatioTotal+12/31/04LAEYearYear $$$$ 0.0990.7395.1671.0001.137-5.8%Earned Premium~.' 1,567,5641,266,8541,265,0171,265,0171,032,929Loss Development Fixed Expense 672,955662,973$$$$$$ Factors2,890,0342,890,034Developed861,417861,417Rate Level Change {(8) Period (midpoint 9/1/07) , Incurred-12.5%0.7421.1163.167EndedEnded 12/31/03& LAE (5) x (6)at Present Loss and DCCE : +;;: 'J (9)) /(10) Rates 1.0130.0%0.89Private Passenger AutoPermissible Loss Rat~o(11 ) Indicated Rate Level Change
Calendar Uninsured/Underinsured Motorists

Line of InsuranceTrucks, Tractors & TrailersPOPIPsubtotalPublics
Taxi & limo POTaxi & limo PIPsubtotalSchool & Church Bus BISchool & Church Bus POSchool & Church Bus PIPsubtotalOther Bus BIOther Bus PDOther Bus PIPsubtotalVan Pools BIVan Pools POVan Pools PIPsubtotalTotal PublicsZone rated trucks
POsubtotalZone rated publics
POsubtotalTrucks & Publics
UMPOsubtotalGrand Total
07 -0 14 5 CA Exhibit 1
TEXAS AUTOMOBILE INSURANCE PLAN ASSOCIATION
23.6%-11.5%26.7%26.6%25.5%25.3%-5.3%25.1%24.4%20.5%to Loss Costs 17.2%16.2%CommercialEarned Premium 29Auto24.2%15.6%13.6%4.5% 64Transition26.7%24.9%25.9%-10.0%0.0%0.0%21.8%20.2%22.5%5.8%9.8% 1,086,565530,560134,263110,725111,53919,4369,59734 3,673,765228,25716,160Estimated Impact of 2,035,4311,031,3051,530,391920,671487,615270,765129,07750,49972,3476.5639,7189,7185.99317.42528.19513.13021,848 BIBIBITaxi & limo BIUMBI
AY2004Rate Level Changes

Variable Expenses(1)
(2)(3)(4)(5)(6)(7) Expected Loss and Allocated Loss Adjustment Expense Ratio
[1.000- (5) - (6)]* See CA Exhibit 2-2
CA Exhibit 2-1 0'7 -0 14 5 TEXAS AUTOMOBILE INSURANCE PLAN ASSOCIATION
1.5650.122-0.0100.0200.668Publics Commercial Auto -0.0100.2100.1000.0620.0200.172 0.6181.618Commission0.0500.0620.210Zones1.497Taxes, Licenses and Fees AdjustingUnderwritingFixed Expense Weighted & Ratio* Provision Special Tvpes Averaqeand other Expense Expenses [(1) + (2) + (3) + (4)]Total Variable Profit Contingencies Loss Cost Multiplier
(8) Loss Cost Multiplier [1 / (7)] Trucks &

TEXAS AUTOMOBILE INSURANCE PLAN ASSOCIATIONLiability
PremiumYear200220032004Physical Damaqe
PremiumYear200220032004Selected Expense Provisions: Acquisition(7)LiabilityPhys. Dam. Conversion from percentage in total market
EarnedPremiumYear200220032004Physical Damaqe (Trucks. Tractors. and Trailers)
EarnedPremiumsYear200220032004Adjusted
Fixed Expenseper ExposureYear200220032004 EarnedPremiumAdiustmentYear2002 2003200423.8%19.8%22.4%at CurrentPremiumPremiumPremiumPremiumPremiumPremium10.2%883.225.7%21.6%5.3% 88.855.8% TAlPA-0.4%-0.4%410.595.1% TAlPA 206.385.0%26.4% 84.19717.6414FixedExposuresFixedFixedFixedExposuresPhys Dam 416.13(10)430.13NetG(22)(9)50,062,118-4.0%-4.0%-4.0%General toGeneralGeneral to18.3%11.0%(18)(4b)5.8%759.76742,930Fee25.64914,9222,1271,785ExpensesExpensesExpensesExpensesExpenses44,836,952Ratio toRatioRatioRatioRatioRatioRatio to44,703,849(2b)(8)(16)(24)6.4%20.2%5.6%5.6%PaymentLevelExpenseExpenseExpenseExpenseExpenseExpenseExpense655,835758,581722,964Ratio151 ,546,559 102.91886,301,921308,007,1001.1041.1041.104(1b) (15)5.1% Premium199.786.1%5.4%5.4%90.0922.3%EarnedEarned23.9%& OA 233.13DisallowedInstallmentFixed OtherOtherSelected21.0% 16,683,9311,9925.5%5.5%5.5% 544,384,58446,601,58921.98 149,202,642817,99617,411,724307,694,52217,622,00473.20 549,281,33877.50 579,244,15022.70 152,894,74719,804,47746,474,757313,920,993861,386,57847,009,862895,943,00418,809,43118,353,470(14a)I per Exposureper Exposure(11 a)Exp%Adv(13a)Liability(3a)(17)(3b)AcquisitionAcquisition(4a)(23)(14b)AdjustedAdjusted(21 )(19)(5a)(5b)(12) (11b)(20)(1a) (13b)AverageAverage(2a)FixedRate Phys Dam AverageAverage
Liability (Trucks. Tractors. and Trailers)WrittenWritten Development of Fixed Expense Ratio Other CA Exhibit 2-20'7 5-0to percentage in TAlPA Commercial Auto
Data Sources: Insurance Expense Exhibits - Results of All Companies Writing in Texas, Adjusted for Texas Volume of Business, ca-liability 4.mdb, and ca-PhysDam 1.xls. Weights 15, 30, 55