00-G7/FM F4 pi-xvii
200
Author Team Jason Johnston Bryn Keyes Mary Doucette Antonietta Lenjosek Steve Thomas Margaret Sinclair Trevor Brown Cathy Heideman Don Jones Michael Davis Jennifer Paziuk Sharon Jeroski Ken Harper
Transcript of 00-G7/FM F4 pi-xvii

Author Team
Jason Johnston Bryn Keyes
Mary Doucette Antonietta Lenjosek
Steve Thomas Margaret Sinclair
Trevor Brown Cathy Heideman
Don Jones Michael Davis
Jennifer Paziuk Sharon Jeroski
Ken Harper

Publishing TeamLesley HaynesEnid HaleyLynne GulliverIngrid D’SilvaCristina GulesiuStephanie CoxJudy WilsonNicole Argyropoulos
Editorial ContributorsJohn BurnettJim MennieJanine LeblancChristina Yu
PublisherClaire Burnett
Elementary Math Team LeaderAnne-Marie Scullion
Product ManagerNishaant Sanghavi
Photo ResearchKaren Hunter
DesignWord & Image Design Studio Inc.
Copyright © 2005 Pearson Education Canada Inc.
ISBN 0-321-23536-3
Printed and bound in Canada.
1 2 3 4 5 -- TCP -- 09 08 07 06 05 04
All Rights Reserved. This publication is protectedby copyright, and permission should be obtainedfrom the publisher prior to any prohibitedreproduction, storage in a retrieval system, ortransmission in any form or by any means,electronic, mechanical, photocopying, recording, orlikewise. For information regarding permission,write to the Permissions Department.
The information and activities presented in thisbook have been carefully edited and reviewed.However, the publisher shall not be liable for anydamages resulting, in whole or in part, from thereader’s use of this material.
Brand names that appear in photographs ofproducts in this textbook are intended to providestudents with a sense of the real-worldapplications of mathematics and are in no wayintended to endorse specific products.
The publisher has taken every care to meet orexceed industry specifications for themanufacturing of textbooks. The spine and theendpapers of this sewn book have been reinforcedwith special fabric for extra binding strength. Thecover is a premium, polymer-reinforced materialdesigned to provide long life and withstandrugged use. Mylar gloss lamination has beenapplied for further durability.

iii
Program Consultants
Craig FeatherstoneMaggie Martin ConnellTrevor Brown
Assessment ConsultantSharon Jeroski
Elementary Mathematics Adviser John A. Van de Walle
Program Advisers
Pearson Education thanks its Program Advisers, who helped shape the vision forAddison Wesley Mathematics Makes Sense through discussions and reviews ofprototype materials and manuscript.
Anthony Azzopardi
Sandra Ball
Victoria Barlow
Lorraine Baron
Bob Belcher
Judy Blake
Steve Cairns
Christina Chambers
Daryl M. J. Chichak
Lynda Colgan
Marg Craig
Elizabeth Fothergill
Jennifer Gardner
Florence Glanfield
Linden Gray
Pamela Hagen
Dennis Hamaguchi
Angie Harding
Andrea Helmer
Peggy Hill
Auriana Kowalchuk
Gordon Li
Werner Liedtke
Jodi Mackie
Lois Marchand
Becky Matthews
Betty Milne
Cathy Molinski
Cynthia Pratt Nicolson
Bill Nimigon
Stephen Parks
Eileen Phillips
Carole Saundry
Evelyn Sawicki
Leyton Schnellert
Shannon Sharp
Michelle Skene
Lynn Strangway
Laura Weatherhead
Mignonne Wood
Program Consultants and Advisers

iv
Field Testers
Pearson Education would like to thank the teachers and students who field-testedAddison Wesley Math Makes Sense 7 prior to publication. Their feedback and constructiverecommendations have helped us to develop a quality mathematics program.
Aboriginal Content Reviewers
Early Childhood and School Services DivisionDepartment of Education, Culture, and EmploymentGovernment of Northwest Territories:
Steven Daniel, Coordinator, Mathematics, Science, and Secondary EducationLiz Fowler, Coordinator, Culture Based EducationMargaret Erasmus, Coordinator, Aboriginal Languages
Grade 7 Reviewers
Judy BlaneyOISE/University of Toronto, ON
Michaela ClancySimcoe Muskoka Catholic DistrictSchool Board, ON
Tina ConlonNiagara Catholic District SchoolBoard, ON
Kelly DenholmeSchool District #43 (Coquitlam), BC
Gwen EmeryToronto District School Board, ON
Thomas FalkenbergSchool District #44 (NorthVancouver), BC
Norma FraserSchool District #83 (NorthOkanagan/Shuswap), BC
Rob D’IlarioNiagara Catholic District SchoolBoard, ON
AJ KeeneLakehead District School Board,ON
Linda LoFaroOttawa-Carleton Catholic SchoolBoard, ON
David MacLeanSchool District #43 (Coquitlam), BC
Becky MatthewsVictoria, BC
Jim McCannSimcoe County District SchoolBoard, ON
Timothy T. MillanToronto District School Board, ON
Mark MoorhouseLakehead District School Board,ON
Walter RogozaRainy River District School Board,ON
Wendy SwonnellSchool District #61 (GreaterVictoria), BC
James TremblayDurham Catholic District SchoolBoard, ON
Gregg WilliamsonHamilton-Wentworth DistrictSchool Board, ON
Program Reviewers

v
Cross Strand Investigation: Making a Booklet 2
Patterns in Whole Numbers
Skills You’ll Need 6
1.1 Numbers All Around Us 10
1.2 Factors and Multiples 14
Game: The Factor Game 18
1.3 Squares and Square Roots 19
Mid-Unit Review 22
1.4 Exponents 23
The World of Work: Hospital Administrator 27
1.5 Number Patterns 28
Reading and Writing in Math: Using Different Strategies 32
Unit Review 34
Practice Test 37
Unit Problem: Fibonacci Numbers 38
Ratio and Rate
Skills You’ll Need 42
2.1 What Is a Ratio? 45
2.2 Equivalent Ratios 49
2.3 Comparing Ratios 53
Mid-Unit Review 57
2.4 Applications of Ratios 58
2.5 What Is a Rate? 62
Reading and Writing in Math: Organizing a Math Notebook 66
The World of Work: Race Engineer 68
Unit Review 69
Practice Test 71
Unit Problem: Who’s the Smartest? 72
Table of Contents
• Number Sense and Numeration• Patterning and Algebra
Strand
• Number Sense and NumerationStrand

vi
Geometry and Measurement
Skills You’ll Need 76
3.1 Sketching Views of Solids 78
Technology: Using a Computer to Draw Views of Solids 82
3.2 Sketching Solids 84
The World of Work: Forensic Graphics Specialist 88
3.3 Building Objects from Nets 89
Mid-Unit Review 93
3.4 Using Variables in Measurement Formulas 94
3.5 Surface Area of a Rectangular Prism 97
3.6 Volume of a Rectangular Prism 101
Reading and Writing in Math: Decoding Word Problems 104
Unit Review 106
Practice Test 109
Unit Problem: Making Food for a Bake Sale 110
Cross Strand Investigation: Ratios in Scale Drawings 112
Fractions and Decimals
Skills You’ll Need 116
4.1 Combining Fractions 120
Game: Join the Dots 123
4.2 Adding Fractions Using Models 124
4.3 Adding Fractions 128
4.4 Subtracting Fractions Using Models 132
4.5 Subtracting Fractions 136
Game: Shade One 139
Mid-Unit Review 140
4.6 Exploring Repeated Addition 141
Technology: Fractions to Decimals 144
4.7 Multiplying Decimals 145
4.8 Dividing Decimals 149
The World of Work: Advertising Sales Representative 153
4.9 Order of Operations with Decimals 154
Reading and Writing in Math: Writing a Math Journal Entry 156
Unit Review 158
Practice Test 161
Unit Problem: Publishing a Book 162
Cumulative Review Units 1-4 164
• Geometry and Spatial Sense• Measurement
Strand
• Number Sense and NumerationStrand

vii
Data Management
Skills You’ll Need 168
5.1 Collecting Data 169
Technology: Using Databases to Find Data 172
5.2 Recording Data 174
5.3 Stem-and-Leaf Plots 179
The World of Work: Meteorologist 183
Mid-Unit Review 184
Technology: Using Fathom to Investigate Scatter Plots 185
5.4 Line Graphs 188
Technology: Using Spreadsheets to Record and Graph Data 193
5.5 Applications of Mean, Median, and Mode 198
5.6 Evaluating Data Analysis 202
Reading and Writing in Math: Making a Study Sheet 206
Unit Review 208
Practice Test 211
Unit Problem: Organizing a Winter Carnival 212
Measuring Perimeter and Area
Skills You’ll Need 216
6.1 Area of a Parallelogram 217
6.2 Area of a Triangle 221
Mid-Unit Review 225
6.3 Area and Perimeter of a Trapezoid 226
The World of Work: Measuring for Construction 231
Reading and Writing in Math: Interpreting a Problem 232
6.4 Measuring Irregular Figures 234
Game: Trapezoid Challenge 238
Unit Review 239
Practice Test 241
Unit Problem: Designing a Patio 242
• Data Management and ProbabilityStrand
• Measurement• Patterning and Algebra
Strand

viii
Geometry
Skills You’ll Need 246
7.1 Classifying Figures 250
7.2 Congruent Figures 255
Mid-Unit Review 260
7.3 Transformations 261
7.4 Tiling Patterns 266
7.5 Using Transformations to Make Designs 270
Technology: Using a Computer to Transform Figures 274
Reading and Writing in Math: Choosing a Strategy 278
The World of Work: Office Space Planner 280
Unit Review 281
Practice Test 283
Unit Problem: Tessellations 284
Cross Strand Investigation: Pick’s Theorem 286
Working with Percents
Skills You’ll Need 290
8.1 Relating Fractions, Decimals, and Percents 292
Game: Showdown 296
8.2 Estimating and Calculating Percents 297
8.3 Multiplying to Find Percents 302
Mid-Unit Review 305
8.4 Drawing Circle Graphs 306
8.5 Dividing to Find Percents 311
Reading and Writing in Math: Choosing a Strategy 314
The World of Work: Sports Trainer 316
Unit Review 317
Practice Test 319
Unit Problem: At the Shopping Mall 320
Cumulative Review Units 1-8 322
• Geometry and Spatial SenseStrand
• Number Sense and Numeration• Data Management and Probability
Strand

ix
Integers
Skills You’ll Need 326
9.1 What Is an Integer? 327
9.2 Comparing and Ordering Integers 330
9.3 Representing Integers 334
9.4 Adding Integers with Tiles 337
9.5 Adding Integers 341
Mid-Unit Review 345
9.6 Subtracting Integers with Tiles 346
9.7 Subtracting Integers 351
Reading and Writing in Math: Choosing a Strategy 356
The World of Work: Historian 358
Unit Review 359
Practice Test 361
Unit Problem: What Time Is It? 362
Patterning and Algebra
Skills You’ll Need 366
10.1 Number Patterns 368
10.2 Graphing Patterns 373
10.3 Variables in Expressions 378
Mid-Unit Review 382
10.4 Evaluating Algebraic Expressions 383
10.5 Reading and Writing Equations 387
10.6 Solving Equations 390
The World of Work: Clothes Buyer 395
Reading and Writing in Math: Choosing a Strategy 396
Unit Review 398
Practice Test 401
Unit Problem: Fund Raising 402
• Patterning and AlgebraStrand
• Number Sense and NumerationStrand

x
Probability
Skills You’ll Need 406
11.1 Listing Outcomes 407
11.2 Experimental Probability 411
Mid-Unit Review 415
11.3 Theoretical Probability 416
11.4 Applications of Probability 420
Reading and Writing in Math: Choosing a Strategy 424
Game: Empty the Rectangles 426
Unit Review 427
Practice Test 429
Unit Problem: Games of Chance 430
Cross Strand Investigation: A Population Simulation 432
Cumulative Review Units 1-11 434
Extra Practice 438
Illustrated Glossary 451
Index 458
Acknowledgments 462
Answers 465
• Data Management and ProbabilityStrand

xi
Math helps you understand your world.
This book will help you improve your problem-solving skills and show you how you can use yourmath now, and in your future career.
The opening pages of each unit are designed to helpyou prepare for success.
Find out What You’ll Learn and Why It’s Important. Check the list of Key Words.
Welcome toAddison Wesley Math Makes Sense 7

xii
Review some of the math concepts you’ve already met.
In each Lesson:
Explore an idea orproblem. You may usematerials.
Reflect & Shareyour results with otherstudents.
Then try the Checkquestions to reviewyour skills.
Study the Example.

xiii
Connectsummarizes themath.
Examples showyou how to usethe ideas.
Stay sharp with Number Strategies,Mental Math, and Calculator Skills.
Take It Further questions offerenrichment and extension.
Reflect on the bigideas of the lesson.
Practicequestionsreinforce themath.

xiv
Use the Mid-Unit Review to refreshyour memory of key concepts.
Reading and Writing in Math helps youunderstand how reading and writing about mathdiffers from other language skills you use. It maypresent problem solving strategies or problems foryou to solve.
What Do I Need toKnow? summarizeskey ideas from the unit.
What Should I BeAble to Do? allowsyou to find out if you areready to move on. Theon-line tutorial etextprovides additionalsupport.

xv
The Practice Test models the kind oftest your teacher might give.
The Unit Problem presentsproblems to solve, or a project todo, using the math of the unit.
Keep your skills sharp with Cumulative Review and Extra Practice.

xvi
Explore someinteresting mathwhen you do theCross StrandInvestigations.
Icons remind you to use technology.Follow the step-by-step instructions for usinga computer or calculator to do math.

xvii
Play a Game with yourclassmates or at home toreinforce your skills.
The World of Work describeshow people use mathematics intheir careers.
The Illustrated Glossary is a dictionaryof important math words.

2 Cross Strand Investigation
Materials:
• sheets of newsprintmeasuring25 inches by 38 inches
Making a BookletCross
StrandInvestigation
Work with a partner.
A book is made up of signatures. A signature has 16 or 32 pages.A signature is a sheet of paper printed on both sides, in a specialarrangement. The sheet is measured in inches. The dimensions for the sheet in this Investigation are 25 inches by 38 inches.This is approximately 64 cm by 97 cm.This sheet of paper is then folded into sections of 16 or 32 pages.When the sheet of paper is folded and cut in some places,the pages read in the correct numerical order.
As you complete this Investigation, include all your work in areport that you will hand in.
Part 1Here are both sides of a 16-page signature.The pages are from 1 to 16.
There are patterns in the numbers on a signature. These patterns help the printer decide which page numbers go on each side ofa sheet when it goes on press.
Your challenge will be to find the patterns in the numbers on asignature. How would knowing these patterns help you create abook with more than 32 pages?
! How many folds are needed to make a 16-page signature?Fold a 25-inch by 38-inch piece of paper in half, several times,to find out.
14 3
13 4

Making a Booklet 3
Write the page numbers consecutively on the pages.Open the sheet of paper.Where are all the even numbers? Where are all the odd numbers?What else do you notice about the page numbers?What patterns do you see in the page numbers?
! The 2nd signature has pages 17 to 32.Draw a sketch. Show both sides of this signature with page numbers in place.
! Look for patterns in the numbers.How do these patterns compare with those in the 1st signature?
Part 2Here are both sides of a 32-page signature.
! Repeat the steps in Part 1 for this 32-page signature.Describe all the patterns you discover.
! Find some books in the school or class library.Calculate how many signatures each book might have.
Take It FurtherSuppose you have to create a 64-page signature.How can you use the number patterns in Parts 1 and 2 to helpyou create a 64-page signature?
2 31
5 28

There are many patterns you can see innature. You can use numbers todescribe many of these patterns.
At the end of this unit, you willinvestigate a famous set of numbers,the Fibonacci Numbers. You will explorethese numbers, and find how they canbe used to describe the breeding ofanimals, such as rabbits.
Think about the different patterns you learned in earlier grades.Give an example of each type of pattern.
What You’ll Learn• Use mental math, paper and pencil,
calculators, and estimation to solve problems.• Justify your choice of method for calculations.
• Find factors and multiples of numbers.• Find the greatest common factor and lowest common multiple of two numbers.
• Identify prime and composite numbers.• Use exponents to represent repeated multiplication.
• Identify and extend number patterns.• Choose and justify strategies for solving problems.
Why It’s Important• You need to know an
appropriate and efficient method for calculations.
• You need to be able to find common denominators for fraction calculations.

Key Words• factor• prime number• composite number• greatest common
factor (GCF)• multiple• lowest common
multiple (LCM)• square number• square root• exponent form• base• exponent• power• cube number• perfect square• perfect cube

RoundingThe place-value chart below shows the number 1 234 567.
To round:Look at the digit to the right of the place to which you are rounding.Is this digit 5 or greater?If it is, add 1 to the place digit.If it is not, leave the place digit as it is.Change all the digits to the right of the place digit to 0.
Example 1
a) Round 425 to the nearest ten. b) Round to the nearest thousand.i) 2471 ii) 13 999
Solution
a)
425 rounded to the nearest ten is 430.
b) i)
2471 rounded to the nearest thousand is 2000.
Millions Hundred thousands Ten thousands Thousands Hundreds Tens Ones
1 2 3 4 5 6 7
Hundreds Tens Ones
4 2 5 This number is 5.
So, add 1 ten to this number to get 3 tens.Then, replace 5 with 0.
So, this number does not change.Replace each number to the right of 2 with 0.
This number is less than 5.
6 UNIT 1: Patterns in Whole Numbers
Thousands Hundreds Tens Ones
2 4 7 1

ii)
13 999 rounded to the nearest thousand is 14 000.
1. Round to the nearest ten.a) 36 b) 42 c) 75 d) 361
2. Round to the nearest hundred.a) 311 b) 789 c) 625 d) 2356
Multiplying by 10, 100, 1000To multiply a whole number:– by 10, write 0 after the number.– by 100, write 00 after the number.– by 1000, write 000 after the number.
Example 2
Multiply.a) 32 ! 10 b) 478 ! 100 c) 51 ! 1000d) 32 ! 20 e) 47 ! 300
Solution
a) 32 ! 10 " 320 b) 478 ! 100 " 47 800 c) 51 ! 1000 " 51 000d) 32 ! 20 " 32 ! 2 ! 10 e) 47 ! 300 " 47 ! 3 ! 100
" 64 ! 10 " 141 ! 100" 640 " 14 100
Skills You’ll Need 7
Ten thousands Thousands Hundreds Tens Ones
1 3 9 9 9
This number is greater than 5.
So, add 1 thousand to this number to get 4 thousands.Replace each number to the right of 4 with 0.
"

8 UNIT 1: Patterns in Whole Numbers
"
3. Find.a) 3 ! 10 b) 1000 ! 5 c) 131 ! 10 d) 100 ! 63
4. Use a place-value chart. Explain why we can write zeros after a number when wemultiply by 10, 100, or 1000.
5. Multiply.a) 50 ! 72 b) 18 ! 600 c) 4000 ! 33
Mental Math
Example 3
Use mental math.a) 53 ! 6 b) 308 # 56 $ 6 c) 197 # 452
Solution
a) 53 ! 6 b) 308 # 56 $ 6
50 ! 6 # 3 ! 6 56 $ 6 " 50
" 300 # 18 Then: 308 # 50 " 358
" 318
c) 197 # 452197 " 200 $ 3
Then: 200 # 452 $ 3 " 652 $ 3 Count back to subtract.
" 649
6. Use mental math.a) 4 # 17 b) 9 # 8 c) 12 # 6d) 20 # 6 e) 40 # 30 f) 17 $ 2g) 22 $ 4 h) 70 $ 20 i) 20 $ 15
7. Use mental math. Explain your strategy.a) 28 # 13 # 12 b) 2 ! 29 ! 5 c) 98 # 327d) 4 ! 981 ! 25 e) 99 ! 21 f) 62 ! 8
"

Divisibility RulesA number is divisible by:
• 2 if the number is even
• 3 if the sum of its digits is divisible by 3
• 4 if the number represented by the last 2 digits is divisible by 4
• 5 if the last digit is 0 or 5
• 6 if the number is divisible by 2 and 3
• 8 if the number represented by the last 3 digits is divisible by 8
• 9 if the sum of the digits is divisible by 9
• 10 if the last digit is 0
Example 4
Which of these numbers is 1792 divisible by?a) 2 b) 3 c) 4 d) 5 e) 6
Solution
a) 1792 is divisible by 2 because 1792 is an even number.b) 1 # 7 # 9 # 2 " 19
19 is not divisible by 3, so 1792 is not divisible by 3.c) The last 2 digits are 92.
92 % 4 " 23Since the last 2 digits are divisible by 4, 1792 is divisible by 4.
d) 1792 is not divisible by 5 because the last digit is not 0 or 5.e) Since 1792 is not divisible by 3, 1792 is also not divisible by 6.
8. Which numbers are divisible by 3?
a) 490 b) 492 c) 12 345
9. Write 4 other numbers greater than 400 that are divisible by 3.
10. Which numbers are divisible by 6?a) 870 b) 232 c) 681
11. Which numbers from 1 to 10 is:a) 660 divisible by? b) 1001 divisible by?
Skills You’ll Need 9
"

Work on your own.Read the articles above and at the left.
! Which numbers do you think are exact? Which numbers are estimates? Explain your thinking.
! Use the numbers in the articles.Write a problem you would solve each way:
• using mental math
• by estimating
• using pencil and paper
• using a calculator! Solve your problem.! Trade problems with a classmate.
Solve your classmate’s problem.
Reflect & ShareCompare the strategies you used to solve the problems.
• Explain why some strategies work while others may not.
• Is one strategy more effective? Why?
10 UNIT 1: Patterns in Whole Numbers
1.1 Numbers All Around UsJustify the choice of strategy when solving problems.Focus
We use numbers to understand and describe our world.

Example
Solution
• When the numbers are easy to handle, use mental math.
• When the problem has too many steps, use a paper and pencil.
• When an approximate answer is appropriate and to check reasonableness, estimate.
• When a more accurate answer is needed and the numbers are large, use a calculator.
The population of Canada was 30 750 000 in July 2000.Statistics Canada (Stats Can) data show that there were 6367 telephones per 10 000 people in that year.a) About how many telephones were there in Canada in 2000?b) Find the exact number of telephones in Canada in 2000.c) How did Stats Can know there were 6367 phones per 10 000
people? Explain how this answer affects the answer to part b.
a) Estimate.Round 30 750 000 to the nearest ten million: 30 000 000Round 6367 to the nearest thousand: 600010 000 people use about 6000 phones.10 000 000 people use about 6000 ! 1000, or 6 000 000 phones.30 000 000 people use about 6 000 000 ! 3, or 18 000 000 phones.There were about 18 million phones in Canada in 2000.
b) Find how many groups of 10 000 people there are in 30 750 000.That is, 30 750 000 % 10 000 " 3075For each group of 10 000 people, there were 6367 phones.The number of phones: 3075 ! 6367 " 19 578 525So, there were 19 578 525 phones in Canada in 2000.
c) Stats Can conducted a survey of about 40 000 people.It asked how many phones each person had.Stats Can then calculated how many phones per 10 000 people.
To find out exactly how many phones there are in Canada,Stats Can would have to survey the entire population. This is impractical. So, the number of phones in part b is an estimate.
1.1 Numbers All Around Us 11
Use a calculator.

1. Solve without a calculator.a) 72 # 43 b) 123 # 85 c) 672 # 189d) 97 $ 24 e) 195 $ 71 f) 821 $ 485g) 65 ! 100 h) 14 ! 75 i) 83 ! 25j) 780 % 10 k) 724 % 4 l) 245 % 7
2. Use pencil and paper to find each answer.a) 6825 # 127 b) 7928 $ 815 c) 3614 $ 278d) 138 ! 21 e) 651 % 21 f) 6045 % 15
3. Estimate each answer. Explain the strategy you used each time.a) 103 # 89 b) 123 $ 19c) 72 ! 9 d) 418 % 71
Questions 4 to 7 pose problems about the 1997 Red River Flood inManitoba. Use mental math, estimation, pencil and paper, or acalculator. Justify your strategy.
4. The 1997 Red River Flood caused over $815 036 000 in damages.a) Write this amount in words.b) How close to $1 billion were the damages?
5. Pauline Thiessen and fellow volunteers made an average of10 000 sandwiches every day for 2 weeks to feed the flood relief workers. How many sandwiches did they make?
6. Winnipeg used 6.5 million sandbags to hold back the flood. Eachsandbag was about 10 cm thick. About how high would a stack of6.5 million sandbags be in centimetres? Metres? Kilometres?
7. To help with the flood relief, Joe Morena of St. Viateur Bagels in Montreal trucked 300 dozen of his famous bagels to Manitoba.a) How many bagels did he send?b) Joe sells bagels for $4.80 a dozen.
What was the value of his donation?
8. The Monarch butterfly migrates from Toronto to El Rosario,Mexico. This is a distance of 3300 km.A monarch butterfly can fly at an average speed of 15 km/h.How long does the migration flight take?
12 UNIT 1: Patterns in Whole Numbers
Multiply.
3.6 ! 1000 3.6 ! 1003.6 ! 10 3.6 ! 13.6 ! 0.1 3.6 ! 0.01
What patterns do you see in the questions andthe answers?
Mental Math
9. Estimate each answer. Is each estimate high or low? How do you know?a) 583 # 702 b) 3815 $ 576 c) 821 % 193 d) 695 % 310
For questions 10 and 11: Make up a problem using the given data.Have a classmate solve your problems.
10. Sunil earns $7 per hour. He works 4 h per day during the weekand 6 h per day on the weekends.
11. In October 1954, Hurricane Hazel blew through Toronto,Ontario. Winds reached 124 km/h, 111 mm of rain fell in 12 h,and over 210 mm of rain fell over 2 days.
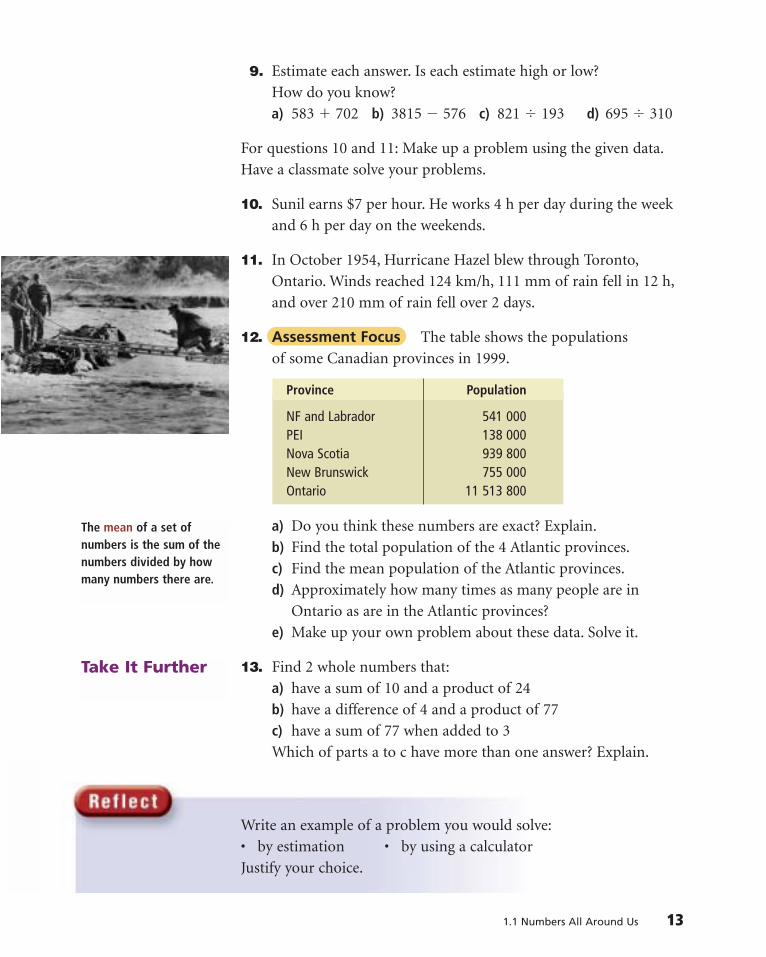
12. Assessment Focus The table shows the populations of some Canadian provinces in 1999.
a) Do you think these numbers are exact? Explain.b) Find the total population of the 4 Atlantic provinces.c) Find the mean population of the Atlantic provinces.d) Approximately how many times as many people are in
Ontario as are in the Atlantic provinces?e) Make up your own problem about these data. Solve it.
13. Find 2 whole numbers that:a) have a sum of 10 and a product of 24b) have a difference of 4 and a product of 77c) have a sum of 77 when added to 3Which of parts a to c have more than one answer? Explain.
Write an example of a problem you would solve:• by estimation • by using a calculatorJustify your choice.
1.1 Numbers All Around Us 13
Take It Further
Province Population
NF and Labrador 541 000PEI 138 000Nova Scotia 939 800New Brunswick 755 000Ontario 11 513 800
The mean of a set ofnumbers is the sum of thenumbers divided by howmany numbers there are.

Work with a partner.! Analyse the numbers in the circles.
Use a table to record the factors of each number.Cross out the number itself.Find the sum of the remaining factors.
! Look for patterns among your results.Why do you think a number is called “Abundant,” “Deficient,”or “Perfect”?
! Copy the 3 circles. Based on your ideas, place each number from 2 to 30 in the appropriate circle. What do you notice?
! Use your observations to predict where 36 and 56 belong.Check your predictions.
Reflect & ShareShare your results with another pair of students.What relationships did you see? How did you describe each type of number?
14 UNIT 1: Patterns in Whole Numbers
1.2 Factors and MultiplesGenerate factors and multiples of given numbers.Focus
Just as numbers can describe our world, we canuse numbers to describe other numbers. We candescribe a number by its factors, by the numberof its factors, and by the sum of its factors.
Abundant Deficient Perfect
18
12
15
8
7
6
20
Number Factors Sum of Factors
12 of 96 an even number
a factor of 144 a multiple of 6
6 × 8 double 24
4 dozen

1.2 Factors and Multiples 15
Example 1
Solution
! Recall that a factor is a number that divides exactly into another number.For example, 1, 2, 3, and 6 are the factors of 6.Each number divides into 6 with no remainder.
A prime number has only 2 factors, itself and 1.2, 3, and 5 are prime numbers.All prime numbers are deficient.
A composite number has more than 2 factors.8 is a composite number because its factors are 1, 2, 4, and 8.Composite numbers can be deficient, abundant, or perfect.
1 has only one factor, so 1 is neither prime nor composite.
When we find the factors that are the same for 2 numbers,we find common factors.
Show the factors of 12 and 30 in a Venn diagram.What is the greatest common factor (GCF) of 12 and 30?
Find pairs of numbers that divide into 12 exactly.12 % 1 " 12 1 and 12 are factors.12 % 2 " 6 2 and 6 are factors.12 % 3 " 4 3 and 4 are factors.Stop at 3 because the next number, 4, is already a factor.The factors of 12 are 1, 2, 3, 4, 6, and 12.
Find the factors of 30.30 % 1 " 30 1 and 30 are factors.30 % 2 " 15 2 and 15 are factors.30 % 3 " 10 3 and 10 are factors.30 % 5 " 6 5 and 6 are factors.
Mark the factors on the Venn diagram.Place the common factors in the overlapping region.The GCF of 12 and 30 is 6.
Use the divisibility rules.
Factors of 12
Factors of 30
4
12
36
515
10
30
12

Example 2
Solution
! The multiples of a number are found by multiplying the number by 1, by 2, by 3, by 4, and so on, or by skip counting.When we find multiples that are the same for 2 numbers, we findcommon multiples.We can use a 100 chart to find multiples and common multiples.
a) Use a 100 chart to find the common multiples of 12 and 21.b) Find the lowest common multiple (LCM) of 12 and 21.
a)
b) Multiples of 12 are 12, 24, 36, 48, 60, 72, 84, 96, …Multiples of 21 are 21, 42, 63, 84, …The LCM is 84.
1. List 4 multiples of each number.a) 5 b) 7 c) 8
2. Find the factors of each number. Explain how you did it.a) 18 b) 20 c) 28 d) 36 e) 37 f) 45
3. Find the factors of each number.a) 50 b) 51 c) 67 d) 75 e) 84 f) 120
16 UNIT 1: Patterns in Whole Numbers
1 2 3 4 5 6 7 8 9 10
11 12 13 14 15 16 17 18 19 20
21 22 23 24 25 26 27 28 29 30
31 32 33 34 35 36 37 38 39 40
41 42 43 44 45 46 47 48 49 50
51 52 53 54 55 56 57 58 59 60
61 62 63 64 65 66 67 68 69 70
71 72 73 74 75 76 77 78 79 80
81 82 83 84 85 86 87 88 89 90
91 92 93 94 95 96 97 98 99 100
The multiples of 12are blue.The multiples of 21are shaded green.The commonmultiple is blue andshaded green.

4. Is each number prime or composite? How do you know?a) 18 b) 13 c) 9 d) 19 e) 61 f) 2
5. Find the GCF of each pair of numbers.Which strategy did you use?a) 10, 5 b) 12, 8 c) 15, 25 d) 9, 12 e) 18, 15
6. Use a 100 chart. Find the LCM of each pair of numbers.a) 3, 4 b) 2, 5 c) 12, 18 d) 10, 25 e) 27, 18
7. Can a pair of numbers have:a) more than one common multiple?b) more than one common factor?Use a diagram to explain your thinking.
8. Julia and Sandhu bought packages of granola bars.a) Julia had 15 bars in total. Sandhu had 12 bars in total.
How many bars could there be in one package? b) What if Julia had 24 bars and Sandu had 18 bars?
How many bars could there be in one package? Draw a diagram to explain your thinking.
9. Assessment Focus Kevin, Alison, and Fred work part-time. Kevin works every second day. Alison works every third day. Fred works every fourth day. Today they all workedtogether. When will they work together again? Explain how you know.
10. The numbers 4 and 16 could be called “near-perfect”.Why do you think this name is appropriate? Find another example of a near-perfect number.What strategy did you use?
What is the difference between a factor and a multiple?Is a factor ever a multiple? Is a multiple ever a factor?Use diagrams, pictures, or a 100 chart to explain.
1.2 Factors and Multiples 17
Number Strategies
Three CDs cost $12.99,$8.18, and $7.88 (tax included).
Approximately how much change shouldthere be from $40.00?

18 UNIT 1: Patterns in Whole Numbers
YOU WILL NEEDOne gameboard;2 coloured markers
NUMBER OF PLAYERS 2
GOAL OF THE GAME To circle factors ofa number
HOW TO PLAY THE GAME:
1. Roll a number cube. The person with the greater number goes first.
2. Player A circles a number on the game board and scores that number. Player B uses a different colour to circle all the factors of that number not already circled. She scores the sum of the numbers she circles.
For example, suppose Player A circles 18.Player B circles 1, 2, 3, 6, and 9 (18 is already circled) to score 1 # 2 # 3 # 6 # 9 " 21 points
3. Player B circles a new number.Player A circles all the factors of that number not already circled. Record the scores.
4. Continue playing.If a player choosesa number with nofactors left tocircle, the numberis crossed out. Theplayer loses her orhis turn, and scoresno points.
For example, if player A circled 16, but 1, 2, 4, and 8 have already been circled, he would lose his turn and score no points.
5. The game continues until all numbers have been circled or crossed out. The player with the higher score wins.
What is the best firstmove? What is theworst first move? Why?How does this gameinvolve factors,multiples, and prime numbers?
The Factor Game

Work with a partnerThis chart shows the number of factors of each whole number.
Look for patterns and relationships in this chart.Find the factors of the numbers with two factors.What do you notice?Describe the numbers with four or more factors.Describe the numbers that have an odd number of factors.
Reflect & ShareOne way to describe a number with an odd number of factors is tocall it a square number.Why do you think this name is used? Draw pictures to support your explanation.
The factors of a composite number occur in pairs.For example, 48 % 2 " 24 2 and 24 are factors of 48.When the quotient is equal to the divisor, the dividend is a square number.For example, 49 % 7 " 7, so 49 is a square number.
1.3Find the squares and square roots ofwhole numbers.
Focus
dividend divisor quotient
X
1
X
X
2
X
X
3
X
X
X
4
X
X
5
X
X
X
X
6
X
X
7
X
X
X
X
8
X
X
X
9
X
X
X
X
10
X
X
11
X
X
X
X
X
X
12
X
X
13
X
X
X
X
14
X
X
X
X
15
X
X
X
X
X
16
X
X
17
X
X
X
X
X
X
18
X
X
19
X
X
X
X
X
X
20
X
X
X
X
21
X
X
X
X
22
X
X
23
X
X
X
X
X
X
X
X
24
X
X
X
25
X
X
X
X
26
X
X
X
X
27
X
X
X
X
X
X
28
X
X
29
X
X
X
X
X
X
X
X
30
Squares and Square Roots
1.3 Squares and Square Roots 19

Example 2
Solution
Example 1
Solution
We can get 49 by multiplying the whole number, 7, by itself.49 " 7 ! 7We write: 7 ! 7 " 72
We say: 7 squared
• One way to model a square number is to draw a square.This square has area 9 square units.The side length is !9", or 3 units.We say: A square root of 9 is 3.
• When we multiply a number by itself, we square the number.Squaring a number and taking its square root are inverse operations. That is, they undo each other.7 ! 7 " 49 !49" "!72"so, 72 " 49 " 7
Find the square of each number.a) 5 b) 15 c) 32
a) 52 " 5 ! 5 b) 152 " 15 ! 15 c) 322 " 32 ! 32" 25 " 225 " 1024
Use a calculator.
Draw a diagram to find a square root of each number.a) 16 b) 36
a) On grid paper, draw a square with area 16 square units.The side length ofthe square is 4 units.So, !16" " 4
b) On grid paper, draw a square with area 36 square units.The side length ofthe square is 6 units.So, !36" " 6
20 UNIT 1: Patterns in Whole Numbers
Other inverse operationsare addition andsubtraction,multiplicationand division
9squareunits
16squareunits
36squareunits

1. Find.a) 82 b) 162 c) 12 d) 292
2. Find the square of each number.a) 4 b) 17 c) 13 d) 52
3. a) Find the square of each number.i) 1 ii) 10 iii) 100 iv) 1000
b) Use the results of part a. Predict the square of each number.i) 10 000 ii) 1 000 000
4. Use grid paper. Find a square root of each number.a) 16 b) 4 c) 900 d) 144
5. Calculate the side length of a square with each area.a) 100 m2 b) 64 cm2 c) 81 m2
6. Order from least to greatest.a) !36", 36, 4, !9" b) !400", !100", 19, 15
7. Which whole numbers have squares between 50 and 200?
8. Assessment Focus Which whole numbers have square rootsbetween 1 and 20? How do you know?
9. A large square room has an area of 144 m2.a) Find the length of a side of the room.b) How much baseboard is needed to
go around the room?c) Each piece of baseboard is 2.5 m long.
How many pieces of baseboard are needed?
10. A garden has an area of 400 m2.The garden is divided into 16 congruent square plots.What is the side length of each plot?
How can you find the perimeter of a square when you know its area?Use an example to explain.
1.3 Squares and Square Roots 21
Number Strategies
Chris had saved$145.98 by June. Hespent $2.25 in July,$4.50 in August, and$9.00 in September.If Chris’ spendingpattern continues,when will he have less than $5.00?

1. The table shows the most commonsurnames for adults in the United Kingdom.
a) Approximately how many adults have one of these three names? To which place value did you estimate? Explain your choice.
b) Exactly how many more Smithsare there than Jones? Explain.
c) Write your own problem about these data. Solve your problem.Justify your strategy.
2. In one week, Joe worked 23 h cutting grass. He was paid $9/h.From this money, Joe bought 5 tickets for a football game, at $15 per ticket, and 2 DVDs for $21 each, including tax. Howmuch money did Joe have left?
3. Find all the factors ofeach number.a) 35 b) 24
4. Find 2 factors of each number.a) 6 b) 10c) 14 d) 15e) 9 f) 21
5. Organize the first 8 multiples of6 and 8 in a Venn diagram.
6. For the numbers 15 and 6, find:a) the GCF b) the LCM
7. a) Why is 7 a prime number?b) Why is 8 not a prime number?
8. Can three consecutive whole numbers all be primes? Justify your answer.
9. A square patio has an area of81 m2. How long is each side?
10. Find.a) !49" b) 82
c) !100" d) the square of 9
11. Find two squares with a sum of 100.
12. Write 100 as a square number and as a square root of a number.
13. Explain why:!1" " 1
22 UNIT 1: Patterns in Whole Numbers
LESSON
1.1
1.2
1.3
Surname NumberSmith 538 369Jones 402 489Williams 279 150
Multiples of 6 Multiples of 8

1.4 Exponents 23
1.4 ExponentsUse exponents to represent repeated multiplication.
Focus
Work with a small group.You will need 65 interlocking cubes.The edge length of each cube is 1 unit.The volume of each cube is 1 cubic unit.
! How many different ways can you make a larger cube?! What is the volume of each larger cube you make?
What is its edge length?! Use factors to write the volume of each cube.! Record your results in a table.
Reflect & ShareObserve how the volume grows. Describe the growth using picturesor numbers. What other patterns do you see in the table?Use these patterns to help you write the volumes of the next 3 cubesin the pattern.
Number of Volume Edge Length Volume As Cubes (cubic units) (units) a Product
1 1 1 1 ! 1 ! 1
When numbers are repeated in multiplication,we can write them in exponent form.
For example, we can write 2 ! 2 ! 2 ! 2 as 24.2 is the base.4 is the exponent.24 is the power.
We say: 2 to the power of 4, or 2 to the 4th
24 is a power of 2.
24power
base
exponent

If we graph the power against the exponent, we see how quickly thepower gets very large.
Square numbers and cube numbers are special powers.
! A power with exponent 2 is a square number.The area of a square is side length ! side length.This square has side length 4 cm.Area " 4 cm ! 4 cm
" 16 cm2
Here are 3 ways to write 16:Standard form: 16Expanded form: 4 ! 4Exponent form: 42
42 is a power of 4.16 is called a perfect square.
! A power with exponent 3 is a cube number.The volume of a cube is edge length ! edge length ! edge length.This cube has edge length 4 cm.Volume " 4 cm ! 4 cm ! 4 cm
" 64 cm3
Here are 3 ways to write 64:Standard form: 64Expanded form: 4 ! 4 ! 4Exponent form: 43
43 is a power of 4.64 is called a perfect cube.
24 UNIT 1: Patterns in Whole Numbers
Exponent Power
1 21 = 22 22 = 43 23 = 84 24 = 165 25 = 32
4 cm
4 cm
4 cm
4 cm
4 cm
48
121620242832
0 1 2 3 4 5
Pow
er
Exponent

1.4 Exponents 25
Example 1
Solution
Example 2
Solution
Write in exponent form.a) 6 ! 6 b) 5 ! 5 ! 5 c) 32
a) 6 ! 6 " 62 b) 5 ! 5 ! 5 " 53
c) 32 " 2 ! 2 ! 2 ! 2 ! 2 " 25
Write in expanded form and standard form.a) 35 b) 74
a) 35 b) 74
" 3 ! 3 ! 3 ! 3 ! 3 " 7 ! 7 ! 7 ! 7 " 243 " 2401
A calculator can be used to simplify a power such as 35.For a scientific calculator, the keystrokes are:
or to display 243
For a non-scientific calculator, use repeated multiplication.The keystrokes are:
to display 243
1. Write the base of each power.a) 24 b) 32 c) 73 d) 105 e) 69 f) 83
2. Write the exponent of each power.a) 25 b) 32 c) 71 d) 95 e) 810 f) 104
3. Write in expanded form.a) 24 b) 103 c) 65 d) 42 e) 21 f) 54
4. Write in exponent form.a) 3 ! 3 ! 3 ! 3 b) 2 ! 2 ! 2 c) 5 ! 5 ! 5 ! 5 ! 5 ! 5d) 10 ! 10 ! 10 e) 79 ! 79 f) 2 ! 2 ! 2 ! 2 ! 2 ! 2 ! 2 ! 2
3 5 ENTER^ 3 5yx ENTER
3 "! " " "

5. Write in exponent form, then in standard form.a) 5 ! 5 b) 3 ! 3 ! 3 ! 3c) 10 ! 10 ! 10 ! 10 ! 10 d) 2 ! 2 ! 2e) 9 ! 9 ! 9 f) 2 ! 2 ! 2 ! 2 ! 2 ! 2 ! 2
6. Write in standard form.a) 24 b) 103 c) 35 d) 73 e) 28 f) 41
7. Write as a power of 10. How did you do it?a) 100 b) 10 000 c) 100 000d) 10 e) 1000 f) 1 000 000
8. Write as a power of 2. Explain your method.a) 4 b) 16 c) 64 d) 256 e) 32 f) 2
9. What patterns do you see in the pairs of numbers? Which is the greater number in each pair? Explain how you know.a) 23 or 32 b) 25 or 52 c) 34 or 43 d) 54 or 45
10. Write these numbers in order from least to greatest:35, 52, 34, 63. How did you do this?
11. Simplify.a) 312 b) 73 c) 56 d) 48 e) 98 f) 223
12. Assessment Focusa) Express each number in exponent form in as many different
ways as you can.i) 16 ii) 81 iii) 64
b) Find other numbers that can be written in exponent form, inmore than one way. Show your work.
13. Write in exponent form:a) the number of small squares on a checkerboardb) the area of a square with side length 5 unitsc) the volume of a cube with edge length 9 units
When you see a number, how can you find out if it is a perfectsquare, or a perfect cube, or neither? Give examples.
26 UNIT 1: Patterns in Whole Numbers
Calculator Skills
A case of 24 cans of popcosts $7.49 at a localgrocery store. A varietystore charges customers$1.25 for 1 can. Howmuch more money is thevariety store making?
The World of Work: Hospital Administrator 27
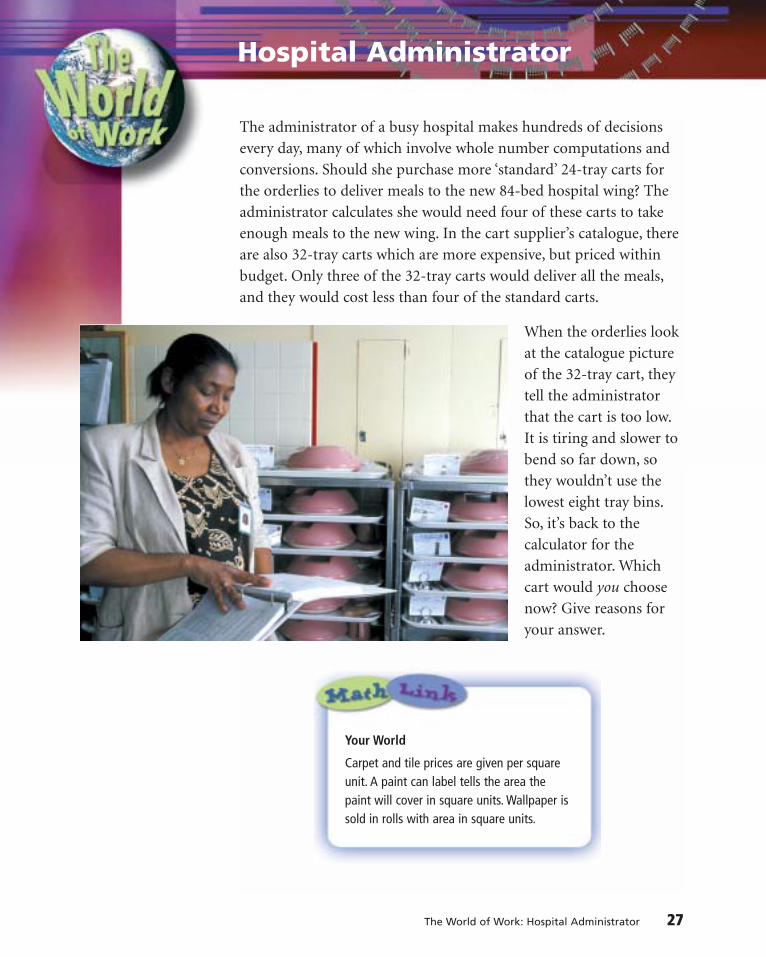
The administrator of a busy hospital makes hundreds of decisionsevery day, many of which involve whole number computations andconversions. Should she purchase more ‘standard’ 24-tray carts forthe orderlies to deliver meals to the new 84-bed hospital wing? Theadministrator calculates she would need four of these carts to takeenough meals to the new wing. In the cart supplier’s catalogue, thereare also 32-tray carts which are more expensive, but priced withinbudget. Only three of the 32-tray carts would deliver all the meals,and they would cost less than four of the standard carts.
When the orderlies lookat the catalogue pictureof the 32-tray cart, theytell the administratorthat the cart is too low.It is tiring and slower tobend so far down, sothey wouldn’t use thelowest eight tray bins.So, it’s back to thecalculator for theadministrator. Whichcart would you choosenow? Give reasons foryour answer.
Your World
Carpet and tile prices are given per squareunit. A paint can label tells the area thepaint will cover in square units. Wallpaper issold in rolls with area in square units.
Hospital Administrator

Work on your own.Blaise Pascal lived in France in the 17th century.He was 13 years old when he constructed the triangle below.This triangle is called Pascal’s Triangle.
1 row 11 1 row 2
1 2 1 row 31 3 3 1 row 4
1 4 6 4 1 row 51 5 10 10 5 1 row 6
! What patterns do you see in the triangle?! What symmetry do you see in the triangle?
Reflect & ShareCompare your patterns with those of a classmate.Together, write about three different patterns you see in the triangle.
Here are some of the patterns in Pascal’s Triangle.Sum
! Each row begins and ends with 1. 1 1After the second row, each number 1 1 2is the sum of the 2 numbers above it. 1 2 1 4To write row 7: 1 3 3 1 8Start with 1. 1 4 6 4 1 16Add: 1 # 5 " 6 1 5 10 10 5 1 32Add: 5 # 10 " 15 1 6 15 20 15 6 1 64Add: 10 # 10 " 20, and so on
! The sum of the numbers in each row is shown above,and in the table on the next page.From the 2nd row on, the sums can be written as powers.
28 UNIT 1: Patterns in Whole Numbers
1.5 Number PatternsDescribe, extend, and explain patterns.Focus

1.5 Number Patterns 29
Row 2 3 4 5 6 7Sum in standard form 2 4 8 16 32 64Sum in exponent from 21 22 23 24 25 26
Example
Solution
We can use this table to predict the sum of the numbers in any row. All sums are powers of 2.The exponent is 1 less than the row number.So, the 10th row has sum: 29 " 512And the 19th row has sum: 218 " 262 144
! The 3rd numbers in each row have this pattern: 1, 3, 6, 10, 15, ...To get each term in the pattern, we add 1 more than we added before. We can use this to extend the pattern.The 5th term: 15The 6th term: 15 # 6 " 21The 7th term: 21 # 7 " 28, and so on
Describe each pattern in words. Write the next 3 terms.a) 4, 9, 14, 19, … b) 1, 3, 9, 27, … c) 1, 3, 7, 13, 21, …
a) 4, 9, 14, 19, …Start at 4.Add 5 to get the next number.The next 3 terms are 24, 29, 34.
b) 1, 3, 9, 27, …Start at 1.Multiply by 3 to get the next number.The next 3 terms are 81, 243, 729.
c) 1, 3, 7, 13, 21, …Start at 1.Add 2.Increase the number added by 2 each time.The next 3 terms are 31, 43, 57.

30 UNIT 1: Patterns in Whole Numbers
1. Write the next 3 terms in each pattern.a) 7, 9, 11, 13, … b) 1, 5, 25, 125, …c) 4, 7, 10, 13, … d) 1, 10, 100, 1000, …e) 20, 19, 18, 17, … f) 79, 77, 75, 73, …
2. Write the next 3 terms in each pattern.a) 3, 4, 6, 9, … b) 1, 4, 9, 16, …c) 101, 111, 121, 131, … d) 1, 12, 123, 1234, …e) 1, 4, 16, 64, … f) 256, 128, 64, 32, …
3. Describe each pattern in words.Write the next 3 terms.a) 200, 199, 201, 198, … b) 4, 7, 12, 19, …c) 100, 99, 97, 94, … d) 2, 6, 12, 20, …e) 50, 48, 44, 38, … f) 2, 6, 18, 54, …
4. Create your own number pattern. Trade patterns with a classmate. Describe your classmate’s pattern.Write the next 3 terms.
5. a) Copy this pattern. Find each product.
99 ! 11 = ! 99 ! 111 = ! …99 ! 22 = ! 99 ! 222 = ! …99 ! 33 = ! 99 ! 333 = ! …
b) Extend this pattern sideways and down.Predict the next 6 terms in each row and column.
c) Check your predictions with a calculator.
6. This pattern shows the first 3 triangular numbers.
a) Draw the next 3 terms in the pattern.b) List the first 6 triangular numbers.c) Find the next 2 triangular numbers without drawing pictures.
Explain how you did this.
… …
Number Strategies
One can of popcontains 355 mL.About how many 2-L pop bottles can be filled with onecase of 24 cans of pop?
1 3 6

d) Add consecutive triangular numbers;that is, Term 1 # Term 2; Term 2 # Term 3; and so on.What pattern do you see? Write the next 3 terms in this pattern.
e) Subtract consecutive triangular numbers;that is, Term 2 $ Term 1; Term 3 $ Term 2; and so on.What pattern do you see? Write the next 3 terms in this pattern.
7. This pattern shows the first 3 cube numbers.
a) Sketch the next 3 cube numbers in the pattern.Use interlocking cubes if they help.
b) Write the next 3 cube numbers without drawing pictures.Explain how you did this.
8. Assessment Focusa) Write the first 10 powers of 2; that is, 21 to 210,
in standard form.b) What pattern do you see in the units digits?c) How can you use this pattern to find the units digit of 240?d) Investigate powers of other numbers.
Look for patterns in the units digits.Explain how you can use these patterns to find units digits for powers too large to display on the calculator.
9. Some sequences of numbers may represent different patterns.Extend each pattern in as many different ways as you can.Write the pattern rule for each pattern.a) 1, 2, 4, … b) 1, 4, 9, … c) 5, 25, …
Choose 3 different types of patterns from this section.Describe each pattern.Explain how you can use the pattern to predict the next term.
1.5 Number Patterns 31
Take It Further
1 278

Using Different Strategies
32 UNIT 1: Patterns in Whole Numbers
ProblemThere are 8 people at a party.Each person shakes hands with everyone else.How many handshakes are there?
Think of a strategyDraw a diagram and count.Draw 8 dots. Join every dot to every other dot.Count the line segments.
Number of line segments" 8 # 5 # 5 # 4 # 3 # 2 # 1" 28
There are 28 handshakes.
Solve simpler problems, then look for a pattern.
Make a table.Each time you add a person,you add one more handshake than the time before.So, 6 people: 10 # 5, or 15 handshakes7 people: 15 # 6, or 21 handshakes8 people: 21 # 7, or 28 handshakes
2 people 3 people 4 people 5 people1 handshake 3 handshakes 6 handshakes 10 handshakes
8 5 + 5 + 4 + 3 + 2 + 1
Number of Number ofPeople Handshakes
2 13 34 65 10
#2
#3
#4
Strategy 1:
Strategy 2:

Reading and Writing in Math: Using Different Strategies 33
Use reasoning.Each of 8 people shakes hands with 7 other people.That is, 8 ! 7, or 56 handshakesBut we have counted each handshake twice.We have said that A shaking hands with B isdifferent from B shaking hands with A.
So, we divide by 2: &526& " 28
There are 28 handshakes.
Look back• Look at the numbers of handshakes for 2 to 8 people.
Where have you seen this pattern before?• What if there were 9 people at the party?
How many handshakes would there be? How do you know?
ProblemsSolve each problem. Try to use more than one strategy.
1. A ball is dropped from a height of 16 m.Each time it hits the ground, the ball bounces to one-half its previous height. The ball is caught when its greatest height for thatbounce is 1 m. How far has the ball travelled?
2. A rectangular garden is 100 m long and 44 m wide.A fence encloses the garden.The fence posts are 2 m apart.How many posts are needed?
3. Here is a 5 by 5 square.How many squares of each different size can you find in this large square?
Why might you want to solve a problem more than one way?
Strategy 3:

_ A factor of a number divides into the number exactly;that is, there is no remainder.For example, 6 % 2 " 3, so 2 is a factor of 6.
_ A prime number has only 2 factors, itself and 1.For example, the only factors of 17 are 17 and 1, so 17 is a prime number.
_ A composite number has more than 2 factors.For example, 12 has factors 1, 2, 3, 4, 6, and 12, so 12 is a composite number.
_ A square number, or perfect square, has an odd number of factors.It can also written as a power with exponent 2.For example, the factors of 9 are 1, 3, and 9, so 9 is a perfect square.We write 9 " 32.
_ A square root of a number is a factor that is squared to get the number.For example, 9 is a square root of 81 because 92 " 81.We write !81" " 9.
_ When a number is written in exponent form, it is written as a power.For example, for the power 53:5 is the base.3 is the exponent.5 ! 5 ! 5 is the expanded form.125 is the standard form.
_ A cube number, or perfect cube, is a power with exponent 3.For example, 13 " 1, 23 " 8, 33 " 27, 43 " 64,so 1, 8, 27, and 64 are perfect cubes.
34 UNIT 1: Patterns in Whole Numbers
What Do I Need to Know?
"
"
"
"
"
"
"
Review any lesson with

Unit Review 35
1. Find each answer.Use pencil and paper.a) 3621 # 8921b) 5123 $ 4123c) 35 ! 12d) 125 ! 27e) 815 # 642 $ 85f) 1638 % 21
2. This table shows the highest all-time scorers at the end ofthe 2000–2001 NBA season.
a) What is the total number of points?
b) Write a problem about these data. Solve your problem.Justify the strategy you used.
3. a) Write the number 300 as thesum of 2 or more consecutivewhole numbers. Find as manyways to do this as you can.
b) What patterns do you see in the numbers added?
c) Suppose you started withanother 3-digit number.Will you see similar patterns?Investigate to find out.
4. Solve each problem. State any assumption you made.a) Armin’s house is 3 km from a
mall. He walks 1 km in 15 min.How long does it take Armin towalk to the mall?
b) Tana makes $15, $21, and $19 for baby-sitting one weekend.How much will Tana make in a month?
5. The table shows the ticket prices and number of tickets sold for a popular movie.
Calculate the total cost of the ticket sales.
6. Find all the factors of each number.a) 36 b) 50c) 75 d) 77
7. Find the first 10 multiples ofeach number.a) 9 b) 7c) 12 d) 15
8. For the numbers 18 and 60, find:a) the GCF b) the LCMDraw a Venn diagram to illustrate part a.
LESSON
1.1
1.2
What Should I Be Able to Do?
Ticket Price Number of ($) Tickets Sold
Adults 12 125Seniors 10 34Youths 8 61
Kareem Abdul-Jabbar 38 387Karl Malone 32 919Wilt Chamberlain 31 419Michael Jordan 29 277
For extra practice, go to page 438.

36 UNIT 1: Patterns in Whole Numbers
9. How many prime numbers are even? Justify your answer.
10. Find a square root ofeach number.a) 121 b) 169 c) 225
11. Find each square root.Draw a picture if it helps.
a) !25" b) !100" c) !81"
12. Calculate the area of a square with each side length.a) 7 cm b) 17 cm c) 93 m
13. The area of a square is 81 m2.What is the perimeter of the square? How do you know?
14. Raquel cooks 8-cm square hamburgers on a grill.The grill is a rectangle with dimensions 40 cm by 40 cm.How many hamburgers can be grilled at one time? Justify your answer.
15. Copy and complete this table.
16. A perfume formula requires 4 g of an essential oil per bottle.a) How many grams are needed
for 2500 bottles?b) Write this number in exponent
form.
17. Write these numbers in order from greatest to least.34, 44, 53, 26
18. a) Write the next 3 terms in each pattern.i) 3, 5, 6, 8, 9, …ii) 1, 2, 4, 8, …iii) 1, 4, 9, 16, …iv) 3, 4, 6, 9, …
b) Describe each pattern in part a.
19. a) Copy and complete this pattern.12 # 22 " !22 # 32 " !32 # 42 " !42 # 52 " !
b) Write the next two rows in the pattern.
c) Describe the pattern.
20. 12 " 112 # 22 " 512 # 22 # 32 " 1412 # 22 # 32 # 42 " 30a) Write the next two lines
in the pattern.b) What pattern do you see?
LESSON
1.5
Exponent Base Exponent Expanded StandardForm Form Form
a) 34
b) 25
c) 107
d) 5 4e) 4!4!4!4
1.3
1.4

Practice Test 37
1. Estimate. Describe your strategy.a) 624 # 1353 b) 897 % 23 c) 752 ! 36
2. Use mental math to evaluate 2 ! 395 ! 5. Explain your strategy.
3. Use a Venn diagram to show the factors of 48 and 18.Circle the GCF.
4. Use patterns to find the first 6 common multiples of 15 and 6.
5. Use the clues below to find the mystery number. Explain your strategy and reasoning.Clue 1: I am a 2-digit number.Clue 2: I am less than 92.Clue 3: I have 26 and 6 as factors.
6. Sharma plays basketball every third day of the month.She baby-sits her little brother every seventh day of the month. How many times in a month will Sharma have a conflictbetween basketball and baby-sitting? Explain your thinking.
7. Write these numbers in order from least to greatest.a) 52, 25, !25", 102, 33 b) 10 ! 10 ! 10, 23, !400", 32, 17
8. The perimeter of a square is 32 cm.What is the area of the square? Explain your thinking.Include a diagram.
9. Write the next 3 terms in each pattern. Describe each pattern.a) 1, 3, 6, 10, … b) 23, 25, 27, … c) 100, 81, 64, 49, …
10. Write the number 35 as:a) the sum of 3 squaresb) the difference between 2 squaresc) the sum of a prime number and a square
Factors of 18
Factors of 48

Unit Problem
38 UNIT 1: Patterns in Whole Numbers
Fibonacci Numbers
One of greatest mathematicians of the Middle Ages was an Italian,Leonardo Fibonacci.
Fibonacci is remembered for this problem:
A pair of rabbits is placed in a large pen.When the rabbits are two months old, they produce another pair of rabbits.Every month after that, they produce another pair of rabbits.Each new pair of rabbits does the same.None of the rabbits dies.How many rabbits are there at the beginning of each month?
This table shows the rabbits at the beginning of the first 5 months.
1. a) Continue the pattern for two more months.Use different colours to show the new rabbits.
b) Write the number of pairs of rabbits at the beginning ofeach month, for the first 7 months.These are the Fibonacci numbers.What pattern do you see? Explain how to find the next number in the pattern.
2. The Fibonacci sequence appears in the family tree of the drone,or male bee.The drone has a mother, but no father.Female bees are worker bees or queens.They have a mother and a father.The family tree of a male bee back to its grandparents is shown on the next page.
Beginning of Month Number of Pairs Number of Rabbits
1 1
2 1
3 2
4 3
5 5

Your work should show:
how you usedpatterns to find youranswers
all diagrams andcharts, clearlypresented
a clear explanationof your results
your understandingof Fibonaccinumbers
a) Copy the diagram. Trace the male bee’s ancestors back 5 more generations.
b) Explain how you can use this pattern to find the Fibonacci numbers.
There are many patterns you can find in the Fibonacci sequence.
3. Write the first 15 Fibonacci numbers.a) What type of number is every third number?b) Which number is a factor of every fourth number?c) Which number is a factor of every fifth number?
4. Add the squares of the:2nd and 3rd terms 3rd and 4th terms4th and 5th terms What do you notice? Write the next two lines ofthis pattern.
5. Research Fibonacci numbers. Make a poster to show your work.
"
"
"
"
queen drone
Check List
Unit Problem: Fibonacci Numbers 39
What have you learned about whole numbers?What have you learned about number patterns?Write about some of the things you have learned.

The animal kingdom provides muchinteresting information. We useinformation to make comparisons.What comparisons can you make fromthese facts?
A sea otter eats about !13! of its bodymass a day.
A Great Dane can eat up to 4 kg offood a day.
A cheetah can reach a top speed of110 km/h.
A human can run at 18 km/h.
The heart of a blue whale is the size of a small car.
One in 5000 North Atlantic lobsters is born bright blue.
WhatYou’ll Learn
• Understand what a ratio is.• Find equivalent ratios.
• Compare ratios and use them to solve problems.
• Understand what a rate is.• Find unit rates.
• Compare rates and use them to solve problems.
Why It’s ImportantYou use ratios and rates tocompare numbers andquantities; and to compareprices when you shop.

Key Words• ratio• part-to-whole ratio• part-to-part ratio• terms of a ratio• equivalent ratios• simplest form• rate• unit rate• average speed

!
42 UNIT 2: Ratio and Rate
Greatest Common FactorRecall that the greatest common factor (GCF) of a set of numbers is the greatest number that will divide exactly into the given numbers.For example, 6 is the greatest common factor of 18 and 24.
Example 1
Find the GCF of 24 and 30.
Solution
Draw a factor tree for each number.
Circle the numbers that appear in the bottom row of both factor trees.2 and 3 are common to both factor trees.The GCF of 24 and 30 is 2 " 3 # 6.
1. Find the GCF of the numbers in each set.a) 30, 75 b) 27, 63 c) 42, 56 d) 12, 18, 42
24
12
2 6
2 32
2
2
2
30
15
3 5
2
2

Skills You’ll Need 43
Lowest Common MultipleRecall that the lowest common multiple (LCM) of a set of numbers is the least number that is a multiple of each number in the set.This also means that each number in the set is a factor of the lowest common multiple.
Example 2
Find the LCM of 18 and 32.
Solution
Draw a factor tree for each number.
Circle the numbers that appear in the bottom row of both factor trees.Multiply the numbers not circled and one each of the circled numbers:3 " 3 " 2 " 2 " 2 " 2 " 2 # 288The LCM of 18 and 32 is 288.
2. Write the first 6 multiples of each number.a) 4 b) 7 c) 9 d) 12
3. Find the LCM of the numbers in each pair.a) 9, 12 b) 14, 35 c) 16, 40
4. Find the LCM of the numbers in each set.a) 36, 45 b) 3, 4, 6 c) 12, 15, 20
!
18
9
3 3
2
2
32
16
4 4
2
2
2
2 2 2 2

44 UNIT 2: Ratio and Rate
Converting among Metric Units100 cm = 1 m 1000 m = 1 km1000 g = 1 kg 1000 mL = 1 L
• To convert centimetres to metres, divide by 100.
• To convert:metres to kilometresgrams to kilograms Divide by 1000.millilitres to litres
• To convert metres to centimetres, multiply by 100.
• To convert:kilometres to metreskilograms to grams Multiply by 1000.litres to millilitres
Example 3
Convert.a) 650 cm to metres b) 82 km to metresc) 2.4 kg to grams d) 2840 mL to litres
Solution
a) 650 cm # !6150
00! m b) 82 km # 82 " 1000 m
# 6.5 m # 82 000 mc) 2.4 kg # 2.4 " 1000 g d) 2840 mL # !21
80
40
00! L
# 2400 g # 2.84 L
5. Convert.a) 1280 cm to metres b) 680 m to kilometresc) 2454 g to kilograms d) 1987 mL to litrese) 8.2 m to centimetres f) 1.25 km to metresg) 0.45 kg to grams h) 2.3 L to millilitres
!
Divide to convert to alarger unit.
Multiply to convert to a
smaller unit.

There are different ways to compare numbers.Look at these advertisements.
How are the numbers in each advertisement compared?Which advertisement is most effective? Explain.
2.1 What Is a Ratio? 45
2.1 What Is a Ratio?Use models and diagrams to investigate ratios.
Focus
Work with a partner.
How can you compare the number of blue counters to the number of yellow counters? How many different ways can you compare the counters? Write each way you find.

Example
Solution
Reflect & Share Share your list with another pair of classmates.Add any new comparisons to your list.Talk about the different ways you compared the counters.
Here is a collection of models.
" We can use a ratio to compare one part of the collection to the whole collection.There are 9 cars compared to 13 models.The ratio of cars to models is written as 9 to 13 or 9:13.
" We can use a ratio to compare one part of the collection to another part.There are 9 cars compared to 4 planes.The ratio of cars to planes is written as 9 to 4 or 9:4.9 and 4 are called the terms of the ratio.9 is the first term and 4 is the second term.
At a class party, there are 16 boys, 15 girls, and 4 adults.What is each ratio?a) boys to girls b) girls to adultsc) adults to total number of people at the party
a) There are 16 boys and 15 girls.So, the ratio of boys to girls is 16:15.
b) There are 15 girls and 4 adults.So, the ratio of girls to adults is 15:4.
c) The total number of people is 16 $ 15 $ 4 # 35.So, the ratio of adults to total number of people is 4:35.
46 UNIT 2: Ratio and Rate
This is a part-to-whole ratio.
This is a part-to-part ratio.

1. Look at the crayons below. Write each ratio.a) red crayons to the total number of crayonsb) yellow to the total number of crayonsc) blue crayons to green crayons
2. Use words, numbers, or pictures.Write a ratio to compare the items in each sentence.a) A student had 9 green counters and 7 red counters
on his desk.b) In a dance team, there were 8 girls and 3 boys.c) The teacher had 2 fiction and 5 non-fiction books
on her desk.
3. The ratio of T-shirts to shorts in Frank’s closet is 5:2.Write the ratio of T-shirts to the total number of garments.
4. a) What is the ratio of boys to girls in your class? b) What is the ratio of girls to boys?c) What is the ratio of boys to the total number of students in
your class?d) What if two boys leave the room?
What is the ratio in part c now?
5. a) Draw two different diagrams to show the ratio 3:5.b) Draw a diagram to show the ratio 7:1.
6. Maria shares some seashells with Jeff.Maria says, “Two for you, three for me, two for you, three for me …”Tonya watches.At the end, she says, “So Jeff got !23! of the shells.”Do you agree with Tonya? Give reasons for your answer.
2.1 What Is a Ratio? 47

7. A box contains 8 red, 5 green, 2 brown, 3 purple, 1 blue,and 6 yellow candles.a) Write each ratio.
i) red:purple ii) green:blueiii) purple:green iv) brown and yellow:total candles
b) What if 3 red, 2 green, and 4 yellow candles were burned? Write the new ratios for part a.
8. Assessment Focus Patrick plans to make salad. The recipe calls for 3 cups of cooked macaroni, 3 cups of sliced oranges,2 cups of chopped apple, 1 cup of chopped celery, and 2 cups of mayonnaise.a) What is the total amount of ingredients?b) What is the ratio of oranges to apples?
Mayonnaise to macaroni?c) What is the ratio of apples and oranges to the total amount
of ingredients?d) Patrick makes a mistake. He uses 2 cups of oranges instead of 3.
What are the new ratios in parts b and c?e) Write your own ratio problem about this salad.
Solve your problem.
9. a) Create four different ratios using these figures.
b) How can you change one figure to create ratios of 2:5 and 7:3? Explain.
Look in newspapers and magazines for examples of ratios.Cut out the examples. Paste them in your notebook.Explain how the ratios are used.What information can you get from them?
48 UNIT 2: Ratio and Rate
Number Strategies
What is the sum of all the prime numbersbetween 1 and 30?
Take It Further

Work on your own.Which cards have the same ratio of pepperoni pieces to pizzas?
Reflect & Share Share your answers with a classmate.Why do you think your answers are correct?What patterns do you see?
2.2 Equivalent Ratios 49
2.2 Equivalent RatiosWrite equivalent ratios.Focus

A ratio of 4:3 means that, for every 4 triangles, there are 3 squares.
A ratio of 8:6 means that, for every 8 triangles, there are 6 squares.
The ratios 8:6 and 4:3 are called equivalent ratios.Equivalent ratios are equal. 8:6 = 4:3
" An equivalent ratio can be formed by multiplying or dividing the terms of a ratio by the same number.
The equivalent ratios are:1:0.75; 2:1.5; 4:3; 8:6; 12:9; 16:12; 20:15
" The equivalent ratios can be shown on a grid.
The points representing the ratios lie on a straight line.
50 UNIT 2: Ratio and Rate
1 2 4 8 12 16 20
0.75 1.5 3 6 9 12 15
" 2" 3
" 4" 5
% 2% 4
" 2" 3
" 4" 5
% 2% 4
1st term 1 2 4 8 12 16 202nd term 0.75 1.5 3 6 9 12 15
Note that3 % 2 is !32! # 1.5
and3 % 4 is !34! # 0.75

Example
Solution
" When we divide the terms in a ratio by their greatest common factor, we write the ratio in simplest form.To write 24:16 in simplest form:
24:16 The GCF is 8. Divide by 8.# (24 % 8):(16 % 8)# 3:2So, 24:16 and 3:2 are equivalent ratios.The ratio 3:2 is in simplest form.
Construction kits come in different sizes.The Regular Kit contains 120 long rods, 80 short rods,and 40 connectors.a) What other kits could be created with the same ratio of rods
and connectors?b) One kit has 10 connectors. How many short and long rods
does it have?
a) Use a table to find equivalent ratios.Label each new kit.
b) Use the table in part a.The kit with 10 connectors is Kit D.It has 20 short rods and 30 long rods.
2.2 Equivalent Ratios 51
A ratio is in simplest formwhen its terms have nocommon factors.
Component Kit A Kit B Kit C Kit D Kit E Regular Kit Kit FLong Rods 3 6 15 30 60 120 240Short Rods 2 4 10 20 40 80 160Connectors 1 2 5 10 20 40 80
"2%2%4
%8%20%40
2468
10121416
0 4 8 12
2nd
Term
1st Term
Graph of Equivalent Ratios
16 20

52 UNIT 2: Ratio and Rate
Number Strategies
Find the greatestcommon factor of thenumbers in each set.
• 16, 40, 24
• 33, 77, 88
• 45, 75, 30
• 150, 75, 225
1. Write three ratios equivalent to each ratio.Use tables to show your work.a) 3:4 b) 14:4
2. Rewrite each sentence as a ratio statement in simplest form.a) In a class, there are 15 girls and 12 boys.b) In a parking lot, there were 4 American cars and
12 Japanese cars.c) A paint mixture is made up of 6 L of blue paint and
2 L of white paint.d) A stamp collection contains 12 Canadian stamps and
24 American stamps.
3. Name the pairs of equivalent ratios:2:3, 9:12, 8:5, 1:2, 2:1, 16:10, 3:6, 6:9, 5:8, 3:4Tell how you know they are equivalent.
4. In a class library, 3 out of 4 books are non-fiction.The rest are fiction.a) How many non-fiction books could there be?
How many fiction books?b) How many different answers can you find for part a?
Which answers are reasonable? Explain.
5. The official Canadian flag has a length to width ratio of 2:1.Doreen has a sheet of paper that measures 30 cm by 20 cm.What are the length and width of the largest Canadian flag Doreen can draw? Sketch a picture of the flag.
6. Assessment Focus Use red, blue, and green counters.Make a set of counters with these two ratios:red:blue # 5:6 blue:green # 3:4How many different ways can you do this?Record each way you find.
Choose a ratio. Use pictures, numbers, or words to show how to findtwo equivalent ratios.

Work with a partner.Recipe A for punch calls Recipe B for punch callsfor 2 cans of concentrate for 3 cans of concentrateand 3 cans of water. and 4 cans of water.
In which recipe is the punch stronger? Or are the drinks the same?Explain how you know.
Reflect & ShareCompare your answer with that of another pair of classmates.Compare strategies.If your answers are the same, which strategy do you prefer? Wouldthere be a situation when the other strategy would be better? Explain.If your answers are different, find out which is correct.
Erica makes her coffee with Jim makes his coffee with 2 scoops of coffee to 5 cups 3 scoops of coffee to 7 cupsof water. of water.
Here are two ways to find out which coffee is stronger.
2.3 Comparing Ratios 53
2.3 Comparing RatiosUse equivalent ratios to compare ratios.Focus

" Find how much water is used for 1 scoop of coffee.Erica Jim
1 scoop of coffee to 1 scoop of coffee to 2 !12! cups of water. 2 !13! cups of water.
Since 2 !13! is less than 2 !12!,Jim uses less water to 1 scoop of coffee.So, Jim’s coffee is stronger.
" Find how much coffee is used for the same amount of water.Write each mixture as a ratio.Write each ratio with the same second term,then compare the first terms.Use equivalent ratios.
Erica Jim
2:5 3:7
4:10 6:14
6:15 9:21
8:20 12:28
10:25 15:35
12:30
14:35
Since 2:5 # 14:35, Since 3:7 # 15:35,Erica uses 14 scoops of Jim uses 15 scoops ofcoffee to 35 cups of water. coffee to 35 cups of water.
Jim uses more coffee. So, Jim’s coffee is stronger.Notice that, as we multiply to get equivalent ratios,we get multiples of the terms of the ratios.That is, the first terms in Erica’s equivalent ratios are multiples of 2;the second terms are multiples of 5.
54 UNIT 2: Ratio and Rate
" 2
" 3
" 4" 5
" 6
" 7
" 2
" 3" 4
" 5

Example
Solution
A quicker way to write each ratio with the same second term is to find the lowest common multiple of the second terms.That is, the lowest common multiple of 5 and 7 is 35.
At the outdoor centre, there were the same numbers of boys andgirls. Five out of every 8 boys wanted to kayak. Two out of every 3 girls wanted to kayak. Do more boys than girls want to kayak?Explain.
Five out of every 8 boys want to kayak.This is a ratio of 5:8.Two out of every 3 girls want to kayak.This is a ratio of 2:3.To compare the ratios, write them with the second terms the same.The lowest common multiple of 8 and 3 is 24.Multiply to make the second term of each ratio 24.
Boys Girls5:8 2:3
# (5 " 3):(8 " 3) # (2 " 8):(3 " 8)# 15:24 # 16:2415 out of 24 boys 16 out of 24 girlswant to kayak want to kayak
Since 16 is greater than 15, more girls want to kayak.
1. The concentrate and water in each picture are mixed.Which mixture is stronger: A or B?Draw a picture to show your answer.
2. Two boxes contain pictures of hockey and basketball players.In one box, the ratio of hockey players to basketball players is 4:3.In the other box, the ratio is 3:2.The boxes contain the same number of pictures.a) What could the total number of pictures be?b) Which box contains more pictures of hockey players?
Draw a picture to show your answer.
A
B
2.3 Comparing Ratios 55

3. In a basketball game, Alison made 6 of 13 free shots.Madhu made 5 of 9 free shots. Who played better? Explain.
4. The principal is deciding which shade of blue to have the classrooms painted. One shade of blue requires 3 cans of white paint mixed with 4 cans of blue paint. Another shade of blue requires 5 cans of white paint mixed with 7 cans of blue paint.a) Which mixture will give the darker shade of blue? Explain.b) Which mixture will require more white paint?
5. Look at the two mixtures.a) What is the ratio of concentrate to water in A and in B?
b) Explain how you could add concentrate or water to make both ratios the same.Draw a picture to show your answer.
6. Assessment Focus The ratio of fiction to non-fiction books in Ms. Arbuckle’s class library is 7:5.The ratio of fiction to non-fiction books in Mr. Albright’s class library is 4:3.Each classroom has 30 non-fiction books.a) Which room has more fiction books? How many more?b) Mr. Albright added two non-fiction books to his class library.
Does this make the ratio the same in both classes? Explain.
7. At Ria’s party, there were 2 pizzas for every 3 people.At Amin’s party, there were 5 pizzas for every 7 people.At which party did each person get more pizza? Explain.
In one store, the ratio of DVDs to videos is 7:5.In another store, the ratio of DVDs to videos is 4:3.Explain why you cannot say which store has more DVDs.
56 UNIT 2: Ratio and Rate
Number Strategies
There are 10 coins that total $0.60.What are the coins?
A
B

Mid-Unit Review 57
1. In the school parking lot, there are 4 Japanese cars, 7 American cars,3 German cars, and 2 Korean cars.Write each ratio.a) American cars to Japanese carsb) German cars to Korean carsc) American cars to total number
of carsd) German cars to Japanese cars
and American cars
2. A box contains 5 cream chocolates,2 chocolate-covered almonds,and 3 caramel chocolates.a) What is each ratio? Sketch a
picture for each ratio.i) almond chocolates to
caramel chocolatesii) cream chocolates to
caramel chocolatesiii) cream chocolates to
all chocolatesb) Lesley ate one of each kind of
chocolate. What is each new ratio for part a?
3. In Mary’s closet, there are 7 T-shirts, 4 pairs of shorts,and 3 sweaters. Write each ratio.a) T-shirts to shortsb) sweaters to shortsc) sweaters to T-shirts and shorts
4. For each ratio, write three equivalent ratios.a) 5:3 b) 6:24
5. a) Write each ratio below in simplest form.
i) green squares to red squaresii) yellow squares to
purple squaresiii) red squares to total number
of squares b) State the colours for each ratio.
i) 1:6 ii) 2:5
6. In Ms. Bell’s class, the ratio of boys to girls is 5:4.a) There are 15 boys in the class.
How many girls are there?b) Two girls leave. What is the new
ratio of boys to girls?
7. A jug of orange juice requires 3 cansof orange concentrate and 5 cans ofwater.a) Accidentally, 4 cans of
concentrate were mixed with 5 cans of water. Is the mixture stronger or weaker than it should be? Explain.
b) Suppose 6 cans of water were mixed with 3 cans ofconcentrate. Is the mixture stronger or weaker than it should be? Explain.
LESSON
2.1
2.3
2.2

Example 1
Solution
2.4 Applications of RatiosUse ratios to solve problems.Focus
Work on your own.In the book Gulliver’s Travels, Gulliver meets little people who areonly 15 cm tall, and giants who are 18 m tall.Gulliver is 1.80 m tall.How many times as big as a little person is Gulliver?How many times as big as Gulliver is a giant?Write these comparisons as ratios.
Reflect & ShareCompare your answers with those of a classmate.Work together to find the ratio of the height of the giants to theheight of the little people.How many times as big as a little person is a giant?
You can use diagrams and tables to model and solve ratio problems.
Jolene makes a scale drawing of her home.She uses a scale of 5 cm to represent 1.5 m.a) What is the ratio of a length in the drawing to the actual length?
What does this ratio mean?b) Jolene measures her bedroom on the drawing. It is 16 cm long.
What is the actual length of Jolene’s bedroom?c) The house measures 18 m by 12 m.
What are the dimensions of the scale drawing?
a) Length in the drawing:actual length # 5 cm:1.50 m# 5 cm:150 cm# (5 cm % 5 cm):(150 cm % 5 cm)# 1:30
When you write ratios ofmeasurements, the units must be the same.Multiply 1.50 m by 100 tochange metres to centimetres.
58 UNIT 2: Ratio and Rate

2.4 Applications of Ratios 59
Example 2
16 cm ? cm
drawing
bedroom
Each 1 cm in the drawing represents 30 cm in the home.b) Draw a diagram.
The length in the drawing is 16 cm.Each 1 cm in the drawing represents 30 cm in the bedroom.So, the length of the bedroom is 16 " 30 cm # 480 cm
# 4.8 mc) Draw a diagram.
1 cm in the drawing represents 30 cm in the house.Divide each measurement in the house to find the measurement on the drawing.
Length in the drawing # !180300
cm!
# 60 cm
Width in the drawing # !120300
cm!
# 40 cm
The dimensions of the scale drawing are 60 cm by 40 cm.
Wallpaper paste can be made by mixing flour and water.The table shows the volume of water to be mixed with flour to makedifferent quantities of paste.
a) What is the ratio of the volume of water to the volume of flour?b) How much water is required for 15 mL of flour?
Water (mL) 16 32 48Flour (mL) 3 6 9

Solution a) Volume of water:volume of flour = 16:3b) Use a pattern to continue the table in part a.
For the water, the pattern rule is: Start at 16, then add 16.The next three terms are 64, 80, 96.For the flour, the pattern rule is: Start at 3, then add 3.The next three terms are 12, 15, 18.Extend the table to include these numbers.
From the table, 80 mL of water are needed for 15 mL of flour.
1. This table shows the quantities of concentrate and water needed to make punch.
a) What are the next two numbers in each row of the table?b) What is the ratio of cranberry concentrate to water?c) Suppose you use 10 cans of orange concentrate.
How much punch would you get?d) Suppose you use 12 cans of concentrate in total.
How much punch would you get?e) How much of each ingredient would you need to make 15 L
of punch? Explain your reasoning.
2. Jenny makes models of Canadian Coast Guard ships.She uses a scale of 3 cm to 1.5 m.a) What is the ratio of a length on the model to a length
on the ship?b) The Terry Fox ship is 88 m long. How long is the model?c) The model of the Otter Bay is 27 cm long.
What is the actual length of the Otter Bay?Draw diagrams to show your answers.
60 UNIT 2: Ratio and Rate
Mental Math
Find all the factors of each number.
7, 15, 27, 36, 48, 51
Water (mL) 16 32 48 64 80 96Flour (mL) 3 6 9 12 15 18
Orange concentrate (cans) 2 4 6Cranberry concentrate (cans) 1 2 3Water (cans) 3 6 9Punch (L) 1.5 3 4.5
Remember to convertthe units so you workwith all measurementsin the same units.

Social StudiesA scale on a provincial map is 1:1 500 000.This means that 1 cm on the map represents 1 500 000 cm on the ground, which is !1 50
1000
000! m, or 15 000 m on the ground.And, 15 000 m is !11
5000000! km, or 15 km.
So, a scale of 1:1 500 000 is 1 cm to 15 km.
3. A set designer builds a model of the stage and the different piecesof furniture on it. He uses a scale of 5 cm to 1 m.a) What is the ratio of a length on the model to
a length on the stage?b) The length of a table is 1.4 m.
What is the length of the model?c) The height of the model of a lamp is 3 cm.
What is the actual height of the lamp?d) The height of the model of an ornament is 0.5 cm.
What is the actual height of the ornament? How did you find out?
Draw diagrams to show your answers.
4. Janice builds a model using a scale of 2 cm to represent 3 m.Her friend William says she is using a ratio of 2:3.Is William correct? Explain.
5. This table shows the quantities of salt and water needed to make salt solutions.
a) How much salt would be needed for 7 L of water?b) How much water would be needed for 90 g of salt?
6. Assessment Focus Aston challenges his father to a 100-m race.Aston runs 4 m for every 5 m his father runs.a) Who wins the race? Draw a diagram to show your answer.b) How far will Aston have run when his father crosses
the finish line?c) Aston asks to race again but wants to be given a head start.
How much of a start should Aston’s father give him to make ita close race? Explain your answer.
Make up your own ratio problem.Solve your problem. Show your work.
2.4 Applications of Ratios 61
Water (L) 2 4 6 8Salt (g) 18 36 54 72

Work with a partner.You will need a stopwatch.One person is the “blinker.” The other person is the timekeeper.The blinker blinks as many times as possible.Count the number of times the blinker blinks in 20 s.Reverse roles.Count the number of times the blinker blinks in 30 s." Who was the faster blinker?
How do you know?" Estimate how many times each person would blink in 1 h.
What assumptions do you make? Are these assumptions reasonable?
Reflect & ShareCompare your results with those of another pair of classmates.How can you decide who is the fastest blinker?
When we compare two different things, we have a rate.Here are some rates.
• We need 5 sandwiches for every 2 people.
• Oranges are on sale at $1.49 for 12.
• Gina earns $4.75 per hour for baby-sitting.
• There are 500 sheets on one roll of paper towels.
The last two rates above are unit rates.Each rate compares a quantity to 1 unit.
Jamal skipped rope 80 times in 1 min.We say that Jamal’s rate of skipping is 80 skips per minute.We write this as 80 skips/min.
To find unit rates, we can use diagrams, tables, and graphs.
62 UNIT 2: Ratio and Rate
2.5 What Is a Rate?Investigate rates.Focus

Example 2
Solution
2.5 What Is a Rate? 63
Example 1
Solution
The doctor took Marjorie’s pulse. He counted 25 beats in 20 s.What was Marjorie’s heart rate in beats per minute?
Draw a diagram.There are 25 beats in 20 s.There are 60 s in 1 min.We multiply 20 s by 3 to get 60 s.So, multiply the number of beatsin 20 s by 3 to get the number ofbeats per minute.
25 beats " 3 # 75 beats
Marjorie’s heart rate is 75 beats/min.
A printing press prints 120 sheets in 3 min.a) Express the printing as a rate.b) How many sheets are printed in 1 h?c) How long will it take to print 1000 sheets?
a) Draw a diagram.The press prints 120 sheets in 3 min.So, in 1 min, the press prints:120 sheets % 3 # 40 sheetsThe rate of printing is 40 sheets/min.
b) In 1 min, the press prints 40 sheets.One hour is 60 min.So, in 60 min, the press prints:60 " 40 sheets # 2400 sheetsThe press prints 2400 sheets in 1 h.
c) Method 1In 1 min, the press prints 40 sheets.So, in 5 min, the press prints: 5 " 40 # 200 sheetsMake a table. Every 5 min, 200 more sheets are printed.Extend the table until you get 1000 sheets.

64 UNIT 2: Ratio and Rate
Method 2The press prints 40 sheets in 1 min.Think: What do we multiply40 by to get 1000?Use division: 1000 % 40 # 25So, 40 " 25 # 1000We multiply the time by the same number.1 min " 25 # 25 minThe press takes 25 min to print 1000 sheets.
The rate at which a car travels is its average speed.When a car travels at an average speed of 80 km/h, it travels:
80 km in 1 h160 km in 2 h240 km in 3 h320 km in 4 h400 km in 5 h … and so on
We can show this motion on a graph.An average speed of 80 km/h is a unit rate.
1. Express as a unit rate.a) Morag typed 60 words in one minute.b) Peter swam 25 m in one minute.c) Abdu read 20 pages in one hour.
2. Express as a unit rate.a) June cycled 30 km in 2 h.b) An elephant travelled 18 km in 30 min.c) A plane flew 150 km in 15 min.
3. Before running in a 100-m race, Gaalen’s heart rate was 70 beats/min. Which do you think is more likely after the race:60 beats/min or 120 beats/min? Explain.
Time (min) 5 10 15 20 25Sheets printed 200 400 600 800 1000
100
200
300
400
0 1 2 3 4 5Time in hours
Car Travelling at 80 km/h
Dis
tanc
e in
kilo
met
res

4. Ribbon costs $1.44 for 3 m.a) What is the cost per metre?b) How much would 5 m of ribbon cost?c) How much ribbon could you buy for $12?
5. The graph shows the distance travelled by a cyclist in 3 h.a) How far did the cyclist
travel in 1 h?b) What is the average speed
of the cyclist?How do you know?
6. James and Lucinda came to Canada on holiday from England.The rate of exchange for their money was $2.50 Can to £1.a) How many Canadian dollars would James get for £20?b) What is the value in English pounds of a gift
Lucinda bought for $30 Can?
7. When a person runs a long-distance race, she thinks of the time she takes to run 1 km (min/km), rather than the distance run in 1 min (km/min).On a training run, Judy took 3 h 20 min to run 25 km.What was Judy’s rate in minutes per kilometre?
8. Assessment Focus Scott trained for the marathon.On day 1, he took 70 min to run 10 km.On day 10, he took 2 h 40 min to run 20 km.On day 20, he took 4 h 15 min to run 30 km.a) What was Scott’s running rate, in minutes per kilometre,
for each day?i) Day 1 ii) Day 10 iii) Day 20
b) What do you think Scott’s running rate, in minutes per kilometre, might be for the 44 km of the marathon?How long do you think it will take him? Explain.
Look through newspapers and magazines to find three differentexamples of rates. Explain how the rates are used.
2.5 What Is a Rate? 65
Mental Math
Find a square root of each number.
49, 25, 81, 16, 64,144, 4, 121
In England, the currency ispennies and pounds.There are 100 pennies inone pound, £1.
20
40
60
80
0 1 2 3Time in hours
How a Cyclist Travels
Dis
tanc
e in
kilo
met
res

Organizing a Math Notebook
66 UNIT 2: Ratio and Rate
You must include the date for each newnote taken or activity performed.
You must include a title foreach new note or activity.
All dates and titles must beunderlined with a ruler.
All tables must be neat. Use a ruler to draw a table.
For example:Section 2.5, question 8.
April 13, 2005
Day Time (min) Distance (km) Rate (min/km)
1
Your daily work must be legible,complete, and well-organized.

Reading and Writing in Math: Organizing a Math Notebook 67
To organize a math problem:
• Restate the problem in your own words.For example, “This problem is about…”
• Think about a strategy you will use and tell about it.For example, “The strategy I will use is…_________ because…”
• Solve the problem. Show all your work.
• State the answer to your problem, and explain how youknow it is reasonable and correct.For example, “I found the answer to be…I know my answer is reasonable because…I know my answer is correct because…”
• Extend your thinking. Make up a similar problem by asking “What if?” questions.For example, “What if all the numbers in this question were doubled? How would the answer change?”
You must make corrections where necessary.
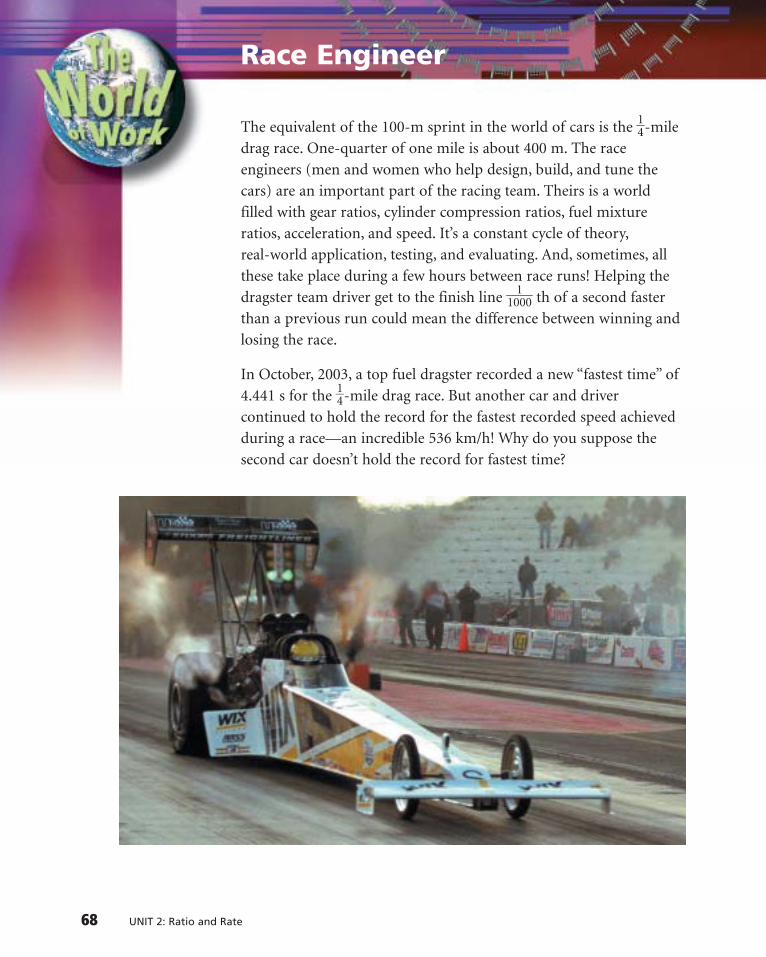
68 UNIT 2: Ratio and Rate
The equivalent of the 100-m sprint in the world of cars is the !14!-miledrag race. One-quarter of one mile is about 400 m. The raceengineers (men and women who help design, build, and tune thecars) are an important part of the racing team. Theirs is a worldfilled with gear ratios, cylinder compression ratios, fuel mixtureratios, acceleration, and speed. It’s a constant cycle of theory,real-world application, testing, and evaluating. And, sometimes, allthese take place during a few hours between race runs! Helping thedragster team driver get to the finish line !10
100! th of a second faster
than a previous run could mean the difference between winning andlosing the race.
In October, 2003, a top fuel dragster recorded a new “fastest time” of4.441 s for the !14!-mile drag race. But another car and drivercontinued to hold the record for the fastest recorded speed achievedduring a race—an incredible 536 km/h! Why do you suppose thesecond car doesn’t hold the record for fastest time?
Race Engineer

Unit Review 69
What Do I Need to Know?
! A ratio is a comparison of quantities.For example, 3 dogs to 7 cats is 3:7.
! An equivalent ratio can be formed by multiplying or dividing the terms of a ratio by the same number.
For example:5:8 and 36:30
# (5 " 3):(8 " 3) # (36 % 6):(30 % 6)# 15:24 # 6:55:8 and 15:24 36:30 and 6:5are equivalent ratios. are equivalent ratios.
! Two ratios can be compared when the second terms are the same.For example, Scott’s scoring record was 16:5.Brittany’s scoring record was 10:3.To find who had the better record, use equivalent ratios to make the second term of each ratio 15.
Scott Brittany16:5 10:3
# (16 " 3):(5 " 3) # (10 " 5):(3 " 5)# 48:15 # 50:15Brittany had the better record.
! A rate is a comparison oftwo quantities with different units.For example:Heart rate is measured in beats per minute (beats/min).Average speed is measured in kilometres per hour (km/h).Fuel consumption of an aircraft is measured in litres per hour (L/h).
Review any lesson with

70 UNIT 2: Ratio and Rate
1. On a school trip, there are 9 boys,10 girls, and 4 adults.Write each ratio.a) girls to boys b) boys and girls to adultsc) adults to boys and girls
2. Write four ratios to describe the coloured squares.
3. Explain two different ways to get ratios equivalent to 25:10.
4. Jake has to draw a flag with a length to width ratio of 3 to 2.What is the largest flag Jake can draw on a 25-cm by 20-cm sheet of paper?
5. The ratio of computers to students in Ms. Beveridge’s class is 2:3. The ratio of computers to students in Mr. Walker’s class is 3:5. Each class has the same number of students.Which room has more computers? Explain.
6. Ali builds model planes. He uses ascale of 8 cm to represent 1.8 m.a) What is the ratio of a length
on the model to the actual length on the plane?
b) A plane has a length of 72 m.What is the length ofthe model?
c) A model has a length of 60 cm.What is the actual length ofthe plane?
Draw pictures to show your answers.
7. Red and white paint is mixed in the ratio of 3 to 2.a) How many cans of red paint
would be needed with 6 cans of white paint?
b) How many cans of each colour are needed to make 20 cans of mixture?
8. Express as a unit rate.a) A bus travelled 120 km in 3 h.b) An athlete ran 1500 m in
6 min.c) A student earned $16 for
2 h work.
9. A lion can run 550 m in 25 s.A zebra can run 270 m in 15 s.a) Which animal is faster?b) What is the ratio of their
average speeds?
LESSON
2.1
2.2
2.3
2.5
What Should I Be Able to Do?
2.4
For extra practice, go to page 439.

Practice Test 71
1. a) Write each ratio in simplest form.i) red squares to blue squaresii) blue squares to green squaresiii) red squares and blue squares to total numbers of squares
b) Suppose the grid is increased to a rectangle measuring9 units by 4 units. The ratios of the colours remain the same.How many red squares will there be in the new rectangle?
2. In the league, the Leos play 8 games. Their win to loss ratio is 5:3.The Tigers play 11 games. Their win to loss ratio is 7:4.a) Which team has the better record? Explain.b) Suppose the Leos win their next game and the Tigers lose
theirs. Which team would have the better record? Explain.
3. Hessa is building a scale model of a park.She uses a scale of 12 cm to represent 1.5 m.a) The actual length of the bridge is 20 m.
What is the length of the model bridge?b) In the model, the height of the climbing frame is 10 cm.
What is the actual height of the frame?
4. Look at this graph.a) What is the speed
of each car?b) How far apart are
the cars after 4 s?
5. Trevor’s mark on a math test was 10 out of 15.Anne’s mark on another test was 15 out of 20.Trevor said, “Each of us got 5 wrong. So, our marks are equal.”Do you agree? Give reasons for your answer.
10
20
30
40
50
0 2 4 6 8 10
How Model Cars Race
Dis
tanc
e in
met
res
Time in seconds
Car B
Car A

72 UNIT 2: Ratio and Rate
Who’s the Smartest?
Mr. Peabody believes you can predict an animal’s intelligence bylooking at the size of its brain.He uses ratios to compare body size to brain size.Investigate this strategy.
Analyse the data below to test Mr. Peabody’s hypothesis.
1. Compare masses: find the ratio of body mass to brain mass.
• How does a human compare to a monkey?
• How does a human compare to a camel?
• How does a camel compare to a monkey?According to Mr. Peabody’s hypothesis, which animal is smartest? Explain your reasoning.
Unit Problem
Species Comparing Mass (g) Comparing Length (cm)Body Brain Body Brain
Human 56 000 1400 150 15Monkey 7 000 100 30 5Camel 520 000 650 200 15
The mass of a humanbrain is about the samemass as your mathtextbook.
A hypothesis is
something that seems
likely to be true. It
needs to be tested and
proved or disproved.

Unit Problem: Who’s the Smartest? 73
2. Compare lengths: find the ratio of body length to brain length.
• How does a human compare to a monkey?
• How does a human compare to a camel?
• How does a camel compare to a monkey?According to Mr. Peabody’s hypothesis, which animal is smartest? Explain your reasoning.
3. The dinosaur, diplodocus, lived about 150 million years ago.The brain of a diplodocus was about 9 cm long.The body of a diplodocus was about 27 m long.
• How long would a human’s brain be if it had the same brain length to body length ratio as a diplodocus?
A frog’s brain is about 2 cm long.A frog’s length is about 10 cm long
• How long would a human’s brain be if it had the same brain length to body length ratio as a frog?
4. Review your results.Write a short letter to Mr. Peabody telling him whether you agree with his hypothesis, and why.Use mathematical language to support your opinion.
How is a rate like a ratio?How is it different?Use examples in your explanation.
Check List
Your work should show:
how you calculated each ratio
your reasoning for which animal is the smartest
your conclusions about the hypothesis
the correct use of mathematicallanguage
!
!
!
!
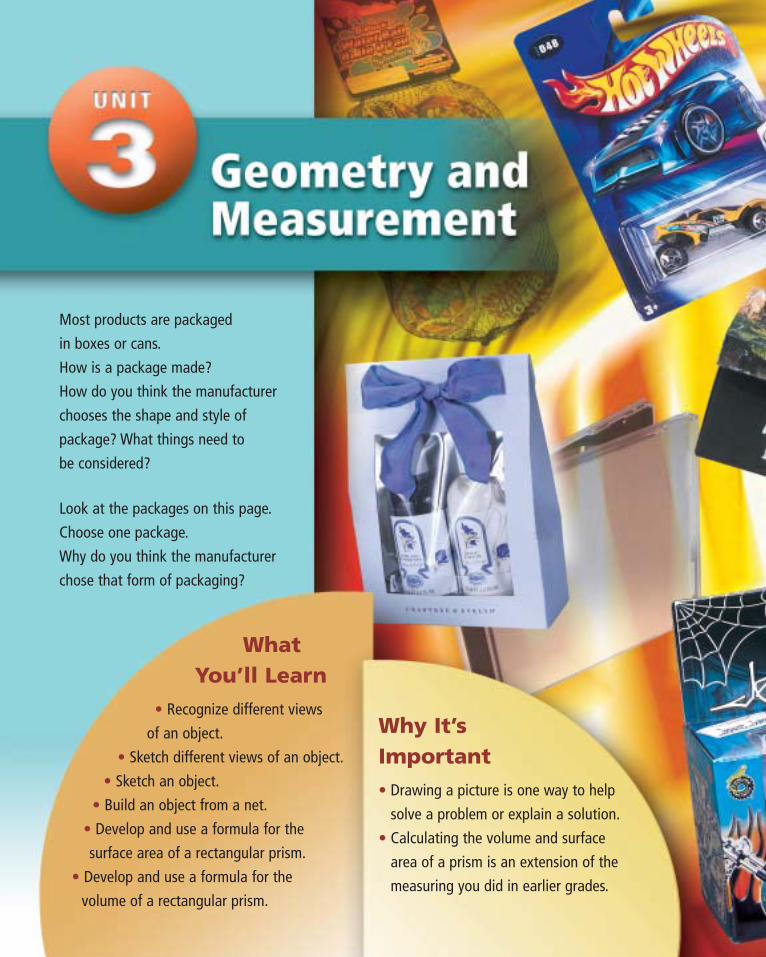
Most products are packaged in boxes or cans.How is a package made?How do you think the manufacturerchooses the shape and style ofpackage? What things need to be considered?
Look at the packages on this page.Choose one package.Why do you think the manufacturerchose that form of packaging?
WhatYou’ll Learn
• Recognize different views of an object.
• Sketch different views of an object.• Sketch an object.
• Build an object from a net.• Develop and use a formula for the surface area of a rectangular prism.
• Develop and use a formula for the volume of a rectangular prism.
Why It’s Important• Drawing a picture is one way to help
solve a problem or explain a solution.• Calculating the volume and surface
area of a prism is an extension of themeasuring you did in earlier grades.

Key Words• polyhedron
(polyhedra)• prism• pyramid• regular polyhedron• cube• tetrahedron• isometric• pictorial diagram• icosahedron• octahedron• dodecahedron• frustum• variable• surface area

76 UNIT 3: Geometry and Measurement
edgevertex
face
baseand face
edge
vertex
face
baseand face
Identifying PolyhedraA polyhedron is a solid with faces that are polygons.Two faces meet at an edge.Three or more edges meet at a vertex.
A prism has 2 congruent bases, and is named for its bases.Its other faces are rectangles.
A pentagonal prism A triangular prism
A pyramid has 1 base and is named for that base.Its other faces are triangles.
A square A hexagonal pyramid pyramid
A regular polyhedron has all faces congruent.The same number of faces meet at each vertex.The same number of edges meet at each vertex.
A cube is a A tetrahedronregular is a regularrectangular triangular prism. pyramid.
Use the pictures of the solids above. Use the solids if you have them.1. a) How are the solids alike? How are they different?
b) Name a real-life object that has the shape of each solid.
!

Using Isometric Dot Paper to Draw a CubeTo draw this cube:
Join 2 dots for one vertical edge.
Join pairs of dots diagonally for the front horizontal edges,top and bottom.
Join the dots for the other 2 vertical edges.
Complete the cube.Join dots diagonally for the back horizontal edges at the top.
Shade visible faces differently toget a three-dimensional (3-D) look.
Skills You’ll Need 77
Isometric means “equal measure.”On isometric dot paper, the linesegments joining 2 adjacent dotsin any direction are equal.
!
2. Use isometric dot paper. Draw each object. Use linking cubes when they help.a) b) c)

Work on your own.Choose a classroom object.
Sketch the object from every view possible. Label each view.Use dot paper or grid paper if it helps.Describe each sketch.
Reflect & ShareTrade sketches with a classmate.Try to identify the object your classmate drew.
We can use square dot paper to draweach view of the object at the left.We ignore the holes in each face.
Back view Front view Left side view
Right side view Top view
78 UNIT 3: Geometry and Measurement
3.1 Sketching Views of SolidsRecognize and sketch different views of objects.
Focus
Which objects do you see in this picture?
Choose an object. What does itlook like from the top? From theside? From the back?
Front view
Left side view

3.1 Sketching Views of Solids 79
Example
Solution
A triangular prism fits on top of a rectangular prism.The bases of the triangular prism are right isosceles triangles.The rectangular prism has two square faces.Sketch the front, back,side, and top views.
The front view and back view are the same.Sketch a right isosceles triangle on top of a rectangle.
The two side views are the same.The side face of the triangular prism is a rectangle. Sketch a rectangle on top of a square.
The top view is two congruent rectangles.
Use linking cubes when they help.
1. Many signs are views of objects.Identify the view (front, back, side, or top) and the object on each sign.a) Child care b) Airport transportation c) Fully accessible
A right isosceles triangle has a 90° angle and two equal sides.
Front view
Side viewTop view
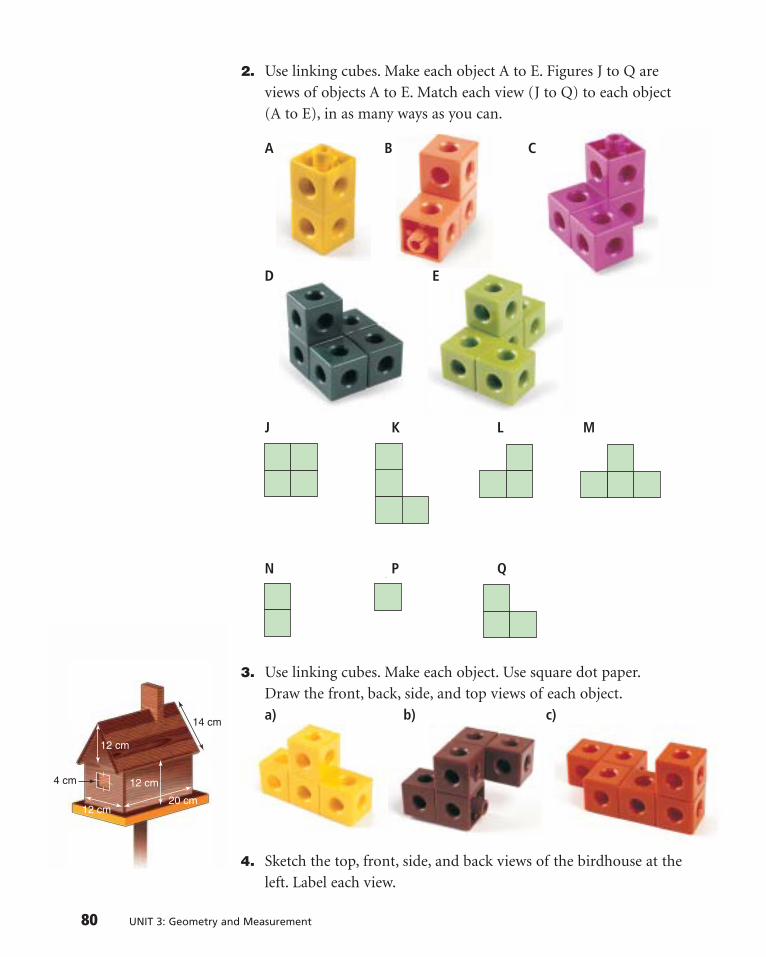
2. Use linking cubes. Make each object A to E. Figures J to Q areviews of objects A to E. Match each view (J to Q) to each object(A to E), in as many ways as you can.
A B C
D E
J K L M
N P Q
3. Use linking cubes. Make each object. Use square dot paper.Draw the front, back, side, and top views of each object.a) b) c)
4. Sketch the top, front, side, and back views of the birdhouse at theleft. Label each view.
80 UNIT 3: Geometry and Measurement
12 cm
12 cm
20 cm12 cm
4 cm
14 cm
P

5. Design a road safety or information sign for each situation.Tell which view you used. Explain how each sign shows the information.a) playground ahead b) tennis courtc) skateboarding allowed d) no flash cameras allowed
6. Find each object in the classroom.Sketch the front, back, top, and side views of each object.a) filing cabinet b) vase c) teacher’s desk
7. Assessment Focus Use 4 linking cubes. Make as many different objects as possible. Draw the front, back, top, and sideviews for each object. Label each view. Use your sketches toexplain how you know all the objects you made are different.
8. All 5 views of a cube are the same.Use the solids in the classroom.a) Are there any other prisms with all views the same? Explain.b) Which solid has 4 views the same?c) Which solid has only 3 views the same?d) Which solid has no views the same?If you cannot name a solid for parts b to d, use linking cubes to make a solid.
9. Here is one view of an object.Sketch a possible different view of the object.a) b) c)
Choose an object. How many views do you need to sketch, sosomeone else can identify it? Explain. Sketch the views you describe.
3.1 Sketching Views of Solids 81
Mental Math
How many:
• days in a year?• months in a year?• days in a week?• hours in a day?• minutes in an hour?• seconds in a minute?

82 UNIT 3: Geometry and Measurement
Software, such as The Geometer’s Sketchpad, can be used to drawdifferent views of solids.
Follow these steps.1. Open The Geometer’s Sketchpad.
To make a “dot paper” screen:
2. From the Edit menu, choose Preferences.Select the Units tab. Check the Distance units are cm.Click OK.
3. From the Graph menu, choose Define Coordinate System.Click on a point where the grid lines intersect.The grid is now highlighted in pink.
4. From the Display menu, choose Line Width, then Dotted.There are dots at the grid intersections.Click anywhere on the screen other than the dots.The dots are no longer highlighted. Hold down the shift key.Click on each numbered axis and the two red dots.Release the shift key.The axes and the dots are now highlighted.
5. From the Display menu, choose Hide Objects.The axes and dots disappear.The screen now appears like a piece of dot paper.From the Graph menu, choose Snap Points.
Make this object with linking cubes.Follow the steps below to create views of this object.
6. From the Toolbox menu, choose (Text Tool).Move the cursor to the screen and a finger appears.Click and drag to make a box at the top left.Inside the box, type: Front View
Using a Computer to DrawViews of Solids
Use technology to sketch viewsof objects.
Focus
Front view

!
Technology: Using a Computer to Draw Views of Solids 83
7. From the Toolbox menu, choose (Straightedge Tool).
Move to a dot on the screen below the title.Click and drag to draw a line segment.Release the mouse button.Continue to draw line segments to draw the front view.Click to select each line segment.From the Display menu, choose Line Width, then Dashed.This draws the line segments as broken lines.
8. From the Toolbox menu, click on (Selection Arrow Tool).
Click to select the four corners of the top square,in clockwise order.From the Construct menu, choose Quadrilateral Interior.From the Display menu, choose Color, then choose blue.
9. Repeat Step 8 to make the bottom squares red and green.
10. Repeat Step 6 to 9 to draw and label the left side view and the back view.
11. Draw the top view and right side view.
1. Open a new sketch. Draw different views of objects from Section 3.1, Practice question 3. Compare the hand-drawn views with the computer-drawn views.

Work with a partner.You will need isometric dot paper and 4 linking cubes.Make an object so its front, top, and side views are all different.Draw the object on isometric dot paper so all 4 cubes are visible.
Reflect & ShareTrade isometric drawings with another pair of classmates.Make your classmates’ object.Was it easy to make the object? Explain.Compare objects. If they are different, find out why.
An object has 3 dimensions: length, height, and width or depth.A drawing is a picture of an object on paper.It has 2 dimensions: length and width.
" We use isometric dot paper to show the 3 dimensions of anobject. Parallel edges on an object are drawn as parallel linesegments. An object made with 5 linking cubes is shown at the left.
When we draw the object from the front or the top,we see only 4 cubes.
Front view Top view
Place the object so that all 5 cubes are seen.
84 UNIT 3: Geometry and Measurement
3.2 Sketching SolidsSketch pictures of objects from modelsand drawings.
Focus
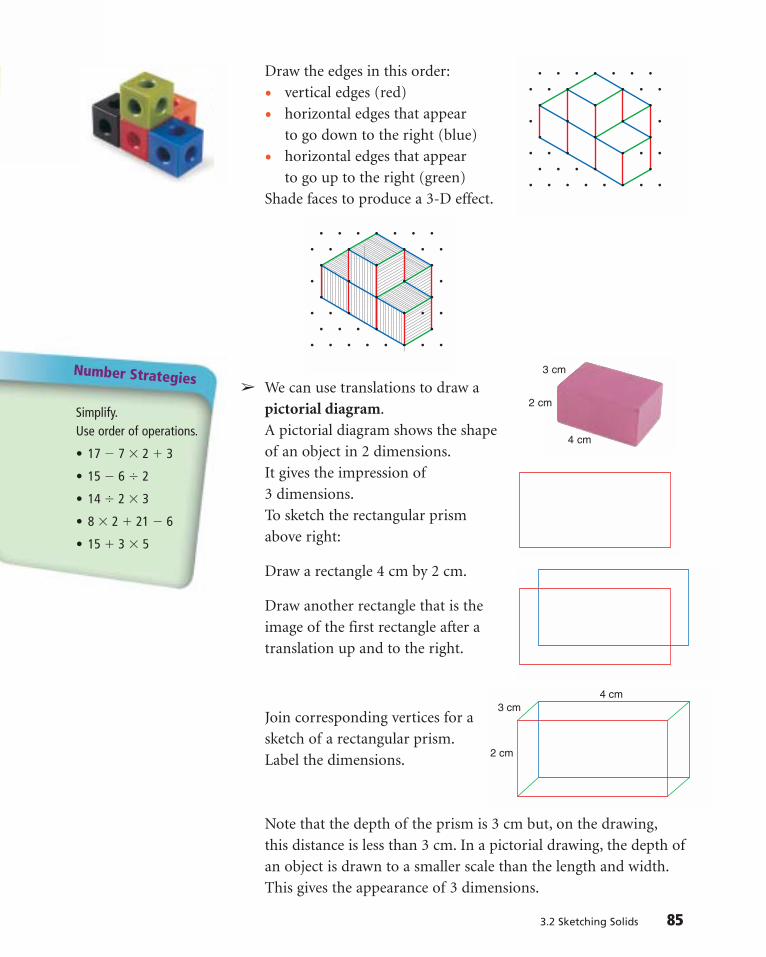
Draw the edges in this order:
• vertical edges (red)
• horizontal edges that appearto go down to the right (blue)
• horizontal edges that appearto go up to the right (green)
Shade faces to produce a 3-D effect.
" We can use translations to draw a pictorial diagram.A pictorial diagram shows the shape of an object in 2 dimensions.It gives the impression of3 dimensions.To sketch the rectangular prism above right:
Draw a rectangle 4 cm by 2 cm.
Draw another rectangle that is the image of the first rectangle after a translation up and to the right.
Join corresponding vertices for a sketch of a rectangular prism.Label the dimensions.
Note that the depth of the prism is 3 cm but, on the drawing,this distance is less than 3 cm. In a pictorial drawing, the depth ofan object is drawn to a smaller scale than the length and width.This gives the appearance of 3 dimensions.
3.2 Sketching Solids 85
Number Strategies
Simplify.Use order of operations.
• 17 ! 7 " 2 # 3
• 15 ! 6 $ 2
• 14 $ 2 " 3
• 8 " 2 # 21 ! 6
• 15 # 3 " 5
4 cm3 cm
2 cm
3 cm
4 cm
2 cm

Art
When you view an IMAXfilm, you “see” it in 3-D.The scenes are filmedfrom two slightly differentangles. This imitates howour eyes view the world.Both films are projectedonto the screen to giveyou the feeling of depth.
86 UNIT 3: Geometry and Measurement
Example
Solution
We can use similar ideas to sketch a 3-D picture of any object.
In a pictorialdrawing, a circle isdrawn as an oval.
Sketch this mug.
The mug is an open cylinderwith a handle.Draw an oval for the circular top.Draw vertical lines for the curved surface (blue).Draw half an oval for the circular base (red).Draw 2 overlapping curvesfor the handle (green).
Use linking cubes when they help.
1. Make each object. Draw it on isometric dot paper.a) b)
2. Turn each object in question 1.Draw it a different way on isometric dot paper.
3. Use linking cubes. Make each object.Draw it on plain paper or isometric dot paper.a) b)

3.2 Sketching Solids 87
4. Here are different views of an object made with linking cubes.
Make the object.Draw it on isometric dot paper or plain paper.
5. Sketch a 3-D picture of each object on plain paper.a) b) c)
6. Square pieces of shelving snap together to make cube-shaped stacking shelves. All the faces are square and measure 30 cm by 30 cm. A side face costs $1.50.A top or bottom face costs $1.30. The back face costs $1.10.Kate built shelves using 9 side faces, 6 back faces,and 9 top/bottom faces.a) Use linking cubes to build a possible design.b) Draw a picture of your design on isometric dot paper.c) How much did the shelving cost?d) Is it possible to have the same number of cubes
but use fewer pieces? Explain.e) If your answer to part d is yes, what is the new cost of
shelving? Explain.
7. Assessment Focus Use 5 linking cubes. Make a solid.a) Sketch the solid on isometric dot paper.b) Sketch a 3-D picture of the solid on plain paper.c) How is sketching a solid on isometric paper different from
sketching it on plain paper? How are the methods alike? Use your sketches to explain.
How do you draw an object to show its 3 dimensions?Use words and pictures to explain.
Front Back Top Left Side Right Side

88 UNIT 3: Geometry and Measurement
A forensic investigator collects information from a crime scene tofind out who was involved and exactly what happened. The forensicinvestigator also presents evidence in court as required by law.
The forensic graphics specialist visits the crime scene to takephotographs and measurements. She may research to composetechnical drawings to help with the investigation. When she preparesthese drawings, the graphics specialist pays attention to shading andrelative line thickness. It is important that she does not presentoptical illusions such as an object appearing to be “inside out.”
Forensic Graphics Specialist

Work with a partner.You will need scissors and tape.Your teacher will give you large copies of the nets below.
" Identify the polyhedron for each net above." Use a copy of each net.
Cut it out. Fold, then tape it to make a polyhedron." Identify congruent faces on each polyhedron.
Reflect & ShareLook at each polyhedron from the top, front, back, and sides.Which views are the same? Explain.
There are 5 regular polyhedra.You reviewed 2 of them, the cube and the tetrahedron,in Skills You’ll Need, page 76.
One regular polyhedron is an icosahedron.Here is a net for one-halfof an icosahedron.
3.3 Building Objects from Nets 89
3.3Build objects from nets.Focus
Building Objects from Nets
In earlier grades, you designed nets for prisms and pyramids.Now, you will fold nets to make prisms, pyramids, and other polyhedra.

Example
Solution
This net can be cut out and folded.The net has 10 congruent triangles.
Two of these pieces are taped together to make an icosahedron.
An icosahedron has 20 congruent faces.Each face is an equilateral triangle.In the Practice questions, you will make the other 2 regular polyhedra.
A regular octahedron A regular dodecahedron
In previous grades, you designed and sketched nets of prisms and pyramids.In the Example that follows, and in Practice questions,you will investigate nets for other objects.
Fold this net to make an object.Describe the object.
The net is folded along the brokenline segments. Each edge touchesanother edge. The edges are taped.
90 UNIT 3: Geometry and Measurement

3.3 Building Objects from Nets 91
The object looks like the bottom of a pyramid;that is, a pyramid with the top part removed.The object is called a frustum of a pyramid.
The object has 2 non-congruent square faces, and 4 congruenttrapezoid faces. The 2 square faces are parallel.
Your teacher will give you a large copy of each net.
1. Fold this net to make a polyhedron.a) Identify the polyhedron.b) Describe the polyhedron.
2. Fold this net.a) Is the object a polyhedron?
If so, what are the attributes that make it a polyhedron?
b) Identify parallel faces and perpendicular faces.
3. Fold two of these nets to make two square pyramids with no base.Tape the two pyramids together at their missing bases.You have made a regular octahedron.a) Why does it have this name?b) Describe the octahedron.
How do you know it is regular?
4. Fold each net. Describe each object.How are the objects the same? How are they different?a) b)
Calculator Skills
Find three primenumbers that have a sum of 43 and aproduct of 1085.

5. Fold two of these nets.Put the open parts together. Tape the pieces to make a regular dodecahedron. Describe the dodecahedron.
6. A soccer ball is not a sphere. It is a polyhedron.Look at a soccer ball.Explain which polygons are joined to make the ball.How are the polygons joined?
7. Assessment Focus Fold the net shown.
a) Describe the object formed.b) Name the object. Justify your answer.
8. All the nets you have used fold to make objects.Which features must be true for this to happen?
9. Use isometric dot paper or plain paper.Draw the object that has this net. Explain your thinking.
Choose a product that has a package in the shape of a polyhedron.Sketch the package. Include appropriate dimensions.Cut along the edges to make the net.Why do you think the manufacturer used this shape for the package?Can you find a better shape for the packaging? Explain.
92 UNIT 3: Geometry and Measurement
Take It Further

Mid-Unit Review 93
LESSON
3.1
3.2
3.3
1. Sketch the front, back, top,and side views of each object.Label each view.a) Television
b) Baseball mitt
c) Chair
2. Make each object.Sketch a 3-D view of the object on isometric dot paper.a)
b)
3. Sketch a 3-D view of each object on plain paper.a) b)
4. Suppose you had to construct anobject from linking cubes. Whichwould you prefer to use: a drawingof the object on isometric dotpaper, or 5 different views on plainpaper? Justify your choice. Usediagrams to support your choice.
5. Use a large copy of this net.Fold the net to make an object.Name the object. List its attributes.
6. Which polyhedra could have each view shown below?Find as many polyhedra as you can for each view.a) b)

Work with a partner.
" Find the area of each rectangle below, in square units.
" Find the perimeter of each rectangle above, in units.
Reflect & ShareCompare your results with those of another pair of classmates.How did you find the area when you did not know:
• the base?
• the height?
• the base and height?How did you find the perimeter in each case?
When we do not know the dimensions of a figure,we use letters to represent them.For a rectangle, we use b to represent the length of the base,and h to represent the height.
One way to find the area of a rectangle is to use a formula.The formula for the area of a rectangle is:
A % base " heightThen A % b " hWe write A % b " h as A % bh.
94 UNIT 3: Geometry and Measurement
3.4 Using Variables in Measurement FormulasUse measurement formulas to introducethe concept of a variable.
Focus
2
5
A
8
10B
h
7
D
b
hE
3
b
C
b
b
hh

3.4 Using Variables in Measurement Formulas 95
We use exponentsto representrepeatedmultiplication.
Example
Solution
The formula for the perimeter of a rectangle is:P % 2 " (base # height)Then P % 2 " (b # h)We write P % 2 " (b # h) as P % 2(b # h).
The letters we use to represent the base and height are calledvariables. Variables in a formula can represent different numbers.When we know the values of the variables, we substitute for thevariables. That is, we replace each variable with a number.
A square is a rectangle with all sides equal.The formula for the area of a square is:A % side length " side lengthUse the variable s for the side length.Then, A % s " s
or A % s 2
The formula for the perimeter of a square is:P % 4 " side length
or P % 4 " s
We write P % 4 " s as P % 4s.
A rectangle has base 15 cm and height 3 cm. Use formulas to find its area and perimeter.
Area, A % bhb % 15 and h % 3Substitute for b and h in the formula.A % 15 " 3A % 45The area is 45 cm2.
Perimeter, P % 2(b # h)Substitute for b and h.P % 2(15 # 3) Use order of operations.P % 2(18) Do the operation inP % 36 brackets first. Then multiply.The perimeter is 36 cm.
15 cm
3 cm
s
s
ss

1. Use the formula: P % 4sFind the perimeter of the square with each side length.a) 5 cm b) 9 cm c) 2 cm d) 8 cm
2. Use the formula for the area of a rectangle: A % bhFind the area of each rectangle.a) base: 6 cm; height: 3 cm b) base: 11 cm; height: 2 cm
3. a) For each rectangle, what is the value of b and the value of h?i) ii) iii)
b) Use your answers to part a to explain why we call b and h variables.
c) What is true about b and h in part a, iii?
4. Find the area and perimeter of each rectangle.a) base: 12 cm; height: 4 cm b) base: 10.5 cm; height: 3.0 cm
5. Find the perimeter and area of each square.a) side length: 2.8 cm b) side length: 3.1 cm
6. Assessment FocusHere is another formula for the perimeter of a rectangle:P % 2b # 2hWrite this formula in words.Explain why there are two formulas for the perimeter of a rectangle.
7. a) How could you use the formula for the perimeter of a rectangle to get the formula for the perimeter of a square?
b) How could you use the formula for the area of a rectangle to get the formula for the area of a square?
What is a variable?Why do we use variables to write measurement formulas?
Number Strategies
Find the LCM and GCF of 10,15, and 25.
96 UNIT 3: Geometry and Measurement
3
2
5
4 2
Take It Further

Area = 8 × 3
Area = 8 × 5
Are
a=
3×
5
Are
a=
3×
5Area = 8 × 3
Area = 8 × 5
3
55
33
3
5
3
5
8
8
3.5 Surface Area of a Rectangular Prism 97
3.5Use a formula to calculate the surface areaof a rectangular prism.
Focus
Surface Area of a Rectangular Prism
Work in a group.You will need several different empty cereal boxes, scissors, and a ruler.
" Cut along the edges of a box to make a net.What is the area of the surface of the box?
" Repeat the activity above for 2 other boxes." Write a formula to find the area of the surface
of a rectangular prism.
Reflect & ShareCompare your formula with that of another group.Did you write the same formula?If not, do both formulas work? Explain.
Here is a rectangular prism, and its net.
In the net, there are 3 pairs ofcongruent rectangles.The area of the net is the sum ofthe areas of the rectangles.The area of the net % 2(8 " 3) # 2(8 " 5) # 2(3 " 5)
% 2(24) # 2(40) # 2(15) Multiply.% 48 # 80 # 30 Add.% 158
The area of the net is 158 cm2.We say that the surface area of the rectangular prism is 158 cm2.
Use order ofoperations, withbrackets first.
5 cm
3 cm
8 cm

Example
Solution
98 UNIT 3: Geometry and Measurement
Remember that lwmeans l " w.
wh
!
8 cm
15 cm10 cm
We can use the net of a rectangular prism to write a formula for its surface area.We use a variable to label each dimension.The prism has length l, width w, and height h.
In the net, there are 3 pairs of congruent rectangles.The surface area of the prism is the sum of the areas of the rectangles.The surface area of the prism % 2lh # 2lw # 2hwWe write: SA % 2lh # 2lw # 2hw
We can use this formula to find the surface area of a rectangularprism, without drawing a net first.
Find the surface area of thisrectangular prism.
Use the formula:SA % 2lh # 2lw # 2hwSubstitute: l % 15, h % 8, and w % 10
SA % 2(15 " 8) # 2(15 " 10) # 2(8 " 10)% 2(120) # 2(150) # 2(80)% 240 # 300 # 160% 700
The surface area of the rectangular prism is 700 cm2.

1. Find the surface area of each rectangular prism.a) b) c)
2. Use isometric dot paper or plain paper.Sketch a rectangular prism with these dimensions:6 cm by 3 cm by 2 cm.Find the surface area of the prism.
3. Find the surface area of each rectangular prism.a) b) c)
4. Use linking cubes.a) Find the surface area of a cube with edge length 1 unit.b) What if the edge length is doubled?
What happens to the surface area? Make a new cube to find out.
c) What if the edge length is tripled? What happens to the surface area? Make a new cube to find out.
d) Predict the surface area of a cube with edge length 4 units.Explain your prediction. Make a new cube to check.
5. a) Find a rectangular prism in the classroom.Measure its length, width, and height.Find its surface area.
b) Suppose each dimension ofthe prism is halved.What happens to the surface area? Explain.
3.5 Surface Area of a Rectangular Prism 99
Visualize the net. Howdoes that help to find thesurface area?
Mental Math
Estimate each product.What strategies did you use?
Order the products fromleast to greatest.
• 24.8 " 3.2• 35.2 " 2.8• 13.2 " 5.7• 5.5 " 15.5
8 cm
4 cm4 cm
6 cm
6 cm6 cm
7 cm
3 cm2 cm
2.0 cm
5.5 cm3.6 cm3.0 cm
7.2 cm4.5 cm
3.5 cm
5.0 cm5.8 cm

10 cm4 cm
4 cm
10 cm10 cm
25 cm
18 cm10 cm
22 cm
7 cm14 cm4 cm
10 cm
100 UNIT 3: Geometry and Measurement
6. Tanya paints the walls of her family room.The room measures 3 m by 4 m by 7 m.The walls need 2 coats of paint. A 4-L can of paint covers 40 m2.a) How much paint should Tanya buy?b) What assumptions do you make? Explain.
7. Assessment Focus Sketch a rectangular prism. Label itsdimensions. What do you think happens to the surface area of aprism when its length is doubled? Its length is halved? Investigate to find out. Show your thinking.
8. Each object has the shape of a rectangular prism, but one face or parts of faces are missing. Find each surface area.a) b) c)
9. The surface area of a cube is 54 cm2.a) What is the area of one face of the cube?b) What is the length of one edge of the cube?
10. A 400-g cereal box measures 20 cm by 7 cm by 31 cm.A 750-g cereal box measures 24 cm by 9 cm by 33 cm.a) Find the surface area of each box.b) What is an approximate ratio of surface areas?
What is an approximate ratio of masses?c) Compare the ratios in part b.
Do you expect the ratios to be equal? Explain.
11. A rectangular prism has a square base with area 4 m2.The surface area of the prism is 48 m2.What are the dimensions of the prism?
12. A rectangular prism has faces with these areas: 12 cm2, 24 cm2,and 18 cm2. What are the dimensions of the prism? Explain.
Explain how to find the surface area of a rectangular prism using a formula. Include an example in your explanation.
Take It Further

3.6 Volume of a Rectangular Prism 101
3.6Use a formula to calculate the volume ofa rectangular prism.
Focus
Volume of a Rectangular Prism
Work in a group.You will need several empty cereal boxes and a ruler.
" Find the volumes of 3 cereal boxes." Write a formula you can use to find the volume of a
rectangular prism." Measure a 4th cereal box. Substitute its dimensions in your
formula to check that your formula is correct.
Reflect & ShareCompare the formulas for the volume of a rectangular prism andthe area of a rectangle. What do you notice? Explain.
Recall that the volume of arectangular prism is:Volume % base area " height
The base of the prism is a rectangle.Label the length l and the width w.Then, the area of the base is l " w,or lw.
Label the height h.Volume % base area " height
V % lw " hV % lwh
The volume of a rectangular prism is: V % lwh
If we let A represent the area of the base,then A % lw.
Another way to write the volume is: V % A " h,or V % Ah
The base of a rectangularprism can be any face ofthe prism.
The height is measuredfrom the base to theopposite face.The height isperpendicular to the base.
base area
height
h
w!
A
h

5 cm8 cm
3 cm
9 cm9 cm
9 cm
10 cm20 cm
30 cm
3.0 cm5.0 cm
4.5 cm
7.5 cm
4.0 cm
3.2 cm 3.5 cm
3.0 cm2.4 cm
102 UNIT 3: Geometry and Measurement
Example
Solution
A deck of 54 cards fits in a box with dimensions 6.5 cm by 9.0 cm by 1.6 cm. What is the volume of the box? Give the answer to thenearest cubic centimetre.
Draw a diagram.The box is a rectangular prism.Label each dimension.Use the formula: V % lwhSubstitute: l % 9.0, w = 6.5, and h % 1.6V % 9.0 " 6.5 " 1.6 Use a calculator.
% 93.6The volume is 93.6 cm3, or about 94 cm3.
Use a calculator when it helps.
1. For each rectangular prism: find the area of its base,then find its volume.a) b) c)
2. Find the volume of each rectangular prism.a) b) c)
3. Use linking cubes.Make all possible rectangular prisms with volume 36 units3.Sketch each prism you make.Label each prism with its dimensions in units.How do you know you have found all possible prisms?
Recall that, when thedimensions aremeasured incentimetres (cm),the volume ismeasured in cubiccentimetres (cm3).
9.0 cm
6.5 cm
1.6 cm

4. Philip made fudge that filled a 20-cm by 21-cm by 3-cm pan.a) What is the volume of the fudge?b) Philip shares the fudge with his classmates. There are 30
people in the class. How much fudge will each person get?c) How should Philip cut the fudge so each person gets the
same size piece? Sketch the cuts he should make.d) What are the dimensions of each piece of fudge?
5. Sketch a rectangular prism. Label its dimensions.What do you think happens to the volume of the prism when:a) its length is doubled?b) its length and width are doubled?c) its length, width, and height are doubled?Investigate to find out. Show your work.Will the results be true for all rectangular prisms? How do you know?
6. How can you double the volume of a rectangular prism?Does its surface area double, too? Explain.
7. Assessment Focus Use linking cubes.a) How many rectangular prisms can you make with 2 cubes?
3 cubes? 4 cubes? 5 cubes? 6 cubes? and so on, up to 20 cubes?b) How many cubes do you need to make exactly 1 prism?
Exactly 2 prisms? Exactly 3 prisms? Exactly 4 prisms?c) What patterns do you see in your answers to part b?
8. a) Sketch 3 different rectangular prisms with volume 24 cm3.b) Which prism has the greatest surface area?
The least surface area?c) Try to find a prism with a greater surface area.
Describe the shape of this prism.d) Try to find a prism with a lesser surface area.
Describe the shape of this prism.
Suppose you know the volume of a rectangular prism.How can you find its dimensions? Use words and pictures to explain.
3.6 Volume of a Rectangular Prism 103
Mental Math
Estimate each quotient.What strategies did you use?
Order the quotients fromleast to greatest.
• 3572 $ 71• 4675 $ 58• 5007 $ 43• 6729 $ 95

STRATEGIES to consider . . .
READ the problem.
• Do I understand all the words? • Highlight those words I don’t
understand. Whom can I ask? • Are there key words that give
me clues? Circle these words.
THINK about the problem.
• What is the problem about? • What information am I given? • Am I missing any information?• Is this problem like another
problem I have solved before?
Decoding Word Problems
104 UNIT 3: Geometry and Measurement
Use a model.Make an organized list.
Make a table.Use logical reasoning.
Solve a simpler problem.Draw a diagram.Guess and check.
Use a pattern.Work backward.
Draw a graph.
David, Jennifer, and Markcollect baseball cards.Jennifer has the most cards.She has 15 more cards thanDavid. David has 4 times asmany cards as Mark hastoday. Mark often loses someof his cards. This morningMark has 18 cards. Howmany baseball cards doesJennifer have?

TRY out the plan.
• Is the plan working? Should I try something else? • Have I shown all my work?
LOOK back.
• Does my answer make sense? How can I check?
• Is there another way to solve this problem?
• How do I know my answer is correct?• Have I answered the problem?
EXTEND.
• Ask “What if …?” questions. What if the numbers were different? What if there were more options?
• Make up similar problems of your own.
• STRETCH your thinking.
MAKE a plan.
• What strategy should I use? • Would counters, geometric figures, other
materials, calculators, and so on, help?
Reading and Writing in Math: Decoding Word Problems 105

106 UNIT 3: Geometry and Measurement
What Do I Need to Know?
! Perimeter of a rectangle:P % 2(b # h)
Area of a rectangle:A % bh
Perimeter of a square:P % 4s
Area of a square:A % s2
Volume of a cube:V % c3
Surface area of a cube:SA % 6c2
Surface area of a rectangular prism:SA % 2lh # 2lw # 2hw
Volume of a rectangular prism:V % lwhor V % Ah, where A % lw
!
!
!
!
!
!
!
b
b
hh
s
s
ss
!
hw
c
Review any lesson with

Unit Review 107
1. Sketch the front, back, side, and top views of each object. Usesquare dot paper, plain paper,or The Geometer’s Sketchpad.a)
b)
c)
2. a) Identify the view and the objects on each sign.i) Railway Crossing Ahead
ii) Fishing Area
b) Design a new sign from a different view.Sketch your design.
3. This is a net for an octahedron.
a) Fold a large copy of the net.Describe the object. Why do youthink it is called an octahedron?
b) How is the object you built different from a regular octahedron?
4. Find the area of each figure.a) a square with side length 7 cmb) a rectangle with base 12 m
and height 3 m
5. A cube has edge length c.a) Write a formula for the surface
area of the cube.b) Use the formula to find the
surface area when c is 4 cm.
6. A children’s play area is 90 m long and 44 m wide. A fence will enclose the area.a) How much fencing is needed?b) Fencing comes in 12-m
bundles. Each bundle costs $35. How much will the fencecost? Justify your answer.
LESSON
3.1
3.2
3.3
3.4
What Should I Be Able to Do? For extra practice, go to page 440.

50 cm
50 cm50 cm
108 UNIT 3: Geometry and Measurement
7. Find the surface area and volumeof each rectangular prism.a)
b)
c)
8. Elizabeth pastes wallpaper on 3 walls of her bedroom. She paintsthe 4th wall. This is one of thesmaller walls. The dimensions ofthe room are 3 m by 5 m by 6 m.A roll of wallpaper covers about 5 m2. A 4-L can of paint coversabout 40 m2.a) How much wallpaper and
paint should Elizabeth buy?b) What assumptions do
you make?
9. The surface area and volume of acube have the same numericalvalue. Find the dimensions of thiscube. How many answers can you find?
10. Sketch all possible rectangularprisms with a volume of 28 m3.Each edge length is a wholenumber of metres. Label eachprism with its dimensions.Calculate the surface area of each prism.
11. In Gulliver’s Travels by JonathanSwift, Gulliver visits a land where each of his dimensions is 12 times as large as that of the inhabitants.a) Assume
you can be modelled as a rectangularprism.Measure your height, width,and thickness.
b) Suppose you were one of the inhabitants. What wouldGulliver’s dimensions be?
c) Use your dimensions. Calculateyour surface area and volume.
d) Calculate Gulliver’s surface areaand volume.
12. The volume, V, and base area, A,of a rectangular prism are given.Find the height of each prism.Sketch the prism. What arepossible dimensions for theprism? Explain.a) V % 18 m3, A % 6 m2
b) V % 60 cm3, A % 15 cm2
13. Samya is making candles. She uses a 1-L milk carton as a mould.Its base is a 7-cm square.Samya pours 500 mL of wax intothe carton.Recall that 1 mL % 1 cm3.Approximately how tall will thecandle be? Justify your answer.
LESSON
3.5
3.6
3 m
2 m6 m
3 cm
3 cm8 cm

Practice Test 109
1. Build the letter H with linking cubes.Draw the front, back, side, and top views.
2. Fold a copy of this net.a) Describe the object.
What name could you give it? Justify your answer.
b) Sketch the object.
3. Find the surface area and volume of this rectangular prism.
4. Each edge length of a rectangular prism is 7 cm.a) Sketch the prism.b) Use formulas to find its volume and surface area.
5. Here are the dimensions of two designs for a sandbox for theprimary playground. Each sandbox is a rectangular prism.One design is 3 m by 3 m by 30 cm.A second design is 3.25 m by 3.25 m by 25 cm.a) Sketch each sandbox. Include its dimensions.b) Compare the designs. For each design, calculate the area
of material needed to build it and the volume of sand it will hold.
c) Which sandbox should be built? Justify your answer.
6. Think about the nets you have folded and the solids you have made.Suppose you are a tent manufacturer.Which net would you use to make a tent?Explain why it would be a good tent design.
16 cm12 cm
7 cm

110 UNIT 3: Geometry and Measurement
Making Food for a Bake Sale
Suppose you are planning to sell baked goods at the local charity bake sale.You have to decide the selling price for your baked goods.You want to make sure that the price covers the cost of theingredients and the packaging.
Decide on the baked goods you will sell.For example, here is a recipe for Rice Krispies Treats.
Use this recipe or find your own recipe for treats.How many batches of treats will you make?Calculate how much of each ingredient you need.Use grocery flyers to find how much the ingredients will cost.
Unit Problem
Rice KrispiesTreats
50 mL margarine250 g marshmallows1.5 L Rice Krispies
Melt the margarine.Add marshmallows andstir until melted.Remove from heat.Add Rice Krispies.Stir until the Rice Krispiesare coated.Press mixture intogreased 32-cm by 23-cm pan.When mixture is cool, cut into squares.

Unit Problem: Making Food for a Bake Sale 111
Write a paragraph to tell what you have learned about polyhedra in this unit.Try to include something from each lesson in the unit.
Your work should show:
all calculations in detail
all sketches clearlylabelled
a clear explanationof your results
how you decided theselling price of 1 boxof treats
!
!
!
!
1. Calculate the cost of 1 batch of treats.
2. How many treats will you sell in 1 package?Design a box as the package for your treats.Decide if the box is open and covered with plastic wrap,or if the box is closed.Draw a 3-D picture of your box.Sketch a net for your box.
3. Calculate the surface area and volume of your box.Suppose the cost of cardboard is 50¢/m2.How many boxes can you make from 1 m2 of cardboard?How much does each box cost?What other costs are incurred to make the boxes?What assumptions do you make?
4. Draw the top, front, back,and side views of your box.
5. How much will you sell 1 box of treats for?Justify your answer.Show how the selling price of the treats covers the cost of all the things you bought.
Check List

112 Cross Strand Investigation
Materials:
• 1-cm grid paper 2-cm grid paper 0.5-cm grid paper
• a ruler
Ratios in Scale Drawings
Work with a partner.
A scale drawing is larger or smaller than the original drawing orobject, but has the same shape. The scale of the drawing is the ratioof a length on the scale drawing to the same length on the originaldrawing or object.
Polygons that have the same shape but different sizes are similar.
As you complete this Investigation, include all your work in a reportthat you will hand in.
Part 1How are the ratios of corresponding sides in similar polygonsrelated?
" Use grid paper.Draw a polygon with vertices where the grid lines meet.Trade drawings with your partner.
CrossStrand
Investigation

Ratios in Scale Drawings 113
" Draw a similar polygon that is larger or smaller than the polygon drawn by your partner. You can use the same sheet of grid paper or a sheet with different grid dimensions. Your drawing is a scale drawing of the polygon.
" Measure and record the lengths of the sides of the two polygons." Compare the lengths of corresponding sides of the two polygons.
What are the ratios? Are the ratios the same for each pair? Explain.
" Predict the ratio of the perimeters of the polygons.Check your prediction.
" Compare your findings with those of your partner.Explain any differences.
Part 2How are the ratios of corresponding sides related to the ratios of theareas of the polygons?
" Draw a polygon with vertices where grid lines meet.Draw a similar polygon that is larger.What is the ratio of the corresponding sides?
" Predict the ratio of the area of the original polygon to the area of the second polygon.Explain your reasoning for making this prediction.
" Find the area of each polygon. What is the ratio of the two areas?" How does your prediction compare to your findings?
Explain any differences." How is the ratio of the corresponding sides of the polygons
related to the ratio of the areas of the polygons?
Take It Further" Suppose you have to enlarge a polygon so that its area is doubled.
Should you double the length of each side? Explain.Use an example in your explanation.
" Suppose you have to enlarge a polygon so that its area is four times its original area. How would you do that?
" What patterns do you see?How could you use these patterns to enlarge a polygon even more?

Many newspapers and magazines selladvertising space. Why do smallcompanies run small advertisements?
Selling advertising space is a good wayto raise funds. Students at GardenAvenue School plan to sell advertisingspace in their yearbook.
How can fractions and decimals beused in advertising space and advertising rates?
WhatYou’ll Learn
• Add and subtract fractions.• Multiply a fraction by a
whole number.• Compare and order decimals.
• Multiply and divide decimals.• Use order of operations with decimals.
• Solve problems using fractions and decimals.
Why It’s Important• You use fractions when you
share or divide.• You use decimals when you
shop and when you measure.

Key Words• fraction strips• equivalent fractions• related
denominators• unrelated
denominators• common
denominator• lowest common
denominator• unit fraction• terminating decimal• repeating decimal

116 UNIT 4: Fractions and Decimals
Adding and Subtracting Fractions with Pattern BlocksLet the yellow hexagon represent 1:
Then the red trapezoid the blue rhombus and the green triangle represents !12! : represents !13! : represents !16! :
Example 1
Use Pattern Blocks to add and subtract.
a) !13! " !12! b) !12! # !13!
Solution
a) !13! " !12! b) !12! # !13!
Show !12!. Cover !13!.
!13! " !12! $ !56! !12! # !13! $ !16! !16! is not covered.
1. Use Pattern Blocks to add.
a) !13! " !23! b) !46! " !16! c) !76! " !12! d) !56! " !23!
2. Use Pattern Blocks to subtract.
a) !56! # !26! b) !23! # !16! c) !32! # !23! d) !56! # !23!
!
+ =

Multiplying by 0.1, 0.01, and 0.001We can use patterns to multiply by 0.1, 0.01, and 0.001.We can show products on a place-value chart.
Thousands Hundreds Tens Ones Tenths Hundredths Thousandths
24 % 100 2 4 0 024 % 10 2 4 024 % 1 2 4
24 % 0.1 2 424 % 0.01 0 2 4
24 % 0.001 0 0 2 4
On the chart: To get the product:• To multiply by 0.1, • Move the decimal point
move each digit 1 place to the right. 1 place to the left.• To multiply by 0.01, • Move the decimal point
move each digit 2 places to the right. 2 places to the left.• To multiply by 0.001, • Move the decimal point
move each digit 3 places to the right. 3 places to the left.
Example 2
Multiply.a) 372 % 0.1 b) 56 % 0.01 c) 41 % 0.001
Solution
Mark the decimal point in the whole number.a) 372. % 0.1 $ 37.2 The decimal point moves 1 place to the left.b) 56. % 0.01 $ 0.56 The decimal point moves 2 places to the left.c) 41. % 0.001 $ 0.041 Write zeros as placeholders. Then move the
decimal point 3 places to the left.
3. Multiply.a) 5 % 0.1 b) 98 % 0.1 c) 124 % 0.1d) 326 % 0.01 e) 72 % 0.01 f) 6 % 0.01g) 56 % 0.001 h) 276 % 0.001 i) 8 % 0.001
Skills You’ll Need 117
!
•••••••

118 UNIT 4: Fractions and Decimals
Operations with Decimals
Example 3Evaluate.
a) 82.34 " 4.7 b) 79.1 # 43.8 c) 426.31 % 2 d) 9.47 & 2
Solution
a) 82.34 " 4.7Add the hundredths.Add the tenths: 10 tenths $ 1 wholeAdd the ones. Add the tens.
b) 79.1 # 43.8To subtract the tenths, trade 1 whole for 10 tenths.Subtract the ones. Subtract the tens.
c) 426.31 % 2Ignore the decimal point.Multiply as you would with whole numbers.Place the decimal point in the answer by estimation:426.31 % 2 is about 400 % 2 $ 800So, 426.31 % 2 $ 852.62
d) 9.47 & 2Use short division.Divide 9 ones by 2. There is 1 whole left.Trade 1 whole for 10 tenths. 2 9.14710Divide 14 tenths by 2. 4. 73 5Divide 7 hundredths by 2. There is 1 hundredth left.Trade 1 hundredth for 10 thousandths. Divide 10 thousandths by 2.So, 9.47 & 2 $ 4.735
4. Evaluate.a) 12.3 " 3.5 b) 21.41 # 13.8 c) 31.47 % 4 d) 7.44 & 2e) 182.34 % 7 f) 52.103 " 71.81 g) 49.35 & 3 h) 138.97 % 6
Estimate: 80 " 5 $ 85
Estimate: 80 # 40 $ 40
Estimate: 400 % 2 $ 800
Estimate: 10 & 2 $ 5
!
821.34
" 4.787.04
798!.1
11!
# 43.835.3
426.31% 2
852.62

Comparing and Ordering DecimalsHere are two ways to order these decimals from least to greatest: 1.84, 2.10, 1.80, 1.89" Use a number line.
Mark each decimal on a number line in hundredths from 1.75 to 2.15.1.84 is between 1.80 and 1.85, but closer to 1.85.1.89 is between 1.85 and 1.90, but closer to 1.90.
" Use place value.1.84, 2.10, 1.80, 1.89In the ones place, the least digit is 1.Three decimals have 1 as a ones digit.Compare these 3 decimals: 1.84, 1.80, 1.89In the tenths place, each decimal has the digit 8.So, look in the hundredths place:The least hundredths digit is 0; so, 1.80 is the least decimal.The next hundredths digit is 4; so, 1.84 is the next largest decimal.The next hundredths digit is 9; so, 1.89 is the next largest decimal.
So, from least to greatest: 1.80, 1.84, 1.89, 2.10
Example 4
Compare each pair of decimals. Place > or < between each pair.a) 0.5 and 0.08 b) 47.305 and 47.5
Solution
a) 0.5 and 0.08 b) 47.305 and 47.5Both decimals have 0 ones. Both decimals have 4 tens and 7 ones.In the tenths place, 5 > 0 In the tenths place, 3 < 5So, 0.5 > 0.08 So, 47.305 < 47.5
5. Order the numbers in each set from least to greatest.a) 7.32, 4.116, 3.79, 4.12, 3.1 b) 4.4, 0.62, 2.591, 0.65, 4.15c) 1.25, 3.62, 1.43, 2.81, 2.55 d) 3.669, 1.752, 3.68, 2.67, 1.8
Skills You’ll Need 119
!
1.75 1.80 1.85 1.90 1.95 2.05 2.10 2.15
1.89
2.00
2.101.80 1.84

We can use an area model to show fractions of one whole.
120 UNIT 4: Fractions and Decimals
4.1 Combining FractionsFind equivalent fractions and add fractions.Focus
Smith
Perry
Jones
Burns
Scullion
Haynes
FerriChan
551010
12
441010
2255
Work with a partner.Your teacher will give you a copy of the map.The map shows a section of land owned by 8 families.
• What fraction of the land did each family own? What strategies did you use?
Four families sold land to the other 4 families.
• Use the clues below to draw the new map.
• Write addition equations, such as !12! " !14! $ !34! , to keep track ofthe land sales.
Reflect & ShareDid you find any equivalent fractions? How do you know?Which clues helped you most to draw the new map? Explain how they helped.
This circle shows equivalent fractions.
The circle also shows:!12! " !25! " !1
10! $ 1
1: When all the sales were finished, four families owned all the land – Smith, Perry, Haynes, and Chan.
2: Each owner can walk on her or his land without having to cross someone else’s property.
3: Smith now owns !12! of the land.4: Perry kept !12! of her land, and sold the other half to Chan.5: Haynes bought land from two other people.
He now owns !136! of the land.
6 : Chan now owns the same amount of land as Haynes.

4.1 Combining Fractions 121
You can model fractions with strips of paper called fraction strips.
Here are more fraction strips and some equivalent fractions they show.
To add !14! " !12!, estimate first.
You know that !12! " !12! $ 1. Since !14! ' !12!, then !14! " !12! ' 1
Use fraction strips to add. Align the strips for !14! and !12! .
Find a single strip that has the same length as the two strips.
There are 2 single strips: !68! and !34!.
So, !14! " !12! $ !68!
And, !14! " !12! $ !34!
!34! and !68! are
equivalent fractions.
They represent the same amount.
Use fraction strips to add.!13! " !24!
!13! " !24!
Use the !13! - and !24!-
fraction strips.
These strips align with
the !56!-strip.!13! " !24! $ !56!
!14! $ !28! !12! $ !24! $ !48!
Example
Solution
Estimate: !13! < !12! ; !24! $ !12!
So, !13! " !24! < 1
35
410
14
28
12
24
48
12
14
68
34
24
13
56
1
This striprepresents1 whole.

Use models.
1. Which fraction is greater? How do you know?
a) !23! , !25! b) !34! , !23! c) !58! , !35! d) !34! , !56!
2. a) Add.
i) !15! " !15! ii) !23! " !13! iii) !140! " !1
30! iv) !14! " !24!
b) Look at your work in part a.How else could you add fractions with the same denominator?
3. Add. Estimate first.
a) !15! " !110! b) !12! " !13! c) !16! " !13! d) !14! " !18!
4. Add. Estimate first.
a) !24! " !38! b) !23! " !16! c) !25! " !120! d) !36! " !48!
5. Find 2 fractions that have a sum of 1.Try to do this as many ways as you can.
6. Meena’s family had a pizza for dinner. The pizza was cut into 8 equal pieces. Meena ate 1 piece, her brother ate 2 pieces,and her mother ate 3 pieces.a) What fraction of the pizza did Meena eat? Her brother eat?
Her mother eat?b) Which person’s fraction can you write in more than one way?
Explain.c) What fraction of the pizza was eaten? What fraction was left?
7. Find the missing number that makes both sides equal.
a) !15! " !12! $ !1!0! b) !1
!0! " !25! $ !1
60! c) !12! " !!
3! $ !78!
8. Assessment Focus Boris added 2 fractions. Their sum was !56!.Which 2 fractions might Boris have added? Find as many pairs of fractions as you can.
Write 4 equivalent fractions.How are these fractions the same? How are they different? Explain.
122 UNIT 4: Fractions and Decimals
A loonie has adiameter of about 25 mm. About howmany loonies, laidside by side, wouldthere be in 1 km?
Number Strategies

Game: Join the Dots 123
Join the Dots
HOW TO PLAY THE GAME:
1. Use dot paper. Mark an array of 49 dots.
2. Take turns to join 2 dots.
3. The player who completes a square claims that square bywriting her initials in it.
4. Continue playing until all squares are claimed.
5. Each player writes the squares he has as a fraction of the whole.
6. The winner is the player who can write the greatest number of equivalent fractions for her share.
What if you used asquare array of 81 dots.How would this affectthe game?
YOU WILL NEEDSquare dot paper
NUMBER OF PLAYERS2 or more
GOAL OF THE GAMETo write the greatestnumber ofequivalent fractions

Work on your own.
Baljit trains for cross-country one hour a day.One day, she ran for !13! of the time, walked for 25 minutes,then got a second wind and ran for the rest of the time.
How long did Baljit run altogether? What fraction of the hour is this?
• Use fractions to write an addition equation to show how Baljit spent her hour. Baljit never runs for the whole hour.
• Write another possible training schedule for Baljit.Share it with a classmate.
• Write an additon equation for your classmate’s training schedule.
Reflect & ShareCompare your equations with your classmate’s equation.Were the equations the same? Explain.When might a clock be a good model for thinking about adding fractions? When is a clock not a good model?
There are many models that help us add fractions.
• We could use clocks to model halves, thirds, fourths, sixths,and twelfths.
Circle models are useful when the sum is less than 1.
!12! " !13! " !112! $ !11
12!
124 UNIT 4: Fractions and Decimals
4.2 Adding Fractions Using Models
Add fractions using circles or fraction strips.Focus
12
6
9
78
1011
3
12
45

Example
Solution
• When the sum is greater than 1, we could use fraction strips and a number line.
Add. !12! " !45!
!12! " !45!
Place both strips end-to-end on the halves line.
The right end of the !45!-strip does not line up with a fraction on the halves line.
Place both strips on the fifths line.
The right end of the !45!-strip does not line up with a fraction on the fifths line.
Find a line on which to place both strips so the end of the !45!-striplines up with a fraction.
The end of the !45!-strip lines up with a fraction on the tenths line.
The strips end at !1130!.
So, !12! " !45! $ !1130!
4.2 Adding Fractions Using Models 125
!34! " !23! $ !1172!
Estimate:!45! is close to 1; so, !12! " !45! > 1
0 1210
2410
610
810
1210
1410
1610
1810
910
1910
110
310
510
710
1110
1310
1510
1710
12
45
0 1 212
32
12
45
0 115
225
35
45
65
75
85
95
12
45
23
34
0 1612
21812

Use models.
1. Write 2 equivalent fractions for each fraction shown.
a) b)
2. Add.
a) !24! " !34! b) !180! " !1
90! c) !35! " !45! d) !78! " !78!
3. Find 2 fractions with a sum of !32!.Try to do this as many ways as you can.Record each way you find.
4. Add. Estimate first.
a) !78! " !12! b) !170! " !35! c) !12! " !34! d) !56! " !23!
5. Add. Estimate first.
a) !38! " !34! b) !44! " !12! c) !22! " !46! d) !12! " !190!
6. Use your answers to questions 4 and 5.a) Look at the denominators in each part, and the number line
you used to get the answer. What patterns do you see?b) The denominators in each part of questions 4 and 5 are
related denominators.Why do you think they have this name?
7. Add.
a) !12! " !23! b) !12! " !25! c) !13! " !34! d) !22! " !35!
8. Look at your answers to question 7.a) Look at the denominators in each part, and the number line
you used to get the answer. What patterns do you see?b) The denominators in each part of question 7 are called
unrelated denominators.Why do you think they have this name?
c) When you add 2 fractions with unrelated denominators,how do you decide which number line to use?
126 UNIT 4: Fractions and Decimals
How many daysare there in onemillion seconds?
Calculator Skills

9. One day Ryan ran for 30 min, rested for 20 min, and then ranfor another 45 min. Use fractions of one hour. Write an additionequation that represents his training session.
10. A jug holds 2 cups of liquid. A recipe for punch is !12! cup of orange juice, !14! cup of raspberry juice,!38! cup of grapefruit juice, and !58! cup of lemonade.
Is the jug big enough for the punch? Explain.
11. Assessment Focus Use any of the digits 1, 2, 3, 4, 5, 6 only once. Copy and complete.Replace each ! with a number.
!!!! " !!!!
a) Find as many sums as you can that are between 1 and 2.b) Find the least sum that is greater than 1.Show your work.
12. Abey and Anoki are eating chocolate bars.The bars are the same size.Abey has !34! left. Anoki has !78! left.How much chocolate is left altogether?
13. A pitcher of juice is half empty.After !12! cup of juice is added, the pitcher is !34! full.How much juice does the pitcher hold when it is full?Show your thinking.
14. Which number line would you need to add each pair offractions? Explain.
a) !13! " !18! b) !13! " !15! c) !14! " !15! d) !14! " !16!
Which strategies do you use to add 2 fractions? Include 3 different examples in your answer.
Take It Further
4.2 Adding Fractions Using Models 127
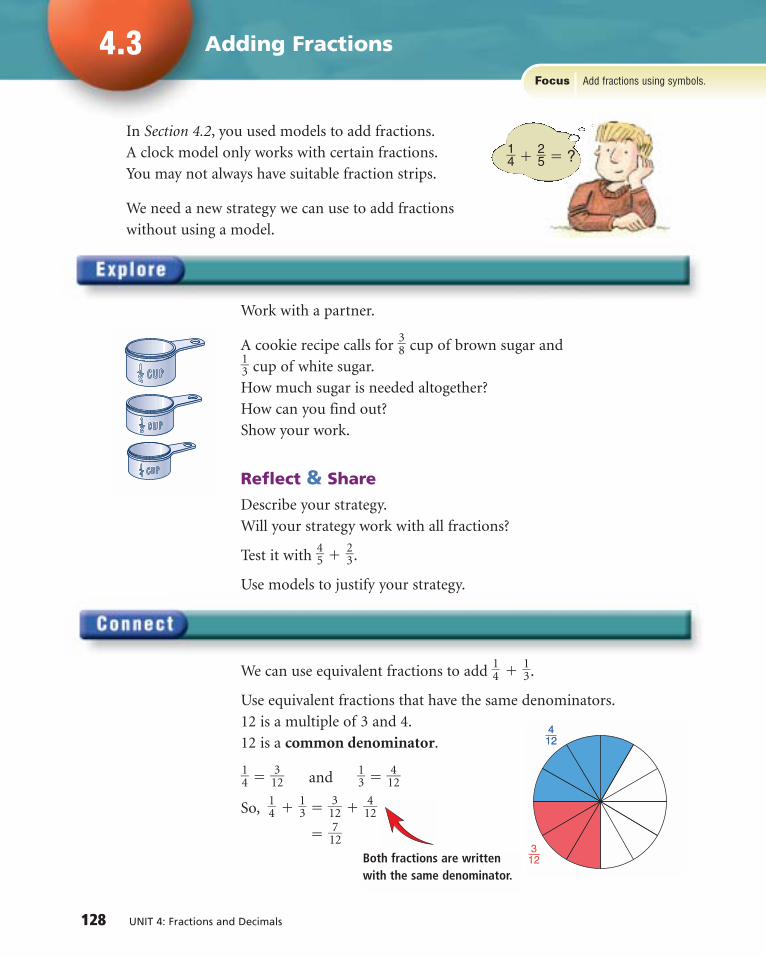
Work with a partner.
A cookie recipe calls for !38! cup of brown sugar and !13! cup of white sugar.How much sugar is needed altogether?How can you find out?Show your work.
Reflect & ShareDescribe your strategy.Will your strategy work with all fractions?
Test it with !45! " !23!.
Use models to justify your strategy.
We can use equivalent fractions to add !14! " !13!.
Use equivalent fractions that have the same denominators.12 is a multiple of 3 and 4.12 is a common denominator.
!14! $ !132! and !13! $ !1
42!
So, !14! " !13! $ !132! " !1
42!
$ !172!
128 UNIT 4: Fractions and Decimals
4.3 Adding FractionsAdd fractions using symbols.Focus
In Section 4.2, you used models to add fractions.A clock model only works with certain fractions.You may not always have suitable fraction strips.
We need a new strategy we can use to add fractionswithout using a model.
Both fractions are writtenwith the same denominator.
!14! " !25! $ ?
441212
312

Example 2
Solution
Example 1
Solution
Look at the pattern in the equivalent fractions below.
!14! $ !132! !13! $ !1
42!
So, to get an equivalent fraction, multiply numerator anddenominator by the same number.
We may also get equivalent fractions by dividing.
For example, !180! can be written !1
80&&
22! $ !45!
Add. !56! " !29!
!56! " !29!
The common denominator is a multiple of 6 and 9.List the multiples of 6: 6, 12, 18, 24, …List the multiples of 9: 9, 18, 27, 36, …18 is the lowest common multiple of 6 and 9.So, choose 18 as the common denominator.
!56! $ !1158! !29! $ !1
48!
!56! " !29! $ !1158! " !1
48!
$ !1198!
Add. !12! " !23! " !34!
!12! " !23! " !34!
2 is a multiple of 4.So, the common denominator is a multiple of 3 and 4.List the multiples of 3: 3, 6, 9, 12, 15, 18, …List the multiples of 4: 4, 8, 12, 16, 20, 24, …12 is the lowest common multiple of 3 and 4.
%4
%4
%3
%3
%3
%3
%2
%2
We say that 18 isthe lowest commondenominator.
Estimate:!56! is close to 1; !29! < !12!
So, !56! + !29! is less than 1!12!.
Estimate:!23! > !12! and !34! > !12!
So, !12! " !23! " !34! is greater than 1!12!.
We can write !1198! as a mixed number: 1!1
18!
4.3 Adding Fractions 129
This fraction is insimplest form.
A fraction is in simplestform when thenumerator anddenominator have nocommon factors.

130 UNIT 4: Fractions and Decimals
1. Add. Use grid paper. Draw a picture to show each sum.
a) !12! " !13! b) !13! " !15! c) !14! " !15! d) !15! " !16!
2. Copy and complete. Replace each ! with a number to make a true sentence.
a) !132! $ !!4! b) !34! $ !!
6! c) !36! $ !!4! d) !68! $ !1!5!
3. Add. Estimate first.
a) !45! " !12! b) !34! " !13! c) !23! " !45! d) !23! " !34!
4. Add.
a) !23! " !29! b) !16! " !152! c) !38! " !12! d) !34! " !78!
5. Add.
a) !56! " !14! b) !16! " !49! c) !170! " !46! d) !34! " !1
30!
6. One page of a magazine had 2 advertisements.One was !18! of the page, the other !1
16!.
What fraction of the page did these occupy?
7. Which sum is greater? How do you know?
!23! " !56! or !34! " !45!
8. Add.
a) !38! " !12! " !34! b) !14! " !32! " !25! c) !23! " !56! " !49!
So, 12 is the lowest common denominator.
!12! $ !162! !23! $ !1
82! !34! $ !1
92!
!12! " !23! " !34! $ !162! " !1
82! " !1
92!
$ !2132!
%6
%6
%4
%4
%3
%3
We can write !2132! as a mixed number: 1!11
12!
Multiply.• 5 % 27 % 2• 10 % 3 % 31• 4 % 9 % 25• 6 % 20 % 5
Which mental mathstrategies did you use?
Mental Math
A fraction withnumerator 1 is a unit fraction.
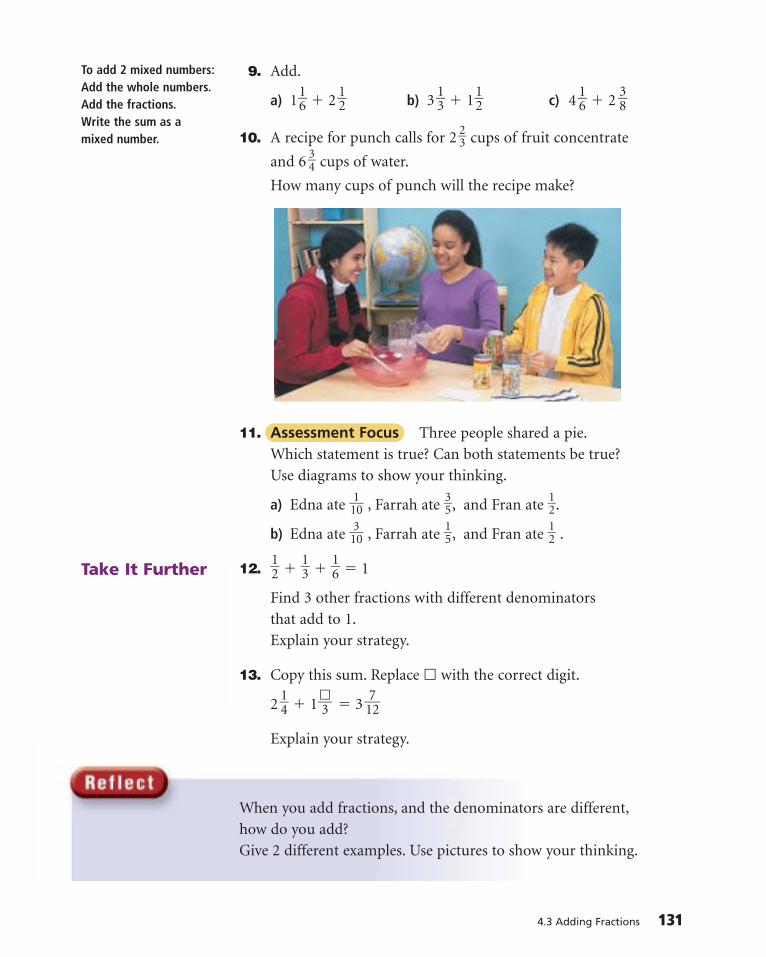
9. Add.
a) 1!16! " 2 !12! b) 3 !13! " 1!12! c) 4 !16! " 2 !38!
10. A recipe for punch calls for 2 !23! cups of fruit concentrate
and 6 !34! cups of water.
How many cups of punch will the recipe make?
11. Assessment Focus Three people shared a pie.Which statement is true? Can both statements be true? Use diagrams to show your thinking.
a) Edna ate !110! , Farrah ate !35!, and Fran ate !12!.
b) Edna ate !130! , Farrah ate !15!, and Fran ate !12! .
12. !12! " !13! " !16! $ 1
Find 3 other fractions with different denominators that add to 1.Explain your strategy.
13. Copy this sum. Replace ! with the correct digit.
2 !14! " 1!!3! $ 3 !172!
Explain your strategy.
When you add fractions, and the denominators are different,how do you add? Give 2 different examples. Use pictures to show your thinking.
4.3 Adding Fractions 131
Take It Further
To add 2 mixed numbers:Add the whole numbers.Add the fractions.Write the sum as a mixed number.

Work with a partner.You will need fraction strips and number lines.
Find 2 fractions with a difference of !12!.
How many different pairs of fractions can you find?Record each pair.
Reflect & ShareDiscuss with your partner.How are your strategies for subtracting fractions the same as yourstrategies for adding fractions? How are they different?
To subtract !35! # !12! , think addition: What do we add to !12! to get !35! ?Try the fifths number line.Place the !12!-strip with its right end at !35! .
The left end of the strip does not line up with a fraction on the line.Use a number line that has equivalent fractions for halves and fifths.Put the !12! -strip on the tenths number line, with its right end at !1
60!.
The left end of the strip is at !110!.
So, !35! # !12! $ !110!
Estimate:!35! < 1 ; so, !35! – !12! < !12!
Equivalent fractions:!35! $ !1
60!
!12! $ !150!
132 UNIT 4: Fractions and Decimals
4.4 Subtracting Fractions Using ModelsSubtract fractions using fraction stripsand number lines.
Focus
0 115
25
35
45
12
0 1210
410
610
810
910
110
310
510
710
12

Use fraction strips and number lines to subtract.
a) !65! # !45! b) !58! # !14!
a) !65! # !45!
Think addition.What do we add to !45! to get !65! ?Use the fifths number line because both denominators are 5.Place the !45!-strip on the fifths number line with its right end at !65!.
The left end of the strip is at !25!.
So, !65! # !45! $ !25!
b) !58! # !14!
Think addition.What do we add to !14! to get !58! ?
Use a number line that shows equivalent fractions for eighths and fourths.That is, use the eighths number line.Place the !14!-strip on the eighths number line with its right end at !58!.
The left end of the strip is at !38!.
So, !58! # !14! $ !38!
4.4 Subtracting Fractions Using Models 133
Example
Solution Estimate:!65! > 1, !45! < 1;
so, !65! – !45! < 1
Estimate:!58! is between !12! and 1,!14! < !12! ; so , !58! – !14! < !12!
0 128
48
68
18
38
58
78
14
0 115
225
35
45
65
75
85
95
45

0 1 224
64
14
54
74
34
64
12
0 128
48
68
18
38
58
78
2108
128
148
98
118
138
158
34
Use models.
1. Subtract.
a) !34! # !24! b) !45! # !15! c) !23! # !13! d) !58! # !38!
2. a) Write a rule you could use to subtract fractions with like denominators without using number lines or fraction strips.
b) Write 3 subtraction questions with like denominators.Use your rule to subtract the fractions.Use fraction strips and number lines to check your answers.
3. Write the subtraction equation that each number line andfraction strip represent.
a)
b)
c)
4. Subtract. Estimate first.
a) !38! # !14! b) !56! # !23! c) !54! # !12! d) !170! # !35!
5. Subtract. Estimate first.
a) !34! # !12! b) !34! # !38! c) !23! # !16! d) !56! # !12!
6. Aaron has !23! cup of raisins. He gives Raj !12! cup.How much does Aaron have left?
7. Subtract.
a) !23! # !14! b) !53! # !12! c) !12! # !15! d) !32! # !13!
134 UNIT 4: Fractions and Decimals
Find:
• 8 tenths less than 22.23
• 9 hundredths more than 94.43
• 36 hundredths more than 48.425
• 36 thousandthsmore than 48.425
Number Strategies
0 126
46
16
36
56
13
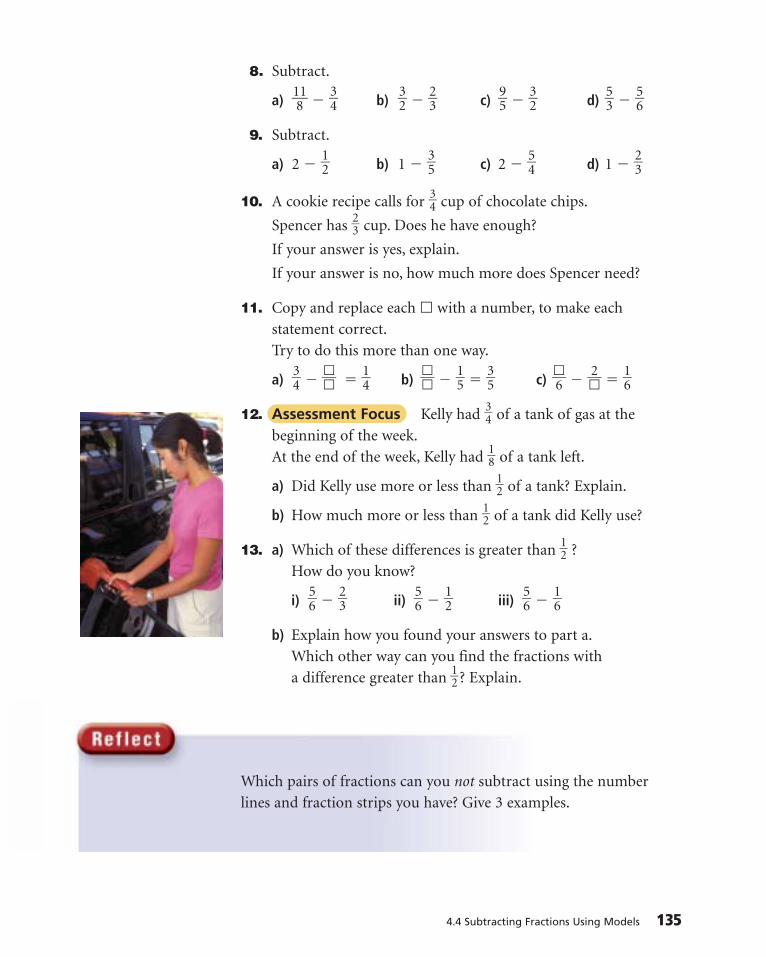
8. Subtract.
a) !181! # !34! b) !32! # !23! c) !95! # !32! d) !53! # !56!
9. Subtract.
a) 2 # !12! b) 1 # !35! c) 2 # !54! d) 1 # !23!
10. A cookie recipe calls for !34! cup of chocolate chips.
Spencer has !23! cup. Does he have enough?
If your answer is yes, explain.
If your answer is no, how much more does Spencer need?
11. Copy and replace each ! with a number, to make each statement correct.Try to do this more than one way.
a) !34! # !!!! $ !14! b) !!!! # !15! $ !35! c) !!6! # !!2! $ !16!
12. Assessment Focus Kelly had !34! of a tank of gas at the beginning of the week.At the end of the week, Kelly had !18! of a tank left.
a) Did Kelly use more or less than !12! of a tank? Explain.
b) How much more or less than !12! of a tank did Kelly use?
13. a) Which of these differences is greater than !12! ?How do you know?
i) !56! # !23! ii) !56! # !12! iii) !56! # !16!
b) Explain how you found your answers to part a.Which other way can you find the fractions with a difference greater than !12! ? Explain.
Which pairs of fractions can you not subtract using the number lines and fraction strips you have? Give 3 examples.
4.4 Subtracting Fractions Using Models 135

4.5 Subtracting Fractions Subtract fractions using symbols.Focus
Addition and subtraction are related operations.You can use what you know about adding fractions to subtract them.
Work with a partner.Use any of the digits 1, 2, 3, 4, 5, 6 only once.Copy and complete. Replace each ! with a number.
!!!! # !!!!
Find the least difference greater than 0.Which strategies did you use?
Reflect & ShareCompare your least difference with that of another pair of classmates.Are the differences the same?If your answer is no, what is the least difference?
To subtract !34! # !16! , estimate first.!34! is between !12! and 1, and !16! ' !14! .
So, !34! # !16! is about !12!.
Use equivalent fractions to subtract.
Express !34! and !16! with a common denominator.
Find the lowest common denominator.
List the multiples of 4: 4, 8, 12, 16, 20, …
List the multiples of 6: 6, 12, 18, 24, 30, …
The lowest common denominator is 12.
!34! $ !192! !16! $ !1
22!
!34! # !16! $ !192! # !1
22!
$ !172!
%3
%3
%2
%2
136 UNIT 4: Fractions and Decimals
9 twelfths minus 2 twelfths is 7 twelfths.
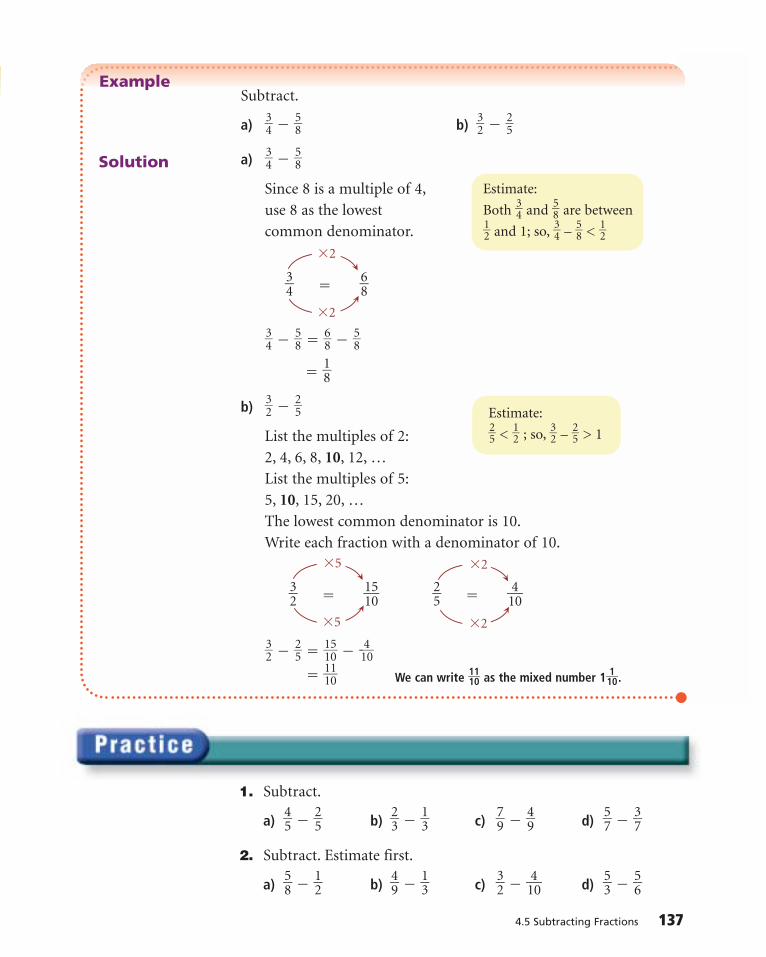
Example
Solution
Subtract.
a) !34! # !58! b) !32! # !25!
a) !34! # !58!
Since 8 is a multiple of 4,use 8 as the lowest common denominator.
!34! $ !68!
!34! # !58! $ !68! # !58!
$ !18!
b) !32! # !25!
List the multiples of 2:2, 4, 6, 8, 10, 12, …List the multiples of 5:5, 10, 15, 20, …The lowest common denominator is 10.Write each fraction with a denominator of 10.
!32! $ !1150! !25! $ !1
40!
!32! # !25! $ !1150! # !!1
40!
$ !1110!
4.5 Subtracting Fractions 137
We can write !1110! as the mixed number 1!1
10!.
1. Subtract.
a) !45! # !25! b) !23! # !13! c) !79! # !49! d) !57! # !37!
2. Subtract. Estimate first.
a) !58! # !12! b) !49! # !13! c) !32! # !140! d) !53! # !56!
Estimate:!25! < !12! ; so, !32! – !25! > 1
Estimate:
Both !34! and !58! are between !12! and 1; so, !34! – !58! < !12!
%2
%2
%5
%5
%2
%2

3. Subtract.
a) !56! # !29! b) !56! # !24! c) !58! # !132! d) !1
70! # !1
45!
4. Subtract. Estimate first.
a) !34! # !23! b) !52! # !34! c) !45! # !23! d) !54! # !45!
5. Subtract.
a) !46! # !12! b) !53! # !34! c) !72! # !32! d) !56! # !34!
6. Subtract.
a) 5 !57! # 1!27! b) 3 !49! # 2 !16! c) 4 !130! # 2 !15! d) 4 !35! – 2 !12!
7. Assessment Focus Terri biked 2 !14! h on Sunday.Terri increased the time she biked by !14! h every day.Sam biked !12! h on Sunday.Sam increased the time he biked by !12! h every day.
a) Who will bike longer the next Saturday? Explain.
b) For how much longer will this person bike?
c) What did you need to know about fractions to answer these questions?
8. A recipe calls for !34! cup of walnuts and !23! cup of pecans.Which type of nut is used more in the recipe? How much more?
9. Write as many different subtraction questions as you can where the answer is !34!.
10. The difference of 2 fractions is !12
!.The lesser fraction is between 0 and !14!.What do you know about the other fraction?
When you subtract fractions, and the denominators are different,how do you subtract? Give 2 different examples.Explain your steps.
138 UNIT 4: Fractions and Decimals
Calculator Skills
Suppose the key on your calculator
is broken. How would youuse your calculator to findeach answer?
• 18 + 27
• 118 – 85
• 18 % 27
• 225 & 8
8
To subtract 2 mixednumbers: Subtract thewhole numbers.Subtract the fractions.Write the difference as a mixed number.

Game: Shade One 139
HOW TO PLAY THE GAME:
1. Each player chooses adifferent colour marker.
2. Place the set of fractioncards face down.
3. Player A turns over acard. This is his targetfraction.
4. Player A could shade thetarget fraction on onefraction strip, or share thefraction among several fraction strips. However, the totalfraction shaded must equal the target fraction.
For example: If your target fraction is !34!, you could shadefrom 0 to !34! on the fourths strip, or 0 to !68! on the eighthsstrip. Or you could shade several fractions that add up to!34!. For example, you could shade !1
32!, !28!, and !14!; or you
could shade !25!, !110!, and !14!.
5. Player B turns over the next fraction card.He repeats Step 4 for his fraction.
6. Play continues with players taking turns to shade thetarget fraction. If there is not enough of a fraction stripleft, and it is impossible to shade the target fraction, thatplayer forfeits his turn. When a player is not able to shadeany more fractions, the game is over.
7. The player who shades to complete 1 whole gets 1 point.
8. The person with the most points wins.
Shade One
YOU WILL NEEDOne gameboard;coloured markers;1 set of 42 fraction cards
NUMBER OF PLAYERS2 or more
GOAL OF THE GAMETo shade 1 whole on each fraction strip

1. Add. Use fraction strips to help you.
a) !23! " !16! b) !24! " !13!
c) !28! " !24! d) !120! " !35!
2. We know that !12! " !45! $ !1130!.
Use this result to find each sum.
a) 1!12! " !45! b) 5 !12! " 2 !45!
3. Use models to add.
a) !45! " !35! b) !23! " !12!
c) !12! " !56! d) !32! " !13!
4. Add. Estimate first.
a) !34! " !56! b) !32! " !23!
c) !170! " !25! d) !59! " !56!
5. Add.
a) !25! " !32! " !130!
b) !38! " !34! " !12!
c) !13! " !56! " !29!
6. Add.
a) 2 !13! " 3 !13!
b) 2 !14! " 1!13!
c) 1!34! " 3 !38!
7. Use models to subtract.
a) !78! # !34! b) !32! # !35!
c) !43! # !56! d) !161! # !23!
8. Peter put !45! cup of chocolate chips into his cookie batter.Samantha put !78! cup into hers.Whose batter contains more chips? How do you know?
9. Alex delivered flyers to !14! of herroute on Saturday morning.She delivered to !23! of the route onSaturday afternoon, and the remainder on Sunday.a) What fraction of her route did
Alex deliver on Saturday?b) What fraction did she deliver
on Sunday?
10. Subtract. Estimate first.
a) !32! # !15! b) !76! # !23!
c) !161! # !34! d) !11
30! # !35!
11. We know that !98! # !14! $ !78!.
Use this result to find each
difference.
Explain how you did this.
a) !182! # !14! b) !58! # !14!
12. Subtract.
a) 3 !58! # 2 !38! b) 2 !12! # 1!14!
140 UNIT 4: Fractions and Decimals
LESSON
4.1
4.2
4.3
4.5
4.4

Work with a partner.Jan takes !34! h to walk to her music lesson.Jan has a music lesson once a week, for 9 weeks.How much time does Jan spend walking to her music lessons?
Reflect & ShareCompare your strategy for solving the problem with that of another pair of classmates.Did you get the same answers?If not, who is correct? Explain.
!15! " !15! " !15! " !15! $ !45!
All the fractions added are !15!.Repeated addition can be written as multiplication.
!15! " !15! " !15! " !15! $ 4 % !15! $ !45!
We can show this as a picture.
Similarly: !34! " !34! " !34! " !34! " !34!
$ 5 % !34!
$ !145!
We can show this as a picture.
4.6 Exploring Repeated Addition Multiply a fraction by a whole number.Focus
4.6 Exploring Repeated Addition 141
How many ways can you find this sum?2 " 2 " 2 " 2 " 2 " 2 " 2 " 2 " 2You can use the same strategies in Explore.
4 %
shaded
shaded
shaded
shaded
$15
15
15
15
15 4
5
5 %
shaded
shaded
shaded
shaded
shaded
$34
34
34
34
34
34
154
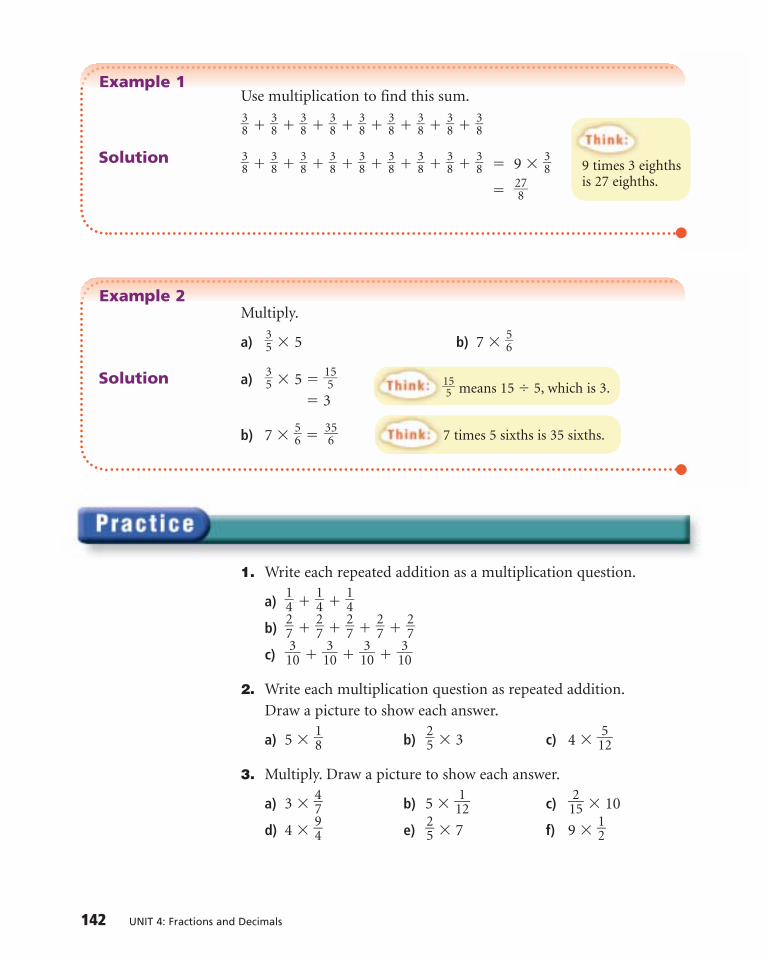
Example 2
Solution
Example 1
Solution
Use multiplication to find this sum.
!38! " !38! " !38! " !38! " !38! " !38! " !38! " !38! " !38!
!38! " !38! " !38! " !38! " !38! " !38! " !38! " !38! " !38! $ 9 % !38!
$ !287!
Multiply.
a) !35! % 5 b) 7 % !56!
a) !35! % 5 $ !155!
$ 3
b) 7 % !56! $ !365!
1. Write each repeated addition as a multiplication question.
a) !14! " !14! " !14!
b) !27! " !27! " !27! " !27! " !27!
c) !130! " !1
30! " !1
30! " !1
30!
2. Write each multiplication question as repeated addition.Draw a picture to show each answer.
a) 5 % !18! b) !25! % 3 c) 4 % !152!
3. Multiply. Draw a picture to show each answer.
a) 3 % !47! b) 5 % !112! c) !1
25! % 10
d) 4 % !94! e) !25! % 7 f) 9 % !12!
142 UNIT 4: Fractions and Decimals
9 times 3 eighths is 27 eighths.
!155! means 15 & 5, which is 3.
7 times 5 sixths is 35 sixths.

4. Multiply.
a) 3 % !45! b) 5 % !170! c) !56! % 6
d) !12! % 5 e) 12 % !172! f) !23! % 9
5. It takes !23! h to pick all the apples on one tree at Springwater Farms. There are 24 trees.How long will it take to pick all the apples? Show your work.
6. a) Draw a picture to show each product. What is each answer?
i) 4 % !130! ii) 3 % !1
40!
b) How are the questions in part a related?Write 2 more questions like these.Find each product. What do you notice?
7. A cookie recipe calls for !34! cup of oatmeal.How much oatmeal is needed to make 3 batches of cookies?
8. Assessment Focus
a) Draw a picture to show 5 % !12!.
b) What meaning can you give to !12! % 5?
Draw a picture to show your thinking.
9. Jacob takes !34! h to fill one shelf at the supermarket.Henry can fill the shelves in half Jacob’s time.There are 15 shelves. Henry and Jacob work together.How long will it take to fill the shelves? Justify your answer.
Draw a picture to show why 4 % !25! is the same as !25! + !25! + !25! + !25!.Explain your picture.Draw a different picture to show the same answer.
4.6 Exploring Repeated Addition 143
Number Strategies
Calculate each answer.
6000 & 10 6000 % 0.1
600 & 10 600 % 0.1
60 & 10 60 % 0.1
6 & 10 6 % 0.1
What patterns do you see in the questions and answers?
Take It Further

!
144 UNIT 4: Fractions and Decimals
Fractions to Decimals
A period above anequal sign showsthe answer isapproximate.
Recall that !110! means 1 ÷ 10, which is 0.1 as a decimal.
Similarly, !12! means 1 ÷ 2, which is 0.5 as a decimal.
0.1 and 0.5 are terminating decimals, because each has a definitenumber of decimal places.
On a calculator, press: to display 0.090909091
The calculator rounds up the last digit.The fraction !1
11! is a repeating decimal.
The decimal for !111! is 0.0"9", with a bar above the 0 and 9 to show
they repeat.
We can round 0.0"9" to an approximate decimal.
• 0.0"9" ! 0.1 to 1 decimal place
• 0.0"9" ! 0.09 to 2 decimal places
• 0.0"9" ! 0.091 to 3 decimal places
1. Investigate other unit fractions; that is, fractions with
numerator 1.
a) Which unit fractions from !13! to !210! produce
terminating decimals?
Which produce repeating decimals? Explain why.
b) Investigate other fractions.
For example, how are the decimals for !16!, !26!, …, !56! related?
2. Investigate fractions with greater denominators.
For example, how are the decimals for !19!, !919!, !9
199!, … related?
3. Which is greater in each case? Justify your answer.
a) 0.3" or 0.3
b) !19! or 0.11
$111 ÷

4.7 Multiplying Decimals 145
4.7 Multiplying DecimalsMultiply decimals with tenths.
To multiply 2 whole numbers,we can use Base Ten Blocks.This picture shows the product 20 % 16 = 100 " 100 " 60 " 60
= 320
We can also use Base Ten Blocks to multiply a decimal and a whole number.
The flat The rod The small cuberepresents 1. represents 0.1. represents 0.01.
This picture shows the product 2 % 1.6 $ 1 " 1 " 0.6 " 0.6
$ 3.2
In Explore, you will use Base Ten Blocks to multiply 2 decimals.
Focus
16
20
10
6
2
1.6
1.0
0.6
Work with a partner.A rectangular tabletop measures 2.4 m by 1.8 m.Use Base Ten Blocks to find the area of the tabletop.Record your work on grid paper.
Reflect & ShareCompare your answer with that of another pair of classmates.Did you draw the same picture? Explain.Did you get the same area? Explain.

Example 1
Solution
A rectangular park measures 1.7 km by 2.5 km.
Here are 2 ways to find the area of the park.
" Use Base Ten Blocks.
There are 2 flats: 2 % 1 $ 2There are 19 rods: 19 % 0.1 $ 1.9There are 35 small cubes: 35 % 0.01 $ 0.35The total area is 2 " 1.9 " 0.35 $ 4.25The area of the park is 4.25 km2.
" Use the method for multiplying 2 whole numbers.The area, in square kilometres, is 1.7 % 2.5.Multiply: 17 % 25
Estimate to place the decimal point in the answer.1.7 % 2.5 is about 2 % 3 $ 6So, the product is 4.25.The area of the park is 4.25 km2.
Multiply. 5.8 % 9.7
5.8 % 9.7Multiply: 58 % 97
Estimate to place the decimal point.5.8 % 9.7 is about 6 % 10 $ 60.So, the product is 56.26.
146 UNIT 4: Fractions and Decimals
58% 97
40652205626
17% 25
85340425
1.7
2.5

Multiply.a) 0.9 % 6.8 b) 0.5 % 0.4
a) 0.9 % 6.8Multiply: 9 % 68
Estimate to place the decimal point.0.9 % 6.8 is about 1 % 7 $ 7.So, the product is 6.12.
b) 0.5 % 0.4Multiply: 5 % 4 $ 20Estimate to place the decimal point.0.5 % 0.4 is about 1 % 0.4 $ 0.4.So, the product is 0.20.
1. Write a multiplication equation for each picture.Each small square represents 0.01.
a) b)
2. Use Base Ten Blocks to find each product.a) 2.6 % 1.5 b) 1.4 % 2.8 c) 2.7 % 1.6
3. Use Base Ten Blocks to find each product.Record your work on grid paper.a) 2.3 % 0.4 b) 0.6 % 1.9 c) 0.8 % 0.7
4. Multiply: 36 % 24Use this to find each product. Explain your work.a) 36 % 2.4 b) 3.6 % 24 c) 3.6 % 2.4
5. Multiply.a) 4.2 % 3.7 b) 8.9 % 0.3 c) 0.6 % 0.9
4.7 Multiplying Decimals 147
Example 2
Solution 68% 9612

6. Carla drives 7.6 km to work. She drives the same distance home.How many kilometres does Carla drive in a 5-day workweek?
7. A rectangular plot of land measures 30.5 m by 5.3 m.What is the area of the plot?
8. a) Multiply.i) 6.3 % 1.8 ii) 4.2 % 0.7 iii) 0.8 % 0.5
b) Look at the questions and products in part a. What patterns do you see in the numbers of decimal places in the question and the product? How could you use this pattern to place the decimal point in a product without estimating?
9. The product of 2 decimals is 0.36.What might the decimals be? Find as many answers as possible.
10. Recall that dividing by 10 is the same as multiplying by 0.1.Multiply to find:
a) !110! of 25.2 b) !1
20! of 37.3 c) !1
60! of 58.7
11. Assessment Focus An area rug is rectangular.Its dimensions are 3.4 m by 2.7 m.Show different strategies you can use to find the area of the rug. Which strategy is best? Justify your answer.
12. a) Find each product.i) 4.8 % 5.3 ii) 4.8 % 0.6 iii) 0.4 % 0.6
b) When you multiply 2 decimals, how does the productcompare with the numbers you multiplied? Explain your reasoning.
13. Explain why the sum of the number of digits to the right of thedecimal point in the factors of a product equals the number ofdigits to the right of the decimal point in the product.
When you multiply 2 decimals, how do you know where to place thedecimal point in the product? Use examples to explain.
148 UNIT 4: Fractions and Decimals
Take It Further
Calculator Skills
Which is greater in each pair?
0.3 or !13! 0.4 or !14!
0.7 or !23! 0.09 or !111!
Justify your answer.

4.8 Dividing Decimals 149
Work with a partner.Mark bought 19.5 m of fabric to make costumes for a play.Each costume needs 2.6 m of fabric.How many costumes can Mark make? How much material is left over?Show your work.
Reflect & ShareHow did you use division of whole numbers to find your answer?
4.8 Dividing DecimalsDivide decimals with tenths.Focus
Recall that we can use the same Base Ten Blocks to multiply:14 % 18 $ 252 and 1.4 % 1.8 $ 2.52
The only difference is the values we assign to the flat, the rod, and the small cube.
In a similar way, we can divide 2 decimals by thinking about whole numbers instead.
So, 252 & 18 $ 14 and 2.52 & 1.8 $ 1.4
To divide 2 decimals, ignore the decimal points.Divide as you would whole numbers, then estimate to place the decimal point in the answer.
14
18
1.4
1.8

Example
Solution
Jan bought 18.9 m of framing to make picture frames.Each picture needs 1.8 m of frame.How many frames can Jan make? How much framing material is left over?
To divide: 18.9 & 1.8, ignore the decimal points.Find 189 & 18, then estimate.
10.518#18"9."0"
1809 09 0
0
189 & 18 $ 10.5Estimate to place the decimal point correctly.18.9 & 1.8 is about 20 & 2, which is 10.So, 18.9 & 1.8 is 10.5.
Jan can make 10 frames.10 frames use 10 % 1.8 m $ 18 m.So, the framing material left is 18.9 m – 18 m $ 0.9 m.
Sometimes when we divide 2 decimals, the quotient is not aterminating decimal.
Divide.a) 12.5 & 0.6 b) 25.2 & 4.7
a) 12.5 & 0.6
6 125.50202020. 8 3 3
If we continue to divide, the 3 in the quotient repeats.So, 125 & 6 $ 20.83"To estimate: 12.5 & 0.6 is about 13 & 1 $ 13.So, the quotient is 20.83".
150 UNIT 4: Fractions and Decimals
When you divide 2 numbers, theanswer is thequotient.
Use short division to find 125 & 6.

4.8 Dividing Decimals 151
b) 25.2 & 4.7
5.3647#"25"2."00"
23517 014 1
2 902 82
8
Round the quotient to 5.4.To estimate: 25.2 & 4.7 is about 25 & 5 $ 5.So, the quotient is approximately 5.4.
1. Look at each division equation on the left.Estimate each quotient on the right.a) 234 & 13 $ 18 23.4 & 1.3b) 133 & 7 $ 19 13.3 & 7c) 714 & 34 $ 21 71.4 & 3.4d) 450 & 18 $ 25 4.5 & 1.8e) 51 & 17 $ 3 5.1 & 1.7
2. Choose the correct quotient for each division question.Explain how you know.
Question Possible Quotientsa) 5.95 & 3.5 17 1.7 0.17b) 195.3 & 6.2 315 31.5 3.15c) 31.32 & 1.8 174 17.4 1.74d) 1.44 & 0.12 12 1.2 0.12
3. Divide.a) 8.7 & 0.3 b) 2.24 & 0.7 c) 10.3 & 0.6
4. Divide.a) 10.92 & 0.6 b) 30.42 & 1.3 c) 18.56 & 5.8
There is 1 decimal place in each number in the
question. Continue to divide until there are 2 decimal
places in the quotient. That is, calculate the quotient
to 1 more decimal place than in the question.
Then, round the quotient to 1 decimal place.
Use long division to find 252 & 47.
Number Strategies
A rectangular prism hasdimensions 6 cm by 4 cm by 8 cm. Find thesurface area andvolume of thisrectangular prism.

Measurement
The prefixes in units of length less than 1 m show fractions or decimals of 1 m.
One decimetre is !110!
or 0.1 m.
One centimetre is !1100!
or 0.01 m.
One millimetre is !10100!
or 0.001 m.
One micrometre is !1 0010 000!
or 0.000 001 m.
5. Divide. Round the quotient to the nearest tenth.a) 172.5 & 2.6 b) 21.68 & 3.4 c) 92.8 & 8.2
6. Divide. Round to the nearest tenth where necessary.a) 7.3 & 0.4 b) 1.98 & 1.3 c) 426.8 & 3.7
7. The quotient of 2 decimals is 0.12. What might the decimals be?Write as many different possible decimal pairs as you can.
8. Assessment Focus Alex finds a remnant of landscaping fabric at a garden store.The fabric is the standard width, with length 9.7 m.Alex needs twelve 0.85-m pieces for a garden patio.a) Will Alex have more fabric than she needs?
If so, how much more?b) Will Alex need more fabric? If so, how much more?
9. The area of a rectangular lawn is 120.4 m2.The width is 5.6 m. What is the length?
10. The question 237 & 7 does not have an exact quotient.The first five digits of the quotient are 33857. The decimal point has been omitted. Use only this information and estimation.Write an approximate quotient for each question.Justify each answer.a) 237 & 0.7 b) 2.37 & 7 c) 23.7 & 7 d) 2370 & 70
11. Here is a recipe for bread.Sam wants to make one-half the amount.Find how much of each ingredient Sam needs.
12. Jack has 2.5 L of juice.Each day, he drinks 0.4 L.How many days will it take Jack to drink the juice?Justify your answer.
Explain how you decide where to place the decimal point when youdivide 2 decimals. Use an example in your explanation.
152 UNIT 4: Fractions and Decimals

The World of Work: Advertising Sales Representative 153
Magazines and newspapers make money by sellingadvertising space.
The advertising sales representative contacts companieswhose products might be of interest to readers. She offers tosell them various sizes of advertisement space at differentrates. When talking about ads smaller than a full page, thesales rep uses fractions to describe them. It’s much simpler totalk about a !23!-page ad instead of a 0.666 667 page ad!
The sales rep tries to sell combinations of ads that can fillpages, with no space left over. A sales rep has sold two !14!-pageads and one !16!-page ad. She wants to know the possiblecombinations of ad sizes she can sell to fill the page.What might they be?
photo of person, change He/She whenphoto decided
Advertising Sales Representative

We use a base ten, or decimal, number system.Every whole number is also a decimal.So, we use the same order of operations for decimals as for whole numbers.
Example
Solution
Work on your own.Evaluate this expression: 6 % (15.9 " 36.4) & 4Explain each step.
Reflect & ShareCompare your solution and answer with that of a classmate.If your answers are different, who has the correct answer?
Here is the order of operations.
• Do the operations in brackets first.
• Then divide and multiply, in order, from left to right.
• Then add and subtract, in order, from left to right.
Evaluate. 12.4 # (4.7 " 1) " 2.4 % 3 # 4.8 & 2
12.4 # (4.7 " 1) " 2.4 % 3 # 4.8 & 2 Calculate in brackets.
= 12.4 # 5.7 " 2.4 % 3 # 4.8 & 2 Multiply and divide from left to right.
= 12.4 # 5.7 " 7.2 # 2.4 Add and subtract from left to right.
= 6.7 " 7.2 # 2.4
= 13.9 # 2.4
= 11.5
154 UNIT 4: Fractions and Decimals
4.9 Order of Operations with DecimalsFocus Use the order of operations
to evaluate expressions.

1. Evaluate.a) 3.4 " 4 % 7 b) 14 # 2.2 % 5 c) 8 # 3.6 & 2
2. Evaluate.a) 7.4 # 3 " 2.3 % 4 b) 4.6 " 5.1 # 3.2 & 2c) 16.4 # (10.8 # 3.1) d) 23 % 6.2 " 4e) 81.2 # (35.8 " 2.1) f) 85.7 & 0.4 % 7
3. Evaluate.a) 46.78 # 6.1 % 2.3 b) 75.06 % (3.45 # 1.2)c) (98.5 " 7) & 2.5 d) 9.0023 % 5.1 # 4.32 % 6e) 8.3 " 46.2 & 1.4 f) 70.56 # 32.8 & 4.1
4. Evaluate.a) 3.2 " 5.6 % 7.2 & 2.4 # 9.3b) 8.5 % 7 # 6.3 & 9 " 10.6c) 1.35 " (5 % 4.9 & 0.7) – 2.7 % 2.1d) (4.7 # 3.1) % 5 – 7.5 & 2.5
5. Evaluate.a) 164.5 & 7 % 10 " 7.2 b) 73.8 % (3.2 " 6.8) # 14.1 & 0.2
6. The cross-country team members ran timed circuits.Here are their times: 15.8 min,12.5 min, 18.0 min, 14.2 min,13.9 min, 16.0 min, 16.2 min,17.5 min, 16.3 min, 15.6 minFind the mean time.
7. Assessment FocusEvaluate. Show all steps.0.38 " 16.2 % (2.1 " 4) " 21 & 3.5
Explain why the brackets are unnecessary in this expression:(4.2 % 3.8) # (15.25 & 6.1)Find the answer. Show each step.
4.9 Order of Operations with Decimals 155
Number Sense
A number cube has faces labelled 1 to 6.
The cube is rolled 75 times.
About how many times will the number 3 show?
The mean time is the sumof the times divided bythe number of times.

THINK about what you did in math.
• Which materials did you use?• Which problem did you solve?
How did you solve it?• What did you learn?• What are you confused about?• What vocabulary did you use?• What was challenging? What was easy?
TALK about what you did in math.
• Work with a partner or in a group.• Share your ideas. Listen to the ideas of others.• What information did your partner or group
share that was new?• Ask your partner or group members about any
issue that was confusing … what did they say?
BRAINSTORM all your ideas.
• Make dot jots of the things you discussed and thought about.Don’t leave anything out … you can edit it later.
• Think about how you can support your written work.Use graphs, tables, numbers, symbols, diagrams, and so on.
Writing a Math Journal Entry
156 UNIT 4: Fractions and Decimals

WRITE your ideas.
• Put your thoughts into words.Be sure you follow a logical order.
• Think about what you write. Are you usingmath language? Underline this language.
READ your ideas out loud.
• Listen for missing words.• Be sure your thoughts are in a logical order.• Add anything that is missing.• What is unclear? Why? What would help?• Add graphs, tables, and so on, that will help
explain your written work.
READ your work to your partner or group.
• Listen to your partner's or group members’ ideas.• Discuss: What was done well?
What part was not clear? What would help improve the journal entry?
Reading and Writing in Math: Writing a Math Journal Entry 157
REVISE and REWRITE.
• Make the changes that are necessary.• Rewrite on a new piece of paper if necessary.

158 UNIT 4: Fractions and Decimals
What Do I Need to Know?
Adding and Subtracting Fractions
There are 4 types of fraction questions. Look at the denominators.
! Same denominators
For example, !56! and !26!
!56! " !26! $ !76! !56! # !26! $ !36!
! Related denominatorsFor example, !16! and !1
12!
12 is a multiple of 6, so the lowest common denominator is 12.!16! $ !1
22!
!16! " !112! $ !1
22! " !1
12! $ !1
32! !16! # !1
12! $ !1
22! # !1
12! $ !1
12!
! Partially related denominatorsFor example, !16! and !19!
6 and 9 have the common factor, 3.So, list multiples to find the lowest common denominator.Multiples of 6: 6, 12, 18, 24, 30, …Multiples of 9: 9, 18, 27, 36, …The lowest common denominator is 18.
!16! $ !138! ; !19! $ !1
28! ; !16! " !19! $ !1
38! " !1
28! $ !1
58! ; !16! # !19! $ !1
38! # !1
28! $ !1
18!
! Unrelated denominatorsFor example, !15! and !16!
5 and 6 have no common factors, so the lowest common denominator is their product: 5 % 6 = 30
!15! $ !360! ; !16! $ !3
50! ; !15! " !16! $ !3
60! " !3
50! $ !13
10! ; !15! # !16! $ !3
60! # !3
50! $ !3
10!
Multiplying a Fraction by a Whole Number
! This is the same as repeatedly adding the same fraction.
4 % !35! $ !35! " !35! " !35! " !35! $ !152!
Review any lesson with

LESSON
4.1
4.2
1. Which fraction is greater? How do you know?
a) !25! , !26! b) !130! , !12!
c) !48! , !36! d) !72! , !73!
2. Add.
a) !23! " !16! b) !34! " !28!
c) !14! " !36! d) !110! " !35!
3. Find 2 fractions that add to !58!.Find as many pairs of fractions as you can.
4. Add.
a) !23! " !56! b) !12! " !34!
c) !12! " !190! d) !88! " !14!
5. Adam eats !130! of a pizza.
Julie eats !25! of the pizza.a) How much of the pizza
is eaten?b) How much is left?
6. Add. Draw a picture to showeach sum.
a) !13! " !25! b) !12! " !38!
c) !23! " !130! d) !35! " !14!
7. Add.
a) !25! " !56! b) !14! " !25!
c) !130! " !56! d) !38! " !23!
8. Add.
a) 6 !13! " 2 !13! b) 1!152! " 2 !16!
c) 2 !130! " 3 !15! d) 5 !14! " 2 !25!
9. Add.
a) !23! " !34! " !38!
b) !52! " !13! " !25!
c) !170! " !34! " !58!
10. Subtract.
a) !12! # !13! b) !170! # !25!
c) !34! # !18! d) !56! # !13!
11. Find 2 fractions with a differenceof !14!. Find as many pairs offractions as you can.Remember to use fractions with different denominators.
12. Ali drank !34! cup of water.Brad drank !23! cup of water.a) Who drank more water?b) How much more water did
he drink?
4.4
4.3
4.5
Unit Review 159
What Should I Be Able to Do?
12
34
58
For extra practice, go to page 441.

160 UNIT 4: Fractions and Decimals
13. Subtract.
a) !190! # !25! b) !73! # !56!
c) !85! # !14! d) !94! # !23!
14. Subtract.
a) 3 !34! – 2 !18! b) 4 !45! # 2 !23!
c) 9 !12! # 3 !13! d) 6 !34! # 6 !15!
15. Multiply. Draw a picture toshow each answer.
a) !14! % 7 b) 8 % !38!
c) 6 % !170! d) !45! % 5
16. Sasha had 16 tomatoes in his vegetable garden. He gave:Samira !18! of the tomatoes;Sielen !18! of the tomatoes; and Amina !14! of the tomatoes.a) What fraction of the
tomatoes did Sasha have left?
b) How many tomatoes did Sasha have left?
17. Orit spends !14! of her day at school, !1
12! of her day
playing soccer, and !13! of her day sleeping.How many hours are left in Orit’s day?
18. A rectangular park has dimensions 2.8 km by 1.9 km.What is the area of the park?
19. Nuri has 10.8 L of water.He pours 1.5 L into each ofseveral plastic bottles.
a) How many bottles can Nuri fill?
b) How much water is left over?
20. Delia works at the library after school. She earns $7.50/h.She usually works 15 h a week.a) What does Delia earn
in a week?Use estimation to check your answer.
b) One week Delia only works !12! the hours she usually works. What are her earningsthat week?
21. Mr. Statler took his class to the local library 4 times last year.One student had a pedometer.She measured the trip as 1.7 km each way.How far did the students walk back and forth to the library during the year?
22. Evaluate.a) 5.3 " 5.1 & 3b) 12.6 % (1.5 " 2.5)c) 68.9 # 32.7 % 2
23. Evaluate.a) 5.9 " 3.7 % 2.8 # 1.5 & 0.5b) 3.4 % 1.9 & 1.7 " 7.2 & 1.2
LESSON
4.9
4.7
4.6
4.8

1. Add or subtract.
a) !54! " !38! b) !32! # !35! c) !1112! # !23! d) !49! " !76!
2. a) Find three pairs of fractions that have a sum of !35!.
b) Find three pairs of fractions that have a difference of !15!.
3. Add or subtract.
a) 6 !38! # 2 !15! b) 4 !14! " 2 !23!
4. Lana does yard work. The table shows the approximate time for each job.
For one Saturday, Lana has these jobs:– mow 3 small lawns– mow 1 large lawn– mow lawn/tidy yard in 2 places– plant annuals in 1 place
Lana needs travel time between jobs, and a breakfor lunch. Do you think she will be able to doall the jobs? Justify your answer.
5. a) Evaluate.
i) !34! " !34! " !34! " !34! " !34! " !34! ii) 7 % !23! iii) !78! % 8
b) Convert each answer in part a to a decimal.
c) Order the decimals from least to greatest.
6. A 6-kg bag of fertilizer covers a rectangular area of 2.5 m by 5.0 m.a) How many bags of fertilizer are needed for a
rectangular lawn measuring 7.5 m by 10.2 m?b) A 6-kg bag of fertilizer costs $15.50.
How much does it cost to fertilize the lawn?
7. Evaluate. Explain each step.12.4 % (2.9 " 4.6) " 23.7 & 2.4
Job Time
Mow small lawn !12! h
Mow large lawn !34! h
Mow lawn/tidy yard 1 !12! h
Plant annuals 2 !12! h
Practice Test 161

162 UNIT 4: Fractions and Decimals
Publishing a Book
The students at Garden Avenue School are preparing a special bookfor the school’s 100th anniversary. They finance the book by sellingadvertising space to sponsors.
The students sold the following space:
All the advertisements are to fit at the back of the book.
Sam asks: “How many pages do we need for the advertisements?”Mara asks: “Will the advertisements fill the pages?”Kathleen asks: “Is there more than one way to arrange these advertisements?”Can you think of other questions students might ask?
1. Find the total advertising space needed.
2. Sketch the pages to find how the advertisements can be placed.Use grid paper if it helps.
Unit Problem
Full page !12! page !13! page !14! page !16! page !18! page
1 1 1 3 4 5

3. Compare your group’s sketch with those of other groups.When you made your sketch, what decisions did you make aboutthe shape of each advertisement? Did other groups make thesame decisions? Explain.
4. What are the fewest pages needed to display the advertisements? Will there be room for any other advertisements? Explain.
5. What else might students need to consider as they prepare the layout for the book?
Here are the fees for the advertisements.
6. How much money will students get from the advertisers?
7. Students will do the layout on computer.The cost to copy and bind 500 books is $4750. Use the income from question 6.a) What do the students have to charge per book so they do not
incur a loss? Justify your answer.b) The students cannot print fewer than 500 books.
What if they can sell only 350 books?What do the students have to charge per book so they do notincur a loss? Justify your answer.
c) What if the students decide to charge $5 per book?How many books do the students need to sell so they do notincur a loss? Justify your answer.
Unit Problem: Publishing a Book 163
Choose one operation with fractions and a different operation with decimals.Write an example that illustrates how to carry out each operation.
Size Full page !12! page !13! page !14! page !16! page !18! page
Cost ($) 500 360 250 200 150 100Your work should show:
all calculations in detail
diagrams of thelayout for theadvertisements
a clear explanation of how you preparedthe layout
a clear explanation of how students donot incur losses
!
!
!
!
Check List

1. Find the number that is:• a factor of 1000• not a factor of 100• a multiple of 5• has fewer than 3 digitsExplain how you found the number.
2. A rectangular pen is built with 60 m of fencing.The length of each side of the pen is a whole number of metres.a) Which dimensions are possible?
Make an organized list ofyour answers.
b) What are the dimensions of the pen with the greatest area? Explain.
3. The number 49 is a perfect square.It can be written as 72.Some numbers that are not perfect squares can be written as the sum of a perfect square and a prime number.For example: 21 = 42 + 5a) Find all the numbers between
40 and 50 that can be written this way.
b) Which numbers in part a can be written more than one way? Show each new way.
4. Write the next 3 terms in each pattern. Describe each pattern.a) 49, 36, 25, 16, . . .b) 3, 7, 15, 31, . . .c) 6, 36, 216, 1296, . . .
5. Write each ratio in simplest form.
a) saxophones to trumpetsb) drums to flutesc) saxophones to total number
of instruments
6. The ratio of the number of hits to the times at bat for three baseball players is:Irina, 3:5; Juana, 2:3; Carla, 3:4a) Who has the best record?b) Who had the least success?Explain your answers.
7. The ratio of boys to girls in the sailing club is 4:5.a) There are 15 girls in the club.
How many boys are in the club?b) What if 3 boys leave the club?
What is the new ratio of girls to boys?
164 Units 1–4
Units 1–4 Cumulative Review
UNIT
1 2

8. Identify the view (front, back, side,or top) and the object on each sign.Then draw a different view ofthat object.a) Post office
b) Picnic area
c) Microwave oven
9. Find the surface area of each rectangular prism.a)
b)
c)
10. Use a large copy of this net.
a) Fold the net to make an object.b) Sketch the front, back, side, and
top view of the object.
11. Use fraction strips, number lines, oranother model to add or subtract.
a) !38! " !32! b) !23! " !14!
c) !75! # !12! d) !161! # !43!
12. Skylar and Riley work together on a project.Skylar does !1
30! of the work.
Riley does !25! of the work.a) Who does more work? How
much more does this person do?b) What fraction of the project has
yet to be done?
13. Multiply. Draw a picture to show each answer.
a) 4 % !58! b) !35! % 5
c) 3 % !130! d) 5 % !54!
14. Multiply.Record your work on grid paper.a) 3.5 % 2.1 b) 0.8 % 1.2
15. The area of a rectangle is 7.35 m2.The width is 2.1 m.What is the length?
16. Evaluate.a) 1.25 " 3.6 % 2.4 & 1.2b) 10.5 & 1.5 # 2.8 % 0.3c) 10.1 # 4.5 & 0.5 " 7.5d) (10.1 # 4.5) & (0.5 " 7.5)Why are the answers to parts c and d different?
Cumulative Review 165
UNIT
3
4
1 cm
2 cm
4 cm
3.5 cm
5.5 cm4.5 cm
0.3 m
0.3 m
0.3 m

WhatYou’ll Learn
• Collect and organize data on tally charts and stem-and-leaf plots.
• Display data on frequency tables,bar graphs, pictographs, line graphs,
and circle graphs.• Describe and evaluate data presented on charts, tables, and graphs,
and solve related problems.• Use databases and spreadsheets.• Calculate and use mean, median, and mode.• Identify and describe trends in graphs.• Use technology to draw graphs.
Why It’s Important• You see data and their
interpretations innewspapers, magazines,and on TV.You need to understandhow to interpret these data.
David and his friend surveyed theirclassmates. They wanted to find outwhich outdoor winter activities thestudents participated in. They recordedthe results in a tally chart.
• What survey question might the students have asked to get the data in the chart?
• How could you graph the data?
• Which graph is most suitablefor the data?
Outdoor Winter Activities
Activity Tally
Skating //// //// //// //// ////
Skiing //// //// ////
Snowboarding //// //// //
Tobogganing //// //// //// //// //// ////

167
Key Words• mean• median• mode• primary data• secondary data• biased• database• fields• Statistics Canada
(Stats Can)• frequency table• stem-and-leaf plot• cluster• trend• line graph• spreadsheet

!
Calculating Mean, Median, and ModeFor any set of numbers:
• The mean is the sum of all the numbers divided by the number of numbers.
• The median is the middle number when the numbers are arranged in order.When there is an even number of numbers, the median is the mean of the twomiddle numbers. Half the numbers are above the median and half are below.
• The mode is the number that occurs most often.There may be more than one mode. There may be no mode.
Example
Calculate the mean, median, and mode of these numbers:7, 13, 10, 12, 14, 8, 9, 7, 11, 6
Solution
There are 10 numbers in the set.
• For the mean, add the numbers, then divide by 10.
Mean: ! "9170"
! 9.7
• For the median, arrange the numbers in order, beginning with the least number. The median is the middle number. Since there are 10 numbers,the median is the mean of the two middle numbers. For 10 numbers in order, the first middle number is "12
0" ! 5, or the 5th number. The next middle number is the 6th number.
6, 7, 7, 8, 9, 10, 11, 12, 13, 14
Median: "9 #2
10" ! "129" , or 9.5
• The mode is the number that occurs most often. The mode is 7.
1. Calculate the mean, median, and mode for the numbers in each set.a) 3, 9, 5, 8, 2, 0, 9, 5 b) 25, 24, 55, 30, 44, 21, 17, 19, 21c) 14, 18, 16, 12, 11, 16 d) 76, 81, 50, 64, 67, 69, 72, 94, 81, 76
7 # 13 # 10 # 12 # 14 # 8 # 9 # 7 # 11 # 6"""""10
168 UNIT 5: Data Management

Work in a group.Which electronic game is most popular in your class?Conduct a survey to find out.What survey question will you ask? Record your results.
Reflect & ShareCompare your results with those of another group.How did the survey question affect the results?
Mia wanted to find out the favourite singer of her classmates.She conducted a survey. She asked this question:
“Who is your favourite singer: Bryan Adams ____, Susan Aglukark
____, Celine Dion ____, Sam Roberts ____,
Shania Twain ____, or Other ____?”
Mia recorded the results in a tally chart.
Mia concluded that Celine Dion was the mostpopular singer of those named.However, if all the votes in the “Other” categorywere for the same person, then that person wouldbe the most popular.
Since Mia collected the data herself, they are calledprimary data.Data that are found from the library or using theInternet are called secondary data.
5.1 Collecting Data 169
5.1 Collecting DataAnalyse data collection and possible bias.Focus
Electronic games are popular among Grade 7 students.Which electronic game do you think Grade 7 studentsin your class like to play?How could you find out?
The word “data” is plural. So, we say“The data are …” A single piece ofinformation is called “datum.”
Singer Number of Students
Bryan Adams ////
Susan Aglukark ////
Celine Dion //// //
Sam Roberts ///
Shania Twain //
Other //// //// /

170 UNIT 5: Data Management
Example
Solution
It is important that a survey is conducted and data are collected in afair way. Sometimes, the way a question is asked or written mightpersuade a person to answer a certain way. This type of question isbiased. A survey question must be unbiased. That is, the questionmust not lead a person toward a particular answer.
How is each survey question biased?Rewrite the question so it is unbiased.
a) “Many students are bored at the end of August.Should the school year be longer? Yes _______ No _______”
b) “Some people get sick after visiting patients in a hospital.Do you think patients in a hospital should have visitors?Yes _______ No _______ No Opinion _______”
a) The question includes a statement about how some students feel.This may encourage more people to answer “Yes.”An unbiased survey question is:“The school year is 10 months long. Should it be longer?Yes ________ No _______”
b) The question includes a statement that may encourage people to answer “No.”An unbiased survey question is:“Should patients in a hospital have visitors?Yes _______ No ________ No Opinion _______”
1. Are primary data or secondary data collected in each situation? How do you know?a) Elly used an encyclopedia to find the area of each continent.b) Jason read the thermometer to find the outside temperature.c) Jane looked in the newspaper to see which NHL team won
the game.

2. Would you use primary or secondary data in each case? Explain.a) To find the favourite car model in Canadab) To find the favourite juice of Grade 7 students in your school c) To find the favourite song of Grade 7 students in Ontariod) To find the most popular type of transport used by students
in your school
3. Biased data are unreliable. Yet, sometimes people use biased data.Why do people use biased data?
4. Think of a survey you could conduct in your school.a) Write a biased survey question.b) Write an unbiased survey question.
5. Comment on each survey question.If it is biased, write an unbiased question.a) “Sugar is bad for your teeth. Should children eat candy?
Yes _______ No _______ No Opinion _______”
b) “Children prefer snowboarding to skiing.Which do you think is more fun?Snowboarding _______ Skiing _______”
6. Assessment Focus Suppose a person intends to open a shoe store in the local mall.The person is unsure of the style or make of shoes to stock.What questions should the person ask to make the best decision?Explain what role a survey might play in the decision.
7. a) Predict the favourite hobby or pastime of your classmates.b) Write a survey question you could ask to find out.
Explain how you know your question is unbiased.c) Conduct the survey. Tally the results.d) How did your prediction compare with your results?
Why is it important that a survey question is unbiased?
5.1 Collecting Data 171
Number Strategies
How are these twopatterns related?
• 0.75, 1.5, 3, 6, . . .
• 96, 192, 384, 768, . . .

A database is an organized collection of data.Examples of databases include a telephone book, a dictionary,an encyclopedia, or a library catalogue.
A database is organized into fields. Each field contains specificinformation. In a library database, a book may be stored withinformation in each of these fields: title, author, publisher,subject, ISBN (international standard book number), or Dewey decimal number.
Statistics Canada (Stats Can) is the federal governmentdepartment that collects, analyses, and stores data about Canadaand Canadians. Two of its Internet databases are CANSIM II (Canadian Socio-economic Information ManagementSystem) and E-STAT.
Stats Can charges a fee for some of its data onCANSIM II.E-STAT is a free database for teachers and students.Your teacher will give you the website addresses forthese databases.
To use E-STAT to find data on school attendance for15- to 24-year-olds, follow these steps:
1. Open the E-STAT Website.You may be asked for your username and password. Ask your teacher for these.
2. Click the “Data” tab. Click “Education,” as shownabove left.
3. Under Census databases, click “Enrolment,” as shown below left.
Using Databases to Find DataSearch databases for information.Focus
172 UNIT 5: Data Management

Technology: Using Databases to Find Data 173
!
4. Under 2001 Census of Population (Provinces, Census Divisions, Municipalities), click “2001 School Attendance,Education, Field of Study, Highest Level of Schooling and Earnings,” as shown below left.
5. Click “Attending school, full time, population 15 to 24 years,”as shown above right.
6. Choose an output format. For data in a table arranged in rows,click “Table Areas as Rows,” as shown below left. The data are displayed as shown below right.
1. Use E-STAT or another database.Research one of the topics below. Print your data.Be sure to state your source.• The number of Canadians who had a particular type of
occupation at the time of the 1911 Census • The top 10 movies of the year• The top 10 music CDs of the year• A topic of your choiceWrite 3 things you know from looking at the data.

Work on your own.Use a novel you are currently reading.Open it to any page.
" Count the number of letters in each of the first 50 words.Record your data in a tally chart.
" Graph your data. Justify your choice of graph." Which is the most common length of word?" Who might be interested in these data?
Reflect & ShareCompare your most common length of word with that of aclassmate. Should the lengths be the same? Explain.
Data can be organized in a tally chart or frequency table.A frequency table is a tally chart with an extra column.
Andrew recorded the different birds that visited his feeder one morning.
174 UNIT 5: Data Management
5.2 Recording DataRecord data in tables, bar graphs, and pictographs.
Focus
Number of Letters Tally of Number of Words
1234
Birds at the FeederBird Tally Frequency
Blue jay //// 5Cardinal //// 4Sparrow //// //// //// // 17
Robin //// //// / 11Chickadee //// // 7

5.2 Recording Data 175
Example
Solution
To fill in the Frequency column, Andrew counted the tallies for each bird.He graphed the data using a pictograph.Andrew chose a key of 1 symbol represents 2 birds.
a) Construct a bar graph of Andrew’s data.b) Compare the graph and tally chart.
How are they alike?
a) Construct a bar graph, below left.One square represents 2 birds.
b) The longest bar on the bar graph represents the same bird as the longest row on the tally chart.When we rotate the Tally column "14" turn counterclockwise,above right, its shape matches that of the bar graph, above left.
Blue jay
Birds at the Feeder
Key: represents 2 birds
Cardinal
Sparrow
Robin
Chickadee
////
////
////
////
////
//
////
////
/
////
//
Birds at the Feeder
Blue jay Cardinal Sparrow Robin ChickadeeType of bird
Num
ber
of b
irds
20181614121086420
Blue
jay
Card
inal
Spar
row
Robin
Chick
adee

Key: represents 10 people
Banking
Shopping
Games
Music
Education
Research
Main Use of Internet
1. The table shows the favourite Canadianhockey teams of some Grade 7 students atHamilton Junior High School.a) Write the frequency of each team.b) How many students were surveyed?c) Which team is the most popular among
the sample? The least popular? Givesome possible reasons for these results.
2. Work with a partner. You will need anumber cube labelled 1 to 6.a) Roll the number cube 50 times.
Make a table. Record the frequency ofeach number.
b) Predict the results if you were to roll thenumber cube 50 more times.Justify your answer.
c) Compare your results with those of another pair of students.If they are different, explain why.
d) Graph your data. Justify your choice of graph.
3. This pictograph displays the results of a survey.
a) What do you think the survey question was? Explain.b) How many people were surveyed?c) How would the pictograph change if
represented 1 person? 50 people?d) Draw a bar graph to display these data.
176 UNIT 5: Data Management
Favourite Canadian Hockey Team
Hockey Team Tally Frequency
Calgary Flames //// ///
Edmonton Oilers //// /
Montreal Canadiens ////
Ottawa Senators ////
Toronto Maple Leafs //// ////
Vancouver Canucks //// /
Rolling a Number Cube
Number Tally Frequency
1
2
3

Populations of 10- to 14-year-olds, 2001
0 100 000 200 000 300 000 400 000Population
ALB
BC
MAN
NB
NFLD/LBR
NWT
NS
NUNAVUT
ONT
PEI
QB
SASK
YUKON
FemaleMaleP
rovi
nce
or T
erri
tory
e) Is a bar graph better than a pictograph to display the data? Explain.
f) Write a question you could answer using the pictograph or bargraph. Answer the question.
4. This is a double-bar graph.
a) How is this bar graph different from the others in this lesson? b) How does the female population compare with
the male population?c) Which province(s) have approximately the same number of
10- to 14-year-old females as males?d) Here are the data for the 3 territories.
Why are there no bars on the graph for Nunavut and Yukon?e) Could you use a pictograph to display the data in the double-
bar graph? Explain.
5.2 Recording Data 177
Nunavut Northwest Territories Yukon
Females 1550 1725 1090
Males 1685 1785 1225
Add.
• "12" + "23"
• "34" + "45"
• "56" + "67"
Number Strategies

5. Use an atlas or an almanac.a) Choose 5 cities in Canada.b) Choose a recent year.
Find the population of each city in that year.c) Record the data in a table.d) Graph the data. Justify your choice of graph.e) What do you know from looking at the data?
6. Assessment Focusa) Suppose you want to find out how your classmates spend
their money. Write a question you could use to survey your classmates.
b) Conduct the survey. Record the data in a frequency table.c) Graph the data. Justify your choice of graph.d) What do most of your classmates spend their money on?e) Use the graph to write 3 other things you know about how
your classmates spend their money.
7. Two classes of Grade 7 students took a spelling test.The number of words each student misspelled is recorded at the left.
a) Copy the frequency table. Continue the pattern of the intervals in the 1st column to 18–20.Complete the 2nd and 3rd columns in the frequency table.
b) Graph the data.
When is a pictograph more appropriate than a bar graph?When is a bar graph more appropriate than a pictograph?Give examples.
178 UNIT 5: Data Management
Number of Tally FrequencyMistakes
0 – 2
3 – 5
The interval is 3 becausethe numbers of mistakesare counted in groups of 3.
Spelling Mistakes
4 7 9 2 1 0 6 5 8 10 73 2 12 8 11 3 4 8 4 5 8 15 9 6 2 1 0 17 19 16 3 11 5 10 7 3 7 1 9 10 3 5 8 6 13 8 2 4 6 18 19 5 20 0 1 8 10 3
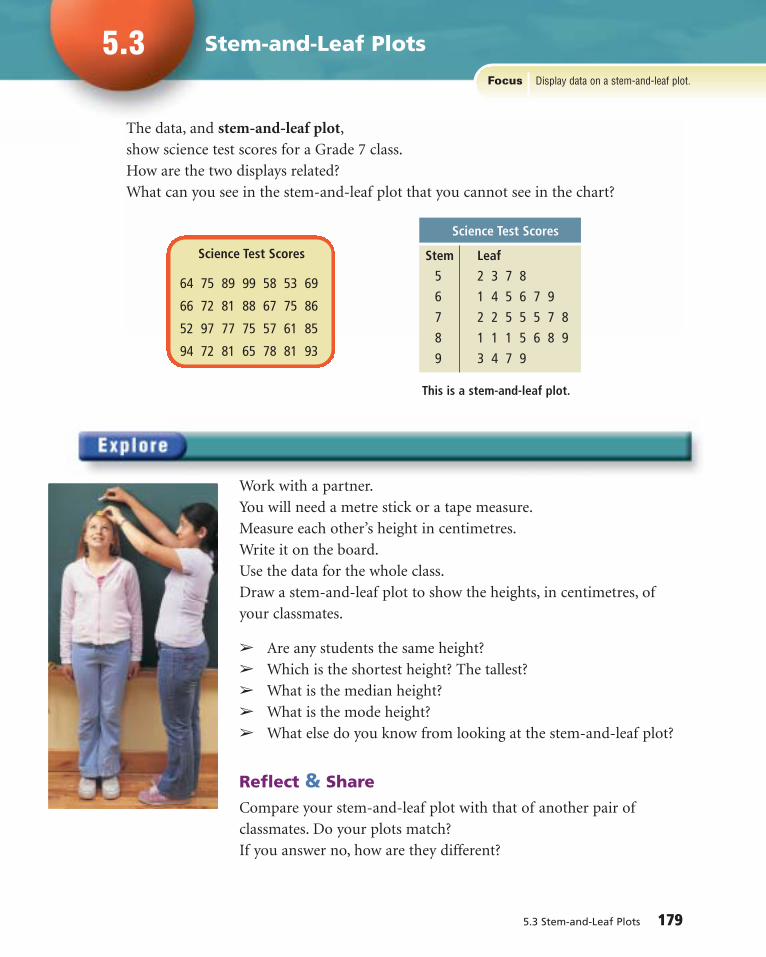
5.3 Stem-and-Leaf Plots 179
5.3
Work with a partner.You will need a metre stick or a tape measure.Measure each other’s height in centimetres.Write it on the board.Use the data for the whole class.Draw a stem-and-leaf plot to show the heights, in centimetres, ofyour classmates.
" Are any students the same height?" Which is the shortest height? The tallest?" What is the median height?" What is the mode height?" What else do you know from looking at the stem-and-leaf plot?
Reflect & ShareCompare your stem-and-leaf plot with that of another pair ofclassmates. Do your plots match?If you answer no, how are they different?
The data, and stem-and-leaf plot,show science test scores for a Grade 7 class.How are the two displays related?What can you see in the stem-and-leaf plot that you cannot see in the chart?
Science Test Scores
Stem Leaf5 2 3 7 86 1 4 5 6 7 97 2 2 5 5 5 7 88 1 1 1 5 6 8 99 3 4 7 9
Science Test Scores
64 75 89 99 58 53 69
66 72 81 88 67 75 86
52 97 77 75 57 61 85
94 72 81 65 78 81 93
This is a stem-and-leaf plot.
Stem-and-Leaf PlotsDisplay data on a stem-and-leaf plot.Focus

Example
Heights of Football Players in Centimetres
147 153 162 171 159 168 145 183 164187 153 164 148 164 167 187 179 148 190 188 173 155 177 176 189 192
In a stem-and-leaf plot,the leaves are alwaysnumbers from 0 to 9.
Books Read in One Year
23 19 43 12 16 18 31 17
15 23 27 18 13 16 24 10
16 15 29 25 33 42 20 24
17 38 36 11 26 31 32 19
Books Read in One Year
Stem Leaf
1 0 1 2 3 5 5 6 6 6 7 7 8 8 9 92 0 3 3 4 4 5 6 7 9 3 1 1 2 3 6 8 4 2 3
Here are the numbers of books students in one Grade 7 class read in one year.Each number is the number ofbooks one student read.
We can make a stem-and-leaf plot from these data.
• The least number of books is 10. The greatest number is 43. Students read between 10 and 43 books.Write the tens digits 1 to 4 in a column.These are the stems.
• Start with the least number, 10.Write 0 as the leaf next to the stem, 1.Continue with the next greatest number, 11.Write 1 as the next leaf.Continue in this way.Record all the leaves in order from the least number to the greatest number.
• Write a title for the plot.
Here are the heights, in centimetres, of the members of St. Mark’sjunior football team.a) What is the range of
the heights of the football players?
b) Draw a stem-and-leafplot for the data.
c) What is the median height?
d) What is the mode height?
180 UNIT 5: Data Management

5.3 Stem-and-Leaf Plots 181
Solution a) The least height is 145 cm.The greatest height is 192 cm.The range is 192 cm – 145 cm = 47 cm.
b) Each number has 3 digits, so the stem will be the hundreds and tens digits.The leaf will be the ones digit.The stems are from 14 to 19.Start with the least number, 145.Write the leaf, 5, next to the stem, 14.Continue to write the leaves, from the least number to the greatest number.
c) There are 26 numbers.This is an even number.The median is the mean of the two middle numbers when the numbers are arranged in order.For 26 numbers in order, the first middle number is "22
6" ! 13,or the 13th number.The next middle number is the 14th number.Count the leaves, beginning at 5.The 13th and 14th numbers are 167 and 168.
The median is: "167 #2
168" ! 167.5The median height is 167.5 cm.
d) The mode is the number that occurs most often.Leaf 4 occurs three times next to stem 16.The mode is 164 cm.
The Example shows that, when the data are displayed in a stem-and-leaf plot, the range, the median, and the mode can be found from the plot.When you organize data in a stem-and-leaf plot, the original data are visible. A frequency table only shows how many numbers are in each group, and not what the numbers are.
Heights of Football Players in Centimetres
Stem Leaf14 5 7 8 815 3 3 5 916 2 4 4 4 7 817 1 3 6 7 9 18 3 7 7 8 919 0 2
Heights of Football Players in Centimetres
Stem Leaf14 5 7 8 815 3 3 5 916 2 4 4 4 7 817 1 3 6 7 9 18 3 7 7 8 919 0 2

Hours Worked by Part-Time Staff at a Video Store in One Month
Stem Leaf
9 1 6 9 10 2 5 6 811 0 3 4 4 4 7 12 0 1 2 2 5 6 6 8 913 2 3 5 6 7 7 7 7 8 9 9
Calculator Skills
Find two numberswith a difference of2.75 and a productof 60.125.
1. a) What does this stem-and-leaf plot show?b) How many part-time employees work at the
video store?c) What is the least number of hours worked?
The greatest number of hours worked?d) What is the range of hours worked?e) What is the median number of hours worked? f) What is the mode number of
hours worked?
2. The masses of parcels, in kilograms,are given.a) Display the data in a stem-and-leaf plot.b) Find the greatest mass. The least mass.c) What is the range of masses?d) What is the median mass? e) What is the mode mass?
3. Which type of data cannot be shown in a stem-and-leaf plot? Explain.
4. Work with a partner. Use a metre stick to measure each other’sstride, to the nearest centimetre. Record the measures on theboard. Use the measures for the whole class.a) Make a stem-and-leaf plot.b) What did you find out about the strides of your classmates?
Write down as much as you can.
5. A food manufacturer claims:“We guarantee an average of 50 g of peanuts per bag.”In 6 months, Devon found the masses of peanuts, in grams,in 24 bags. Look at the data.a) Is the food manufacturer’s
claim true?b) How could you use a
stem-and-leaf plot to justify your answer?
Masses in Kilograms
28 32 40 36 31 40 48 35 38 34 43 35 41 36 52 37 47 29 42 35 33 39 32 48 37 38 30 35 44 54
182 UNIT 5: Data Management
Masses of Peanuts in Grams
50.1, 49.9, 49.0, 48.9,50.8, 50.3, 51.3, 49.8,48.8, 49.0, 50.3, 51.2,49.4, 49.0, 48.1, 49.6,49.8, 51.3, 50.5, 50.7,48.7, 51.0, 49.3, 52.5

6. Assessment Focusa) Collect data on the points scored by a basketball team in its
last 15 games. The points could be from games played by yourschool team or a professional team.
b) Make a stem-and-leaf plot.c) Write 3 things you know from looking at the plot.
Explain why it is easier to read data in a stem-and-leaf plot than data in a table.
A meteorologist is often a specialist. Sheuses data collection tools suitable for theweather condition being studied. Thedata collected are pooled nationally andinternationally, and studied by a varietyof meteorologists and others in relatedfields. The information and analysisproduce severe weather alerts, which cansave thousands of lives.
We may not experience surviving a tornado or a hurricane. But thereare other weather conditions that are just as destructive.On January 6, 1998, a severe ice-storm hit Quebec, eastern Ontario,and northeastern U.S. Many people called it the largest ecologicaldisaster in the history of Quebec. On February 6, 1998, Quebec wasrestored to some normalcy.
When was the last time you heard a “severe weather warning”? Was the prediction correct?What kinds of data management tools might have been used topredict this event?
The World of Work: Meteorologist 183
Meteorologist

184 UNIT 5: Data Management
1. A survey was conducted to decideif a new hockey arena should bebuilt. The question was, “We haveone hockey arena that is always in use. Do we need a new hockey arena? Yes _____ No _____”a) Is the question biased? Explain.b) If your answer to part a is yes,
rewrite the question so it is not biased.
2. The pictograph shows the types ofmovies rented from a video storein one day.
a) Record the data in a frequency table.
b) Construct a bar graph.c) Write a question you could
answer from the bar graph or pictograph.Answer the question.
d) What else do you know from the graphs?
3. Use an atlas or other database.a) Choose 5 countries other than
Canada.b) Find the area of each country
and Canada.c) Record the data in a table.d) Graph the data.e) How does each country’s area
compare with Canada’s area?f) What else do you know from
the table or graph?
4. Here are the history test scores for students in Ms. Epstein’s class.
a) Draw a stem-and-leaf plot to represent the data.
b) What is the range of the scores?c) The pass mark is 50.
How many students did not pass the test?
d) Students who scored below 60 had to rewrite the test.How many students rewrotethe test?
e) Find the median score.f) Find the mode score.
LESSON
5.1
5.35.2
History Test Scores
56 87 98 34 66 75 5069 70 83 99 55 83 5662 90 47 92 75 85 6898 78 62 51 59 75 8158 79 80 94 92 63 71
Drama
Key: represents 4 movies
Comedy
Horror
Animated
Foreign
Action
Other
Movie Rentals in One Day